Multiplicity counting using organic scintillators to distinguish neutron sources: An advanced teaching laboratory
Abstract
In this advanced instructional laboratory, students explore complex detection systems and nondestructive assay techniques used in the field of nuclear physics. After setting up and calibrating a neutron detection system, students carry out timing and energy deposition analyses of radiation signals. Through the timing of prompt fission neutron signals, multiplicity counting is used to carry out a special nuclear material (SNM) nondestructive assay. Our experimental setup is comprised of eight trans-stilbene organic scintillation detectors in a well-counter configuration, and measurements are taken on a spontaneous fission source as well as two (,n) sources. By comparing each source’s measured multiplicity distribution, the resulting measurements of the (,n) sources can be distinguished from that of the spontaneous fission source. Such comparisons prevent the spoofing, i.e., intentional imitation, of a fission source by an (,n) neutron source. This instructional laboratory is designed for nuclear engineering and physics students interested in organic scintillators, neutron sources, and nonproliferation radiation measurement techniques.
I Introduction
In this advanced instructional laboratory, students learn the fundamentals of a current International Atomic Energy Agency (IAEA) nondestructive assay technique. To carry out this study, students measure neutron sources with multiple detectors and then learn how to analyze the resulting timing and energy data in order to identify the characteristic signatures of varying neutron sources. Such detection and characterization of neutron sources is a crucial goal in monitoring nuclear nonproliferation.runkle_securing_2010 ; doyle_nuclear_2019 Special nuclear material (SNM) such as plutonium and enriched uranium is identifiable through the detection of neutrons and photons emitted from spontaneous and induced fission events. However, when only the single-neutron count rates from fission are considered, the detection signals of SNM can be spoofed, i.e., intentionally imitated, by substitution of non-fissioning neutron sources. An undetected spoof can lead to an unknown SNM diversion, i.e., concealing SNM from its declared location, which can in turn lead to global security risks.
Nuclear fusion and (,n) reactions mainly emit single neutrons,petrescu_basic_2017 ; lorch_neutron_1973 while nuclear fission reactions emit multiplets of neutrons and gamma rays for each reaction and the shape of the multiplicity distribution is isotope-dependent.fraser_nuclear_1966 Therefore, fission sources may be distinguished from single-neutron-emitting radiation sources. In addition, the fissioning isotope may be inferred from the detected neutron multiplicity distributions using multiplicity counting.
Multiplicity counting is a method in which detected neutron arrival times are analyzed with sequential timing gates, in which counts are recorded in each timing gate. The resulting count distribution is converted to effective multiplet count rates to determine the mass of SNM. The SNM sample’s total mass and isotopic masses are calculated from the measured multiplets if isotopic ratios are known from complementary gamma-ray spectroscopy. The IAEA uses neutron multiplicity counting measurements as a nondestructive assay method to verify plutonium and uranium amounts in samples. Conventionally, polyethylene-moderated 3He detectors are used to acquire the timing signals for these measurements.macklin_neutron_1972 ; langner_neutron_1991 ; krick_thermal-neutron_1992 The polyethylene moderation scatters and slows down incident neutrons before capture in the 3He gas, hence increasing the likelihood of a 3He neutron-capture reaction. These detectors are arranged in a so-called “well-counter” configuration, where a cylindrical array of detectors is oriented about a central fission source.
Organic scintillators detect neutrons by elastic scattering without the need for moderation and, with their nanosecond timing precision, improve the ratio of correlated-to-uncorrelated signals. When compared to moderated thermal neutron detection methods, these attributes can significantly decrease the measurement time required for a low-uncertainty assay. di_fulvio_passive_2017 ; hua_measured_2020 The main drawback of an organic scintillator well-counter is particle cross-talk, i.e., the scattering of one particle into multiple detectors, which causes a spurious correlated signal. Recently, theoretical adjustments for neutron cross-talkshin_neutron_2015 enabled the use of organic scintillators for multiplicity counting applications.shin_neutron_2017 Additionally, organic scintillators are sensitive to both neutron and photon radiation and can discriminate between the two types.brooks_pulse_1960 ; winyard_pulse_1972 This dual-particle sensitivity has the potential to further improve the precision of correlated fission radiation measurements through increased statistics as well as add additional signatures for fission source analysis.pazsit_combined_2009 ; hua_gamma-ray_2019 ; pakari_high_2022
In this work, we take measurements on one 252Cf fission source and two (,n) neutron sources, calculate discriminated neutron and photon energy deposition spectra, and apply mixed multiplicity counting using a well counter di_fulvio_fast_2015 ; shin_fast_2016 ; shin_fast-neutron_2017 ; di_fulvio_passive_2017 ; shin_neutron-neutron_2019 of eight trans-stilbene zaitseva_scintillation_2015 organic scintillators. We show that this approach can be used to distinguish between the two types of neutron sources. We use commercially available equipment for detector operation and readout and discuss how to conduct the experiment and analyze the data.
II Background
The three neutron sources utilized in this laboratory are a 252Cf spontaneous fission source, a 239Pu-Be (PuBe) (,n) source, and a 241Am-Li (,n) source. The 252Cf spontaneous fission source is used as a stand-in for fissioning special nuclear material (SNM), i.e., plutonium and uranium. The 252Cf has a much higher multiplicity than plutonium and uranium and 252Cf only emits neutrons by spontaneous fission. For this reason, 252Cf is easily distinguishable from (,n) sources when the multiplicity of each source is considered. PuBe is predominantly (,n), but does include trace amounts of plutonium (SNM) with an associated multiplicity. AmLi is an (,n) neutron source without any SNM.
The (,n) neutron sources used in this laboratory are 239Pu-Be (PuBe) and 241Am-Li (AmLi). The (,n) reactions for PuBe and AmLi have average neutron energies of approximately 4.2 and 0.5 MeV and endpoint energies of approximately 10.8 and 1.2 MeV, respectively. geiger_radioactive_1975 ; weaver_neutron_1982 The gamma-ray spectra of both neutron sources are complex, but both include photopeaks due to the de-excitation of the alpha-collided nucleus – 9Be(,n)12C∗ emits a 4.4 MeV gamma ray and 7Li(,)7Li∗ emits a 0.5 MeV gamma ray.vega-carrillo_neutron_2002 ; moore_configuration_2021
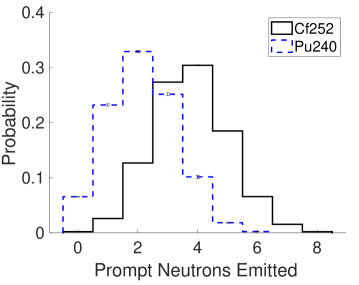
The 252Cf source emits neutrons through spontaneous fission. Although the majority of decays are alpha emissions (97%), the 252Cf is not surrounded by a low-Z matrix that would lead to (,n) reactions. The prompt neutron emission energy follows a Watt spectrum with an average energy of approximately 2.1 MeV. smith_spontaneous_1957 For each spontaneous fission event, 252Cf may emit 0 to 8 (or more) neutrons and 0 to 20 (or more) gamma rays. On average, 252Cf emits 3.76 neutrons and about 8 gamma rays per spontaneous fission.boldeman_prompt_1985 ; valentine_evaluation_2001 Trace amounts of 240Pu in the PuBe source also emit neutrons through spontaneous fission with an average energy of about 2 MeV.vladuca_improved_2001 Each 240Pu spontaneous fission event emits 0 to 6 (or more) neutrons and 2.16 neutrons on average. boldeman_prompt_1985 According to Boldeman and Hines, the full neutron multiplicity distributions for both 252Cf and 240Pu are plotted in Fig. 1. 239Pu may also fission from neutron-induced fission events and the multiplicity is dependent on the incident neutron energy.marini_energy_2022 Additionally, 9Be has an (n,2n) reaction cross-section similar to its (,n) cross-section. Both cross sections are between 0.1-1 b at incident particle energies of 4-10 MeV.soppera_JANIS_2014 The (n,2n) reaction has the potential to cause non-fission coincident neutron detection events, but this effect will not contribute to true detected fission multiplets greater than two.
The PuBe (,n) source is treated as predominantly (,n) in this laboratory. We do not have access to the exact elemental ratios and isotopic ratios from the manufacturer, but previous work has shown the atomic ratio of beryllium-to-plutonium atoms in the matrix is typically 13:1.bagi_neutron_2016 Additionally, the likelihood of PuBe (,n) neutron production is estimated to significantly outweigh correlated neutron emissions.
To measure the radiation from these neutron sources, organic scintillators coupled with photomultipler tubes (PMTs) will be utilized. The organic scintillators detect neutrons mainly through elastic scattering on protons and photons through Compton scattering on electrons, both in the hydrocarbon active volume. The two types of radiation are distinguishable due to the ratio of prompt and delayed scintillation light. Most of the scintillation light comes from prompt fluorescence (few nanoseconds), but the higher stopping power () of a proton in the active volume leads to an increased density of triplet states that de-excite through delayed fluorescence (hundreds of nanoseconds).birks_theory_1964
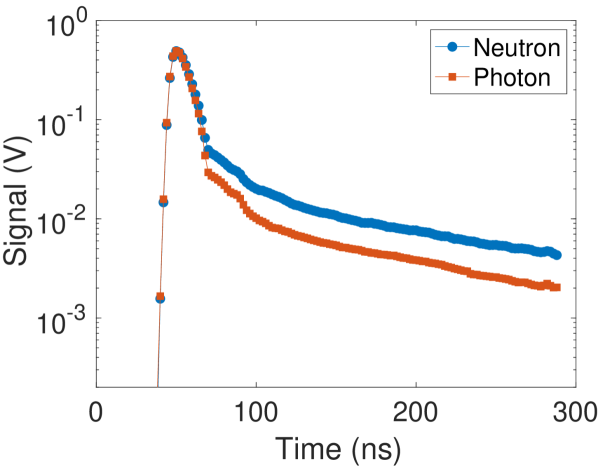
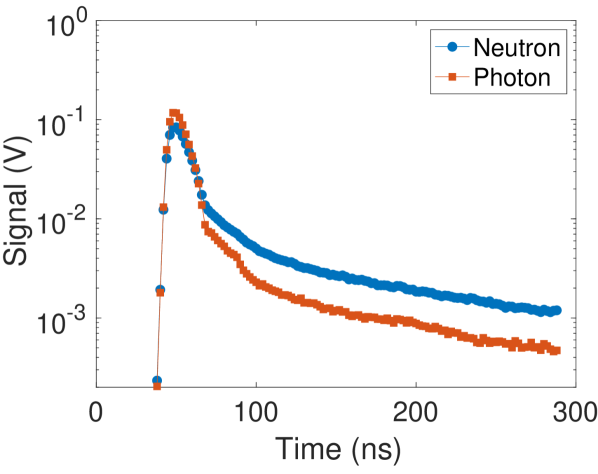
Because of the delayed fluorescence, the pulse die-away time for neutron scatters will be longer than that of photon scatters of equivalent light output, which may be quantified by either pulse height or pulse integral. Thus, we can discriminate between the two types of interactions with charge-integration pulse-shape discrimination (PSD).polack_algorithm_2015 ; brooks_pulse_1960 Figure 2 displays the clear difference in the tail region of neutron and photon pulses. For a neutron and photon signal of equivalent pulse height, the tail region of the neutron signal will have a higher integral value. The same remains true for a neutron and photon signal of equivalent pulse integral. This characteristic highlights the significant amount of delayed fluorescence associated with neutron signals relative to photon signals.
To interpret the energy deposition of particle scatters in organic scintillators, a gamma-ray source of known mono-energetic energy is required to calibrate each detector. Hence, a 137Cs source is used to calibrate each detector using its mono-energetic 662 keV gamma ray. The Compton edge energy (CE) is calculated as
| (1) |
where is the initial energy (662 keV) of the emitted gamma ray and is the rest mass of an electron (511 keV). Thus, a Compton edge of 478 keV is used to calibrate the light output of each detector assuming zero energy deposition does not result in a pulse.
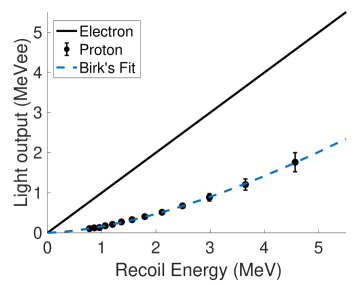
The different interaction types and fluorescence pathways also lead to quenched light output for neutrons.craun_analysis_1970 Figure 3 shows the relative light output due to protons (scattered by neutrons) and electrons (scattered by photons) in our trans-stilbene detector, as measured by Shin.shin_measured_2019 A neutron scatter of 2.00 MeV energy deposited on a proton results in a light output of 0.47 MeV-electron-equivalent (MeVee) according to the Birk’s fit:
| (2) |
where is the light output due to a proton recoil, is the energy-dependent stopping power of the proton, and and are constants calculated by fitting data from a light output experiment (see Fig. 3). Shin calculated and for the stilbene detectors used in this work. The Birk’s fit is commonly accepted for neutron light output as a function of deposited energy.norsworthy_evaluation_2017
Lastly, the neutron scatter nature of organic scintillators leaves an array susceptible to cross talk events. Cross talk occurs when one particle scatters in one detector followed by the scattering of that same particle in another detector with both scatter events exceeding the detection energy deposition threshold. This sequence would lead to spurious coincident events in an organic scintillator array. Cross talk will be acknowledged in this work, but additional simulations outside the scope of this paper are required to fully account for cross talk in organic scintillator systems.
III Experimental Setup
Each neutron source was shielded with 2.16 cm of annular lead shielding during measurement. When neutron sources were not in use, each source was stored in a large metal containment filled with low-Z, paraffin wax in a source room attached to the laboratory with a unique key entry. The 137Cs button source is stored in a small lead pig, a cylindrical lead containment with a lead cap that forms a full shell around the source, when not in use in the same source room.
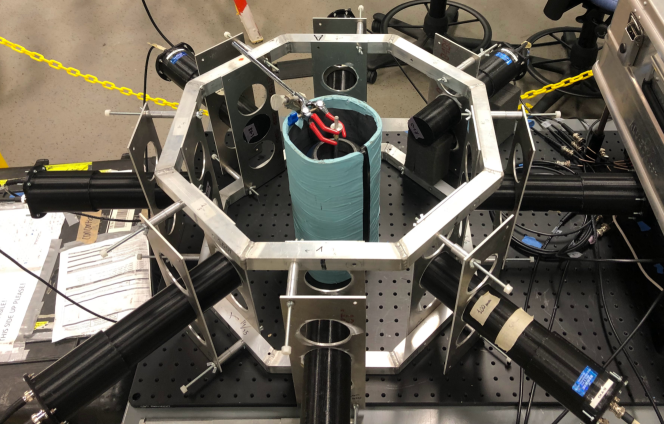
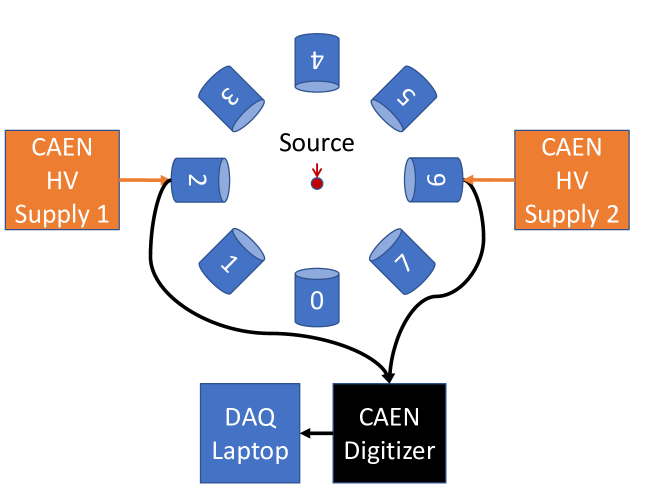
We operated our detection system with a laptop using CoMPASS data acquisition software, a CAEN DT5730S 500-MHz, 14-bit digitizer, and two CAEN DT1470ET high voltage units to measure the sources in Table 1. The eight trans-stilbene organic scintillators were arranged in a circular, well-counter frame, evenly spaced about the circumference as shown in Fig. 4. Each detector is separated by 45 degrees and the detector face and vertical positions are centered about the source. The center of each source is 22 cm from the face of each detector. Each detector is a housed assembly of a 5.08 cm diameter by 5.08 cm length trans-stilbene crystal coupled to a 5.08 cm face photomultiplier tube with BNC readout and SHV input inside a plastic, 3D-printed casing. Figure 5 provides a diagrammatic representation of the connections as well as the central source position. The digitizer connections required BNC-MCX adapters. The analog signals from the detectors are read by the digitizer on a 2 V dynamic range and output to the laptop if the signal meets acquisition requirements. Throughout the measurements, a Ludlum Model 30 neutron dose meter and a Fluke 451P-RYR Ion Chamber were used to monitor neutron and gamma dose rates, respectively.
| Dated | Activity | Neutron | |||
|---|---|---|---|---|---|
| Source | Maker | Date | Activity (Ci) | when measured (Ci) | emission rate (n/s) |
| 137Cs | EZ111Eckert and Ziegler | 10/15/16 | N/A | ||
| 252Cf | FTC222Frontier Technology Company | 05/08/15 | |||
| PuBe | MRC333Monsanto Research Corporation | 09/30/63 | |||
| AmLi | Gt444Gammatron | 12/10/19 | 9.60 | 9.56 |
IV Procedure
During all measurements, ALARA (as low as reasonably achievable) dose practices were applied. We used the minimum time and reasonable distance and shielding to minimize the radiation dose to participants. We shielded the AmLi source with lead to decrease the gamma dose and improve the neutron count ratio in our detectors. No more than three meters of separation of participants from the sources was required to reduce neutron dose below 0.5 mrem/hr and gamma dose below 0.1 mrem/hr measured by calibrated dose meters.
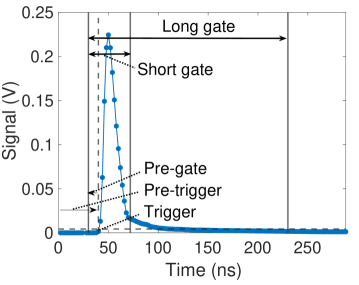
We acquired pulse data with our digitizer controlled by a Dell laptop using the Windows 10 CAEN CoMPASS data acquisition software. The PSD and pulse window settings, based on previous work,shin_measured_2019 are as follows. The pulse acquisition window was set to 288 ns with a 200 ns pulse integral gate, 42 ns short gate, 10 ns pre-gate (or “gate offset”), and 40 ns pre-trigger. We triggered on the leading edge at a 35 LSB (least-significant bits) threshold above the baseline leading to a pulse height threshold of . The baseline was dynamically calculated for each waveform using the first 16 samples (32 ns). The digital scaling was set to 2.5 fC/(LSB Vpp). Figure 6 provides a diagrammatic explanation of the gate settings. When a pulse exceeds the 4.3 mV threshold, the digitizer triggers and writes out a full waveform, as seen in Fig. 6. The time stamp associated with the trigger is calculated by the digitizer as the linearly interpolated time between the first sample below the trigger threshold and the first sample above the trigger threshold.
IV.1 Light-output calibration
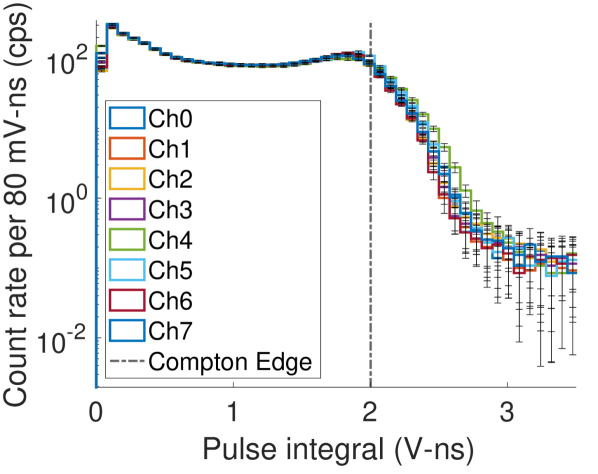
To gain-match each of our detectors, we use adjustments in the high voltage applied to each detector in order to align the spectral channels to the Compton edge from the 137Cs 662 keV gamma ray. We measured the 137Cs source without lead shielding and adjusted the applied voltage on each detector to align the Compton edge of the pulse integral light-output spectrum for each channel within 1.95 0.04 V-ns. An ideal pulse integral distribution exhibits a sharp drop-off after a peak at the Compton edge. Realistically, this sharp edge is distorted by detector energy resolution (in this case, 12.90 +/- 0.24%),shin_fast-neutron_2019 leading the true location of the Compton edge to occur at a light output greater than the measured peak. The true location can be determined by performing an energy-time gated measurement. Such a measurement has previously been completed and described by Shin,shin_fast-neutron_2019 and it was found that the true Compton edge appears at 75.4% of the observed Compton maximum frequency corresponding to a higher pulse integral value than the observed Compton maximum. Once all channels were calibrated, we collected a final calibration measurement of five minutes.
IV.2 Neutron source measurements
With our detectors calibrated, we measured the 252Cf source and the PuBe and AmLi (,n) sources at the center of our well counter shielded by 2.16 cm of annular lead shielding similar to Fig. 4. We measured the two strongest neutron sources, 252Cf and PuBe, for five minutes and the weakest neutron source, AmLi, for 30 minutes. Measurement times are dependent on source strength. In this work, we have detected over one million neutrons for each source.
V Data processing
We acquired list format data of the channel, time of detection (trigger), long gate, and short gate for each detection on-the-fly with our digitizer. CoMPASS PSD settings allow on-the-fly acquisition of the long gate and short gate pulse integrals in analog-to-digital (ADC) digitizer units. To check the analog-to-digital scaling of our raw waveforms, we briefly collected full waveforms during calibration. For convenience as well as bandwidth restrictions of our data acquisition setup, only list format data was processed for the remaining measurements. During data acquisition with the 252Cf source, we received a memory error when attempting to collect full waveforms at a data throughput rate of approximately 13.15 MB/s. This was likely due to the hard drive write speed of our laptop. By collecting in list format, our throughput was reduced to about 1.53 MB/s and the memory error did not occur.
V.1 Light-output conversion factor
Using the long gate integral values from our list format data, we converted our calibrated 137Cs pulse-integral spectra to light-output spectra in Fig. 7, taking our true Compton edge to be at 75.4% of the peak amplitude due to the inherent detector light-output resolution.shin_fast-neutron_2019 We calculated a light-output conversion factor of MeVee/V-ns, accounting for one sample standard deviation from averaging the eight channels.
V.2 Pulse-shape discrimination (PSD)
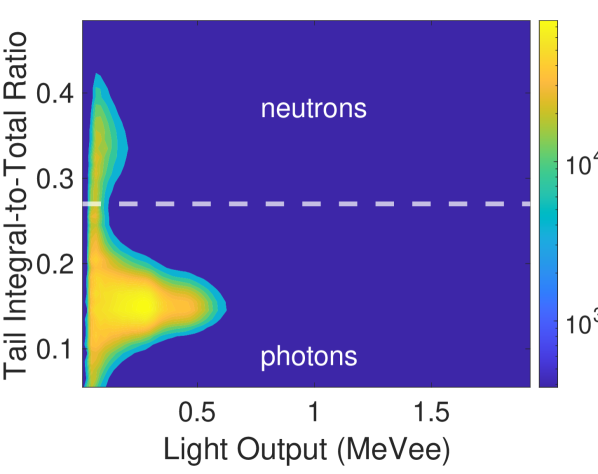
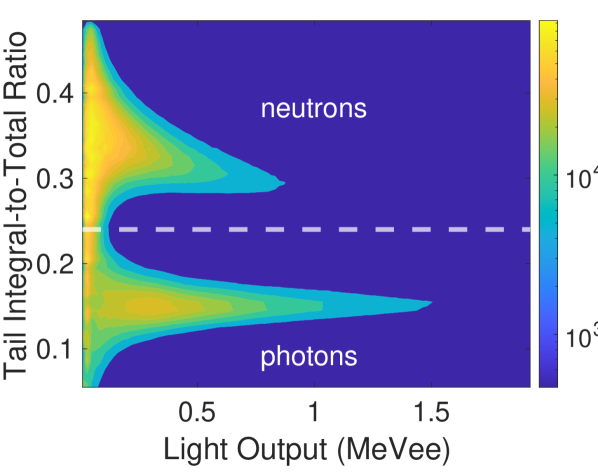
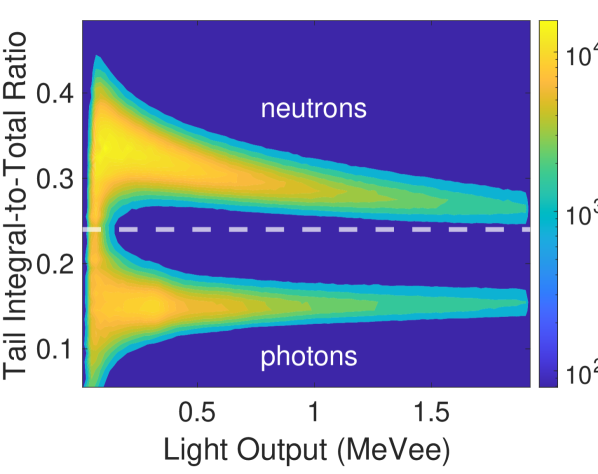
After calibrating each channel with the 137Cs source, we used a pulse-shape discrimination (PSD) parameter known as the tail-to-total integral ratio to discriminate the neutrons from photons for each neutron source. The tail-to-total integral ratio (R) is:
| (3) |
in our list-mode data, where LG is the long gate integral and SG is the short gate integral described in Fig. 6. From our PSD plots in Fig. 8, we chose a constant tail-to-total integral value to discriminate between the neutron (higher R) and photon (lower R) bands spanning over all light-output values. In practice, we discriminate separated light output slices and fit a curve to chosen separation points.polack_algorithm_2015 For simplicity in this analysis, we chose constant R values representing the minimum observed overlap at low light output. R values of 0.24, 0.27, and 0.24 were selected for the 252Cf, AmLi, and PuBe sources, respectively. Using each respective discrimination value, we divided the neutron source list format data into discriminated neutron and photon data for spectra plotting and multiplicity analysis. The PSD is applied after the measurement is completed. To evaluate our PSD fidelity visually during measurement, we utilized the CoMPASS on-the-fly PSD plotting feature.
V.3 Signal-triggered coincidence gates
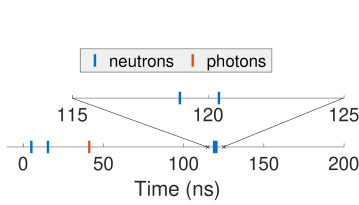
We tagged each detection in our list format data with the appropriate particle label after discriminating the detections into neutron and photon events and sorted the events by time of detection. All detections were treated as gate triggers starting from the first detected particle and a 200 ns gate was opened forward in time after each trigger. The combination of neutron and photon detections in each gate was recorded and included the triggering signal. Each unique combination was summed regardless of the order so that a combination of the order “NP” is equivalent to “PN” where “N” is a neutron and “P” is a photon detected in the same gate. All possible combinations of four or fewer particles were tallied separately and instances of five or more detections in a gate were tallied without recording the combination type. The method described above is signal-triggered multiplicity counting and is used to create our combined neutron and photon multiplicity distribution. Figure 9 in combination with Table 2 provides one example of a pulse train and the signal-triggered combinations that would be recorded for these pulse trains. This pulse train shows a combination of four neutrons and one photon recorded during the 252Cf measurement. These detection timelines of multiple coincident neutrons and photons are limited to a maximum of one detection of each unique combination. For example, the timeline in Fig. 9 would record one “4”, one “NNNP”, one “NNP”, one “NN”, and one “N” combination. One combination for each trigger forward in time.
VI Results and Discussion
VI.1 Neutron source light-output spectra
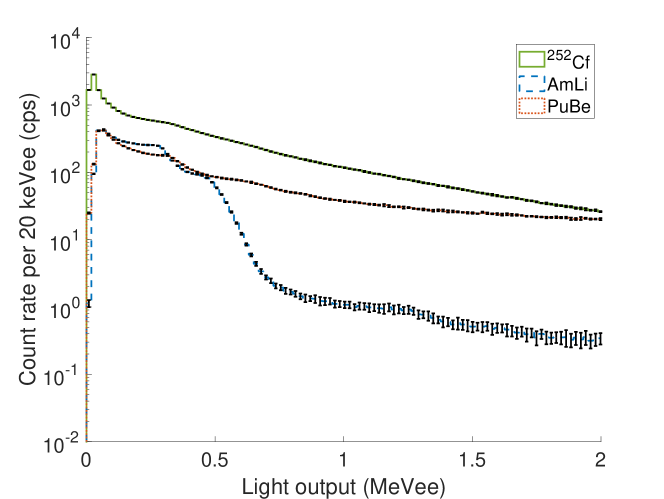
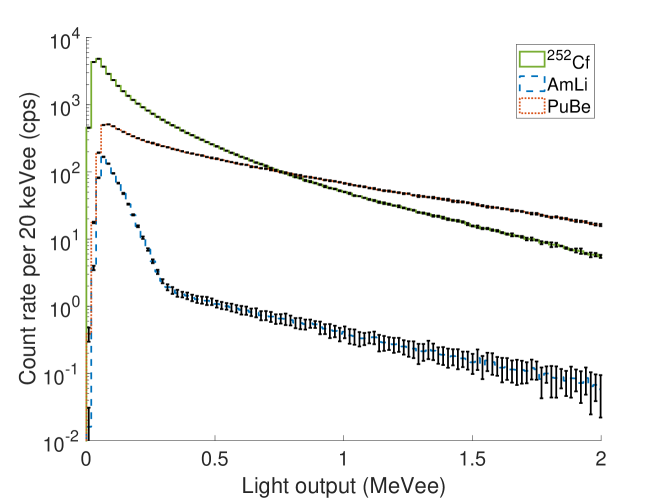
The light-output spectra in Fig. 10 compare the absolute photon distributions in count rate per bin for each neutron source (10(a)) and the absolute neutron distributions in count rate per bin for each neutron source (10(b)) based on the PSD in the previous section.
The AmLi source has approximate observed maximum energy scatters at about 0.80 MeVee and 0.31 MeVee (the latter due to neutron light-output quenching) on the photon and neutron light-output spectra, respectively. The light output above these values is likely due to multiple scatter events from a single particle (in the photon spectrum) or pulse pile-up (in both spectra). Observable maximum energy scatters for AmLi distinguish it from a 252Cf fission source and show that the energy sensitivity of our organic scintillator system provides additional capability as compared to 3He systems given their lack of direct energy sensitivity. The spectra do not fully distinguish PuBe from 252Cf so further multiplicity analysis is required.
VI.2 Combined neutron and photon multiplicity of neutron sources
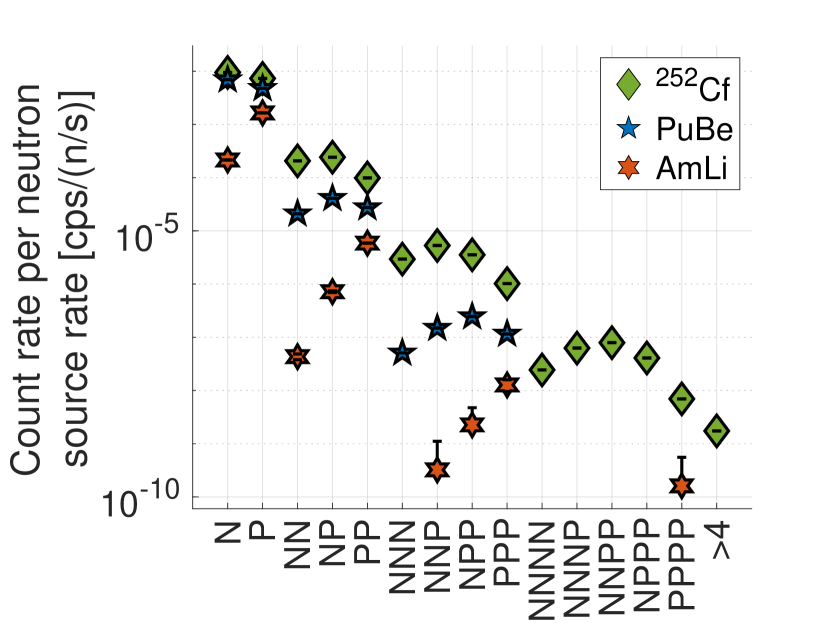
We obtained the combined neutron and photon multiplicity distribution of each neutron source per unit neutron source strength in Fig. 11(a) by applying a 200 ns, signal-triggered timing gate to the discriminated list format data from each radiation source as described in Sec. V.3. The 0.035 MeVee threshold applied is equivalent to about a 0.350 MeV neutron scatter on a proton in stilbene, which eliminates more of the total neutron scatters for AmLi than PuBe or 252Cf due to the higher proportion of neutron scatter events above the energy threshold for the latter two sources. Consequently, the AmLi exhibits a much lower single neutron counts per source neutron than 252Cf and PuBe due to the lower relative neutron energies emitted from AmLi. The AmLi “NNP”, “NPP”, and “PPPP” combinations are all within one standard deviation of zero, and all combinations that are not shown are zero. The AmLi does not produce any neutron triples or particle combinations of four or more, further distinguishing AmLi from 252Cf. The 252Cf produces neutron quadruples and particle combinations of five or more, which is reflective of the higher multiplicity of 252Cf. PuBe produced all combinations of triples or less, but at a significantly lower magnitude than 252Cf despite a similar neutron and photon source-rate-normalized singles magnitude. PuBe did not produce any combinations of four particles except for “PPPP” events that were within one standard deviation of zero. The PuBe source produced significantly more neutron double counts than the AmLi source and the PuBe source had measurable triple neutron counts. These points indicate that PuBe may have a multiplicity, but it is much lower than that of the 252Cf.
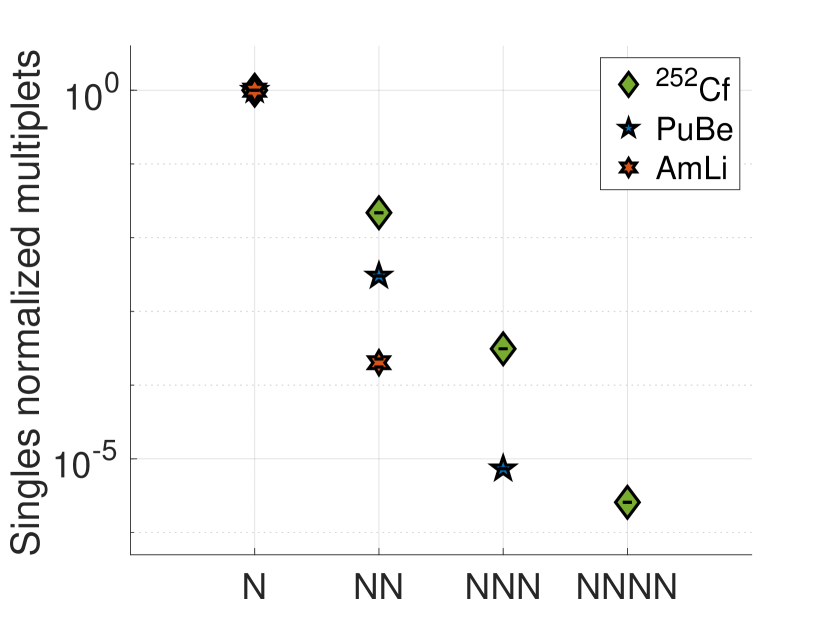
The neutron multiplet rates normalized by the neutron singles rate in Fig. 11(b) show that the relative multiplets of the 252Cf source are clearly higher than that of the (,n) sources. The small rates of neutron multiplets relative to the neutron singles from AmLi completely distinguish AmLi from 252Cf and PuBe. Neutron cross talk contributes to the small rate of neutron doubles from AmLi. The neutron doubles and rare neutron triples relative to the neutron singles from PuBe arise from several characteristics of the PuBe source. The PuBe has a higher proportion of neutrons above the detection threshold than both 252Cf and AmLi, leading to a higher likelihood of neutron cross talk. Secondary (n,2n) reactions in the PuBe matrix, trace amounts of 240Pu, and (n, fission) reactions increase the detected multiplets as well. However, the relative multiplet rates from PuBe are sufficiently low to distinguish the PuBe from 252Cf.
VII Conclusions
We have developed an advanced instructional laboratory that teaches students how to operate a complex organic scintillator well counter and apply nondestructive assay techniques. By completing this laboratory, students will be capable of measuring neutron sources with organic scintillators using the CoMPASS software and CAEN electronics. Participants will learn about pulse-shape discrimination concepts and techniques and be capable of producing discriminated light-output spectra. Building on these methods with signal-triggered time gating, students will be able to produce combined neutron and photon multiplicity distributions. 241Am-Li (AmLi) can be distinguished from 252Cf using the relative maximum energy scatters of neutron and photon light-output spectra and multiplicity distribution relative to 252Cf. In addition, 239Pu-Be (PuBe) can be distinguished from the multiplicity distribution relative to 252Cf with some 240Pu. The difference in relative AmLi and PuBe multiplets may also provide a signature for the trace amounts of plutonium, a special nuclear material, in PuBe. Further simulation of cross talk is required to fully rule out an (,n) source as a fission source, but neither (,n) has spoofed the 252Cf fission source as a non-fissioning neutron source due to the analysis methods applied. This laboratory builds all the fundamental skills needed to assay special nuclear materials like plutonium and uranium in conjunction with gamma-ray spectroscopy for material isotopicsreilly_passive_1991 ; sampson_plutonium_1980 and the cross-talk adjusted point-model equations for neutron multiplet evaluation.shin_neutron_2017
Acknowledgements.
We would like to thank the Detection and Nuclear Nonproliferation Group at the University of Michigan for supporting this work and for the development of the fast neutron multiplicity well-counter. We would like to especially thank Professor Angela Di Fulvio and Dr. Tony Shin for their work in developing and implementing this course with EJ-309 liquid scintillators and the trans-stilbene organic scintillators used in this laboratory. This work is supported and funded by the Consortium for Monitoring, Technology, and Verification under DOE NNSA award number DENA0003920. Any opinions, findings, conclusions, or recommendations expressed in this material are those of the authors and do not necessarily reflect the views of the Consortium for Monitoring, Technology, and Verification.VIII Author Declarations
VIII.1 Pre-proof Statement
The authors are submitting this work to ArXiv in its pre-proof form. This article is being processed for publication by the American Institute of Physics for publication in the American Journal of Physics in the Instruction Laboratories and Demonstrations subsection. The processing identification for this pre-proof is Article Number: AJP22-AR-01524. AJP has provided permission to the authors to submit this pre-proof to ArXiv.
VIII.2 Conflict of Interest Disclosure
The authors have no conflicts to disclose.
IX References
References
- (1) R. C. Runkle, A. Bernstein, and P. E. Vanier, “Securing special nuclear material: Recent advances in neutron detection and their role in nonproliferation,” vol. 108, no. 11, p. 111101, american Institute of Physics. [Online]. Available: https://aip.scitation.org/doi/full/10.1063/1.3503495
- (2) J. Doyle, Nuclear Safeguards, Security, and Nonproliferation, 2nd ed. Elsevier, Butterworth-Heinemann.
- (3) R. V. Petrescu, R. Aversa, S. Kozaitis, A. Apicella, and F. I. Petrescu, “Some basic reactions in nuclear fusion,” vol. 10, no. 3, p. 8, american Journal of Engineering and Applied Sciences. [Online]. Available: http://papers.ssrn.com/abstract=3074117
- (4) E. A. Lorch, “Neutron spectra of 241am-b, 241am-be, 241am-f, 242cm-be, 238pu-13c and 252cf isotopic neutron sources,” vol. 24, no. 10, pp. 585–591, the International Journal of Applied Radiation and Isotopes. [Online]. Available: https://www.sciencedirect.com/science/article/pii/0020708X73901270
- (5) J. S. Fraser and J. C. D. Milton, “Nuclear fission,” vol. 16, no. 1, pp. 379–444, annual Review of Nuclear Science. [Online]. Available: https://doi.org/10.1146/annurev.ns.16.120166.002115
- (6) R. L. Macklin, F. M. Glass, J. Halperin, R. T. Roseberry, H. W. Schmitt, R. W. Stoughton, and M. Tobias, “Neutron multiplicity counter,” vol. 102, no. 1, pp. 181–187, nuclear Instruments and Methods. [Online]. Available: https://www.sciencedirect.com/science/article/pii/0029554X7290537X
- (7) D. G. Langner, M. S. Krick, N. Ensslin, G. E. Bosler, and N. Dytlewski, “Neutron multiplicity counter development,” pp. 1–7, LA-UR-91-1569; CONF-910534-5. [Online]. Available: https://www.osti.gov/biblio/6246287
- (8) M. S. Krick, D. G. Langner, D. W. Miller, J. R. Wachter, and S. S. Hildner, “Thermal-neutron multiplicity counter measurements,” pp. 1–5, LA-UR-91-1569; CONF-910534-5. [Online]. Available: https://www.osti.gov/biblio/7046258
- (9) A. Di Fulvio, T. H. Shin, T. Jordan, C. Sosa, M. L. Ruch, S. D. Clarke, D. L. Chichester, and S. A. Pozzi, “Passive assay of plutonium metal plates using a fast-neutron multiplicity counter,” vol. 855, pp. 92–101, nuclear Instruments and Methods in Physics Research Section A: Accelerators, Spectrometers, Detectors and Associated Equipment. [Online]. Available: https://www.sciencedirect.com/science/article/pii/S0168900217303066
- (10) M. Hua, T. Plummer, J. Hutchinson, G. McKenzie, S. Clarke, and S. Pozzi, “Measured nondestructive assay of 237np using organic scintillators and active neutron multiplicity counting,” in INMM 61st Annual Meeting, p. 1.
- (11) T. H. Shin, M. J. Marcath, A. DiFulvio, S. D. Clarke, and S. A. Pozzi, “Neutron cross-talk characterization of liquid organic scintillators,” in 2015 IEEE Nuclear Science Symposium and Medical Imaging Conference (NSS/MIC), pp. 1–4.
- (12) T. H. Shin, M. Y. Hua, M. J. Marcath, D. L. Chichester, I. Pázsit, A. Di Fulvio, S. D. Clarke, and S. A. Pozzi, “Neutron multiplicity counting moments for fissile mass estimation in scatter-based neutron detection systems,” vol. 188, no. 3, pp. 246–269. [Online]. Available: https://doi.org/10.1080/00295639.2017.1354591
- (13) F. D. Brooks, R. W. Pringle, and B. L. Funt, “Pulse shape discrimination in a plastic scintillator,” vol. 7, no. 2, pp. 35–38.
- (14) R. A. Winyard and G. W. McBeth, “Pulse shape discrimination in inorganic and organic scintillators, II,” vol. 98, no. 3, pp. 525–533. [Online]. Available: https://www.sciencedirect.com/science/article/pii/0029554X72902388
- (15) I. Pazsit, A. Enqvist, and S. Avdic, “Combined use of neutron and gamma multiplicities for determining sample parameters,” in International Conference on Mathematics, Computational Methods, and Reactor Physics. American Nuclear Society - ANS, pp. 1–12, INIS Reference Number: 42064787.
- (16) M. Hua, J.-T. Iacovetta, S. Clarke, and S. Pozzi, “Gamma-ray and fast-neutron rossi-alpha measurements of special nuclear material with organic scintillators,” in INMM 60th Annual Meeting, pp. 1–10. [Online]. Available: https://resources.inmm.org/annual-meeting-proceedings/gamma-ray-and-fast-neutron-rossi-alpha-measurements-special-nuclear
- (17) O. V. Pakari, V. Lamirand, T. Mager, P. Frajtag, and A. Pautz, “High accuracy measurement of the prompt neutron decay constant in CROCUS using gamma noise and bootstrapped uncertainties,” vol. 170, p. 109011. [Online]. Available: https://www.sciencedirect.com/science/article/pii/S0306454922000469
- (18) A. Di Fulvio, S. D. Clarke, T. Jordan, T. Shin, C. Sosa, M. M. Bourne, D. Chichester, and S. A. Pozzi, “Fast multiplicity counter featuring stilbene detectors for special nuclear material assay,” in 2015 IEEE Nuclear Science Symposium and Medical Imaging Conference (NSS/MIC), pp. 1–4.
- (19) T. Shin, A. Di Fulvio, T. Jordan, D. Chichester, S. Clarke, and S. Pozzi, “Fast neutron multiplicity counter based on stilbene and EJ-309 scintillators for nuclear non-destructive assay,” in INMM 57th Annual Meeting, pp. 1–9. [Online]. Available: https://www.researchgate.net/publication/309200213_Fast_Neutron_Multiplicity_Counter_based_on_Stilbene_and_EJ-309_Scintillators_for_Nuclear_Non-Destructive_Assay
- (20) T. Shin, A. Di Fulvio, S. Clarke, D. Chichester, and S. Pozzi, “Fast-neutron multiplicity counter for the detection of diversion scenarios,” in INMM 58th Annual Meeting, pp. 1–9. [Online]. Available: https://www.osti.gov/servlets/purl/1400262
- (21) T. H. Shin, C. A. Bravo, J. Marlow, W. Geist, S. D. Clarke, and S. A. Pozzi, “Neutron-neutron angular and energy-angle correlations of plutonium samples with varying alpha-ratio,” vol. 946, p. 162297. [Online]. Available: https://www.sciencedirect.com/science/article/pii/S0168900219308836
- (22) N. Zaitseva, A. Glenn, L. Carman, H. Paul Martinez, R. Hatarik, H. Klapper, and S. Payne, “Scintillation properties of solution-grown trans-stilbene single crystals,” vol. 789, pp. 8–15. [Online]. Available: https://www.sciencedirect.com/science/article/pii/S0168900215004635
- (23) K. W. Geiger and L. Van Der Zwan, “Radioactive neutron source spectra from 9be(alpha, n) cross section data,” vol. 131, no. 2, pp. 315–321. [Online]. Available: https://www.sciencedirect.com/science/article/pii/0029554X75903365
- (24) D. R. Weaver, J. G. Owen, and J. Walker, “The neutron spectrum from a 5 ci am/li neutron source,” vol. 198, no. 2, pp. 599–602. [Online]. Available: https://www.sciencedirect.com/science/article/pii/0167508782903064
- (25) H. R. Vega-Carrillo, E. Manzanares-Acuña, A. M. Becerra-Ferreiro, and A. Carrillo-Nuñez, “Neutron and gamma-ray spectra of PuBe and AmBe,” vol. 57, no. 2, pp. 167–170. [Online]. Available: https://www.sciencedirect.com/science/article/pii/S0969804302000830
- (26) M. E. Moore, A. V. Mozhayev, R. S. Wittman, and E. K. Mace, “Configuration and impurity quantification of AmLi sources using radiography and gamma spectroscopy,” vol. 990, p. 164987. [Online]. Available: https://www.sciencedirect.com/science/article/pii/S016890022031384X
- (27) A. B. Smith, P. R. Fields, and J. H. Roberts, “Spontaneous fission neutron spectrum of cf-252,” vol. 108, no. 2, pp. 411–413. [Online]. Available: https://link.aps.org/doi/10.1103/PhysRev.108.411
- (28) J. W. Boldeman and M. G. Hines, “Prompt neutron emission probabilities following spontaneous and thermal neutron fission,” vol. 91, no. 1, pp. 114–116. [Online]. Available: https://doi.org/10.13182/NSE85-A17133
- (29) T. E. Valentine, “Evaluation of prompt fission gamma rays for use in simulating nuclear safeguard measurements,” vol. 28, no. 3, pp. 191–201. [Online]. Available: https://www.sciencedirect.com/science/article/pii/S0306454900000396
- (30) G. Vladuca and A. Tudora, “Improved los alamos model applied to the neutron induced fission of 239pu and 240pu and to the spontaneous fission of pu isotopes,” vol. 28, no. 7, pp. 689–700. [Online]. Available: https://www.sciencedirect.com/science/article/pii/S0306454900000839
- (31) P. Marini, J. Taieb, D. Neudecker, G. Bélier, A. Chatillon, D. Etasse, B. Laurent, P. Morfouace, B. Morillon, M. Devlin, J. A. Gomez, R. C. Haight, K. J. Kelly, and J. M. O’Donnell, “Energy dependence of prompt fissions neutron multiplicity in the 239pu(n,f) reaction,” vol. 835, p. 137513. [Online]. Available: https://www.sciencedirect.com/science/article/pii/S0370269322006475
- (32) N. Soppera, M. Bossant, and E. Dupont, “JANIS 4: An improved version of the NEA java-based nuclear data information system,” vol. 120, pp. 294–296. [Online]. Available: https://www.sciencedirect.com/science/article/pii/S0090375214005237
- (33) J. Bagi, L. Lakosi, and C. T. Nguyen, “Neutron producing reactions in PuBe neutron sources,” vol. 366, pp. 69–76. [Online]. Available: https://www.sciencedirect.com/science/article/pii/S0168583X15009787
- (34) J. Birks, The Theory and Practice of Scintillation Counting, 1st ed. Pergamon Press Ltd.
- (35) J. K. Polack, M. Flaska, A. Enqvist, C. S. Sosa, C. C. Lawrence, and S. A. Pozzi, “An algorithm for charge-integration, pulse-shape discrimination and estimation of neutron/photon misclassification in organic scintillators,” vol. 795, pp. 253–267. [Online]. Available: https://www.sciencedirect.com/science/article/pii/S0168900215006889
- (36) R. L. Craun and D. L. Smith, “Analysis of response data for several organic scintillators,” vol. 80, no. 2, pp. 239–244. [Online]. Available: https://www.sciencedirect.com/science/article/pii/0029554X70907688
- (37) T. H. Shin, P. L. Feng, J. S. Carlson, S. D. Clarke, and S. A. Pozzi, “Measured neutron light-output response for trans-stilbene and small-molecule organic glass scintillators,” vol. 939, pp. 36–45. [Online]. Available: https://www.sciencedirect.com/science/article/pii/S0168900219306680
- (38) M. A. Norsworthy, A. Poitrasson-Rivière, M. L. Ruch, S. D. Clarke, and S. A. Pozzi, “Evaluation of neutron light output response functions in EJ-309 organic scintillators,” vol. 842, pp. 20–27. [Online]. Available: https://www.sciencedirect.com/science/article/pii/S0168900216310737
- (39) T. Shin, “Fast-neutron multiplicity counting techniques for nuclear safeguards applications,” department of Nuclear Engineering and Radiological Sciences, University of Michigan. [Online]. Available: http://deepblue.lib.umich.edu/handle/2027.42/151644
- (40) D. Reilly, N. Ensslin, H. A. Smith, Los Alamos National Laboratory, and US Nuclear Regulatory Commission Office of Nuclear Regulatory Research, “Passive nondestructive assay of nuclear materials,” pp. 195–220, ISBN: 9780160327247; LA-UR-90-732; LA-UR-90-0732; NUREG/CR-5550. [Online]. Available: http://permalink.lanl.gov/object/tr?what=info:lanl-repo/lareport/LA-UR-90-0732
- (41) T. Sampson, S. Hsue, J. Parker, S. Johnson, and D. Bowersox, “Plutonium isotopic composition by gamma-ray spectroscopy,” pp. 1–11, LA-8603-MS, 6742725. [Online]. Available: http://www.osti.gov/servlets/purl/6742725-FBb21P/
- (42) N. P. Zaitseva, M. L. Carman, A. M. Glenn, and A. N. Mabe, Plastic Scintillators: Chemistry and Applications, ser. Topics in Applied Physics, M. Hamel, Ed. Springer International Publishing, vol. 140. [Online]. Available: https://link.springer.com/10.1007/978-3-030-73488-6
- (43) F. D. Becchetti, M. Febbraro, R. Torres-Isea, M. Ojaruega, and L. Baum, “Cf-252 fission-neutron spectrum using a simplified time-of-flight setup: An advanced teaching laboratory experiment,” vol. 81, no. 2, pp. 112–119. [Online]. Available: https://aapt.scitation.org/doi/10.1119/1.4769032
- (44) J. C. Hopkins, J. T. Martin, and J. D. Seagrave, “Shadow-bar design for fast-neutron scattering experiments,” vol. 56, no. 1, pp. 175–176. [Online]. Available: https://www.sciencedirect.com/science/article/pii/0029554X67902807
- (45) A. Enqvist, M. Flaska, and S. Pozzi, “Measurement and simulation of neutron/gamma-ray cross-correlation functions from spontaneous fission,” vol. 595, no. 2, pp. 426–430. [Online]. Available: https://www.sciencedirect.com/science/article/pii/S0168900208009212
- (46) M. J. Marcath, T. H. Shin, S. D. Clarke, J. L. Dolan, M. Flaska, E. W. Larsen, S. A. Pozzi, and P. Peerani, “Plutonium metal spontaneous fission neutron cross-correlation measurements,” in 2014 IEEE Nuclear Science Symposium and Medical Imaging Conference (NSS/MIC), pp. 1–3.
- (47) K. Skarsvåg, “Prompt neutron emission from spontaneous fission of cf-252 at long times,” vol. 16, no. 5, pp. 1902–1906. [Online]. Available: https://link.aps.org/doi/10.1103/PhysRevC.16.1902
- (48) L. Holewa, W. Charlton, E. Miller, and S. Pozzi, “Using neutron angular anisotropy information to dynamically determine the ratio of the (alpha,n) rate to spontaneous fission rate for coincidence counting applications,” vol. 701, pp. 249–253. [Online]. Available: https://www.sciencedirect.com/science/article/pii/S0168900212013605
- (49) E. O. Cohen, Y. Waschitz, Y. Ifergan, A. Roy, D. Vartsky, Y. Yehuda-Zada, I. Israelashvili, A. Beck, and L. Arazi, “Demonstration of fast multiplicity counting of 252cf using plastic scintillators and silicon photomultipliers,” vol. 1040, p. 167287. [Online]. Available: https://www.sciencedirect.com/science/article/pii/S0168900222006155
- (50) H. Sabet, G. Prekas, M. Breen, H. B. Bhandari, P. Nickerson, G. Derderian, F. Robertson, H. Kudrolli, S. Cool, and V. V. Nagarkar, “High-performance and cost-effective detector using microcolumnar CsI:tl and SiPM,” vol. 59, no. 5, pp. 1841–1849.
- (51) C. Chung, T. Backes, C. Dittmar, W. Karpinski, T. Kirn, D. Louis, G. Schwering, M. Wlochal, and S. Schael, “The development of SiPM-based fast time-of-flight detector for the AMS-100 experiment in space,” vol. 6, no. 1, p. 14. [Online]. Available: https://www.mdpi.com/2410-390X/6/1/14
- (52) W. Skulski, A. Ruben, and S. BenZvi, “FemtoDAQ: A low-cost digitizer for SiPM-based detector studies and its application to the HAWC detector upgrade,” vol. 64, no. 7, pp. 1677–1682.
Appendix A Possible Extensions and Cost-saving Adjustments
The mixed multiplicity laboratory utilizes several unique and complex characteristics of organic scintillators to provide an advanced teaching laboratory. Calculating discriminated light-output spectra and mixed multiplicity distributions is a challenging task, but there are other aspects of this laboratory that may be separately focused on or added in addition to this experiment presented to perform useful instructional laboratories.
Pulse-shape discrimination (PSD) optimization is a challenging parameter optimization problem that could be explored with only one detector and neutron source.polack_algorithm_2015 The confidence in PSD is a function of the tail-to-total integral ratio distribution within a given light-output range. This confidence can be evaluated by a figure of merit (FOM) such as:
| (4) |
where and are the mean value of Gaussian fits to the neutron and photon ratio distributions and and are the full-width at half-maximum of each respective Gaussian fit. By optimizing for the best FOM in the desired light-output range, the short gate can be optimized for any organic scintillator. Students would learn the underlying physics behind delayed fluorescence,hamel_plastic_2021 curve-fitting for histogram distributions, and figure-of-merit evaluation.
A neutron time-of-flight (TOF) laboratory may be completed with only two detectors from our setup, one neutron source, and the optional addition of a shadow bar to account for room return.becchetti_cf-252_2013 The neutron light-output response relative to the photon light-output response of organic scintillators is nonlinear with energy, which makes it difficult to calculate incident neutron energy. TOF measurements provide the capability to calculate the neutron energy spectrum from a neutron source with organic scintillators using coincident signals from a trigger and offset detector. TOF also provides a means of quantifying PSD particle misclassification. Placing a 252Cf adjacent to a trigger detector and offset from a coincident organic scintillator the neutron energy can be derived from the neutron time of flight and classical physics. The shadow bar is composed of mainly hydrogenhopkins_shadow-bar_1967 and attenuates neutrons along the direct flight path between two detectors. By subtracting the shadow bar TOF from the unattenuated TOF, room return is accounted for. Students would learn the 252Cf energy spectrum and optimization of detector offset for time-of-flight resolution and detection efficiency.
Similarly, organic scintillators may uniquely observe the cross-correlation of fission eventsenqvist_measurement_2008 ; di_fulvio_fast_2015 ; marcath_plutonium_2014 with only two detectors and one fission source. Placing a 252Cf equidistant between two coincident organic scintillators the symmetry and dimensions of the measurement system may be inferred from peaks in the discriminated neutron (n) and photon (p) coincident time-difference distributions. Additionally, particle misclassification may be estimated from the overlap of the respective (n,n), (p,p), and (n,p) cross-correlation distributions. Students would apply discriminated coincident time-difference calculations to build a cross-correlation distribution and classical physics for neutron and photon time of flight.
Fission events have anisotropy in particle emissionskarsvag_prompt_1977 ; holewa_using_2013 and the well-counter utilized in this laboratory is well-equipped to measure coincidence anisotropy.shin_neutron-neutron_2019 The anisotropy can be quantified as a coincidence ratio of respective detector pair groups at specified angles. Students would learn how to complete advanced coincidence analysis of large detector arrays.
The equipment used for this laboratory may be substituted for lower-cost alternatives. EJ-309 liquid scintillators as well as plastic scintillators are capable organic scintillators for multiplicity counting,di_fulvio_passive_2017 ; cohen_demonstration_2022 but do not have the same low-energy PSD capability as trans-stilbene crystals. Higher measurement light-output thresholds would be necessary to reduce particle misclassification. Higher measurement thresholds require longer measurement times to achieve the same statistics, which would increase the measurement time required for this laboratory. A promising new, low-cost alternative that remains untested for multiplicity counting is organic glass.shin_measured_2019 The PSD of organic glass is not as good as trans-stilbene, but organic glass has comparable timing precision to trans-stilbene and comparable PSD to EJ-309. The photomultiplier tubes may be replaced by silicon photomultipliers (SiPMs)sabet_high-performance_2012 ; chung_development_2022 at a potentially lower cost. The digitizerskulski_FemtoDAQ_2017 and high voltage units may also be replaced by lower cost alternatives at the drawback of decreased ease-of-use and loss of built-in compatibility with routinely maintained software like CoMPASS. The digitizer could be swapped for a cheaper, lower frequency (less than 500 MHz) CAEN unit at a loss of PSD fidelity and pulse timing precision.