Fast and Accurate Transferability Measurement by Evaluating Intra-class Feature Variance
Abstract
Given a set of pre-trained models, how can we quickly and accurately find the most useful pre-trained model for a downstream task? Transferability measurement is to quantify how transferable is a pre-trained model learned on a source task to a target task. It is used for quickly ranking pre-trained models for a given task and thus becomes a crucial step for transfer learning. Existing methods measure transferability as the discrimination ability of a source model for a target data before transfer learning, which cannot accurately estimate the fine-tuning performance. Some of them restrict the application of transferability measurement in selecting the best supervised pre-trained models that have classifiers. It is important to have a general method for measuring transferability that can be applied in a variety of situations, such as selecting the best self-supervised pre-trained models that do not have classifiers, and selecting the best transferring layer for a target task.
In this work, we propose TMI (Transferability Measurement with Intra-class feature variance), a fast and accurate algorithm to measure transferability. We view transferability as the generalization of a pre-trained model on a target task by measuring intra-class feature variance. Intra-class variance evaluates the adaptability of the model to a new task, which measures how transferable the model is. Compared to previous studies that estimate how discriminative the models are, intra-class variance is more accurate than those as it does not require an optimal feature extractor and classifier. Extensive experiments on real-world datasets show that TMI outperforms competitors for selecting the top-5 best models, and exhibits consistently better correlation in 13 out of 17 cases.
1 Introduction
Transfer learning is an important concept in the field of machine learning, revolutionizing the way models are trained and applied to various domains. Transfer learning has proven to be particularly valuable when labeled data in the target domain are scarce or costly to obtain. Within the broader scope of transfer learning, several variants have emerged, such as source-free domain adaptation [9, 27, 23, 4], multi-source transfer learning [15, 13, 4, 16], heterogeneous transfer learning [10, 14], and open-set domain adaptation [7, 21].
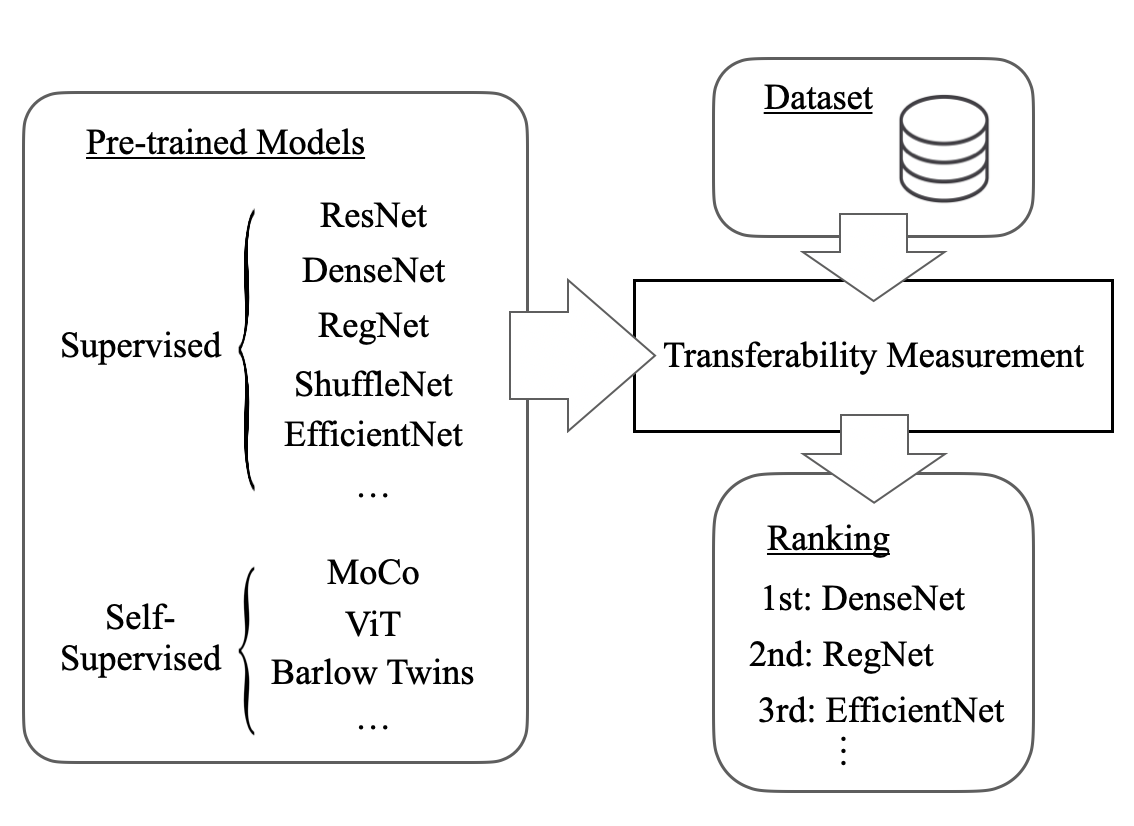
In transfer learning, fine-tuning a pre-trained model becomes a simple and effective way to improve the performance of a downstream task. A crucial step in transfer learning is to quickly and accurately select the most helpful pre-trained model in a set of given pre-trained models. Transferability measurement is to quantify how transferable is a pre-trained model learned on a source task to a target task. As shown in Figure. 1, transferability measurement is used for ranking pre-trained models for a given task, and is a crucial step for transfer learning.
A desired method for transferability measurement should be faster than running a transfer learning algorithm, accurately select the best pre-trained model, and be general to be implemented in various common scenarios. Taskonomy [26] and Task2Vec [1] are computationally expensive due to their learning with data. NCE [18] and LEEP [12] are free of training but cannot be applied to general cases, such as selecting self-supervised pre-trained models and selecting the best transferring layer. LogMe [25] and H-Score [2] also cannot be applied to select the best transferring layer. Instead of measuring transferability, they measure how discriminative a pre-trained model is to a target task before implementing transfer learning, which cannot estimate fine-tuning performance. TransRate [6] is simple and general to be applied for transferability measurement, but too slow due to the computation of the entropy of whole hidden representations.
|
 |
 |
 |
 |
 |
|---|---|---|---|---|---|
| (a) Caltech-101 | (b) Caltech-256 | (c) CIFAR-10 | (d) CIFAR-100 | (e) MNIST | (f) FashionMNIST |
|
 |
 |
 |
 |
 |
| (g) SVHN | (h)FlowerPhotos | (i) EuroSAT | (j) Chest X-Ray | (k) VisDA | (l) FGVC-Aircraft |
|
 |
 |
 |
 |
 |
| (m) CUB-200 | (n) Cars | (o) DTD | (p) Food-101 | (q) Oxford-IIIT Pet |
In this paper, we propose TMI (Transferability Measurement with Intra-class feature variance), a simple but effective method for transferability measurement. We deem transferability as the generalization of a pre-trained model on a target task. To quantify the degree of generalization, we measure the intra-class variance by the conditional entropy of target representation given a label. Intra-class variance evaluates the adaptability of the model to a new task, which measures how transferable the model is. Compared to previous studies that estimate how discriminative the models are, intra-class variance is more accurate than those as it does not require an optimal feature extractor and classifier. Large intra-class variance implies the feature is efficient for learning tasks. TMI can be used for selecting not only the best supervised model but also the best self-supervised models and the best transferring layer.
Our contributions are summarized as follows:
Algorithm. We propose TMI, a fast, accurate, and general method for measuring transferability. We view transferability as generalization ability of a pre-trained model on a target task. The model generalization is measured by intra-class feature variance.
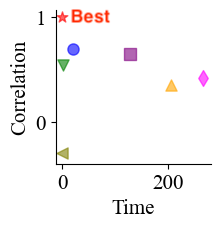
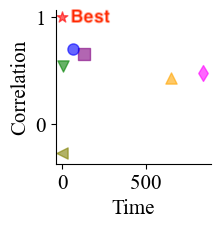
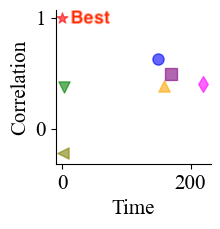
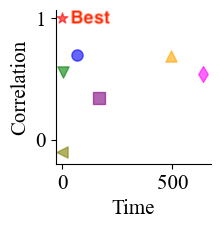
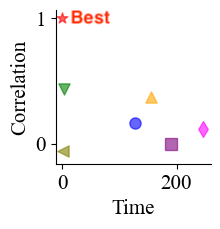
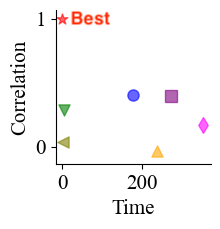
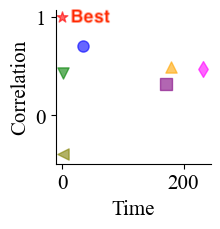
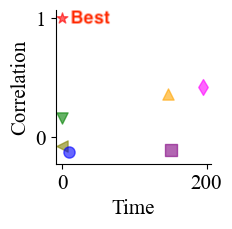
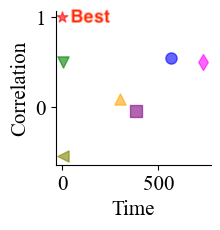
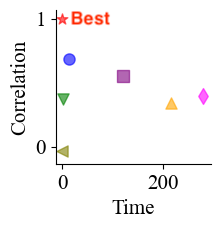
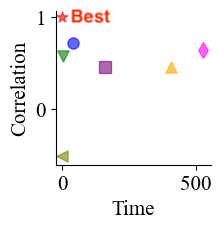
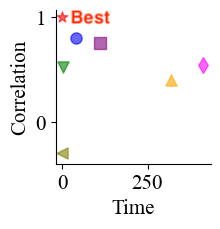
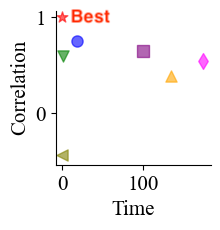
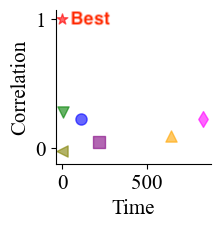
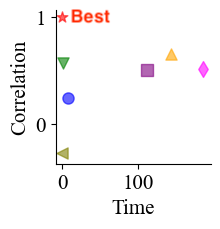
Experiments. We conduct extensive experiments on seventeen datasets with fifty supervised pre-trained models and eleven self-supervised pre-trained models. TMI outperforms competitors for selecting the top-5 pre-trained architecture in 14 out of 17 cases and selecting the best source data in all cases. TMI also shows the best trade-off of the running time and transferability, outperforming competitors in 12 out of 17 cases (see Figure. 2).
Case study. We evaluate the transferability in more general cases, such as applying to self-supervised pre-trained models and selecting the best transferring layer. Compared to competitors, TMI achieves the highest correlation coefficient in 13 out of 17 for selecting the best self-supervised pre-trained models, and in 16 out of 17 datasets for selecting the best transferring layer.
2 Related Works
We assume a pre-trained model in a source domain where is a feature extractor, and is a classifier (or head). We transfer the model to a target domain and add a new classifier at the end of the feature extractor before fine-tuning. Since the target task is different from the source task in most cases, the pre-trained classifier is inappropriate to solve the target task. Thus, we fine-tune the model by minimizing the cross entropy loss on the target dataset :
| (1) |
where a feature extractor maps an input to a representation , and a classifier maps the representation to a probability distribution where is an activation function. Note that is a vector of length , where is the number of classes, and is the cross entropy loss, which is equivalent to the average negative log-likelihood:
| (2) |
where is the probability of -th input instance belonging to its ground truth.
The transferability of a source task to a target task is defined by the log-likelihood [18]:
| (3) |
Taskonomy [26] and Task2Vec [1] train the source model using target data to obtain the optimal feature extractor and the optimal classifier . These methods are inconvenient to measure the transferability due to their training with data. There have been works focusing on estimating a bound on the log-likelihood to evaluate the transferability without training. NCE [18] proposes negative conditional entropy, which is drawn from the empirical joint distribution over ground truths and predicted labels from a pre-trained model. Similarly, LEEP [12] replaces the ground truth with the average log-likelihood to evaluate the transferability. NCE and LEEP are fast, but are restricted to supervised pre-trained models because the algorithms rely on the outputs of the pre-trained classifier. To apply measurements in more general cases, LogME [25] calculates the logarithm of maximum evidence given extracted features, and H-Score [2] solves an HGR maximum correlation problem. LogMe [25] and H-Score [2] still cannot be applied to select the best transferred layer since they extract features from only the ultimate layers of the pre-trained feature extractors. TransRate [6] is the most recent algorithm and applicable to self-supervised models and transferring layer selection. However, it is time-consuming since it requires to calculate mutual information between extracted feature and ground truth. To simplify the problem, [18, 12, 25, 2, 6] assume that the optimal model can be obtained by re-training the classifier while freezing the feature extractor. The assumption goes against the purpose of transferability measurement because we re-train both feature extractor and classifier in general transferring methods. The performance of re-training only the classifier is even worse than training a target model from scratch [24]. In this paper, we propose a fast, accurate, and general transferability measurement method that predicts fine-tuned performance of a pre-trained model to a new target task.
3 Proposed Method
We propose TMI to measure the transferability between a pre-trained model and a target task.
3.1 Overview
Our goal is to measure the transferability in a fast, accurate, and general manner. The following challenges need to be addressed for the goal.
-
C1
Speed. Training a pre-trained model on the target data requires a high computational cost. How can we measure the transferability without training on the target data?
-
C2
Accuracy. Existing methods evaluate the transferability that estimate the performance of the optimal target model obtained by re-training only the classifier, not the feature extractor, which is uncommon in transfer learning. How can we accurately measure the transferability for predicting the fine-tuning performance?
-
C3
Generality. How can we measure the transferability such that it is applicable to general settings, including selecting the best supervised pre-trained model, the best self-supervised pre-trained models, and the transferring layer?
We address the aforementioned challenges with the following main ideas:
-
I1
We assess the transferability by evaluating the compactness and sparseness of target representations with only a one-way forward propagation.
-
I2
We relax the assumption proposed in existing methods that the pre-trained feature extractor can extract all the information related to the target task. We view transferability as the generalization ability of a pre-trained model on a target task. We estimate the generalization ability using intra-class variance, which implies how efficient the feature is for learning tasks.
-
I3
We measure the transferability using intra-class variance of latent representations, which is applicable to various settings including self-supervised pre-trained models and transferring layer selection.
3.2 TMI
Given a pre-trained source model and a target dataset with labels, our goal is to measure the transferability between the source model and the target task to predict the fine-tuning performance. Existing methods measure the performance of re-trained classifier while freezing the feature extractor, which is time-consuming. To address the issues, our proposed TMI computes the transferability as the intra-class variance of a pre-trained model on a target task. Intra-class variance evaluates the adaptability of the model to a new task, which measures how transferable the model is. It is unnecessary for TMI to obtain optimal classifier which is a time-consuming process.
TMI The transferability of a pre-trained feature extractor from a source task to a target task , denoted by , is measured by TMI with the intra-class feature variance obtained from the pre-trained model .
| (4) |
where and represent the target feature and the target label, respectively. represents the number of classes and is the set of target features in the -th class. and represent the number of total instances and number of instances in the -th class, respectively. We measure the intra-class variance of target representations using conditional entropy. The intra-class variance encourages the pre-trained model to have a generalization ability for learning tasks.
How to utilize TMI? Given a set of pre-trained models and a target dataset with labels, we first obtain target representations of pre-trained models by one-way forward propagation. Next, we compute the transferability score using Equation (4). We select the pre-trained model with the highest transferability score and then fine-tune the model using the target data. We argue that the larger the TMI, the higher the transfer performance.
4 Experiments
We present experimental results to answer the following questions about TMI:
-
Q1
Evaluation of transferability estimation (Section 4.2). Does TMI accurately select the best pre-trained model compared to baselines? Is the transferability score measured by TMI highly correlated to the transfer performance?
-
Q2
Comparison of ICV measures (Section 4.3). What is the best measurement to evaluate Intra-Class Variance (ICV)?
-
Q3
Evaluation of generalization ability (Section 4.4). Does intra-class variance estimate generalization ability of a pre-trained model on a target task?
-
Q4
General applications (Section 4.5). Does TMI accurately estimate the transferability in general cases, such as selecting the best self-supervised pre-trained model and the best transferring layer?
-
Q5
Hyperparameter sensitivity (Section 4.6). How sensitive is TMI to hyperparameters?
4.1 Experimental Setup
We present pre-trained models, datasets, baselines, evaluation, estimator, and hyperparameters for our experiments.
Pre-trained models.
We use supervised model groups offered by Pytorch: ResNet, DenseNet, MnasNet, ShuffleNet V2, MobileNet V2, MobileNet V3, ResNeXt, Wide ResNet, EfficientNet, EfficientNet V2, and RegNet. We also utilize self-supervised model groups, which have only feature extractors without classifiers. We obtain Swin Transformer and Vision Transformer from Pytorch; we get MoCo v1, MoCo v2, Barlow Twins, SwAV, SimSiam, and Dino from Gitlab repositories. Note that we select fifty supervised pre-trained models and eleven self-supervised pre-trained models from the aforementioned model groups.
Datasets.
We use seventeen image datasets summarized in Table 1. We randomly split each dataset into a train set and test set by 8:2 ratio, except for datasets that already have been separated.
| Dataset | # of instances (train / test) | # of classes | Category |
|---|---|---|---|
| Caltech-1011 | 7,315 / 1,829 | 101 | Multiple domains |
| Caltech-2562 | 24,485 / 6,122 | 256 | Multiple domains |
| CIFAR-103 | 50,000 / 10,000 | 10 | Multiple domains |
| CIFAR-1003 | 50,000 / 10,000 | 100 | Multiple domains |
| MNIST4 | 60,000 / 10,000 | 10 | Digit |
| FashionMNIST 5 | 60,000 / 10,000 | 10 | Fashion |
| SVHN6 | 73,257 / 26,032 | 10 | Digit |
| FlowerPhotos 7 | 2,936 / 734 | 5 | Flower |
| EuroSAT8 | 21,600 / 5,400 | 10 | Landscape |
| Chest X-Ray9 | 5,216 / 623 | 2 | Medicine |
| VisDA10 | 152,397 / 72,372 | 212 | Multiple domains |
| FGVC-Aircraft11 | 3,334 / 3,333 | 100 | Aircraft |
| CUB-20012 | 9,430 / 2,358 | 200 | Animal |
| Cars13 | 8,144 / 8,041 | 196 | Auto |
| DTD14 | 4,512 / 1,128 | 47 | Texture |
| Food-10115 | 80,800 / 20,200 | 101 | Food |
| Oxford-IIIT Pet16 | 3,680 / 3,669 | 37 | Animal |
- 1
- 2
- 3
- 4
- 5
- 6
- 7
- 8
- 9
- 10
- 11
- 12
- 13
- 14
- 15
- 16
Baselines.
We compare the proposed method with the following baselines. NCE [18] defines the transferability as negative conditional entropy between ground truths and predicted labels from a pre-trained model. LEEP [12] measures negative conditional entropy between ground truths and predicted average log-likelihood. H-Score [2] estimates the transferability by solving an HGR maximum correlation problem. LogME [25] proposes the logarithm of maximum evidence given extracted features. TransRate [6] measures the transferability by the mutual information between target labels and target representations. We omit the comparison with Taskonomy [26] and Task2Vec [1] due to tremendous time costs.
Evaluation.
We evaluate the performance of transferability measurement methods in two ways. First, do they accurately predict the best model? Second, are the transferability scores correlated to fine-tuned accuracy? We adopt Kendall correlation coefficient to measure the correlations between the transferability and fine-tuned accuracy. Kendall correlation coefficient tests the ordinal association between two measured quantities. Kendall correlation coefficient has values between -1 and 1, and correlations between two variables are high when the values are close to 1.
Estimator.
We adopt -nearest estimator [8] to evaluate the continuous entropy in Equation (4). Compared to kernel density estimators [11, 17], -nearest estimator vastly reduces errors by sacrificing time, especially when data are too big. TMI greatly reduces the size of data to be calculated at once because it computes conditional entropy of representation given label.
Hyperparameters.
We use greedy searching algorithm to find the best hyperparameters for fine-tuning. For transferability measurement, the only hyperparameter in our proposed TMI is the number of neighbors, which is used in the entropy estimator [8]. We discuss the hyperparameter sensitivity to transferability in Section 4.6.
4.2 Evaluation of Transferability Estimation
Remind that our goal is to quickly and accurately select the best pre-trained model among a pool of well-trained models. A pre-trained model is determined by two components, source data and model architecture. Thus, we conduct experiments to select the best model architecture and the best source data.
Selecting the best model architecture.
We evaluate how the transferability measurement methods accurately select the best source model for a target model. Table 2 shows the ratio of targets tasks where their top-5 best source models include the model estimated by each transferability measurement method. Note that TMI gives the best ratio, accurately selecting the best pre-trained models in 14 out of 17 cases, which is much better than the ratio 9 / 17 of the second-best model TransRate.
| Methods | NCE | LEEP | LogMe | H-Score | TransRate | TMI |
|---|---|---|---|---|---|---|
| Top-5 | 3 / 17 | 5 / 17 | 4 / 17 | 8 / 17 | 9 / 17 | 14 / 17 |
We also compare the correlations between fine-tuned accuracies and transferability scores in Table 3. Note that our proposed TMI shows the best Kendall correlation in 13 out of 17 datasets, outperforming all the competitors. Some baselines even give negative coefficients, which means that their predictions are far from the correct ranking.
| Dataset | Kendall Correlation Coefficient | |||||
|---|---|---|---|---|---|---|
| NCE | LEEP | LogMe | H-Score | TransRate | TMI | |
| Caltech-101 | 0.429 | 0.425 | 0.316 | 0.362 | 0.474 | 0.524 |
| Caltech-256 | 0.686 | 0.455 | 0.492 | 0.503 | 0.509 | 0.481 |
| CIFAR-10 | -0.140 | 0.324 | 0.275 | 0.323 | 0.364 | 0.527 |
| CIFAR-100 | -0.202 | 0.340 | 0.351 | 0.398 | 0.432 | 0.497 |
| MNIST | 0.057 | 0.282 | 0.083 | 0.137 | 0.038 | 0.137 |
| FashionMNIST | -0.328 | 0.127 | -0.038 | 0.121 | 0.125 | 0.467 |
| SVHN | -0.023 | 0.091 | -0.002 | 0.092 | 0.206 | 0.394 |
| FlowerPhotos | 0.117 | 0.139 | 0.224 | 0.321 | 0.392 | 0.499 |
| EuroSAT | 0.269 | 0.082 | -0.005 | 0.102 | 0.051 | 0.085 |
| Chest X-Ray | 0.071 | 0.152 | 0.171 | 0.333 | 0.285 | 0.395 |
| VisDA | 0.298 | 0.240 | 0.329 | 0.334 | 0.304 | 0.341 |
| FGVC-Aircraft | 0.366 | -0.011 | 0.216 | 0.498 | 0.421 | 0.500 |
| CUB-200 | 0.415 | 0.098 | 0.325 | 0.410 | 0.519 | 0.523 |
| Cars | 0.270 | 0.506 | 0.175 | 0.432 | 0.455 | 0.521 |
| DTD | -0.074 | 0.501 | 0.479 | 0.366 | 0.499 | 0.401 |
| Food-101 | 0.261 | 0.515 | 0.395 | 0.421 | 0.448 | 0.537 |
| Oxford-IIIT Pet | 0.536 | 0.527 | 0.418 | 0.493 | 0.500 | 0.576 |
Selecting the best source data.
We fine-tune eighteen pre-trained models with the same model architecture ResNet-50, but different source datasets, including ImageNet and seventeen datasets introduced in Section 4.1. We predict the best source data and compare correlations with the ground truths. Table 4 shows that our proposed TMI accurately predicts the best source data in all the 17 cases, outperforming all the competitors. Our proposed TMI gives the best Kendall correlation consistently in 12 out of 17 cases, as shown in Table 5.
| Methods | NCE | LEEP | LogMe | H-Score | TransRate | TMI |
|---|---|---|---|---|---|---|
| Top-1 | 1 / 17 | 2 / 17 | 3 / 17 | 2 / 17 | 13 / 17 | 17 / 17 |
| Dataset | Kendall Correlation Coefficient | |||||
|---|---|---|---|---|---|---|
| NCE | LEEP | LogMe | H-Score | TransRate | TMI | |
| Caltech-101 | -0.294 | 0.542 | 0.353 | 0.647 | 0.425 | 0.699 |
| Caltech-256 | -0.268 | 0.542 | 0.437 | 0.660 | 0.477 | 0.699 |
| CIFAR-10 | -0.216 | 0.373 | 0.383 | 0.490 | 0.399 | 0.630 |
| CIFAR-100 | -0.098 | 0.556 | 0.686 | 0.345 | 0.542 | 0.699 |
| MNIST | -0.061 | 0.439 | 0.372 | -0.007 | 0.115 | 0.162 |
| FashionMNIST | -0.086 | 0.362 | 0.430 | 0.475 | 0.046 | 0.150 |
| SVHN | 0.039 | 0.285 | -0.033 | 0.393 | 0.170 | 0.407 |
| FlowerPhotos | -0.359 | 0.412 | 0.456 | 0.307 | 0.490 | 0.516 |
| EuroSAT | -0.388 | 0.428 | 0.490 | 0.322 | 0.467 | 0.704 |
| Chest X-Ray | -0.072 | 0.164 | 0.359 | -0.111 | 0.425 | -0.123 |
| VisDA | -0.538 | 0.498 | 0.094 | -0.039 | 0.498 | 0.546 |
| FGVC-Aircraft | -0.033 | 0.373 | 0.339 | 0.556 | 0.399 | 0.688 |
| CUB-200 | -0.503 | 0.582 | 0.455 | 0.464 | 0.647 | 0.723 |
| Cars | -0.294 | 0.529 | 0.403 | 0.752 | 0.542 | 0.804 |
| DTD | -0.438 | 0.595 | 0.393 | 0.647 | 0.542 | 0.757 |
| Food-101 | -0.020 | 0.281 | 0.092 | 0.046 | 0.229 | 0.225 |
| Oxford-IIIT Pet | -0.268 | 0.569 | 0.660 | 0.503 | 0.516 | 0.248 |
4.3 Comparison of ICV Measures
Intra-Class Variance (ICV) is a general concept widely used in metric learning. In addition to the conditional entropy introduced in Section 3, we additionally choose four metric learning methods, Contrast [5], Center [20], SNCA [22], and MS [19]. We use the intra-class variance parts of their objective functions to measure the transferability. We apply the five aforementioned methods to measure the correlations between fine-tuned accuracies and transferability scores. Conditional Entropy (CE) shows the best correlations than the other four metric learning measurements in 15 out of 17 datasets, outperforming all the competitors, as shown in Table 6. M. Boudiaf et al. [3] demonstrate that the conditional entropy is a lower bound of intra-class variance of the four metric learning methods.
| Dataset | Kendall Correlation Coefficient | ||||
|---|---|---|---|---|---|
| Contrast | Center | SNCA | MS | CE | |
| Caltech-101 | 0.274 | 0.283 | 0.380 | 0.358 | 0.442 |
| Caltech-256 | 0.295 | 0.347 | 0.261 | 0.347 | 0.354 |
| CIFAR-10 | 0.328 | 0.322 | 0.275 | 0.299 | 0.369 |
| CIFAR-100 | 0.374 | 0.282 | 0.207 | 0.200 | 0.376 |
| MNIST | 0.383 | 0.267 | 0.306 | 0.228 | 0.374 |
| FashionMNIST | 0.332 | 0.225 | 0.260 | 0.337 | 0.374 |
| SVHN | 0.303 | 0.359 | 0.369 | 0.360 | 0.383 |
| FlowerPhotos | 0.209 | 0.263 | 0.291 | 0.277 | 0.372 |
| EuroSAT | 0.292 | 0.237 | 0.367 | 0.268 | 0.400 |
| Chest X-Ray | 0.292 | 0.289 | 0.210 | 0.232 | 0.357 |
| VisDA | 0.259 | 0.352 | 0.200 | 0.329 | 0.352 |
| FGVC-Aircraft | 0.220 | 0.322 | 0.244 | 0.315 | 0.351 |
| CUB-200 | 0.368 | 0.252 | 0.379 | 0.385 | 0.431 |
| Cars | 0.351 | 0.285 | 0.398 | 0.268 | 0.248 |
| DTD | 0.236 | 0.322 | 0.228 | 0.206 | 0.327 |
| Food-101 | 0.322 | 0.267 | 0.246 | 0.269 | 0.484 |
| Oxford-IIIT Pet | 0.301 | 0.202 | 0.363 | 0.274 | 0.449 |
4.4 Evaluation of Generalization Ability
We perform experiments on two control groups to demonstrate that transferability is relevant to the generalization ability of a pre-trained model on a target task. In Group A, we use a pre-trained ResNet-50 model trained on ImageNet and fine-tune it using the dataset . In Group B, we train a ResNet-50 model trained from scratch on dataset and fine-tune it on the same dataset. Dataset is one of the datasets introduced in Section 4.1.
Table 7 shows the difference of fine-tuning performance and that of transferability between two groups. “+” represents the difference is larger than 0 while “-” represents that is less than 0. Group A has higher transfer accuracies than Group B in most cases since models in Group A have learned a large amount of information from the ImageNet, which can potentially benefit downstream tasks.
Our proposed TMI and TransRate have the same symbols for transfer accuracy in 14 out of 17 cases, while the other four baselines do not provide similar symbols. TransRate also estimates well, but it is computationally expensive since it measures the mutual information between target representation and label. In contrast, TMI is more efficient as it considers only intra-class features.
| Dataset | Accuracy | Transferability (A - B) | |||||
|---|---|---|---|---|---|---|---|
| (A - B) | NCE | LEEP | LogME | H-Score | TransRate | TMI | |
| Caltech-101 | + | - | - | - | - | + | + |
| Caltech-256 | + | - | - | - | - | + | + |
| CIFAR-10 | + | - | - | - | - | + | + |
| CIFAR-100 | + | - | - | - | - | + | + |
| MNIST | - | - | - | - | + | + | + |
| FashionMNIST | + | - | - | - | - | + | + |
| SVHN | - | - | - | - | - | + | + |
| FlowerPhotos | + | - | - | - | - | + | + |
| EuroSAT | + | - | - | - | + | + | + |
| Chest X-Ray | + | - | - | - | - | + | + |
| VisDA | + | - | - | - | + | + | + |
| FGVC-Aircraft | + | - | - | - | - | + | + |
| CUB-200 | + | - | - | - | - | + | + |
| Cars | - | - | - | - | - | + | + |
| DTD | + | - | - | - | - | + | + |
| Food-101 | + | - | - | - | - | + | + |
| Oxford-IIIT Pet | + | - | - | - | - | + | + |
4.5 General Applications
Applying to self-supervised pre-trained models.
TMI not only measures the transferability between supervised pre-trained models and classification tasks but also can be extended to self-supervised pre-trained models. We prepare eleven self-supervised pre-trained models already trained on ImageNet provided by Github repositories introduced in Section 4.1. NCE [18] and LEEP [12] cannot measure the transferability between a self-supervised pre-trained model and a downstream task because they dig out the relationship between target ground truth and predicted label or probability. Thus, we compare the proposed TMI to LogME [25], H-Score [2], and TransRate [6] in Table 8; TMI outperforms competitors in 13 out of 17 classification datasets.
| Dataset | Kendall Correlation Coefficient | |||
|---|---|---|---|---|
| LogMe | H-Score | TransRate | TMI | |
| Caltech-101 | -0.278 | 0.183 | 0.000 | 0.367 |
| Caltech-256 | -0.561 | 0.345 | 0.164 | 0.600 |
| CIFAR-10 | -0.337 | 0.018 | 0.164 | 0.624 |
| CIFAR-100 | -0.561 | 0.673 | 0.236 | 0.697 |
| MNIST | -0.574 | -0.262 | -0.426 | 0.246 |
| FashionMNIST | -0.330 | -0.220 | -0.330 | 0.094 |
| SVHN | 0.055 | 0.309 | -0.345 | 0.075 |
| FlowerPhotos | 0.389 | -0.241 | 0.130 | 0.075 |
| EuroSAT | -0.073 | -0.037 | 0.037 | -0.208 |
| Chest X-Ray | -0.037 | -0.037 | -0.257 | 0.175 |
| VisDA | 0.550 | 0.055 | 0.309 | -0.597 |
| FGVC-Aircraft | -0.345 | 0.091 | -0.309 | 0.150 |
| CUB-200 | -0.112 | -0.018 | 0.091 | 0.564 |
| Cars | 0.000 | 0.382 | -0.200 | 0.262 |
| DTD | 0.382 | 0.018 | 0.224 | 0.455 |
| Food-101 | -0.411 | -0.018 | -0.018 | 0.204 |
| Oxford-IIIT Pet | -0.585 | 0.294 | 0.073 | 0.807 |
Selecting the best transferring layer.
Given a ResNet-18 trained on ImageNet, we can easily determine the best transferring layer, which produces the best fine-tuning performance for a target task by measuring transferability. We compare the correlations of LogME [25], H-Score [2], and TransRate to select the best transferring layer for fine-tuning. Theoretically, LogME [25] and H-Score [2] cannot deal with layer selection because they rely on features from the ultimate layer of the feature extractor. However, we extract features from each layer and directly put them into LogME and H-Score algorithms to calculate the transferability. The size of extracted features is quite large in the early layers, resulting in much higher computational cost for transferability measurement. To reduce this cost, we add an avgpool2d layer to the end of transferring layer to reduce the dimension of extracted features. Table 9 shows that TMI achieves the highest correlation coefficients in 16 out of 17 datasets. Correlation coefficients of MNIST, SVHN, and Chest X-Ray are much lower than those of the other datasets because their ranges of minimum and maximum accuracies obtained by layer transfer are smaller than 0.5%, making it challenging to rank these dataset accurately.
| Dataset | Kendall Correlation Coefficient | |||
|---|---|---|---|---|
| LogMe | H-Score | TransRate | TMI | |
| Caltech-101 | 0.346 | 0.935 | 0.752 | 0.941 |
| Caltech-256 | 0.973 | 0.317 | 0.800 | 0.984 |
| CIFAR-10 | 0.360 | 0.743 | 0.704 | 0.746 |
| CIFAR-100 | 0.460 | 0.774 | 0.774 | 0.801 |
| MNIST | 0.180 | 0.055 | 0.179 | 0.184 |
| FashionMNIST | 0.294 | 0.241 | 0.298 | 0.308 |
| SVHN | 0.087 | 0.106 | 0.040 | 0.113 |
| FlowerPhotos | 0.779 | 0.198 | 0.687 | 0.792 |
| EuroSAT | 0.691 | 0.709 | 0.495 | 0.735 |
| Chest X-Ray | 0.113 | 0.154 | 0.100 | 0.054 |
| VisDA | 0.665 | 0.866 | 0.826 | 0.904 |
| FGVC-Aircraft | 0.791 | 0.302 | 0.595 | 0.817 |
| CUB-200 | 0.317 | 0.970 | 0.787 | 0.954 |
| Cars | 0.330 | 0.869 | 0.752 | 0.882 |
| DTD | 0.924 | 0.401 | 0.761 | 0.931 |
| Food-101 | 0.409 | 0.948 | 0.869 | 0.970 |
| Oxford-IIIT Pet | 0.349 | 0.970 | 0.826 | 0.990 |
4.6 Hyperparameter Sensitivity
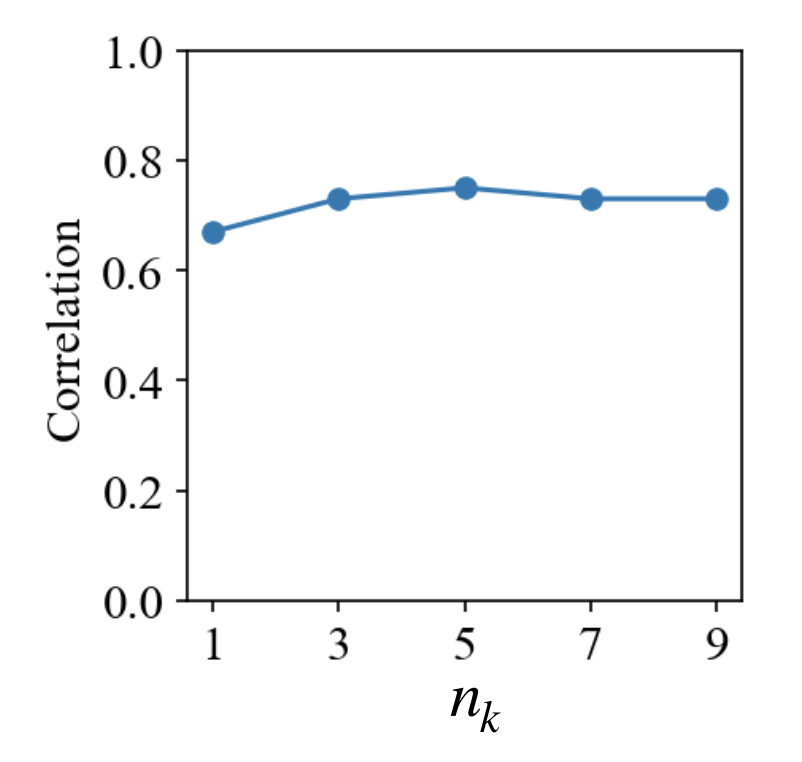
An advantage of TMI is that it does not train models on target datasets because it is time-consuming and sensitive to hyperparameters which may cause different results. The only hyperparameter in TMI is used in the entropy estimator. In Figure. 3, the correlation between pre-trained models and TMI shows consistency.
5 Conclusion
We propose TMI, a fast, accurate, and general algorithm to measure the transferability. TMI quantifies the degree of generalization of a pre-trained model to a new task by estimating the intra-class feature variance. We conduct experiments on seventeen datasets with fifty supervised pre-trained models and eleven self-supervised pre-trained models. TMI selects the top-5 pre-trained architecture in 14 out of 17 cases and selects the best source data in all cases, outperforming its competitors. We measure the correlation between the fine-tuning performance and transferability, and our proposed TMI outperforms competitors in 13 out of 17 cases.
Acknowledgments
This work was supported by Institute of Information & communications Technology Planning & Evaluation(IITP) grant funded by the Korea government(MSIT) [No.2020-0-00894, Flexible and Efficient Model Compression Method for Various Applications and Environments], [No.2021-0-01343, Artificial Intelligence Graduate School Program (Seoul National University)], and [NO.2021-0-02068, Artificial Intelligence Innovation Hub (Artificial Intelligence Institute, Seoul National University)]. The Institute of Engineering Research at Seoul National University provided research facilities for this work. The ICT at Seoul National University provides research facilities for this study. U Kang is the corresponding author.
References
- [1] Alessandro Achille, Michael Lam, Rahul Tewari, Avinash Ravichandran, Subhransu Maji, Charless C. Fowlkes, Stefano Soatto, and Pietro Perona. Task2vec: Task embedding for meta-learning. In ICCV, 2019.
- [2] Yajie Bao, Yang Li, Shao-Lun Huang, Lin Zhang, Lizhong Zheng, Amir Roshan Zamir, and Leonidas J. Guibas. An information-theoretic approach to transferability in task transfer learning. In ICIP, 2019.
- [3] Malik Boudiaf, Jérôme Rony, Imtiaz Masud Ziko, Eric Granger, Marco Pedersoli, Pablo Piantanida, and Ismail Ben Ayed. A unifying mutual information view of metric learning: Cross-entropy vs. pairwise losses. In Computer Vision - ECCV 2020 - 16th European Conference, Glasgow, UK, August 23-28, 2020, Proceedings, Part VI, volume 12351 of Lecture Notes in Computer Science, pages 548–564. Springer, 2020.
- [4] Jeon H., Lee S., and Kang U. Unsupervised multi-source domain adaptation with no observable source data. PloS one, 16(7), 2021.
- [5] Raia Hadsell, Sumit Chopra, and Yann LeCun. Dimensionality reduction by learning an invariant mapping. In 2006 IEEE Computer Society Conference on Computer Vision and Pattern Recognition (CVPR 2006), 17-22 June 2006, New York, NY, USA, pages 1735–1742. IEEE Computer Society, 2006.
- [6] Long-Kai Huang, Junzhou Huang, Yu Rong, Qiang Yang, and Ying Wei. Frustratingly easy transferability estimation. In ICML, 2022.
- [7] JoonHo Jang, Byeonghu Na, DongHyeok Shin, Mingi Ji, Kyungwoo Song, and Il-Chul Moon. Unknown-aware domain adversarial learning for open-set domain adaptation. In NeurIPS, 2022.
- [8] Alexander Kraskov, Harald Stögbauer, and Peter Grassberger. Estimating mutual information. Physical Review E, 2004.
- [9] Jian Liang, Dapeng Hu, Jiashi Feng, and Ran He. Dine: Domain adaptation from single and multiple black-box predictors. In Proceedings of the IEEE/CVF Conference on Computer Vision and Pattern Recognition, 2022.
- [10] Feng Liu, Guangquan Zhang, and Jie Lu. Heterogeneous domain adaptation: An unsupervised approach. IEEE Transactions on Neural Networks and Learning Systems, 31(12):5588–5602, 2020.
- [11] Young-Il Moon, Balaji Rajagopalan, and Upmanu Lall. Estimation of mutual information using kernel density estimators. Phys. Rev. E, 1995.
- [12] Cuong Nguyen, Tal Hassner, Matthias W. Seeger, and Cédric Archambeau. LEEP: A new measure to evaluate transferability of learned representations. In ICML, 2020.
- [13] Tuan Nguyen, Trung Le, He Zhao, Quan Hung Tran, Truyen Nguyen, and Dinh Phung. Most: multi-source domain adaptation via optimal transport for student-teacher learning. In Proceedings of the Thirty-Seventh Conference on Uncertainty in Artificial Intelligence, pages 225–235, 2021.
- [14] Seungcheol Park, Huiwen Xu, Taehun Kim, Inhwan Hwang, Kyung-Jun Kim, and U Kang. Fast and accurate transferability measurement for heterogeneous multivariate data. CoRR, abs/1912.13366, 2019.
- [15] Chuan-Xian Ren, Yong Hui Liu, Xiwen Zhang, and Ke-Kun Huang. Multi-source unsupervised domain adaptation via pseudo target domain. IEEE Trans. Image Process., 31:2122–2135, 2022.
- [16] Lee S., Jeon H., and Kang U. Multi-epl: Accurate multi-source domain adaptation. PloS one, 16(8), 2021.
- [17] Ralph E. Steuer, Jürgen Kurths, Carsten O. Daub, Janko Weise, and Joachim Selbig. The mutual information: Detecting and evaluating dependencies between variables. In ECCB, 2002.
- [18] Anh Tuan Tran, Cuong V. Nguyen, and Tal Hassner. Transferability and hardness of supervised classification tasks. In ICCV, 2019.
- [19] Xun Wang, Xintong Han, Weilin Huang, Dengke Dong, and Matthew R. Scott. Multi-similarity loss with general pair weighting for deep metric learning. In IEEE Conference on Computer Vision and Pattern Recognition, CVPR 2019, Long Beach, CA, USA, June 16-20, 2019, pages 5022–5030. Computer Vision Foundation / IEEE, 2019.
- [20] Yandong Wen, Kaipeng Zhang, Zhifeng Li, and Yu Qiao. A discriminative feature learning approach for deep face recognition. In Computer Vision - ECCV 2016 - 14th European Conference, Amsterdam, The Netherlands, October 11-14, 2016, Proceedings, Part VII, volume 9911 of Lecture Notes in Computer Science, pages 499–515. Springer, 2016.
- [21] Jun Wu and Jingrui He. Domain adaptation with dynamic open-set targets. In KDD ’22: The 28th ACM SIGKDD Conference on Knowledge Discovery and Data Mining, Washington, DC, USA, August 14 - 18, 2022, pages 2039–2049. ACM, 2022.
- [22] Zhirong Wu, Alexei A. Efros, and Stella X. Yu. Improving generalization via scalable neighborhood component analysis. In Computer Vision - ECCV 2018 - 15th European Conference, Munich, Germany, September 8-14, 2018, Proceedings, Part VII, volume 11211 of Lecture Notes in Computer Science, pages 712–728.
- [23] Huiwen Xu and U Kang. Transfer alignment network for blind unsupervised domain adaptation. Knowl. Inf. Syst., 63(11):2861–2881, 2021.
- [24] Jason Yosinski, Jeff Clune, Yoshua Bengio, and Hod Lipson. How transferable are features in deep neural networks? In Advances in Neural Information Processing Systems, volume 27, 2014.
- [25] Kaichao You, Yong Liu, Jianmin Wang, and Mingsheng Long. Logme: Practical assessment of pre-trained models for transfer learning. In ICML, 2021.
- [26] Amir R. Zamir, Alexander Sax, William B. Shen, Leonidas J. Guibas, Jitendra Malik, and Silvio Savarese. Taskonomy: Disentangling task transfer learning. In 2018 IEEE Conference on Computer Vision and Pattern Recognition, CVPR 2018, 2018.
- [27] Haojian Zhang, Yabin Zhang, Kui Jia, and Lei Zhang. Unsupervised domain adaptation of black-box source models. arXiv preprint arXiv:2101.02839, 2021.