Boletim da Sociedade Astronômica Brasileira, 31, no. 1, XX-XX3
22email: paola.marziani@inaf.it
Broad lines in active galaxies are primarily emitted by photoionization processes that are driven by the incident continuum arising from a complex geometrical structure circumscribing the supermassive black hole. A model of the broad-band spectral energy distribution (SED) effective in ionizing the gas-rich broad line emitting region (BLR) is needed to understand the various radiative processes that eventually lead to the emission of emission lines from diverse physical conditions. Photoionization codes are a useful tool to investigate two aspects - the importance of the shape of the SED, and the physical conditions in the BLR. In this work, we focus on the anisotropy of continuum radiation from the very centre a direct consequence of the development of a funnel-like structure at regions very close to the black hole. Accounting for the diversity of Type-1 active galactic nuclei (AGNs) in the context of the main sequence of quasars, permits us to locate the super Eddington sources along the sequence and constrain the physical conditions of their line-emitting BLR.Linhas amplas em galáxias ativas são emitidas principalmente por processos de fotoionização que são conduzidos pelo contínuo incidente decorrente da estrutura geométrica complexa que circunscreve o buraco negro supermassivo. Um modelo da distribuição de energia espectral de banda larga (SED) eficaz na ionização da região emissora de linha larga (BLR) rica em gás é necessário para entender os vários processos radiativos que eventualmente levam à emissão de linhas de emissão de diversas condições físicas. Os códigos de fotoionização são uma ferramenta útil para investigar dois aspectos - a importância da forma do SED e as condições físicas no BLR. Neste trabalho, focamos na anisotropia da radiação contínua do próprio centro, uma consequência direta do desenvolvimento de uma estrutura em forma de funil em regiões muito próximas ao buraco negro. Levar em conta a diversidade de núcleos galácticos ativos do tipo 1 (AGNs) no contexto da sequência principal de quasares, nos permite localizar as fontes super Eddington ao longo da sequência e restringir as condições físicas de seus BLR emissores de linha.
Modeling the quasar spectra for super-Eddington sources
keywords:
accretion, accretion disks– galaxies: active – quasars: emission lines – Radiation mechanisms: thermal – Radiative transfer – cosmological parameters1 Introduction
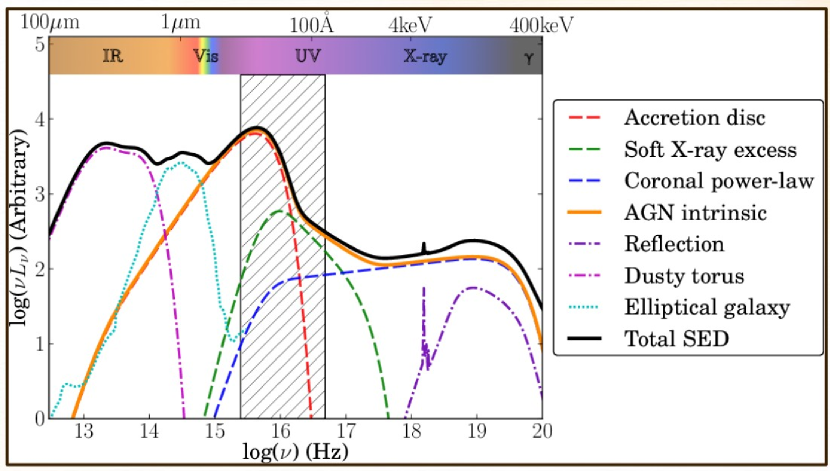
Active galactic nuclei (AGN) are amongst the most luminous cosmic objects to be found in the Universe. They host supermassive black holes (SMBH) at their centers which possess immense gravitational potential. The gravitational force leads to the accretion of matter that in turn leads to heating up, loss of angular momentum, infall, and formation of an accretion disk (Lynden-Bell 1969; Shakura & Sunyaev 1973). The radiation emitted due to the heated-up matter from the accretion disk is the primary source of ionization of the gas-rich media in the vicinity of the SMBH. These gas-rich media are photoionized due to the incoming ionizing photons and lead to the production of emission lines which we observe (Schmidt 1963; Greenstein & Schmidt 1964; Schmidt & Green 1983; Osterbrock & Ferland 2006; Netzer 2015). The AGN is made of various interrelated regions that contribute to the observed spectrum that we receive as a spatially unresolved spectrum. Apart from the SMBH at the centre and the accretion disk surrounding it, an X-ray corona is expected to be present where the hot Comptonized X-ray emission originates from. The AGN intrinsic continuum (Collinson 2016; Kubota & Done 2018; Panda et al. 2019; Ferland et al. 2020) is thus due to the various thermal processes that are marked in Figure 1. Primary among them is the thermal continuum from the accretion disk, the X-ray coronal power-law continuum, and the reflection component which is due to the accretion disk reflecting the X-ray photons originally from the corona. In addition to these components, a “soft X-ray excess” (Arnaud et al. 1985) is partially seen in the spectra of some AGNs. The origin of the soft X-ray excess has been attributed to a warm Comptonizing component and helps to bridge the absorption gap between the UV downturn and the soft X-ray upturn (e.g., Elvis et al. 1994; Laor et al. 1997; Richards et al. 2006), and changes the far-UV and soft X-ray parts of the spectrum.
Emission lines have a range of relative intensities and line widths. Transforming this information into a velocity-space, we then have a range of velocities - for the broad emission lines this velocity is usually 500-700 km s-1 at low luminosity (Zhou et al. 2006; Marziani et al. 2009; Shen et al. 2011; Rakshit et al. 2020). As these ionized media are bound to the SMBH and they orbit around it in Keplerian trajectories, the exact value of their velocities allows us to infer (relatively) how close to the SMBH they are orbiting. An exact determination of the distances of these line-emitting media can be achieved using the light-echo or the reverberation mapping technique which involves cross-correlating the direct continuum light from the accretion disk and the scattered light from the BLR, both eventually reaching to us (Blandford & McKee 1982; Peterson et al. 2004; Peterson 1993). The scattered light from the BLR due to the extra light travel time takes longer to arrive to us relative to the direct continuum light. This allows us to measure the separation of the BLR from the accretion disk. With the collective information of the velocity of the emission line (from single or multi-epoch spectroscopy) and the radial separation of the line-emitting BLR from the ionizing continuum source (or the RBLR), one can then use the virial relation to estimate the black hole mass (Bentz et al. 2013; Du et al. 2014; Kaspi et al. 2000) of the SMBH111The virial relation also requires a scale-factor (f) that contains the information of the geometry of the emitting region.. Therefore the study of an AGN spectrum should involve the definition of the ionizing continuum and of the intensity ratios and line profile properties of the emission lines. They will in turn provide us with insight on the dynamics, energetics and composition of their immediate surroundings.
2 Narrow-Line Seyfert 1 Galaxies: drivers of the Eigenvector 1 correlations
Narrow Line Seyfert Type-1 galaxies (or NLS1s) are a unique class of Type-1 AGNs that are characterized by “narrower” broad emission lines. They show FWHM(H) 2,000 km s-1, and the ratio [Oiii]5007/H 3 (Osterbrock & Pogge 1985; Goodrich 1989). Also, the NLS1s exhibit strong Fe ii emission and the relative strength of the optical Fe ii (within 4434-4684 Å) to the H, or RFeII, is 1 (Sulentic et al. 2000; Marziani et al. 2018; Panda et al. 2019). NLS1s have been used to analyze the Fe ii emission since the late 1970s (Phillips 1978) which is among the most noticeable cooling agents of the BLR, emitting about 25% of the total energy in the BLR (Wills et al. 1985). The Fe ii is a strong contaminant owing to a large number of emission lines and without proper modelling and subtraction, it may lead to a wrong description of the physical conditions in the BLR (Verner et al. 1999; Sigut & Pradhan 2003; Sigut et al. 2004; Baldwin et al. 2004; Panda 2020). In addition, the parameter RFeII is central to the Eigenvector 1 scheme which consists of the dominant variable in the principal component analysis presented by Boroson & Green (1992) which is now well understood to be associated with fundamental parameters of the accretion process in the AGNs (Sulentic et al. 2000; Shen & Ho 2014; Marziani et al. 2018; Panda et al. 2019; Du & Wang 2019; Martínez-Aldama et al. 2021).
We focus here on NLS1s of relatively high Eddington ratio, selected by the condition RFeII (Marziani & Sulentic 2014) because they are the class of type-1 AGN most frequently isolated for systematic studies. We stress that a more meaningful approach for low redshift samples would be to impose a limit at FWHM H 4000 km s-1. This limit defines a Population A of relatively high accretors that obviously incorporates NLSy1s (Sulentic et al. 2000; Marziani et al. 2018). NLS1s with high accretion rates are typically shown to have a prominent soft-X-ray excess (Arnaud et al. 1985) that can be clearly seen in their broadband SED (Jin et al. 2012b, a; Kubota & Done 2018; Ferland et al. 2020).
3 Shorter BLR time-lags and higher accretion rates in NLS1s
The recent reverberation mapping results have led to populate the empirical RBLR-L5100 observational space (Kaspi et al. 2000; Bentz et al. 2013) and taking the total count over 100, especially the sources monitored under the SEAMBH project (Super-Eddington Accreting Massive Black Holes, Du et al. 2014; Wang et al. 2014a; Hu et al. 2015; Du et al. 2015, 2016, 2018), and from the SDSS-RM campaigns Grier et al. (2017); Shen et al. (2019). But this has introduced us to a new challenge - the inherent dispersion in the RBLR-L5100 relation after the introduction of these new sources (see Figure 1 in Panda & Marziani 2022). The sources that eventually led to the increase in the scatter in the relation, show an interesting trend with the Eddington ratio - the larger the dispersion of a source from the empirical RBLR-L5100 relation, the higher its Eddington ratio. Martínez-Aldama et al. (2019) found that this dispersion can be accounted for in the standard RBLR-L5100 relation with an added dependence on the Eddington ratio (Lbol/LEdd). Du & Wang (2019) exploited this further and realized that with an additional correction term, the relation can be reverted back to the original relation with a slope 0.5. This additional correction term is the strength of the Fe ii emission in the optical region - RFeII, which has been shown in earlier studies to be a reliable observational proxy for the Eddington ratio (Sulentic et al. 2000; Shen & Ho 2014; Marziani et al. 2018; Panda et al. 2019; Du & Wang 2019; Martínez-Aldama et al. 2021). Thus, the introduction of RFeII in the RBLR-L5100 relation, is able to account for the shorter time-lags and hence, smaller RBLR sizes for sources that show strong Fe ii emission.
4 Anisotropic emission from the disk - the missing ingredient?
Accounting for these shorter time lags for the observed AGNs needs advancement in our photoionization modelling setup, to account for the Eddington ratio dependence on the accretion disk emission and the changes it causes in the overall disk vertical structure, especially the regions very close to the last stable orbit around an accreting SMBH. Wang et al. (2014b) derived the analytical solutions (steady-state) for the structure of “slim” accretion disks from sub-Eddington accretion rates to extremely high, super-Eddington rates. They notice the appearance of a funnel-like structure very close - few gravitational radii from the SMBH (see Figure 3 in their paper) and attribute this change in the accretion disk structure to the high accretion rates that are realized from the solutions of the slim accretion disks wherein the structure of the geometrically thin, optically thick accretion disk as per the Shakura & Sunyaev (1973) prescription does not hold (Abramowicz et al. 1988; Sadowski 2011; Wang et al. 2014b). We show an illustration of this scenario in the right panel of Figure 2. Such modifications to the disk structure strongly affect the overall anisotropic emission of ionizing photons from the disk in addition to just inclination effects that arise due to the axisymmetric nature of these systems. Therefore, a viewing-angle-dependent anisotropy needs to be accounted for in the modelling at high accretion rates. If the gas clouds emitting the low-ionization lines are located not far from the disk plane, the lower disk luminosity (with respect to the one seen by an observer whose line-of-sight is almost coaxial with the disk axis) leads to the shrinking in the position of the line emitting BLR and brings the modelled location in agreement to the observed estimates from the reverberation mapping campaigns (see Panda 2020, for more details).
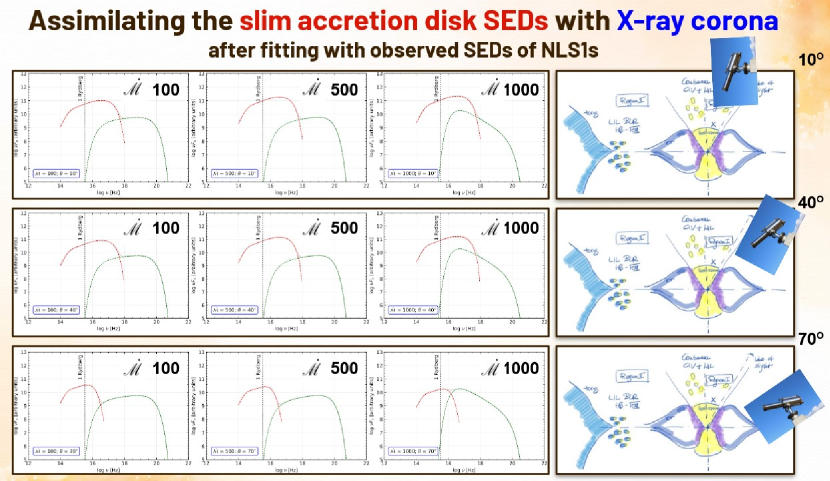
In our setup, we construct a database of composite SEDs which comprise two primary components - a slim accretion disk and a hot corona (shown using red and green curves in each of the panels of Figure 2). The normalization of these two components is characterized by the spectral index () - which is the ratio of the flux at 2 keV (from the hot corona) and flux at 2500Å (from the accretion disk). The exact estimate of this parameter and the overall slope of the two spectral components in our SEDs is set by matching the modelled composite SEDs viewed at 10∘ with observed SEDs from Ferland et al. (2020). For each observed SED case, we find the best representative composite SED from our models. The upper panels in Figure 2 show these best-fit modelled SEDs as a function of increasing dimensionless accretion rate (, see Wang et al. (2014a); Panda (2022) for an overview). In addition, we extend the modelled SEDs as a function of angle in order to quantify the effect of the viewing angle to the distant observer. In principle, we assume that the hot corona comes from an isotropically radiating source and hence is not affected by the change in the viewing angle, although the accretion disk component does change with the viewing angle. The illustration on the right panels in Figure 1 highlights this aspect of the anisotropy. The funnel-like structure leads to a preferential direction of the continuum radiation coming from the accretion disk, especially the photons that originate very close to the SMBH.
The high-ionization part of the BLR contains a set of lines that include Ly, C iii], C iv, He i, He ii, and N v emitted by a highly ionized region that has a relatively low density (1010 cm-3). Whereas, the low-ionization part of the BLR includes the bulk of the Balmer lines, Mg ii, Fe ii, O i and Ca ii, emitted by a mildly ionized medium having a much higher density (1010 cm-3).222Reverberation mapping estimates have shown that the two emitting regions have different distances from the SMBH - the high-ionization lines (HILs) are produced much closer to the SMBH while the low-ionization counterparts originate from a region that is relatively more distant (Grier et al. 2017; Lira et al. 2018; Homayouni et al. 2020; Kaspi et al. 2021). This result is in apparent contradiction with the scenario we suggest. This is not really the case: these results refer to Population B sources (Sulentic et al. 2000), which are accreting at modest rates. Recent studies (Panda 2020, 2022) have shown that the optimal emission from the LIL-part of the BLR requires a much lower radiation field, i.e., lower than expected photon flux that is incident on these emitting regions which is then able to recover the line equivalent widths (EWs) for the LILs. Also, this prescription has qualitatively shown that the location estimated for these emitting regions is then in agreement with the estimates derived from the reverberation mapping of the NLS1s. The overall effect suggests that the fraction of the photon flux originating from the accretion disk and corona that eventually is responsible for the line emission, in the LIL-part of the BLR, is a very small (1-10%). Although this is a step in the right direction, there is yet to have a full quantitative picture of the overall emission from the low- and high-ionization line emitting regions. Here, we further our investigation by accounting for the changes in the disk structure that can eventually lead to the development of a geometrically thick, funnel-like structure within a few 100 gravitational radii that can block a significant part of the incident radiation directed towards the LIL part. This funnel then leads to a preferential emission in a cone about the spin axis of the SMBH where the HILs can be produced.
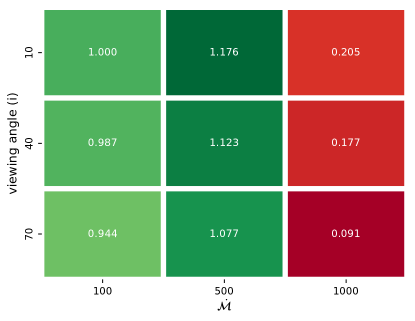
Coming back to Figure 2, we estimate the total ionizing flux in each of these composite SEDs shown as a function of the and viewing angle. The heatmap shown in Figure 3 highlights this aspect of the composite SEDs. The values in each grid mark the ratio of the photon flux (above 1 Rydberg) for a given case ( and viewing angle) with respect to the base case, i.e., the composite SED at =100 and viewing angle=10∘ (upper left panel in Figure 2). As we can gauge from this heatmap, for any given value of (100, 500, and 1000), the amount of ionizing photon flux available decreases with increasing viewing angle. Whereas, the trend with respect to increasing for a given viewing angle first rises (going from 100 to 500) and then falls off drastically (from 500 to 1000). The highest available ionizing photon flux is obtained for the case with = 500 viewed at 10∘. On the other hand, the lowest ionizing photon flux is recovered for the case with = 1000 viewed at 70∘.
5 Concluding Remarks
The inclusion of the anisotropic emission from a slim disk is therefore going qualitatively in the right direction: the HILs may be emitted in a funnel or at any rate in a region fully exposed to the ionizing continuum. On the converse, LILs might be exposed to a fainter continuum that requires a closer distance in order to compensate for the lower photon flux. At present, this is our working hypothesis. A more detailed analysis of the results from our photoionization modelling will be presented in a forthcoming work.
Acknowledgements.
SP acknowledges the Conselho Nacional de Desenvolvimento Científico e Tecnológico (CNPq) Fellowships 164753/2020-6 and 300936/2023-0. We are grateful to Prof. Jian-Min Wang for providing his slim disk SED models, and to Prof. Bożena Czerny for fruitful discussions.References
- Abramowicz et al. (1988) Abramowicz M. A., Czerny B., Lasota J. P., Szuszkiewicz E., 1988, The Astrophysical Journal, 332, 646
- Arnaud et al. (1985) Arnaud K. A., et al., 1985, Monthly Notices of the Royal Astronomical Society, 217, 105
- Baldwin et al. (2004) Baldwin J. A., Ferland G. J., Korista K. T., Hamann F., LaCluyzé A., 2004, The Astrophysical Journal, 615, 610
- Bentz et al. (2013) Bentz M. C., et al., 2013, The Astrophysical Journal, 767, 149
- Blandford & McKee (1982) Blandford R. D., McKee C. F., 1982, The Astrophysical Journal, 255, 419
- Boroson & Green (1992) Boroson T. A., Green R. F., 1992, The Astrophysical Journal Supplements, 80, 109
- Collinson (2016) Collinson J. S., 2016, PhD thesis, Durham University, UK
- Du & Wang (2019) Du P., Wang J.-M., 2019, The Astrophysical Journal, 886, 42
- Du et al. (2014) Du P., et al., 2014, The Astrophysical Journal, 782, 45
- Du et al. (2015) Du P., et al., 2015, The Astrophysical Journal, 806, 22
- Du et al. (2016) Du P., et al., 2016, The Astrophysical Journal, 825, 126
- Du et al. (2018) Du P., et al., 2018, The Astrophysical Journal, 856, 6
- Elvis et al. (1994) Elvis M., et al., 1994, The Astrophysical Journal Supplements, 95, 1
- Ferland et al. (2020) Ferland G. J., Done C., Jin C., Landt H., Ward M. J., 2020, Monthly Notices of the Royal Astronomical Society, 494, 5917
- Goodrich (1989) Goodrich R. W., 1989, The Astrophysical Journal, 342, 224
- Greenstein & Schmidt (1964) Greenstein J. L., Schmidt M., 1964, The Astrophysical Journal, 140, 1
- Grier et al. (2017) Grier C. J., et al., 2017, The Astrophysical Journal, 851, 21
- Homayouni et al. (2020) Homayouni Y., et al., 2020, ApJ, 901, 55
- Hu et al. (2015) Hu C., et al., 2015, The Astrophysical Journal, 804, 138
- Jin et al. (2012a) Jin C., Ward M., Done C., Gelbord J., 2012a, Monthly Notices of the Royal Astronomical Society, 420, 1825
- Jin et al. (2012b) Jin C., Ward M., Done C., 2012b, Monthly Notices of the Royal Astronomical Society, 422, 3268
- Kaspi et al. (2000) Kaspi S., Smith P. S., Netzer H., Maoz D., Jannuzi B. T., Giveon U., 2000, The Astrophysical Journal, 533, 631
- Kaspi et al. (2021) Kaspi S., Brandt W. N., Maoz D., Netzer H., Schneider D. P., Shemmer O., Grier C. J., 2021, ApJ, 915, 129
- Kubota & Done (2018) Kubota A., Done C., 2018, Monthly Notices of the Royal Astronomical Society, 480, 1247
- Laor et al. (1997) Laor A., Fiore F., Elvis M., Wilkes B. J., McDowell J. C., 1997, The Astrophysical Journal, 477, 93
- Lira et al. (2018) Lira P., et al., 2018, ApJ, 865, 56
- Lynden-Bell (1969) Lynden-Bell D., 1969, Nature, 223, 690
- Martínez-Aldama et al. (2019) Martínez-Aldama M. L., Czerny B., Kawka D., Karas V., Panda S., Zajaček M., Życki P. T., 2019, The Astrophysical Journal, 883, 170
- Martínez-Aldama et al. (2021) Martínez-Aldama M. L., Panda S., Czerny B., Marinello M., Marziani P., Dultzin D., 2021, The Astrophysical Journal, 918, 29
- Marziani & Sulentic (2014) Marziani P., Sulentic J. W., 2014, Monthly Notices of the Royal Astronomical Society, 442, 1211
- Marziani et al. (2009) Marziani P., Sulentic J. W., Stirpe G. M., Zamfir S., Calvani M., 2009, A&Ap, 495, 83
- Marziani et al. (2018) Marziani P., et al., 2018, Frontiers in Astronomy and Space Sciences, 5, 6
- Netzer (2015) Netzer H., 2015, Annual Review of Astronomy and Astrophysics, 53, 365
- Osterbrock & Ferland (2006) Osterbrock D. E., Ferland G. J., 2006, Astrophysics of gaseous nebulae and active galactic nuclei
- Osterbrock & Pogge (1985) Osterbrock D. E., Pogge R. W., 1985, The Astrophysical Journal, 297, 166
- Panda (2020) Panda S., 2020, arXiv e-prints, p. arXiv:2004.13113
- Panda (2022) Panda S., 2022, Frontiers in Astronomy and Space Sciences, 9, 850409
- Panda & Marziani (2022) Panda S., Marziani P., 2022, arXiv e-prints, p. arXiv:2210.15041
- Panda et al. (2019) Panda S., Marziani P., Czerny B., 2019, The Astrophysical Journal, 882, 79
- Peterson (1993) Peterson B. M., 1993, Publications of the Astronomical Society of the Pacific, 105, 247
- Peterson et al. (2004) Peterson B. M., et al., 2004, The Astrophysical Journal, 613, 682
- Phillips (1978) Phillips M. M., 1978, The Astrophysical Journal Supplements, 38, 187
- Rakshit et al. (2020) Rakshit S., Stalin C. S., Kotilainen J., 2020, ApJS, 249, 17
- Richards et al. (2006) Richards G. T., et al., 2006, The Astrophysical Journal Supplements, 166, 470
- Sadowski (2011) Sadowski A., 2011, arXiv e-prints, p. arXiv:1108.0396
- Schmidt (1963) Schmidt M., 1963, Nature, 197, 1040
- Schmidt & Green (1983) Schmidt M., Green R. F., 1983, The Astrophysical Journal, 269, 352
- Shakura & Sunyaev (1973) Shakura N. I., Sunyaev R. A., 1973, Astronomy and Astrophysics, 24, 337
- Shen & Ho (2014) Shen Y., Ho L. C., 2014, Nature, 513, 210
- Shen et al. (2011) Shen Y., et al., 2011, The Astrophysical Journal Supplements, 194, 45
- Shen et al. (2019) Shen Y., et al., 2019, The Astrophysical Journal Supplements, 241, 34
- Sigut & Pradhan (2003) Sigut T. A. A., Pradhan A. K., 2003, The Astrophysical Journal Supplements, 145, 15
- Sigut et al. (2004) Sigut T. A. A., Pradhan A. K., Nahar S. N., 2004, The Astrophysical Journal, 611, 81
- Sulentic et al. (2000) Sulentic J. W., Marziani P., Dultzin-Hacyan D., 2000, Annual Review of Astronomy and Astrophysics, 38, 521
- Verner et al. (1999) Verner E. M., Verner D. A., Korista K. T., Ferguson J. W., Hamann F., Ferland G. J., 1999, The Astrophysical Journal Supplements, 120, 101
- Wang et al. (2014a) Wang J.-M., et al., 2014a, The Astrophysical Journal, 793, 108
- Wang et al. (2014b) Wang J.-M., Qiu J., Du P., Ho L. C., 2014b, The Astrophysical Journal, 797, 65
- Wills et al. (1985) Wills B. J., Netzer H., Wills D., 1985, The Astrophysical Journal, 288, 94
- Zhou et al. (2006) Zhou H., Wang T., Yuan W., Lu H., Dong X., Wang J., Lu Y., 2006, ApJS, 166, 128