A machine-learning sleep-wake classification model using a reduced number of features derived from photoplethysmography and activity signals
Abstract
Sleep is a crucial aspect of our overall health and well-being. It plays a vital role in regulating our mental and physical health, impacting our mood, memory, and cognitive function to our physical resilience and immune system. The classification of sleep stages is a mandatory step to assess sleep quality, providing the metrics to estimate the quality of sleep and how well our body is functioning during this essential period of rest. Photoplethysmography (PPG) has been demonstrated to be an effective signal for sleep stage inference, meaning it can be used on its own or in a combination with others signals to determine sleep stage. This information is valuable in identifying potential sleep issues and developing strategies to improve sleep quality and overall health. In this work, we present a machine learning sleep-wake classification model based on the eXtreme Gradient Boosting (XGBoost) algorithm and features extracted from PPG signal and activity counts. The performance of our method was comparable to current state-of-the-art methods with a Sensitivity of 91.15 1.16%, Specificity of 53.66 1.12%, F1-score of 83.88 0.56%, and Kappa of 48.0 0.86%. Our method offers a significant improvement over other approaches as it uses a reduced number of features, making it suitable for implementation in wearable devices that have limited computational power.
Keywords PPG signal Wearable devices Sleep stage Sleep-wake classification.
1 Introduction
Sleep plays a vital role in maintaining good health for individuals of all ages Ramar et al. (2021). Inadequate sleep of poor quality or duration can lead to a host of chronic health problems, including cardiovascular diseases, diabetes, and obesity Hoevenaar-Blom et al. (2011) Knutson and Van Cauter (2008) Rahe et al. (2015). Moreover, sleep disorders are on the rise and have been linked to a decrease in Gross Domestic Product (GDP) in some countries Hillman et al. (2006) Streatfeild et al. (2021). These highlight the importance of ensuring that individuals get adequate and high-quality sleep to maintain their health and well-being.
Polysomnography (PSG) is the gold standard exam for evaluating human sleep Krystal and Edinger (2008). The exam involves the simultaneous recording of multiple electrophysiological signals during sleep, such as Electrocardiogram (ECG), Photoplethysmography (PPG), Electroencephalogram (EEG), Electromyogram (EMG), etc. Rundo and Downey III (2019). After registration, a specialist analyzes the recorded signals and labels different sleep stages based on time windows of 30 s. Nevertheless, PSG is an expensive and time-consuming procedure and can also suffer from labeling errors by the specialist. Additionally, PSG exams are performed in an unfamiliar environment, with multiple electrodes attached, which can affect sleep quality.
With the rise of wearable devices, it is now possible to track several physiological signals, such as heart rate and blood oxygen levels, more cost-effectively and conveniently Prieto-Avalos et al. (2022). Wearable devices are increasingly being used to track and evaluate sleep patterns by capturing PPG signals, raw triaxis accelerometer signal (ACC), and activity-based signals like Activity (ACT). PPG measures changes in the blood volume of vascular tissues, allowing measurements of vital parameters, such as heart rate, respiration rate, arterial oxygen saturation, and blood pressure Mejía-Mejía et al. (2022). On the other hand, the ACT is derived from the ACC signal processing and provides an estimation of rest and wakefulness periods to assess sleep patterns Banfi et al. (2021). Besides the advantage of collecting different signals in the same device, the compact hardware of wearable devices ensures minimal discomfort and does not impact the quality of sleep.
Sleep consists of two main stages: rapid eye movement (REM) and non-rapid eye movement (NREM). According to the guidelines provided by the American Academy of Sleep Medicine (AASM) Iber (2007); Berry et al. (2012), sleep stages can be classified into five distinct categories: (i) wakefulness (W), (ii) non-REM stage 1 (N1), (iii) non-REM stage 2 (N2), (iv) non-REM stage 3 (N3), and (v) REM stage (R). Accurately identifying and categorizing sleep stages is essential for effectively monitoring sleep patterns. However, by establishing only an accurate and reliable classification for sleep-wake stages, it is possible to obtain data to calculate important sleep quality metrics, such as: total sleep time; total wake time; sleep latency, that is the amount of time between the beginning of bedtime to actually falling asleep; sleep efficiency, calculated as total sleep time divided by total amount of time in bed; and wakefulness after sleep onset (WASO), measured as total time of wakefulness after sleep onset. Shrivastava et al. (2014)
While wearable devices cannot directly measure brain activity like EEG devices used in sleep stage analysis , they can capture PPG signals, which can be utilized to estimate Heart Rate (HR) Mejía-Mejía et al. (2022). HR is known to decrease during the transition from wakefulness to non-REM stages Silvani (2008). Additionally, there are indications that HR exhibits a slight decrease during the transition from non-REM to REM sleep stages Silvani (2008); Habib et al. (2023). Therefore, we hypothesize that only using the information of the HR and the Heart Rate Variability (HRV), extracted from the PPG signals, along with the ACT, derived from the ACC signals, is possible to accurately classify sleep and wake stages.
Recent works in the field of sleep-wake classification proposed to use both PPG and/or ACC signals. Most of them are based on features extracted of these signals. Table 1 displays a summary of the state-of-the-art on this topic. Fonseca et al. (2017) used a Bayesian Classifier to predict sleep-wake stages based on a set of HRV features computed from interbeat intervals obtained from PPG signals along with measures from ACC. Likewise, Eyal and Baharav (2017) used a similar approach as Fonseca et al. (2017), without the measures from ACC. Uçar et al. (2018) proposed to use k-Nearest Neighbors (KNN) and Support Vector Machine (SVM) algorithms based on PPG and HRV features. Palotti et al. (2019) compared a cohort of classification algorithms to perform the sleep-wake classification based on classic machine learning or deep learning techniques using only ACC signals. Likewise, Banfi et al. (2021) proposed to use only raw ACC signals using Convolutional Neural Networks (CNN) for this binary classification. Habib et al. (2023) proposed a CNN derived from PPG raw signals of 10 subjects with sleep-disordered breathing, using a leave-one-out strategy on the sleep-wake classification with data augmentation. Motin et al. (2023) used the same dataset as Habib et al. (2023), extracting 72 features from the PPG signals, instead of using the raw PPG, using three different classifiers, KNN, SVM and a Random Forest (RF).
| Accuracy | Sensitivity | Specificity | F1-score | Kappa | Dataset | Method | |||
|---|---|---|---|---|---|---|---|---|---|
| Fonseca et al. (2017) | 91.5 5.1 | 58.2 17.3 | 92.9 2.0 | - | 0.55 0.14 | Private (s = 101) |
|
||
| Eyal and Baharav (2017) | 84.3 | 38.1 | 91.7 | - | 0.31 | Private (s = 88) |
|
||
| Uçar et al. (2018) | 79.23 | 78.0 | 80.0 | 79.0 | 0.58 | Private (s = 10) |
|
||
| Uçar et al. (2018) | 79.36 | 77.0 | 81.0 | 79.0 | 0.59 | Private (s = 10) |
|
||
| Palotti et al. (2019) | 81.8 1.0 | 90.40 1.20 | 68.10 1.90 | 84.30 1.10 | - | MESA (s = 1,817) |
|
||
| Palotti et al. (2019) | 83.1 1.0 | 91.40 1.10 | 69.90 2.00 | 85.50 1.00 | - | MESA (s = 1,817) |
|
||
| Motin et al. (2019) | 72.36 | 70.64 | 74.22 | - | - | Private (s = 5) |
|
||
| Motin et al. (2020) | 81.10 | 81.06 | 82.50 | 81.74 | - | Private (s = 10) |
|
||
| Banfi et al. (2021) | - | 89.20 | 92.0 | 90.9 | 0.782 | Private (s = 81) |
|
||
| Habib et al. (2023) | 94.18 11.95 | 94.4 | - | 93.05 13.77 | 0.864 0.265 | Private (s = 10) |
|
||
| Motin et al. (2023) | 83.75 0.85 | 87.79 1.10 | 73.63 2.45 | 80.01 1.88 | - | Private (s = 10) |
|
||
| Motin et al. (2023) | 84.66 0.99 | 87.41 1.24 | 77.79 0.93 | 82.32 0.90 | - | Private (s = 10) |
|
||
| Motin et al. (2023) | 85.22 0.62 | 87.86 1.48 | 77.67 3.26 | 82.45 1.62 | - | Private (s = 10) |
|
In this work we present a method to classify sleep and wake stages, comparing the results of three commonly used machine learning techniques: Logistic Regression (LR), Random Forest (RF), and the eXtreme Gradient Boosting (XGBoost). These algorithm are based on features extracted from PPG and ACT signals with a reduced number of features for deployment feasibility on wearable devices. Additionally, a stratified analysis was conducted considering age and gender factors. Our method demonstrates advancement over existing approaches by reducing the feature set, thereby enabling implementation on computational-constrained wearable devices.
2 Materials and Methods
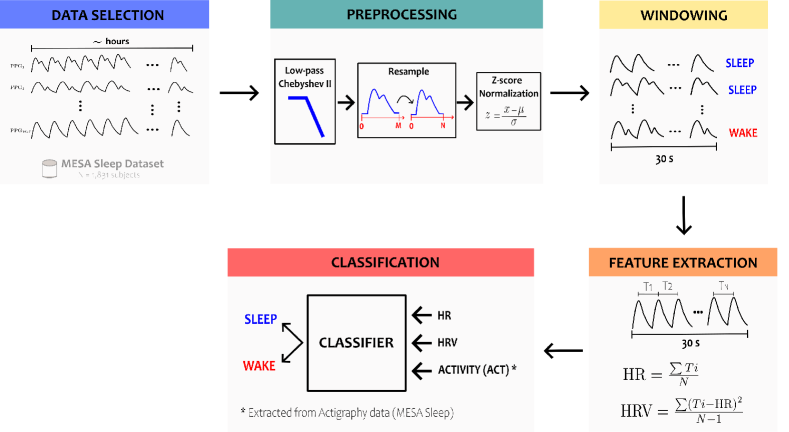
The proposed approach comprises five sequential steps: Data selection, Preprocessing, Windowing, Feature Extraction, and Classification. To begin, we describe the data utilized, specifically selecting subjects with both ACT and PPG signals. We merge the sleep stages to generate a Wake and Sleep dataset, forming the foundation for subsequent analysis. Subsequently, we present the preprocessing and windowing procedures, detailing how the data is prepared for further processing. Additionally, we outline the feature extraction process. Furthermore, we describe our employed classifiers, providing information on our experimental setup. A flow diagram summarizing these steps is shown in Fig. 1.
2.1 Data Selection
The experiments were carried out on the MESA Sleep dataset, a subset of the Multi-Ethnic Study of Atherosclerosis (MESA) dataset Zhang et al. (2018) Chen et al. (2015). The MESA Sleep dataset contains data collected from 2,237 subjects, including overnight Polysomnography exams along with their corresponding PPG signals, 7-day wrist-worn Actigraphy signals, sleep stage labels for every 30 s windows, and sleep questionnaires. For this study, only patients with both ACT and PPG signals were used, resulting in 1,831 patients. The metadata information about the employed dataset is shown in Table 2.
| Parameter | Value |
|---|---|
| Subjects | |
| with PSG | |
| with actigraphy | |
| with PSG and actigraphy | |
| Age | |
| Male subjects |
This dataset provides sleep stage labels for every 30 s window. The labeling process followed the AASM guidelines, which suggest five sleep stage classes, as aforementioned: (i) wake (W), (ii) non-REM-1 (N1), (iii) non-REM-2 (N2), (iv) non-REM-3 (N3), and (v) REM (R) Iber (2007). Since our goal is to detect only sleep or wake stages, classes (ii), (iii), (iv), and (v) were grouped into class “sleep” (S). For every 30 s window, the PPG signal was sampled at 256 Hz, and the corresponding ACT registered.
2.2 Preprocessing
We used the same preprocessing steps proposed by Kotzen et al. (2022)in this study. The PPG data was filtered using a low-pass 8th-order Chebyshev Type II filter at 8 Hz, followed by downsampling from 256 Hz to 34 Hz using linear interpolation. Outlier values greater than or less than three standard deviations from the mean were clipped, and the data was normalized using z-score normalization.
2.3 Windowing
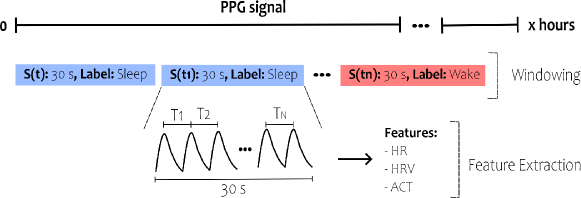
We partitioned the PPG signals into non-overlapping 30-second windows, as the PSG exam provides a sleep stage label for every 30 seconds of recording time. Due to the inherent variable recording lengths for each subject in the MESA Sleep dataset, the number of windows differed among subjects. Figure 2 illustrates the windowing extraction step applied to the PPG signal of a single subject.
2.4 Feature Extraction
Heart Rate (HR) and Heart Rate Variability (HRV) are widely recognized as important features associated with sleep stages and disorders, being both regulated by the sympathetic and parasympathetic nervous systems Stein and Pu (2012). HR was calculated for every window by taking the mean time difference between peaks, which were detected using the method proposed in Bishop and Ercole (2018). HRV was calculated as the standard deviation of the time difference between the peaks. Windows with HR greater than 180 beats per minute or HRV outside of two standard deviations from the mean HRV of the entire dataset were discharged. As consequence, all samples from four participants were excluded in this phase, resulting in subjects. Our model also used as input the activity value provided by the MESA-sleep acquired with the Actiware-Sleep version 5.59 analysis software (Mini-Mitter Co, Inc, Bend, OR).
Therefore, for each subject (), the features collected in each window were arranged as
| (1) |
where is the number of subjects, is the number of features (), and is the number of windows for each subject. Overall, we have a total of 2,050,280 windows: 63.93% (1,310,690) are labeled as sleep and the remaining 36.07% (739,590) as wake.
2.5 Classification
Our sleep-wake classification was performed using three commonly used machine learning techniques: Logistic Regression (LR) Stoltzfus (2011), Random Forest (RF) Breiman (2001) and eXtreme Gradient Boosting (XGBoost) Chen and Guestrin (2016). A 10-fold cross-validation approach was employed to prevent bias in the training and testing split, with samples from the same patient grouped in the same fold to avoid intra-patient bias. The results were compared with the sleep-wake classification provided by the actigraphy used in the MESA Sleep study and with a similar study using the same dataset Palotti et al. (2019). Additionally, the results were compared with other similar studies.
The results with the proposed approach were compared to the literature by using four different evaluation metrics commonly used in sleep-wake classification studies: Accuracy (Ac), Sensitivity (Se), Specificity (Sp), F1-score, and Cohen’s Kappa Coefficient (Kappa). These metrics were used to quantify the accuracy and agreement of the sleep-wake classification results.
Experiments were performed using a Foxconn HPC M100-NHI with an 8-GPU cluster of NVIDIA Tesla V100 16GB cards. The model was implemented in Python (3.8.10) with the support of the libraries scikit-learn (1.1.3), XGBoost (1.6.1), and scipy (1.8.1).
3 Results
Table 3 summarizes the overall performance of the proposed methods for the sleep-wake classification task. Our algorithm that best performed (XGBoost) achieved Ac, Se, Spe, F1-score, and Kappa of , , , and , respectively. Additionally, we used the same metrics to evaluate the classification provided by the actigraphy used in the MESA Sleep dataset as baseline. It obtained Se, Spe, F1-score, and Kappa of 50.49%, 94.75%, 64.08%, and 0.478, respectively.
| Accuracy | Sensitivity | Specificity | F1-score | Kappa | |
|---|---|---|---|---|---|
| XGBoost | 77.62 0.56 | 91.14 1.15 | 53.66 1.11 | 83.88 0.56 | 0.480 0.008 |
| Logistic Regression | 74.62 0.66 | 96.46 0.33 | 35.91 0.88 | 82.92 0.55 | 0.370 0.009 |
| Random Forest | 73.80 0.48 | 83.68 0.93 | 56.30 0.76 | 80.32 0.54 | 0.413 0.007 |
| MESA Actigraphy | - | 50.49 | 94.75 | 64.08 | 0.478 |
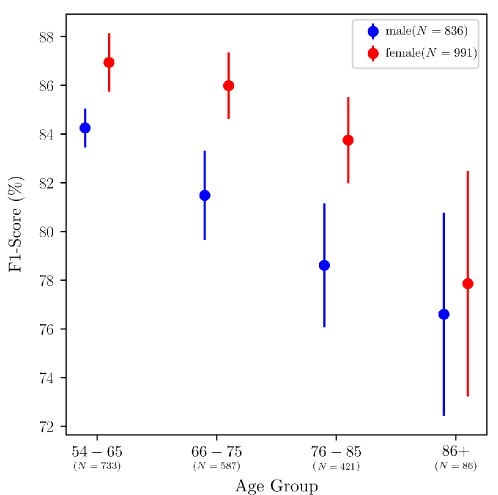
To assess possible biases in our method, we also performed a stratified analysis of our obtained results by age and gender. In Fig. 3, we show the obtained F1-score of our approach in four age groups (54 – 65, 66 – 75, 76 – 85, and 86+) and two gender groups (male and female).
4 Discussion
We developed a methodology with results comparable to the state-of-the-art while maintaining low complexity. Our approach used only three features: two obtained from the peak-to-peak interval from the photoplethysmography signal and one from the actigraph value. The peak-to-peak derived features were extracted even in adverse acquisition scenarios and the actigraph value was easily extracted from the accelerometer. This is a major advantage compared to other reports that extract a complex set of features that can be compromised in noisy acquisitions. As shown in Table 3, apart from the Spe, our proposed method achieved higher metric values than the MESA Sleep actigraphy. This shows the gain of using PPG-derived physiological measures (HR and HRV).
Compared to the best method from Palotti et al. (2019), which also used the MESA Sleep dataset, we obtained comparable Se ( vs ) and F1-score ( vs ); however, the Spe value is lower ( vs ). The lower Spe might be due to the imbalance between the classes. Adopting a proper strategy for dealing with unbalanced data might improve the observed results and need further investigation.
It is not possible to make a direct comparison with other works, since all of them are based on private datasets. Motin et al. (2023) achieved comparable results as ours in terms of F1-score (see Table 1), however, they didn’t used ACC signals and used a much larger set of PPG features than us. Moreover, their work are based only on 10 distinct subjects. Even though their results are promising, this reduced number of subjects may lead to limited generalizability, along with biased learning since there is a high interdependence among intra-subject heartbeats de Chazal et al. (2004); Costa et al. (2023). Likewise, Habib et al. (2023) used a limited number of subjects, and employed a CNN on PPG raw signal, achieving the best F1-score to date, to the best of our knowledge. On the other hand, Banfi et al. (2021) also achieved F1-score higher than 90% by using only raw ACC signals, but they also have a limited number of subjects. However, these deep learning approaches usually requires lots of data for training, computational resources, are more complex than traditional machine learning models and often have many hyperparameters.
In the stratified analysis shown in Fig. 3, the F1-score progressively decreases with age. Also, there was consistently better mean F1-score for females than for males, despite an increase in the standard deviation for both genders. This indicates that the reduction in the number of older patients affects both genders similarly. However, the cause of the higher mean F1-score for females cannot be determined based on the available data, as it could be due to a larger sample size or physiological differences between genders. Further research may be necessary to determine the underlying reasons for these results.
Furthermore, it was aforementioned that deep learning models could be cumbersome for deployment in wearable devices. However, the computational resource needed depends on a set of parameters that should be investigated. Thus, future works should address this by comparing the performance and computational resources of different models. Likewise, future works should also be done on external datasets to validate the generalizability of our proposed method.
Finally, the validation of wearable sleep monitoring devices would reduce the cost of sleep disorder compared to traditional polysomnography exams. This requires reliable and practical sleep stages prediction models easy to implement and capable of being integrated into commercial devices in line with the reported findings.
5 Conclusion
We provided evidence for a simple method to classify sleep-wake states using only three features: HR, HRV, and ACT. Our method showed comparable results with more complex methods and superior results than using only the ACT measured by an actigraph, which is currently the wearable device of choice for sleep monitoring.
References
- Ramar et al. [2021] Kannan Ramar, Raman K Malhotra, Kelly A Carden, Jennifer L Martin, Fariha Abbasi-Feinberg, R Nisha Aurora, Vishesh K Kapur, Eric J Olson, Carol L Rosen, James A Rowley, et al. Sleep is essential to health: an american academy of sleep medicine position statement. Journal of Clinical Sleep Medicine, 17(10):2115–2119, 2021.
- Hoevenaar-Blom et al. [2011] Marieke P Hoevenaar-Blom, Annemieke MW Spijkerman, Daan Kromhout, Julia F van den Berg, and WM3198203 Verschuren. Sleep duration and sleep quality in relation to 12-year cardiovascular disease incidence: the morgen study. Sleep, 34(11):1487–1492, 2011.
- Knutson and Van Cauter [2008] Kristen L Knutson and Eve Van Cauter. Associations between sleep loss and increased risk of obesity and diabetes. Annals of the New York Academy of Sciences, 1129(1):287–304, 2008.
- Rahe et al. [2015] Corinna Rahe, Maria Eszter Czira, Henning Teismann, and Klaus Berger. Associations between poor sleep quality and different measures of obesity. Sleep medicine, 16(10):1225–1228, 2015.
- Hillman et al. [2006] David R Hillman, Anita Scott Murphy, Ral Antic, and Lynne Pezzullo. The economic cost of sleep disorders. Sleep, 29(3):299–305, 2006.
- Streatfeild et al. [2021] Jared Streatfeild, Jackson Smith, Darren Mansfield, Lynne Pezzullo, and David Hillman. The social and economic cost of sleep disorders. Sleep, 44(11):zsab132, 2021.
- Krystal and Edinger [2008] Andrew D. Krystal and Jack D. Edinger. Measuring sleep quality. Sleep Medicine, 9:S10–S17, 2008. ISSN 1389-9457. doi:10.1016/S1389-9457(08)70011-X. The Art of Good Sleep Proceedings from the 5th International Sleep Disorders Forum: Novel Outcome Measures of Sleep, Sleep Loss and Insomnia.
- Rundo and Downey III [2019] Jessica Vensel Rundo and Ralph Downey III. Polysomnography. Handbook of clinical neurology, 160:381–392, 2019.
- Prieto-Avalos et al. [2022] Guillermo Prieto-Avalos, Nancy Aracely Cruz-Ramos, Giner Alor-Hernández, José Luis Sánchez-Cervantes, Lisbeth Rodríguez-Mazahua, and Luis Rolando Guarneros-Nolasco. Wearable devices for physical monitoring of heart: A review. Biosensors, 12(5):292, 2022.
- Mejía-Mejía et al. [2022] Elisa Mejía-Mejía, John Allen, Karthik Budidha, Chadi El-Hajj, Panicos A. Kyriacou, and Peter H. Charlton. 4 - photoplethysmography signal processing and synthesis. In John Allen and Panicos Kyriacou, editors, Photoplethysmography, pages 69–146. Academic Press, 2022. ISBN 978-0-12-823374-0. doi:10.1016/B978-0-12-823374-0.00015-3.
- Banfi et al. [2021] Tommaso Banfi, Nicolò Valigi, Marco di Galante, Paola d’Ascanio, Gastone Ciuti, and Ugo Faraguna. Efficient embedded sleep wake classification for open-source actigraphy. Scientific reports, 11(1):1–12, 2021.
- Iber [2007] Conrad Iber. The aasm manual for the scoring of sleep and associated events: rules, terminology, and technical specification. (No Title), 2007.
- Berry et al. [2012] RB Berry, R Budhiraja, DJ Gottlieb, D Gozal, C Iber, VK Kapur, CL Marcus, R Mehra, S Parthasarathy, SF Quan, S Redline, KP Strohl, Ward SL Davidson, and MM Tangredi. Rules for scoring respiratory events in sleep: update of the 2007 aasm manual for the scoring of sleep and associated events. deliberations of the sleep apnea definitions task force of the american academy of sleep medicine. J Clin Sleep Med, 8(5):597–619, 2012. doi:10.5664/jcsm.2172.
- Shrivastava et al. [2014] Deepak Shrivastava, Syung Jung, Mohsen Saadat, Roopa Sirohi, and Keri Crewson. How to interpret the results of a sleep study. Journal of community hospital internal medicine perspectives, 4(5):24983, 2014.
- Silvani [2008] Alessandro Silvani. Physiological sleep-dependent changes in arterial blood pressure: Central autonomic commands and baroreflex control. Clinical and Experimental Pharmacology and Physiology, 35(9):987–994, 2008. doi:10.1111/j.1440-1681.2008.04985.x.
- Habib et al. [2023] Ahsan Habib, Mohammod Abdul Motin, Thomas Penzel, Marimuthu Palaniswami, John Yearwood, and Chandan Karmakar. Performance of a convolutional neural network derived from ppg signal in classifying sleep stages. IEEE Transactions on Biomedical Engineering, 70(6):1717–1728, 2023. doi:10.1109/TBME.2022.3219863.
- Fonseca et al. [2017] Pedro Fonseca, Tim Weysen, Maaike S. Goelema, Els I.S. Møst, Mustafa Radha, Charlotte Lunsingh Scheurleer, Leonie van den Heuvel, and Ronald M. Aarts. Validation of Photoplethysmography-Based Sleep Staging Compared With Polysomnography in Healthy Middle-Aged Adults. Sleep, 40(7):zsx097, 06 2017. doi:10.1093/sleep/zsx097.
- Eyal and Baharav [2017] Shuli Eyal and Anda Baharav. Sleep insights from the finger tip: How photoplethysmography can help quantify sleep. In 2017 Computing in Cardiology (CinC), pages 1–4, 2017. doi:10.22489/CinC.2017.274-197.
- Uçar et al. [2018] Muhammed Kursad Uçar, Mehmet Recep Bozkurt, Cahit Bilgin, and Kemal Polat. Automatic sleep staging in obstructive sleep apnea patients using photoplethysmography, heart rate variability signal and machine learning techniques. Neural Computing and Applications, 29:1–16, 2018. doi:10.1007/s00521-016-2365-x.
- Palotti et al. [2019] Joao Palotti, Raghvendra Mall, Michael Aupetit, Michael Rueschman, Meghna Singh, Aarti Sathyanarayana, Shahrad Taheri, and Luis Fernandez-Luque. Benchmark on a large cohort for sleep-wake classification with machine learning techniques. NPJ digital medicine, 2(1):1–9, 2019.
- Motin et al. [2023] Mohammod Abdul Motin, Chandan Karmakar, Marimuthu Palaniswami, Thomas Penzel, and Dinesh Kumar. Multi-stage sleep classification using photoplethysmographic sensor. Royal Society Open Science, 10(4):221517, 2023. doi:10.1098/rsos.221517.
- Motin et al. [2019] Mohammod Abdul Motin, Chandan Kumar Karmakar, Thomas Penzel, and Marimuthu Palaniswami. Sleep-wake classification using statistical features extracted from photoplethysmographic signals. In 2019 41st Annual International Conference of the IEEE Engineering in Medicine and Biology Society (EMBC), pages 5564–5567. IEEE, 2019.
- Motin et al. [2020] Mohammod Abdul Motin, Chandan Karmakar, Marimuthu Palaniswami, and Thomas Penzel. Photoplethysmographic-based automated sleep–wake classification using a support vector machine. Physiol. Meas., 41:075013, 2020. doi:10.1088/1361-6579/ab9482.
- Zhang et al. [2018] Guo-Qiang Zhang, Licong Cui, Remo Mueller, Shiqiang Tao, Matthew Kim, Michael Rueschman, Sara Mariani, Daniel Mobley, and Susan Redline. The national sleep research resource: towards a sleep data commons. Journal of the American Medical Informatics Association, 25(10):1351–1358, 2018.
- Chen et al. [2015] Xiaoli Chen, Rui Wang, Phyllis Zee, Pamela L Lutsey, Sogol Javaheri, Carmela Alcántara, Chandra L Jackson, Michelle A Williams, and Susan Redline. Racial/ethnic differences in sleep disturbances: the multi-ethnic study of atherosclerosis (mesa). Sleep, 38(6):877–888, 2015.
- Kotzen et al. [2022] Kevin Kotzen, Peter H Charlton, Sharon Salabi, Lea Amar, Amir Landesberg, and Joachim A Behar. Sleepppg-net: a deep learning algorithm for robust sleep staging from continuous photoplethysmography. IEEE Journal of Biomedical and Health Informatics, 2022.
- Stein and Pu [2012] Phyllis K. Stein and Yachuan Pu. Heart rate variability, sleep and sleep disorders. Sleep Medicine Reviews, 16(1):47–66, 2012. ISSN 1087-0792. doi:10.1016/j.smrv.2011.02.005.
- Bishop and Ercole [2018] Steven M Bishop and Ari Ercole. Multi-scale peak and trough detection optimised for periodic and quasi-periodic neuroscience data. In Intracranial Pressure & Neuromonitoring XVI, pages 189–195. Springer, 2018.
- Stoltzfus [2011] Jill C. Stoltzfus. Logistic regression: A brief primer. Academic Emergency Medicine, 18(10):1099–1104, 2011. doi:10.1111/j.1553-2712.2011.01185.x.
- Breiman [2001] Leo Breiman. Random forests. Machine Learning, 45:5–32, 2001. doi:10.1023/A:1010933404324.
- Chen and Guestrin [2016] Tianqi Chen and Carlos Guestrin. XGBoost. In Proceedings of the 22nd ACM SIGKDD International Conference on Knowledge Discovery and Data Mining. ACM, aug 2016. doi:10.1145/2939672.2939785.
- de Chazal et al. [2004] Philip de Chazal, M. O’Dwyer, and R.B. Reilly. Automatic classification of heartbeats using ecg morphology and heartbeat interval features. IEEE Transactions on Biomedical Engineering, 51(7):1196–1206, 2004. doi:10.1109/TBME.2004.827359.
- Costa et al. [2023] Thiago Bulhões Da Silva Costa, Felipe Meneguitti Dias, Diego Armando Cardona Cardenas, Marcelo Arruda Fiuza De Toledo, Daniel Mário De Lima, Jose Eduardo Krieger, and Marco Antonio Gutierrez. Blood pressure estimation from photoplethysmography by considering intra- and inter-subject variabilities: Guidelines for a fair assessment. IEEE Access, 11:57934–57950, 2023. doi:10.1109/ACCESS.2023.3284458.