0 \vgtccategoryResearch \vgtcinsertpkg
Robust Localization with Visual-Inertial Odometry Constraints for Markerless Mobile AR
Abstract
Visual Inertial Odometry (VIO) is an essential component of modern Augmented Reality (AR) applications. However, VIO only tracks the relative pose of the device, leading to drift. Absolute pose estimation methods infer the device’s absolute pose, but their accuracy depends on the input quality. This paper introduces VIO-APR, a new framework for markerless mobile AR that combines an absolute pose regressor (APR) with a local VIO tracking system. VIO-APR uses VIO to assess the reliability of the APR and the APR to identify and compensate for VIO drift. This feedback loop results in more accurate positioning and more stable AR experiences. To evaluate VIO-APR, we created a dataset that combines camera images with ARKit’s VIO system output for six indoor and outdoor scenes of various scales. Over this dataset, VIO-APR improves the median accuracy of popular APR by up to 36% in position and 29% in orientation, increases the percentage of frames in the high () accuracy level by up to 112% and greatly reduces the percentage of frames predicted below the low () accuracy level. We implement VIO-APR into a mobile AR application using Unity to demonstrate its capabilities. VIO-APR results in fast inference (<100ms) with a noticeably more accurate and stable overall experience.
Visual LocalizationCamera pose regressionVisual-Inertial OdometryVisual positioning system; \CCScatTwelveComputer VisionAugmented Reality
1 Introduction
Augmented reality (AR) applications increasingly rely on visual-inertial odometry (VIO) to track the device’s position and orientation. However, VIO systems can only track the device’s pose in a local coordinate system and do not provide the absolute device pose in a shared world coordinate system. As such, most AR applications still rely on 2D markers to anchor digital content in the physical world.
Absolute camera pose estimation would allow anchoring digital content in the physical world without markers, paving the way to ubiquitous AR. Although the computer vision community has made significant progress in this field, many challenges hinder its application to AR. Most absolute pose estimation techniques rely on structure-based methods that detect and match visual features in the images against a 3D model of the environment or absolute pose regressors (APR) that regress the camera pose with a single monocular image input through end-to-end machine learning models. Structure-based localization methods have achieved great accuracy in pose estimation [15, 37, 47, 34]. However, they are often computationally intensive, taking hundreds of milliseconds to provide results on a GPU-equipped server. They also require storing a large environment model. As such, structure-based localization is only considered in offloaded AR scenarios where end-to-end latency is not critical. APR methods make decisions at least one order of magnitude faster than structure-based methods. However, they offer lower median accuracy and are more prone to large errors (over than 5 meters and 10 degrees), especially in large outdoor environments. Such imprecision can lead to severe alignment problems and unreliable AR experiences. Due to the significant issues with both strategies, 2.5D localization has become popular in the AR community [2]. This technique matches the general shape of the environment (typically buildings) against a 2.5D map with limited features. However, although this technique can yield fast and accurate results in urban or indoor environments that are easy to represent as 2.5D maps, they often require additional data, such as building outlines or dimensions. Additionally, 2.5D localization primarily focuses on urban environments and buildings, limiting its applicability.
In this paper, we argue that the fast inference speed and low storage overhead of absolute pose regressor (APR) methods outweigh their constraints for real-time visual localization on mobile devices like AR. AR applications involve significant mobility and require periodic absolute pose estimation to recalibrate the local tracking mechanisms such as inertial measurement units or simultaneous localization and mapping (SLAM) [52, 3]. Achieving high accuracy on a few selected frames is more critical than localizing all frames in this context. We design a new framework that improves APR’s robustness with easily accessible VIO data from mobile devices. APR output tends to present a high variability around the ground truth pose. Modern VIO systems track the pose very accurately over small displacements at the cost of increasing drift. VIO-APR , our proposed framework, leverages these properties to reduce the noisiness of the APR pose while minimizing the impact of VIO drift across the experience. The VIO system also tracks the device’s pose between absolute pose estimations, reducing the need for frequent relocalizations. To evaluate our pipeline, we release a new dataset that includes both outdoor and indoor scenes with raw sensor data accessible on a modern-day smartphone. The dataset includes the VIO pose of each frame as provided by ARKit. We implement VIO-APR over PoseNet (PN) [24, 23] and MS-Transformer (MS-T) [44], two popular APR methods. Over this dataset, VIO-APR significantly improves the accuracy compared to solely using the corresponding APR. We also implement VIO-APR into an AR application that directly leverages ARKit data to optimize the APR poses. VIO-APR results in more accurate localizations with a lower variability, and thus smoother situated AR experiences.
We summarize our main contributions as follows:
-
1.
We design an APR-agnostic framework, VIO-APR , fusing information from a mobile VIO system to model the uncertainty of APR outputs. We select poses with low uncertainty and filter poses with high uncertainty. Reference poses are calculated from the selected poses to optimize some estimated poses from APR.
-
2.
To evaluate our approach, we release a rich indoor and outdoor dataset with VIO data. Each image in the dataset has multiple pose labels, including ground truth from COLMAP and the 6DoF pose label from ARKit. We also analyze the absolute and relative pose error between ARkit and SfM poses.
-
3.
We implement and evaluate VIO-APR over two APR models. With VIO-APR , both models significantly improve accuracy and all precision levels. Our framework improves the accuracy of MS-T as much as 36% on position error and 29% on orientation error in median error over the average of all three outdoor scenes.
-
4.
We integrate VIO-APR into a mobile AR application. VIO-APR results in more accurate relocalizations and smoother AR experiences with a low computation footprint (100 ms on-device localization time) and low energy consumption.
2 Related work
This paper aims to improve the accuracy of APR methods by using local VIO for keyframe selection and pose optimization. In this section, we first review the most relevant works in the field of APR before discussing methods for keyframe selection and pose optimization. Finally, we review the most common datasets used for evaluating visual positioning algorithms.
2.1 Absolute Pose Regression
Absolute Pose Regressors train Deep Neural Networks for regression to directly predict the 6-DOF camera pose including position and orientation of a query image. The seminal work in this area is introduced by Kendall et al. in PoseNet [24]. Since then, there have been several improvements to APR, mainly in terms of modifying the architecture and loss function of the neural network [22, 23, 28, 51, 44, 11, 10] and using auxiliary learning [36, 49, 5, 29]. Some works use unlabeled data to finetune APR [5, 10] while others increase the training data size with synthetic images [33, 51, 40, 30].
MapNet [5] is the closest work to our study, as it minimizes the loss of the per-image absolute pose and the loss of the relative pose between image pairs. MapNet+ is a version of MapNet augmented with unlabeled data in a semi-supervised manner. However, MapNet relies on GPS interpolation data and DSO to compute the relative pose for each image pair [16] as no VIO dataset was available then. Our work extends such an idea to an APR-agnostic pipeline using commercially available VIO systems such as ARKit to improve the accuracy of the absolute pose estimation. To evaluate the performance of our pipeline, we collect a dataset with high-end mobile devices that integrates sensor and VIO data for each camera frame, together with SfM ground truth (GT) poses. Our pipeline adds negligible extra overhead compared to time-consuming fine-tuning methods and does not require additional unlabeled test data that may be difficult to acquire in real-life applications [9].
2.2 Keyframe Selection and Pose Optimization
Keyframe selection is typical in Simultaneous Localization and Mapping (SLAM) [48, 31, 32], where unique feature points are identified for relocalization and loop closing. APR methods are tend to overfit their training data [40]. Keyframe selection for APR aims to infer which images will likely result in accurate pose estimation. Uncertainty estimation is able to find the outliers. Bayesian PoseNet[22], AD-PoseNet [21], BMDN[13, 7], VaPoR[53] and CoordiNet [29] can output poses and uncertainty simultaneously, but they are less accurate than many APR methods that only provide estimated poses. Besides, they rely on a specific neural network structure and loss functions to model uncertainty by estimating the variance of the pose distribution. In contrast, our pipeline directly compares APR’s prediction’s relative pose distance with the mobile VIO’s relative pose distance at test time. This approach is more interpretable in real-life scenarios [40], enabling its integration into real-time AR applications.
Several methods aim to optimize the absolute pose. MapNet+PGO [5] uses a constant Pose Graph Optimization (PGO) method. However, it tends to optimize well-predicted poses negatively. AD-PoseNet [21] proposes an uncertainty-aware PGO that only optimizes unreliable poses using multiple images.
Zhang et al.[54], Taira et al.[47], and Chen et al. [9] verify whether the estimated pose is reliable by rendering synthetic image based on the estimated pose. Iterative algorithms are used to minimize the gap between the query and synthetic images at test time. These methods discards some of the advantages of APR such as the low computation and storage footprint, making APR less efficient than typical structure-based methods. Our method performs a rigid transformation of the VIO’s pose to optimize unreliable APR poses directly, without iterative optimization. It establishes a feedback loop that also compensates for VIO drift. Additionally, our framework is flexible and APR-agnostic, allowing both uncertainty-aware and uncertainty-unaware pre-trained APR models to be used without modifying training details. This approach improves the accuracy of traditional methods with minimal overhead, enabling reliable APR usage in mobile AR applications.
2.3 Camera localization datasets
Benchmark datasets of visual localization provide camera poses for a set of training and test images. They are commonly used to evaluate performance in autonomous robots [25], self-driving cars [20], and Augmented Reality (AR) systems [1, 8, 26].
Cambridge dataset [24] and 7Scenes [17, 45] are the most popular image-based localization dataset with SfM GT. The GT of 7Scenes are originally obtained from RGB-D SLAM (dSLAM), and [9] extends it with SfM tool COLMAP [42] for higher accuracy proved by [4]. These two datasets present typical indoor and outdoor locations that translate well to the AR context. However, they only offer visual data. Many other vision-only datasets have been developed. However, such datasets present significant limitations in terms of scope [39, 50, 46, 17, 45], hardware [17, 45, 50, 46, 47], and environment size [46, 17, 45, 47]. Datasets that provide additional sensor data alongside visual data often lack the crucial VIO data required to assess our pipeline [24, 14, 17, 45, 47, 27, 39].
To the best of our knowledge, only two datasets consider VIO data from mobile devices such as ARKit or ARCore. LaMAR[38] is a dataset specifically developed for AR localization tasks. However, despite optimizing pseudo-GT global poses by fusing LiDAR, SfM, wireless, and VIO data, Lamar only provides the pseudo-GT, and other sensor data is not public. ADVIO[12] obtains GT by combining inertial navigation with manual position fixes using iPhone 6S and Tango. However, both platforms are nowadays obsolete. Tango was discontinued for ARCore and each new version of ARKit significantly reduces drift [41]. No dataset reflects the current state of VIO tracking for the AR community. This paper thus introduces a new dataset captured using iPhone 14 Pro Max, the flagship ARKit 6 phone at the time. We additionally provide SfM GT and the pose labels of VIO, IMU, GPS, and compass in their respective coordinates. We also use this dataset to characterize the position and orientation drift of ARKit over multiple scenes. Our dataset highlights the low drift of current mobile VIO solutions, such as ARKit, supporting our assumption that VIO can reinforce absolute pose estimation. It enables researchers to consider multiple sensor and VIO data for localization tasks in AR.
3 Proposed Approach
3.1 Definition
Given a stream of query images , APR outputs estimated global position and rotation so that is the 6Dof camera pose for each image. The camera pose of each image in the VIO coordinate system is noted . is the GT pose of each image . The relative translation between image and is characterized by
| (1) |
| (2) |
| (3) |
Similarly, we get relative rotation in degree follow [19], denotes the conjugate of , and we assume all quaternions are normalized:
| (4) |
| (5) |
| (6) |
is the odometry of and from predicted poses of APR. is the odometry of and from the VIO system. is the GT odometry of and . The definition of , and is shown as below,
| (7) |
| (8) |
| (9) |
We define the Relative Position Error (RPE) and the Relative Orientation Error (ROE) for the VIO and the APR as follows:
| (10) |
| (11) |
| (12) |
| (13) |
3.2 Detecting accurate pose estimations using VIO
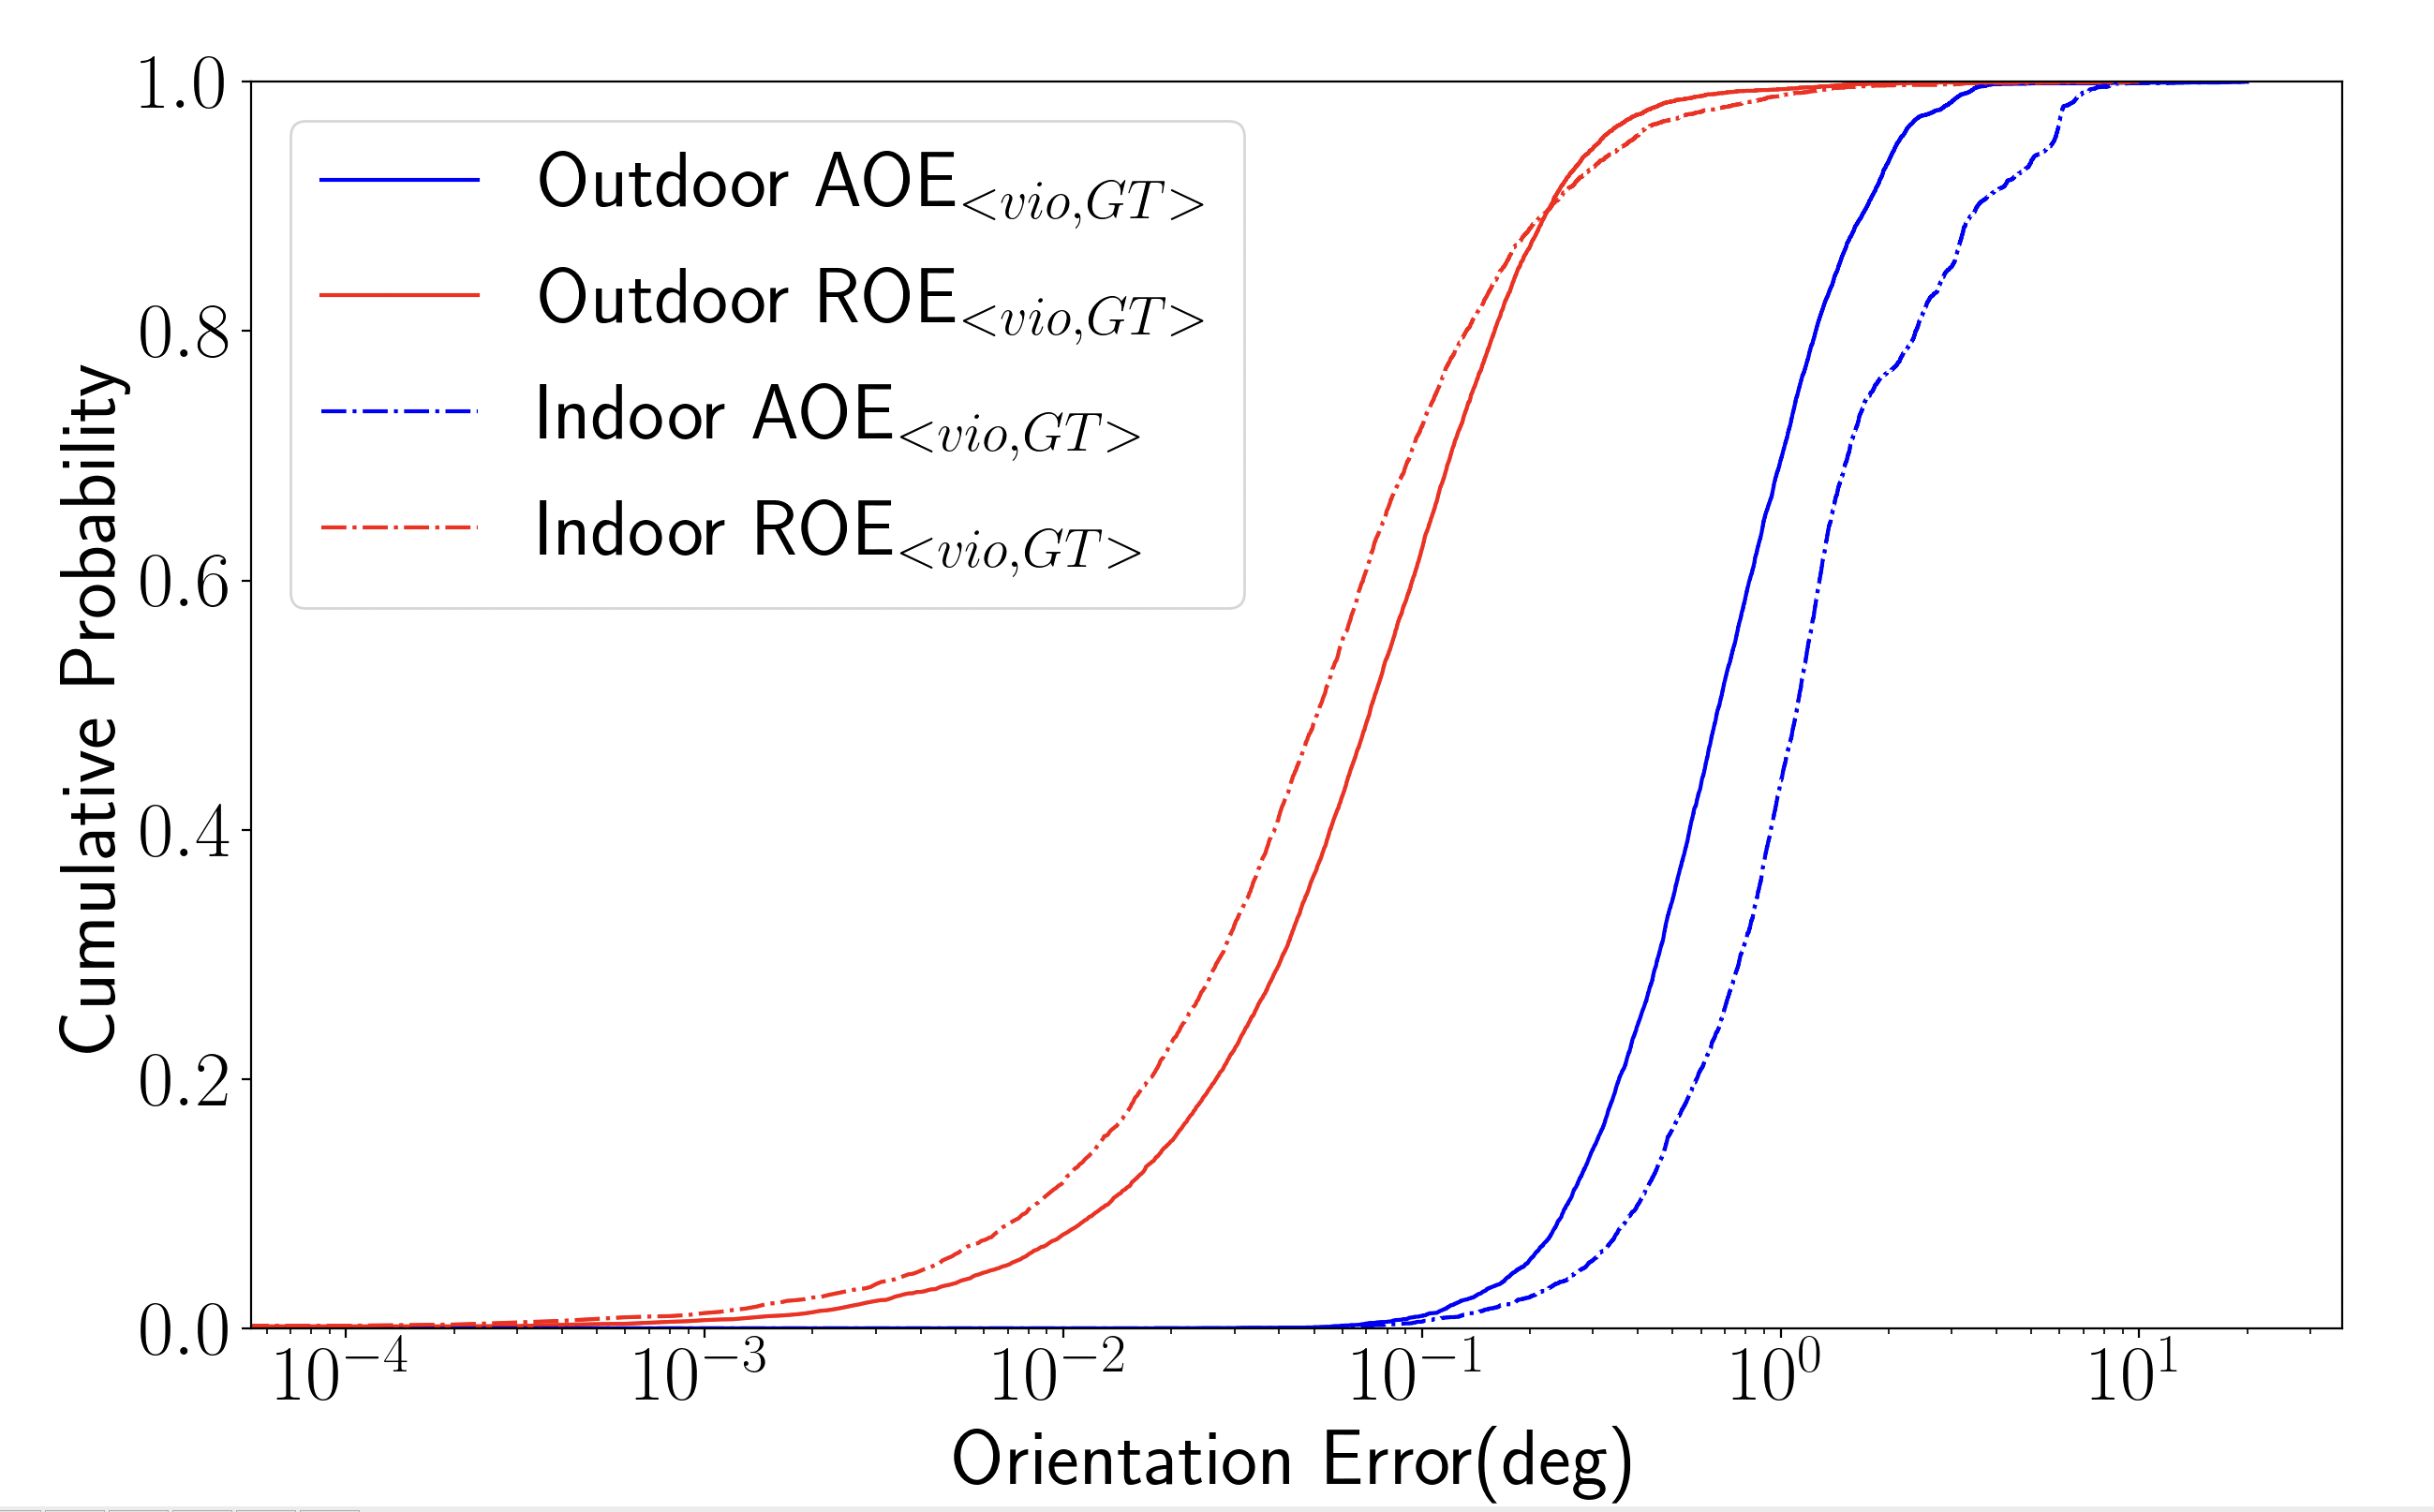
As shown in Section 4, modern VIO systems have low drift at a small temporal scale, and tends to be very close to the GT as shown in Figure 7. More than of the images pairs have less than of and less than of . Therefore, we can assume that is almost the GT odometry for frame , . We model the uncertainty of the APR output, , with , taking advantage of the relationship between and . If the and of multiple consecutive images are very small, we consider the predicted poses to be accurate.
We define a distance threshold for and an orientation threshold for . An estimated pose from the APR is considered accurate if it is close to GT with the error less than and . Given two consecutive query images , ,
-
1.
Estimated poses of and are accurate, then and are lower than and , respectively.
-
2.
One of the estimated pose for and is not accurate, then either should be larger than or should be larger than .
-
3.
Both estimated poses of and are inaccurate. However, remains lower than and lower than .
-
4.
Both estimated poses of and are inaccurate, and either is larger than or is larger than .
When either or is larger than its respective threshold (case (2) and (4)), the pose is flagged as inaccurate and can thus be filtered out. Similarly, in case (1), the two poses are identified as accurate. In case (3), two inaccurate poses are identified as accurate. Our method uses a probabilistic approach to reducing such false positives. APR error tends to be random with a large variance. As such, two consecutive images presenting a large APR error while being close to each other in the same direction as the VIO is a rare occurrence. By comparing more pairs of images, we further reduce the probability of false positive, filtering out the most unreliable predictions. We then obtain the rigid transformation between the VIO coordinate system and the global coordinate system by using the reliable predicted poses and VIO poses. To ensure the rigid transform relationship’s reliability, we calculate the average pose of selected predicted poses as reference pose. The rotation and translation of the coordinate system of VIO and the world coordinate system change over time due to the VIO drift. Therefore, we only need to update the reliable poses occasionally and optimize the predicted pose by calculating the new rotation and translation.
3.3 VIO-APR framework
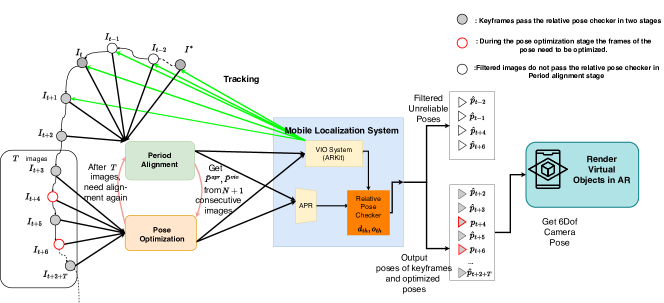
Based on the above subsections, we present VIO-APR a new APR-agnostic framework that combines the outputs of APR methods and information from smartphones’ VIO systems to improve pose prediction accuracy. The framework keeps the most reliable prediction poses with the help of VIO, identifies unreliable poses, and optimizes them based on reliable poses. Our framework combines the distinctive features of APR predictions, which are locally noisy but drift-free, with mobile VIO systems, which are locally smooth but tend to drift, as shown by [5]. This framework consists of two alternating looping stages: Period alignment and Pose optimization, as shown in Figure 1. The Period Alignment stage identifies multiple reliable poses to calculate the average reference pose. The Pose Optimization stage optimizes unreliable poses based on this reference pose and the VIO poses. VIO-APR periodically goes back to the Period Alignment phase to recalculate the reference pose and thus negate the effect of VIO drift (see Section 5.3).
Period Alignment: The Period alignment stage checks the odometry of consecutive images. It is in a sequential localization mode since the system can only determine the absolute pose with at least images as input. We consider the first image to enter the period alignment stage. When all consecutive pairs of images satisfy the requirement that and the predicted results of these consecutive images from to can considered as accurate predicted outputs. and are the relative pose checker’s distance and orientation threshold to filter the inaccurate estimated poses. If the difference between and is larger than or , the pose is inaccurate and discarded. If the difference between and is less than and simultaneously, poses and pass the relative pose checker. Upon getting reliable estimated poses, we perform geometric averaging from using Weiszfeld’s algorithm111https://pypi.org/project/geom-median/. and [18]222https://github.com/christophhagen/averaging-quaternions to get reference pose since we assume the pose error of APR is normally distributed in space. We perform the same geometric averaging from to get the reference pose in the VIO system. Once and are defined, VIO-APR moves to the Pose Optimization stage.
Pose Optimization: The Pose Optimization calculates the pose estimation for each query image. The Relative Pose Checker checks the predicted pose against the previous image’s pose as follows. For the subsequent predicted poses and their corresponding poses in VIO system, we get the odometry of and in APR coordinates and odometry of and in VIO coordinates respectively. If and is satisfied, we consider the APR output for this image to be accurate as the difference of odometry between APR and VIO is very small. The pose is considered reliable and can be output directly. Otherwise, the pose is optimized by (see Algorithm 1). We calculate the rigid transformation between VIO coordinates and world coordinates using and . Then we transform to world coordinates and replace the unreliable pose. Once the system reaches frame , it loops back to the Period Alignment stage to find a new reference pose and compensate for VIO drift.
As shown in Figure 1, we call the consecutive query images of reliable poses in Period Alignment stage and query images pass the relative pose checker in Pose Optimization stage as keyframes. Such a framework removes some estimated poses with particularly large errors in the Period Alignment stage. Predicted poses of keyframes are considered to be reliable and close to the GT. The average estimated pose of keyframes in the Period alignment stage and the corresponding VIO poses are reference poses, and . Then, we correct unreliable poses and keep reliable poses in the Pose Optimization stage according to and . We show that the VIO-APR framework greatly improves the accuracy of the median error and reduces the output of poses with large errors by identifying keyframes and optimizing partial poses in Section 6.
4 Dataset
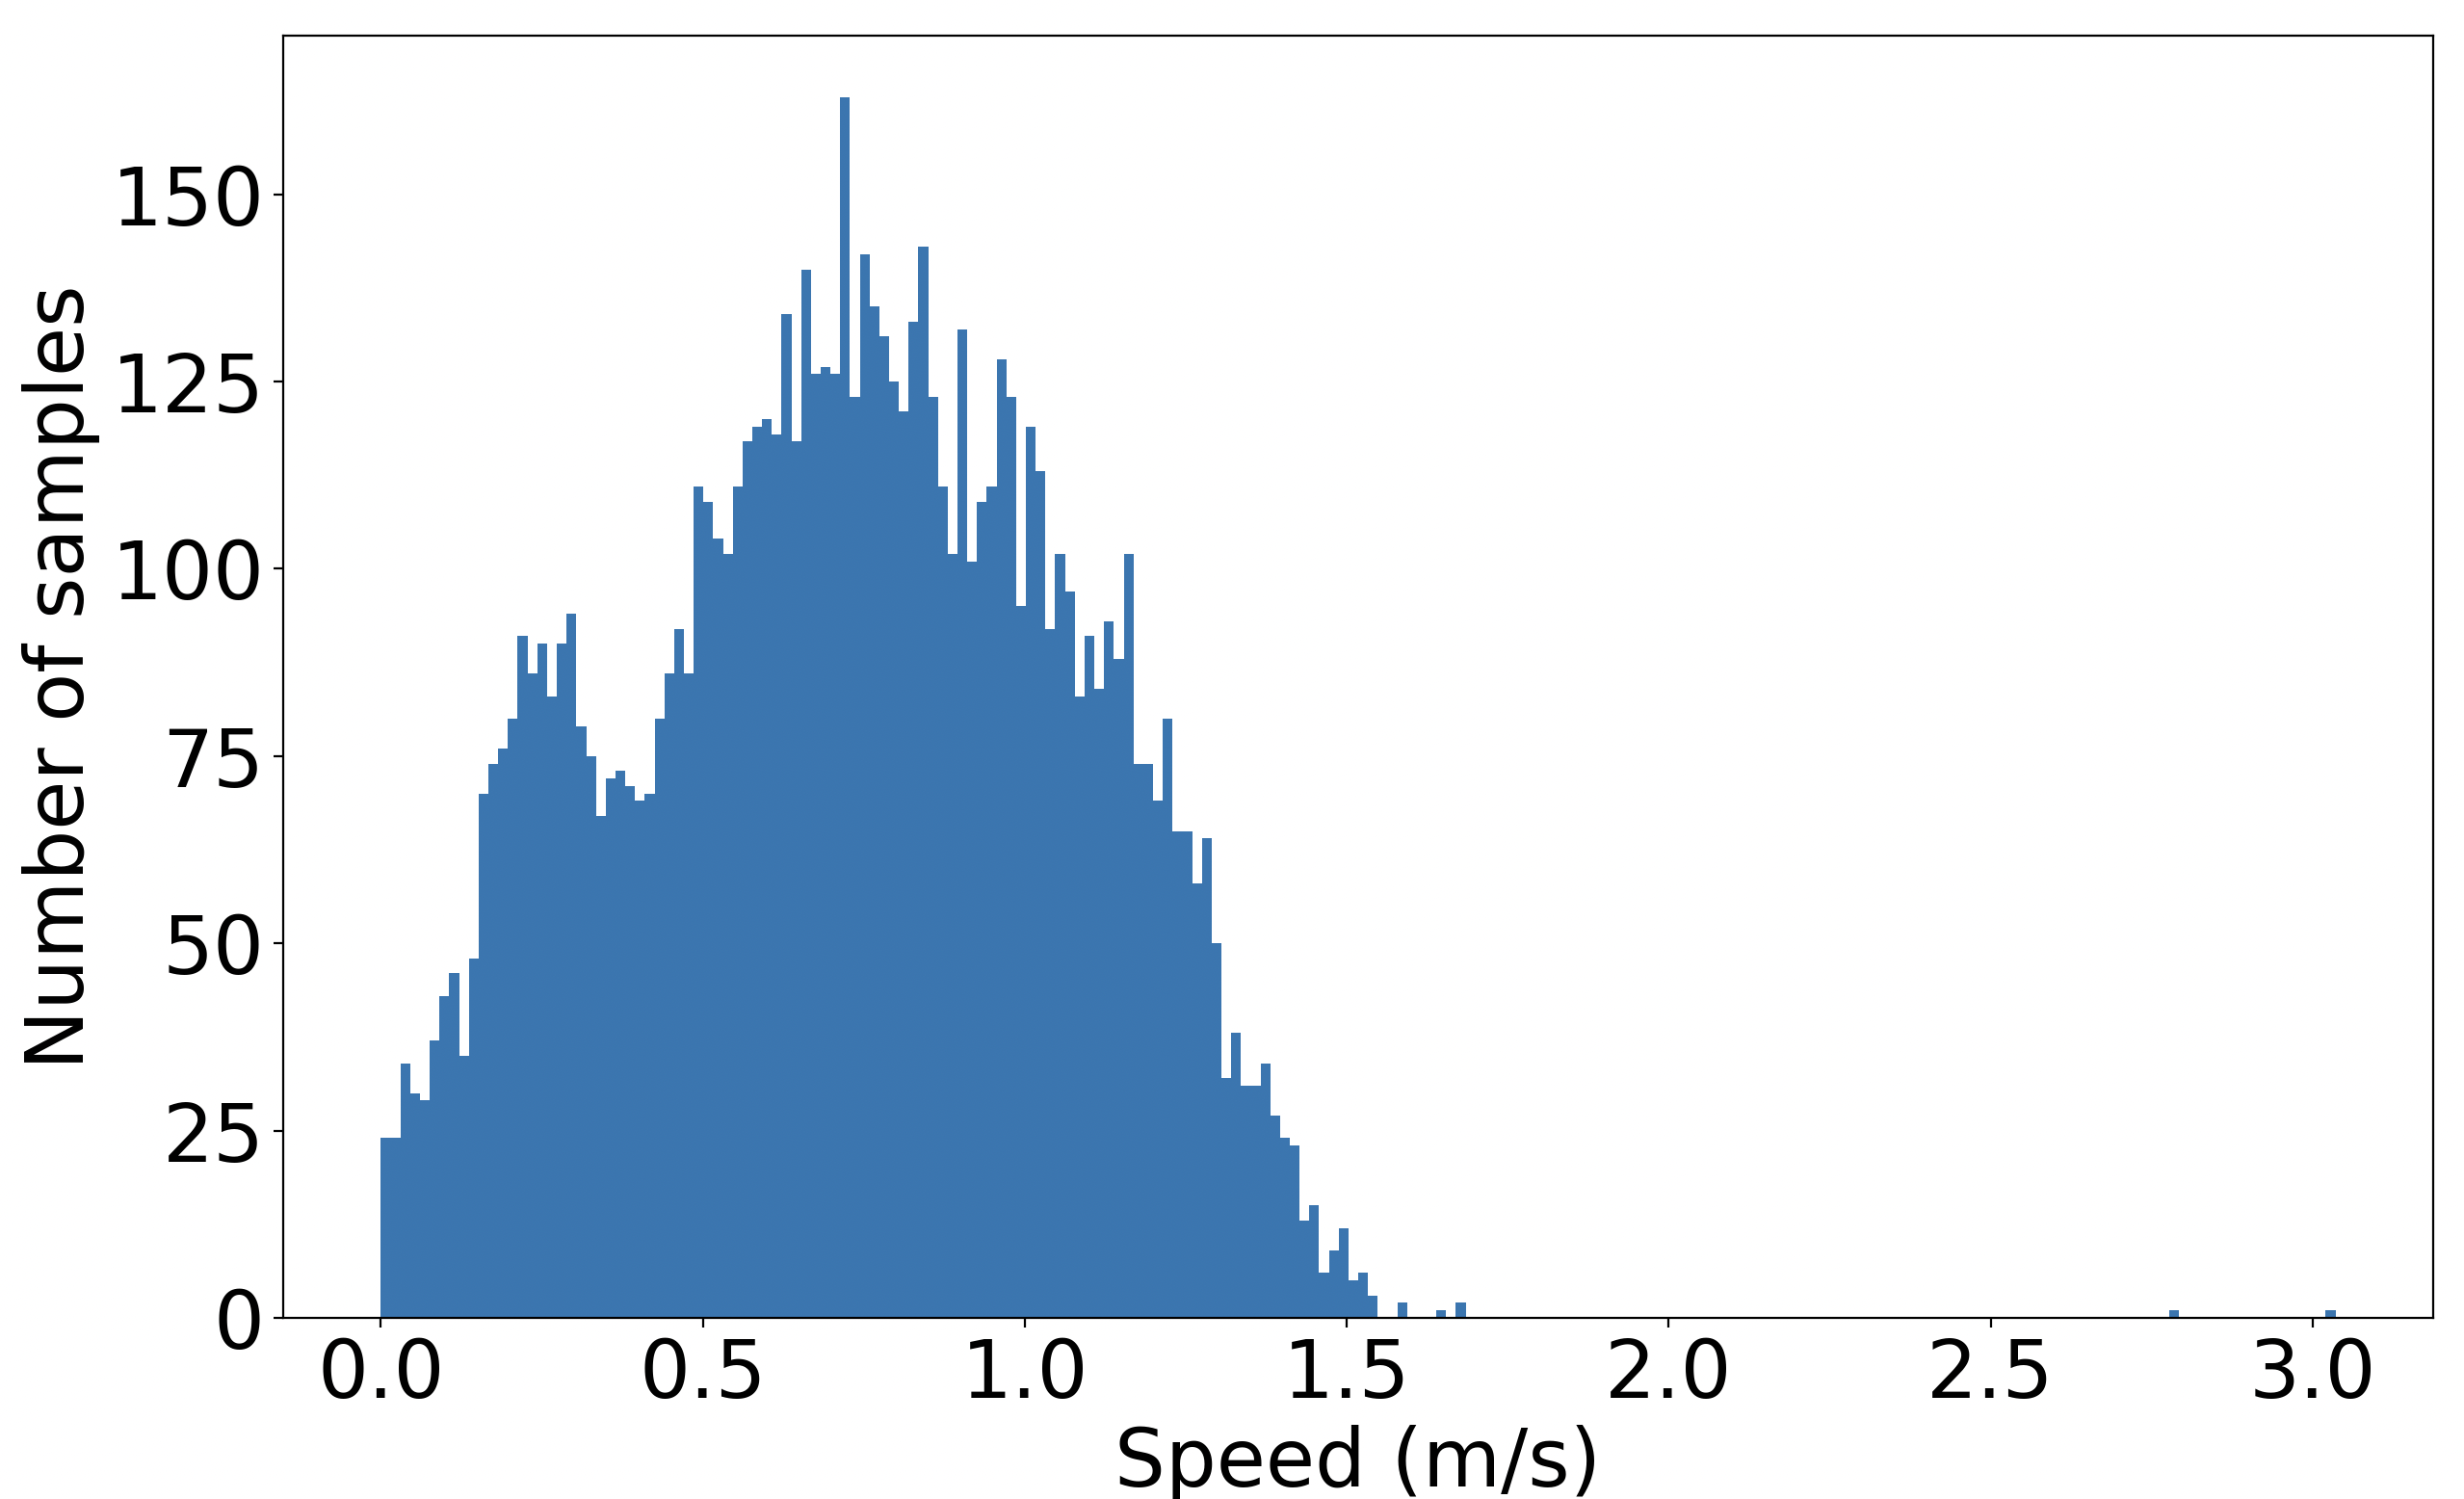
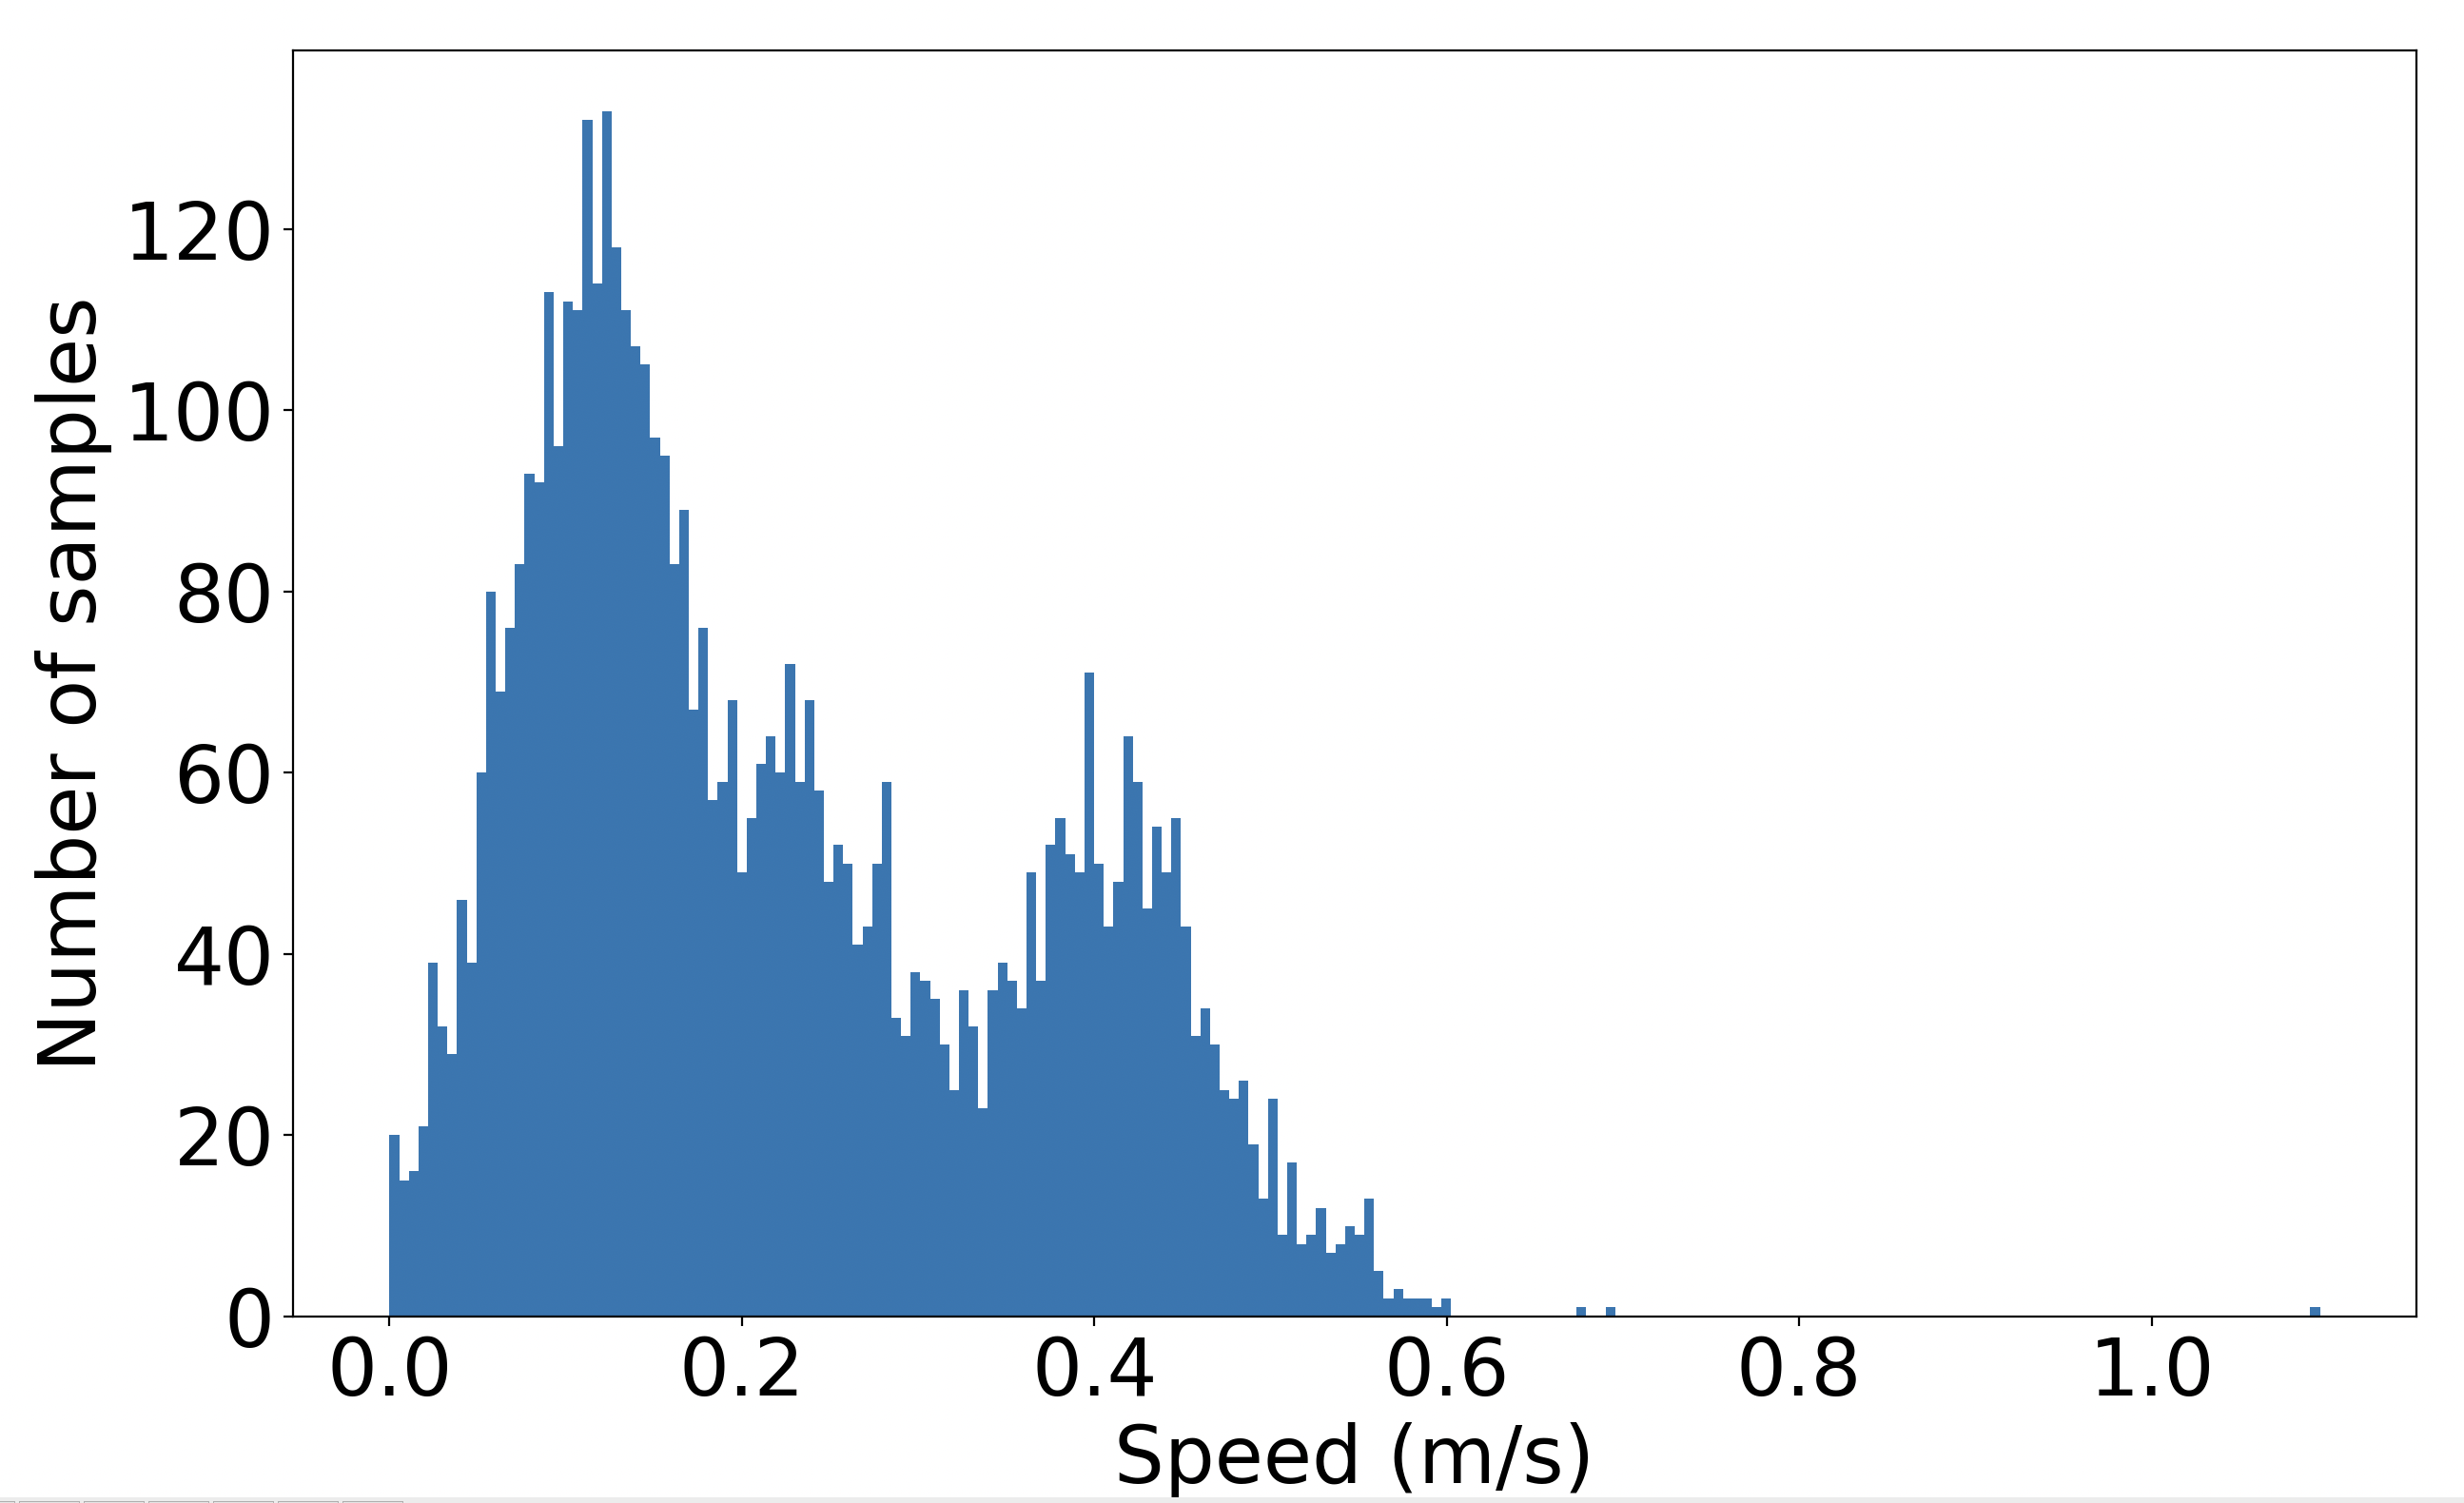
We introduce a localization dataset for this paper, consisting of 70 recordings captured in six locations, including three outdoor and three indoor scenes. We develop a simple application integrates ARKit 6333https://developer.apple.com/augmented-reality/, Gyroscope API444https://docs.unity3d.com/ScriptReference/Gyroscope.html, and iOS GPS Plugin555https://assetstore.unity.com/packages/tools/localization/native-gps-plugin=ios-android-216027#content based on Unity Engine to collect VIO system’s poses data, IMU data, and GNSS location data. All data and timestamps were recorded simultaneously with the image capture. The resolution of all images is . All images are fed into an SfM framework using COLMAP [43] to get the GT. Participants who recorded sequences were asked to freely walk through each scene with the phone in hand without specific routes. Figure 2 shows the speed histogram when collecting data. For outdoor scenes, we captured images in 1Hz. For indoor scenes, we captured images in 2Hz. All visible faces and license plates are anonymized. Table 1 provide summary statistics on the dataset, including the number of samples in the testing and training sets, both derived from independent sequences.
4.1 Outdoor
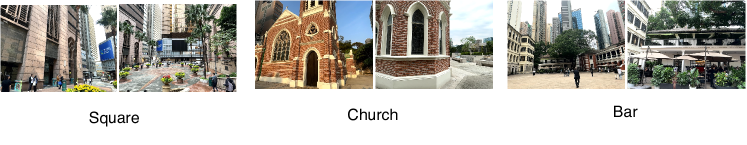
Our dataset contains three large locations representative of AR use cases: 1) Square () is an urban scene at an intersection that contains several office buildings and a garden. 2) Bar () is a scene comprising three historic buildings and outdoor bars. 3) Church () is a scene composed of a historical building and a small garden. 1) and 2) are typical scenes in modern cities, with abundant moving objects like pedestrians and vehicles. 3) is more like a landmark building in a tourist attraction. In addition, each dataset was collected over multiple days and periods, incorporating changes in weather and light as well as changes in the environment’s appearance. Figure 5.a gives example frames from each scene.
4.2 Indoor
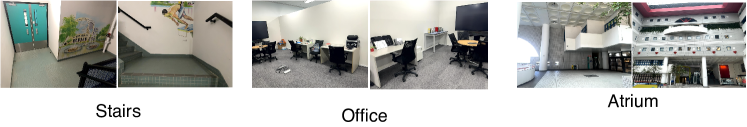
The initial release of our dataset also contains 3 indoor locations representative of AR use cases: 1) Stairs () is the staircase between two floors of a building with murals on the walls. 2) Office () is a daily office and meeting scenario. 1) and 2) are very similar to previous indoor visual localization data sets [17, 45]. 3) Atrium () is a large indoor scene with many moving people of a local university. It was collected over multiple days and multiple time periods. Besides, the scene has small changes in the appearance for different days. Figure 5.b gives example frames from each scene.
5 Implementation
We implement VIO-APR both on a desktop computer to conduct experiments on the collected dataset and in a mobile AR app for collecting system performance data.
5.1 Desktop Implementation
There are four hyperparameters. and are the Relative pose checker’s distance and orientation thresholds to filter inaccurate pose estimations. If among consecutive images, image pairs pass the relative pose checker, we consider these pose estimations to be accurate. is the number of images processed in Pose Optimization before returning to the Period Alignment. We set and according to the average RPE<vio,GT> and ROE<vio,GT> over our datasets. We set and , with one frame processed per second for the AR application demo and all the experiments in this paper. We implement our framework over two APR models:
PN. PoseNet (PN) is the baseline method in this paper. Since there is no open source code for PoseNet [24, 23], we follow [5, 28] and use ResNet34 as the backbone network.
MS-T. MS-Transformer [44] (MS-T) is the SOTA model in supervised learning APR. It aggregates the activation maps with self-attention and queries the scene-specific information. MS-T extends the single-scene paradigm of APR to learning multiple scenes in parallel. Therefore, we trained one MS-T for all outdoor scenes and one MS-T for all indoor scenes using the official open-source code666https://github.com/yolish/multi-scene-pose-transformer.
We note APR methods integrated into our VIO-APR framework as . All APR models are implemented in PyTorch [35]. During training, all input images are resized to and then randomly cropped to before. For both PoseNet and MS-T, we set an initial learning rate of . For all APR models, we use a batch size of 32. The training epoch of PN is 400 for all datasets. The training epoch of MS-T is 600 for all dataset. We implement our framework as a Python script set that takes the output pose from the selected APR method and applies the algorithms discussed in Section 3. All experiments for evaluation in Section 6 are performed on an NVIDIA GeForce GTX 3090 GPU.
5.2 Mobile AR Demo
Besides the Python scripts described above, we implement VIO-APR as a mobile AR app using Unity and ARKit to run on an iPhone 14 Pro Max. We converted the pre-trained PN with a ResNet34 backbone to ONNX format and incorporated it into a Unity application. We use OpenCVforUnity777https://assetstore.unity.com/packages/tools/integration/opencv-for-unity-21088 for processing query images and use Barracuda transfering resized images to tensor as the input of PN. We deploy the framework described in Section 3.3 as a set of C# scripts.
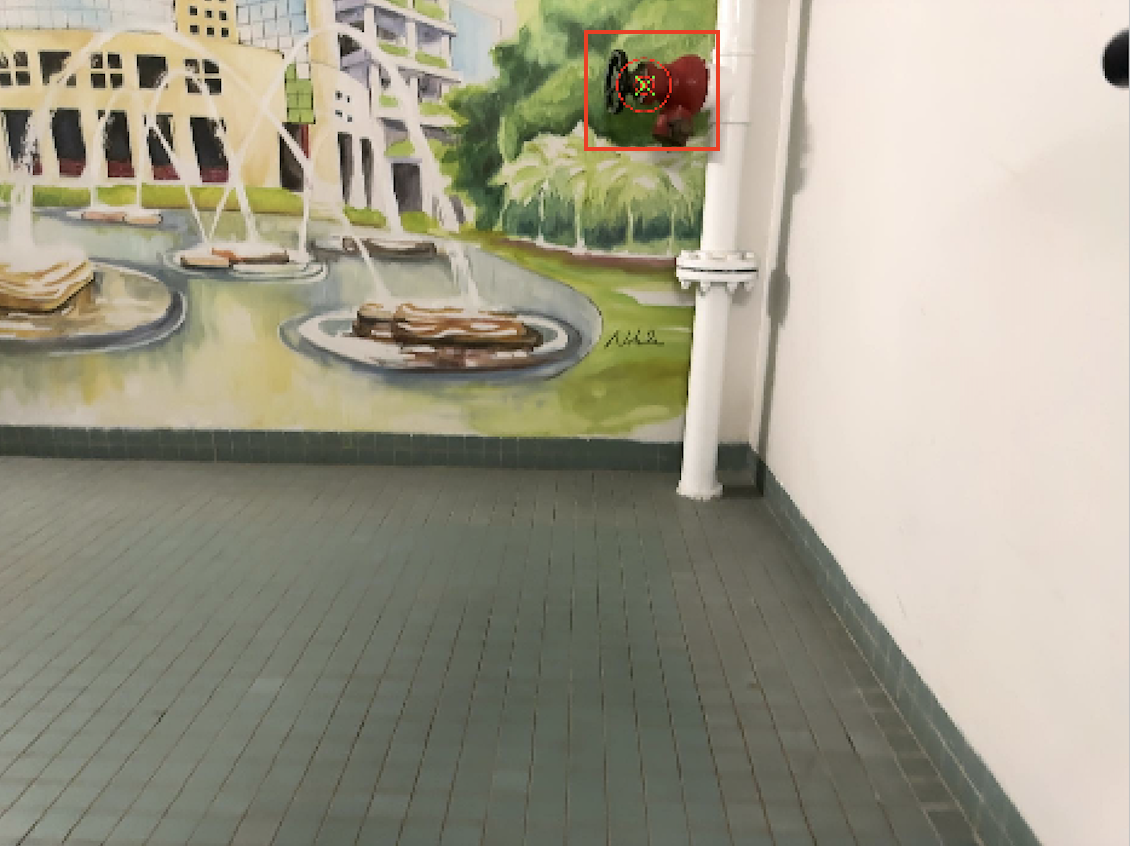
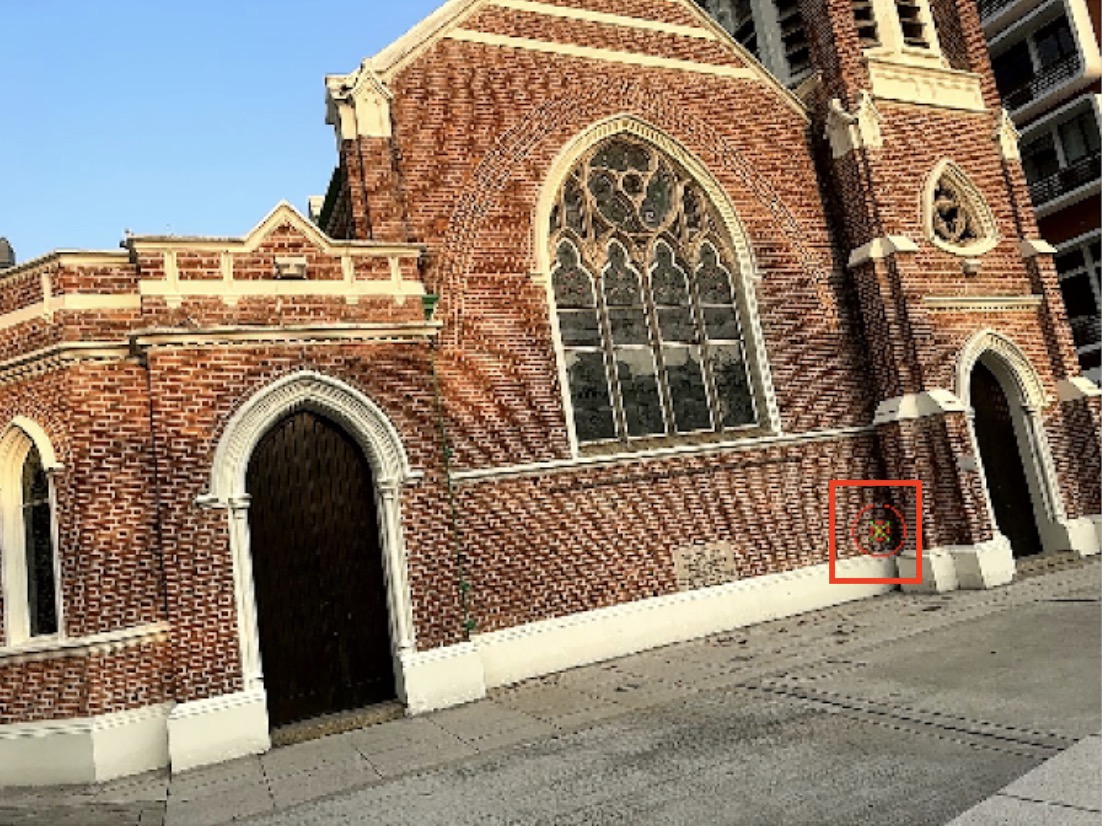
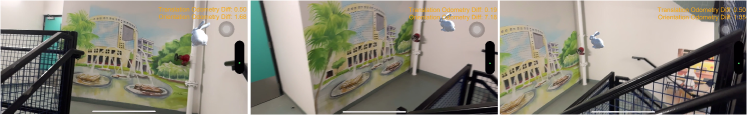
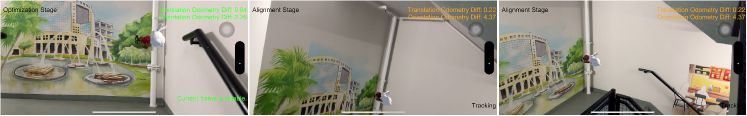
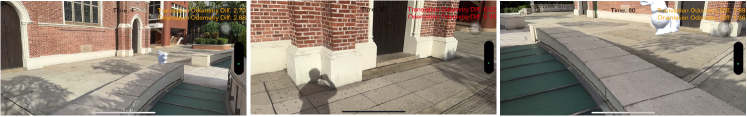
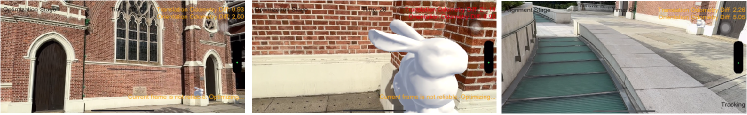
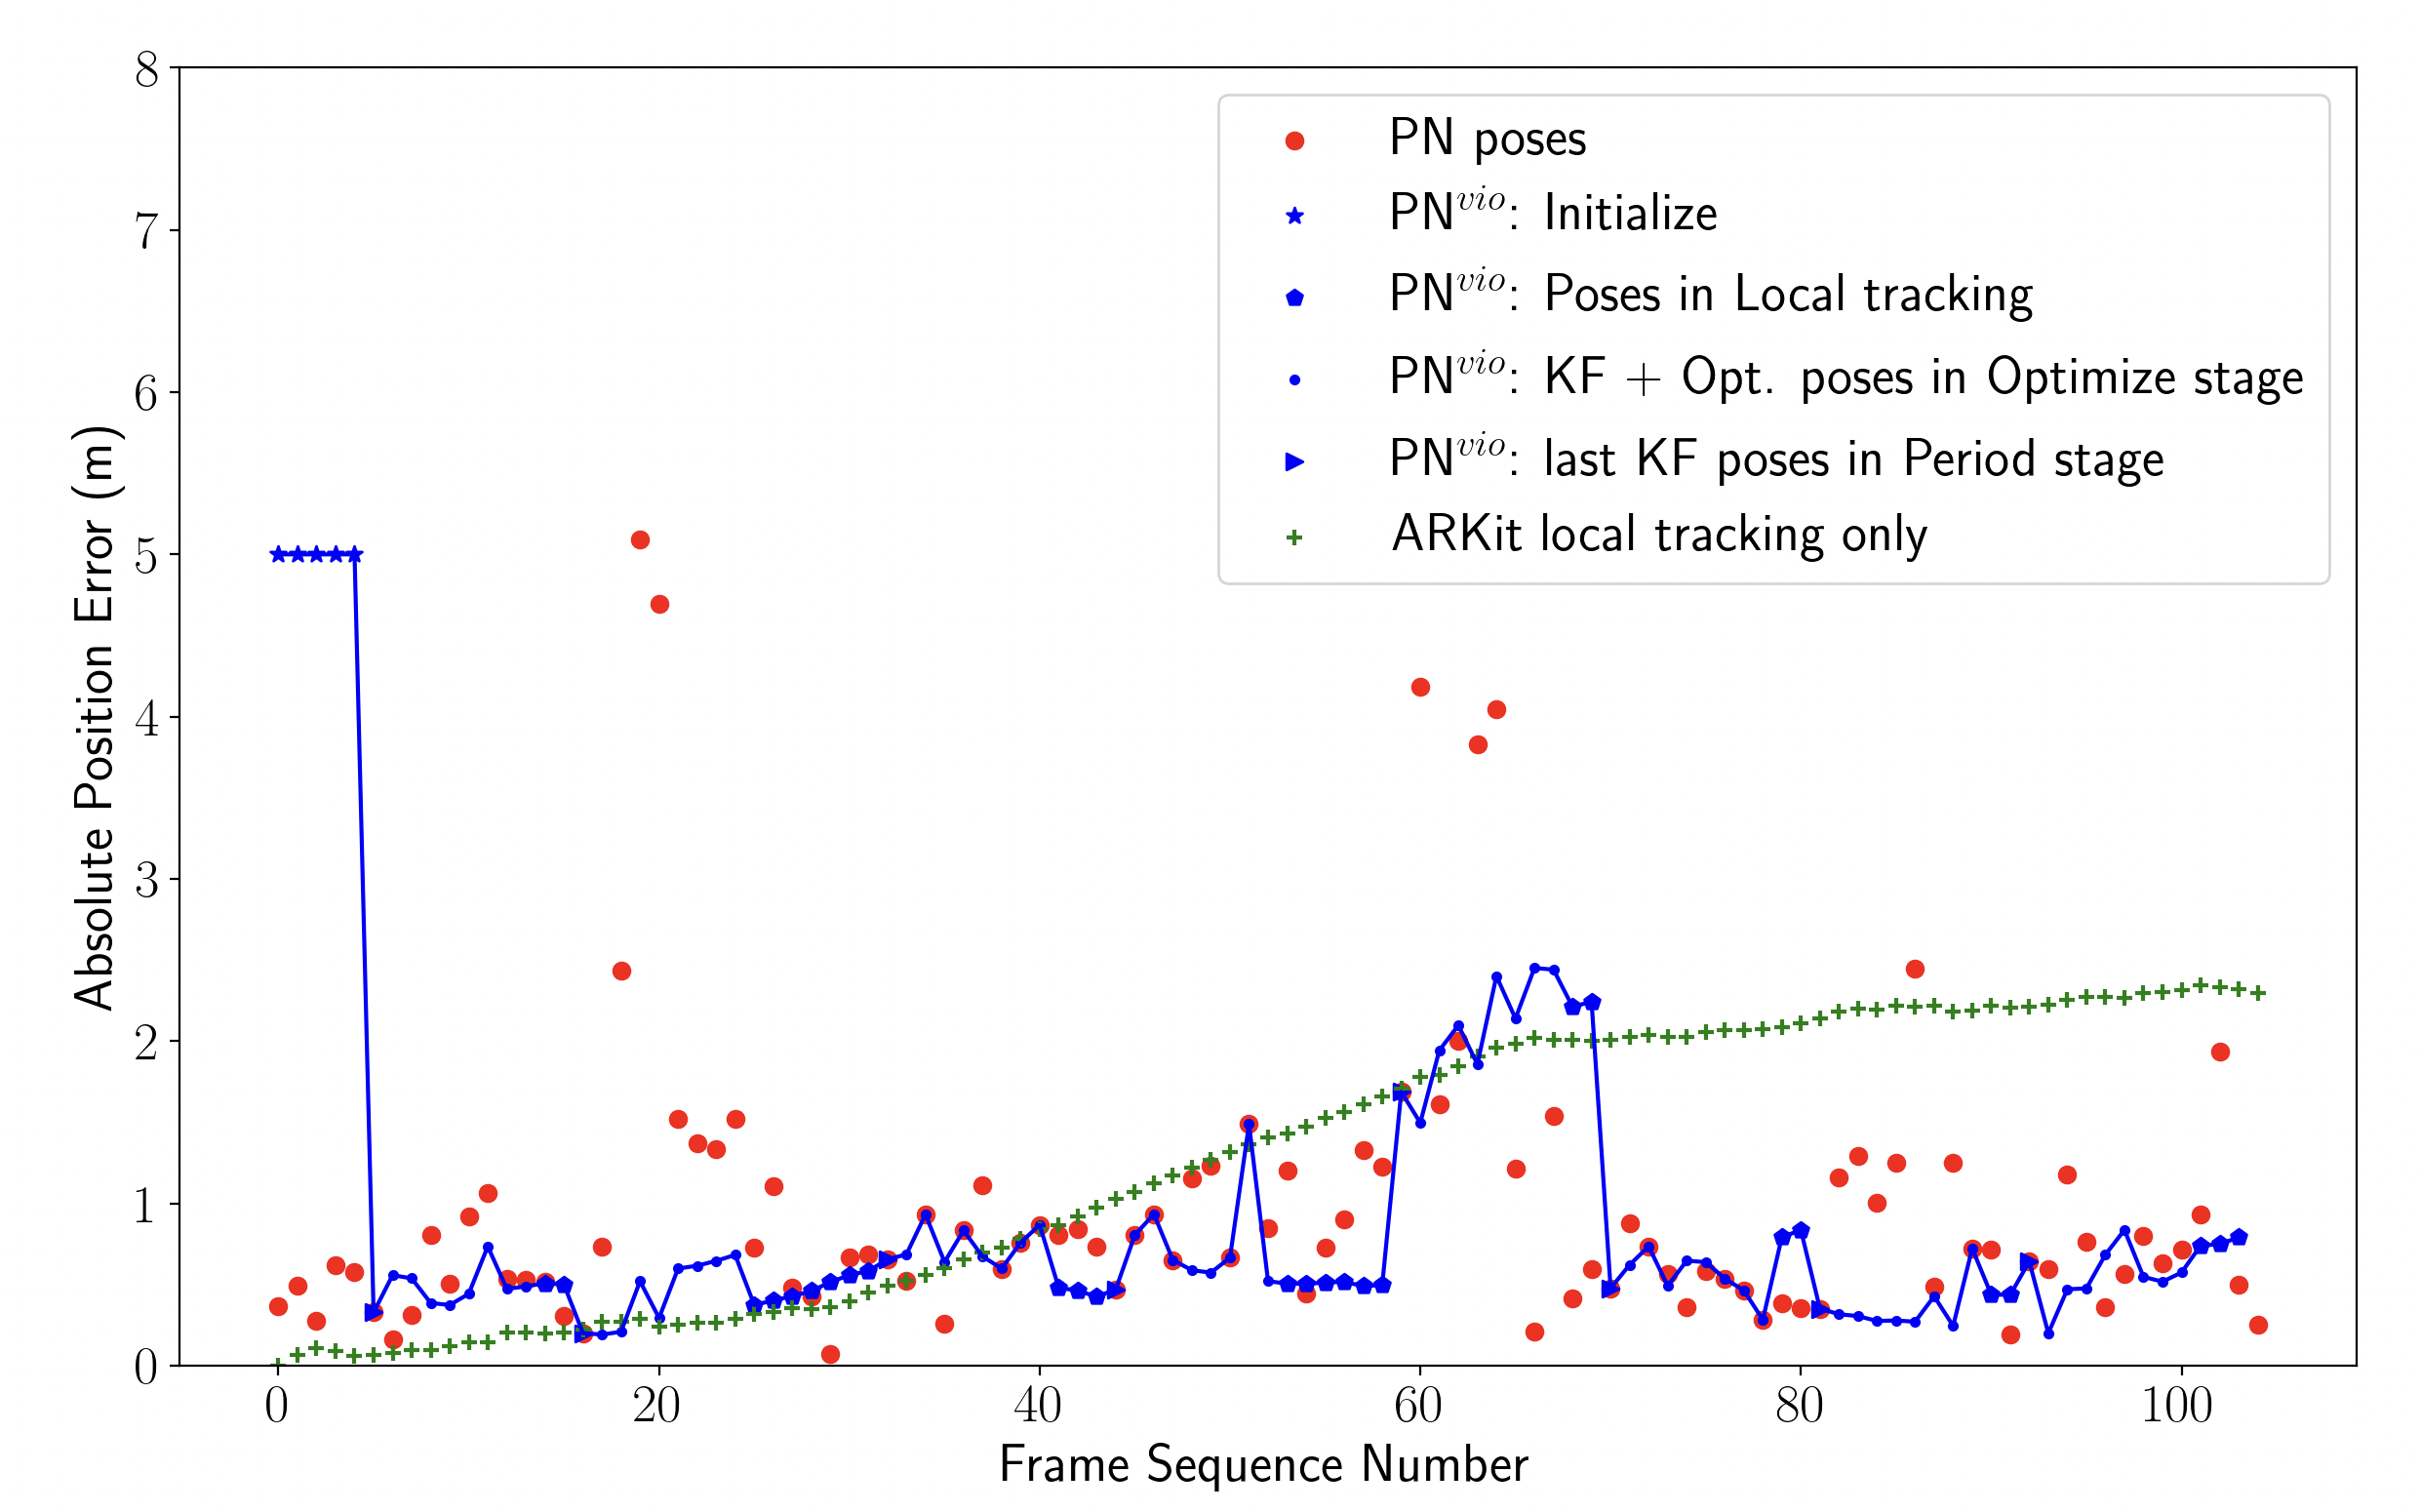
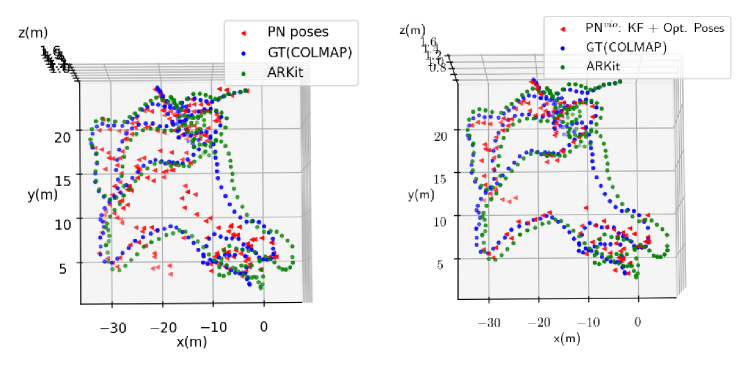
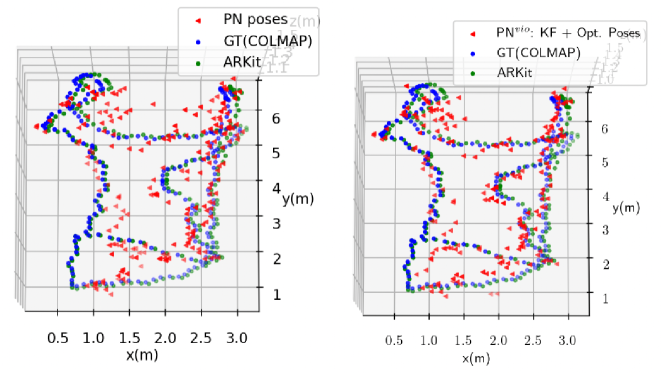
In mobile marker-less AR applications, assume we need to place some virtual objects in specific coordinates in SfM coordinates of the scene. Once reliable absolute poses are obtained, we can adjust (1) the AR Session Origin’s pose 888https://docs.unity3d.com/Packages/com.unity.xr.arfoundation@1.0-preview.8/api/UnityEngine.XR.ARFoundation.ARSessionOrigin.html to place the AR Camera at the original point and the desired orientation and (2) the object’s coordinate based on the position of the output pose. With the adjustment, we are able to render virtual objects correctly. The local tracking module in ARkit or ARCore then automatically keeps the place of virtual objects during the empty window period () as shown by the green arrows in Figure 1 and Figure 6. In practice, we use Camorph [6] for alignment because COLMAP and Unity have coordinate systems with different orientation of axis and handedness. As shown in the Figure 3, we select two coordinates for placing an open-source 3D object, the Stanford Bunny, in the COLMAP reconstructed models of Stairs and Church, respectively. The position where the bunny is located should be stable and the same as the position in SfM coordinates. As depicted in Figure 4, the localization error of PN is very large under some query images. Instead, the localization result of our method is in a small range because our method does not trust all APR predictions, but find the reliable APR output by comparing the difference between the odometry of APR predictions and the odometry of VIO between consecutive images until it finds the reliable APR output. Since our method filtered unrelible predicted poses and improves the robustness of the estimation, the movement of the bunny is small between each update. Local tracking usually occurs only as a slow drift unlike the output of APR jumps between even adjacent frames. Please refer to the supplementary video for watching the AR effect.
5.3 Design Analysis
Using ARKit’s local tracking module for bridging between trusted pose estimates is effective. However, drift accumulates with motion. Since each image of our dataset has ARKit pose labels, we assume that the rigid transformation between the SfM coordinates and ARKit coordinates of the first image’s GT of a sequence is known, and then we use the tracking module for absolute pose estimation, as the pure local tracking error shown in the Figure 6, the error gradually becomes larger with motion, and then stabilize above two meters. This is why we put a restriction on the optimize stage so that after getting the reference pose, we need to get a new reference pose every once in a while by period alignment. This ensures that our method can get much more stable and much lower error than pure local tracking and PoseNet without knowing any query’s GT.
6 Experiment
Since there is no well-known dataset for AR scenario where each image has both a GT pose and pose label from the mobile VIO system, we evaluate our framework on the datasets described in Section 4. To calculate the absolute pose error and the relative pose error between the GT and the ARkit pose, we estimate a rigid transform (3D rotation and translation) between the ARKit tracks and the GT based on the first 30s of estimates in each method (each sequence is around 200s) 999For the smallest stairs scene, the length of each sequence is around 100s. The aligned tracks all start from the origin. We follow the Equation (14) [12], as well as Equations (15, 16, 10, 11) to obtain the cumulative distribution function for the absolute pose error (APE/AOE) and the relative pose error (RPE/ROE):
| (14) |
| (15) |
| (16) |
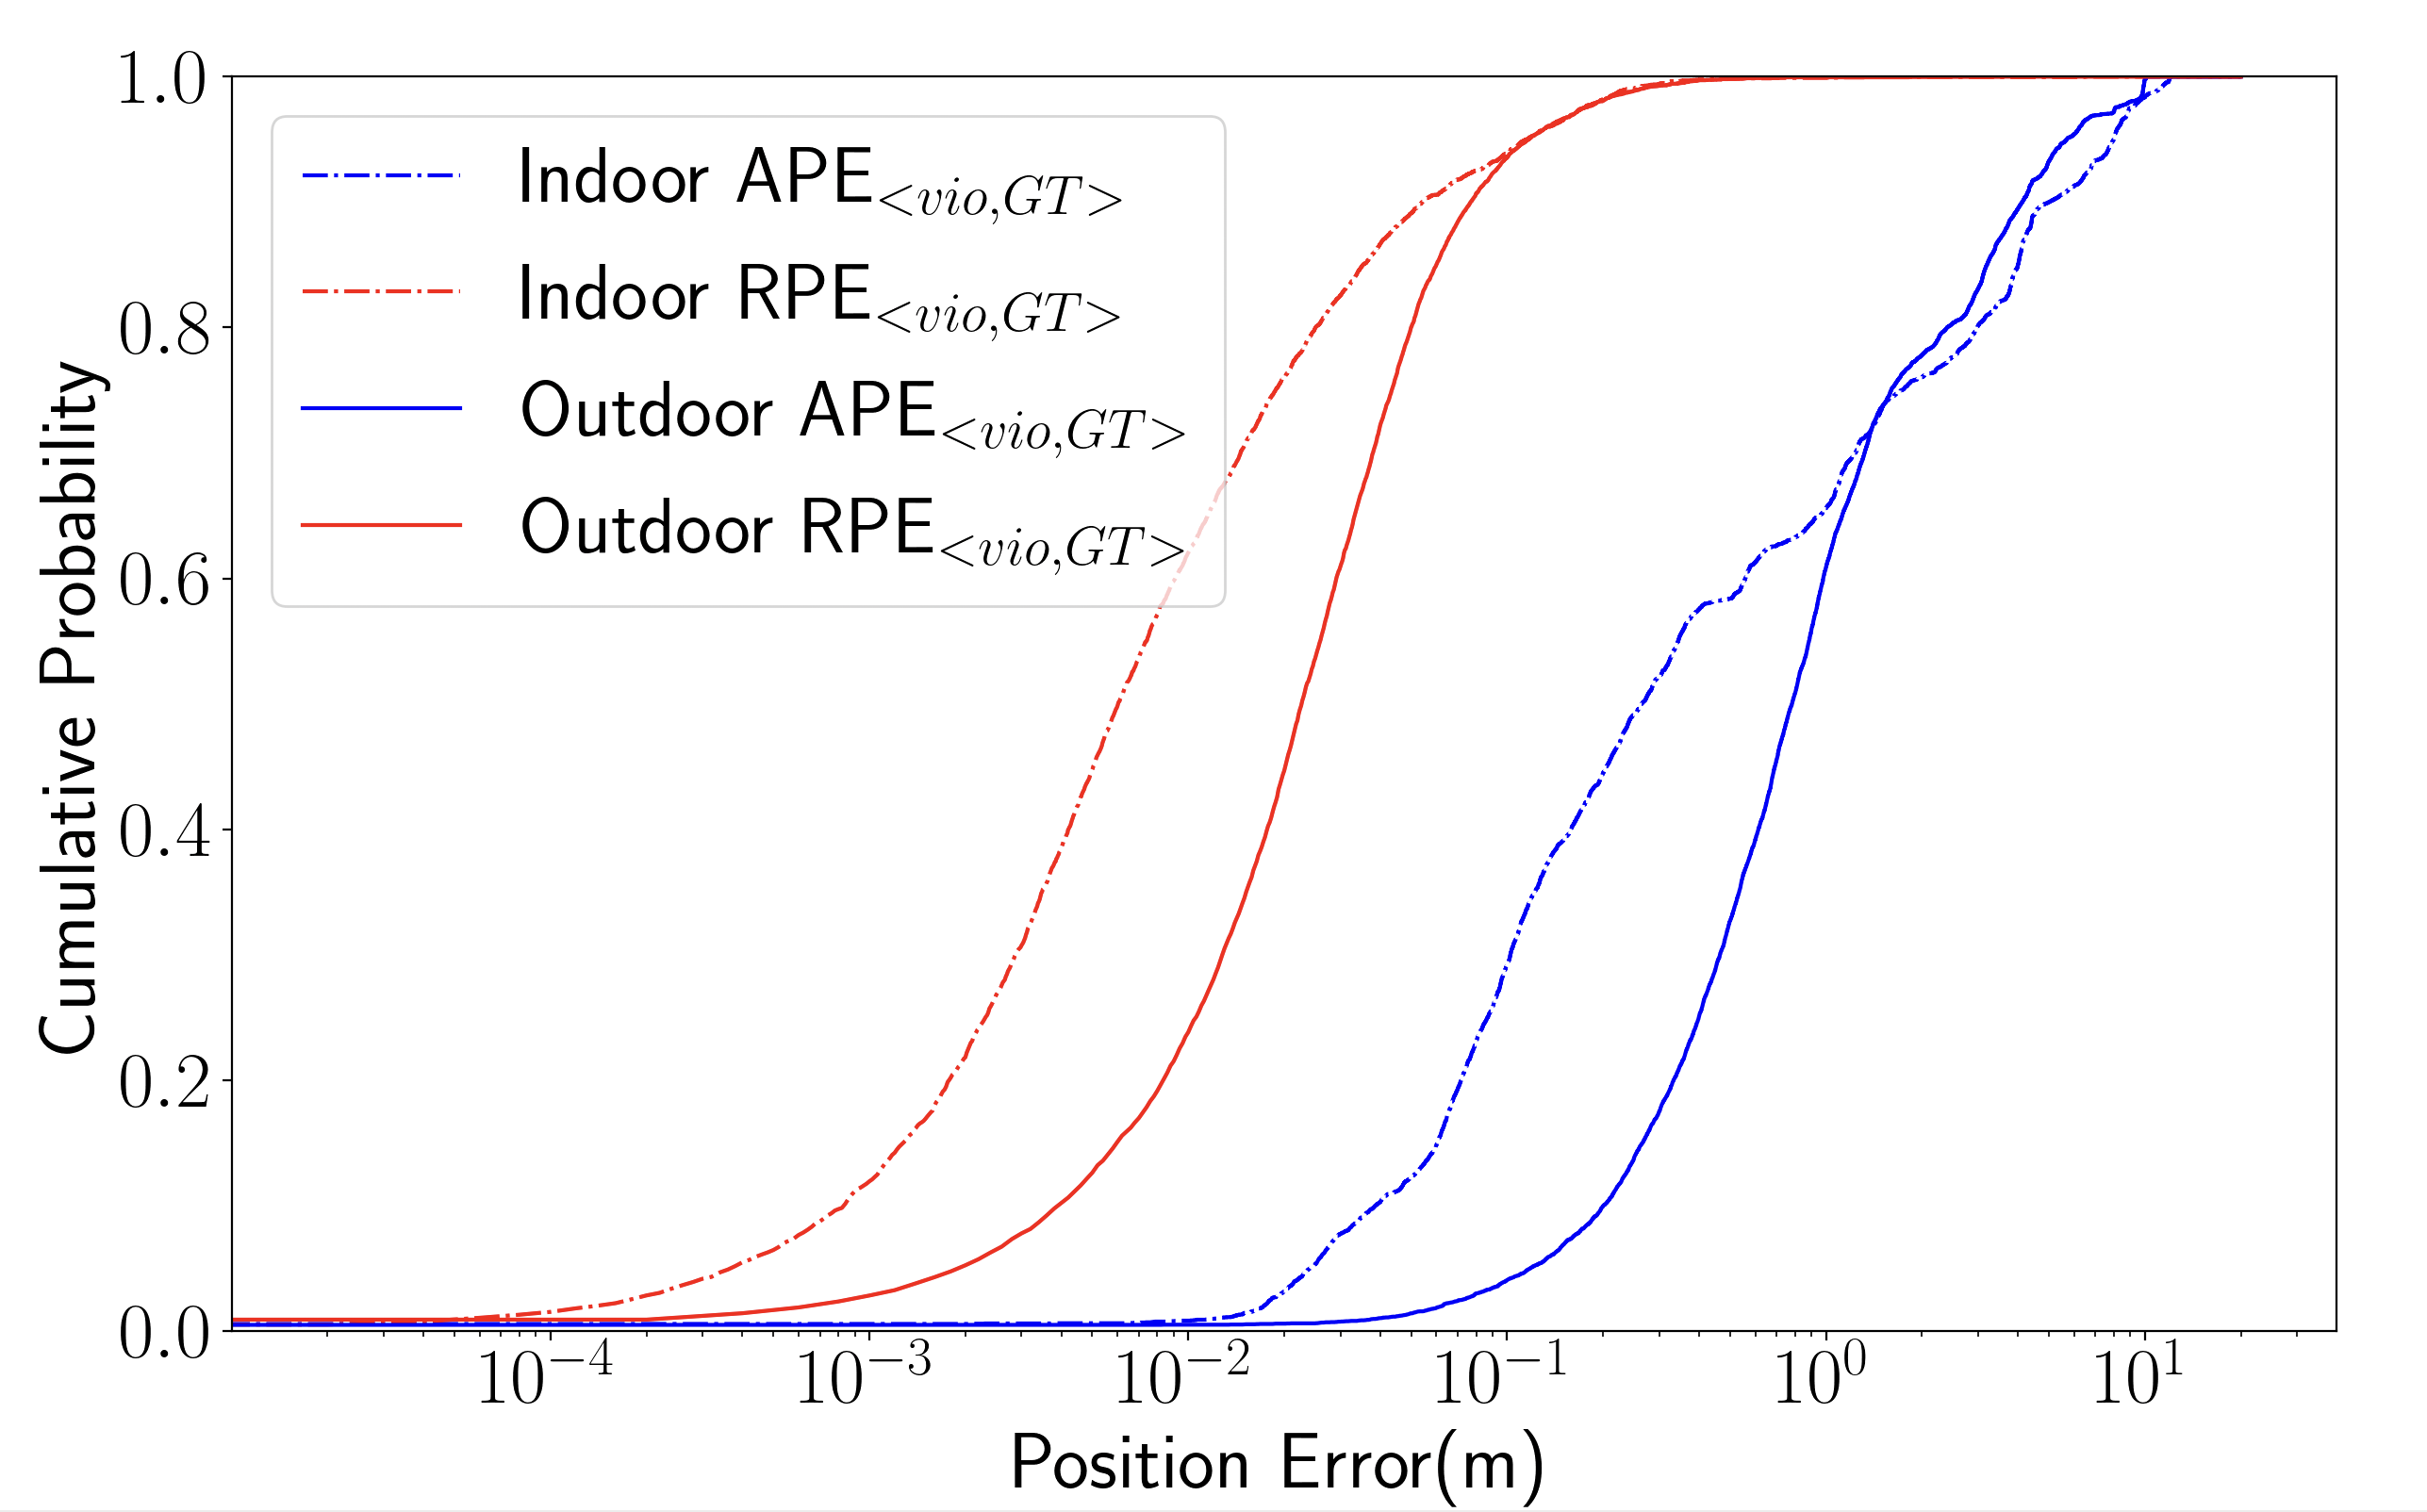
where is the number of poses. is GT, and is the label from the VIO system. In our dataset, are read from Apple ARKit. Figure 7 illustrates the cumulative distribution of position (a) and orientation (b) error. Over 90% of ARKit poses present less than 0.1m and 1° error, confirming the assumption that ARKit pose can generally be considered as ground truth.
We evaluate the performance of APR and our framework through two primary metrics. As indoor and outdoor scenes present significant differences in terms of scale, number of images, and capture speed (see Figure 2 and Table 1), we present the results separately. We consider the median APE and AOE in Tables 2 (outdoor scenes) and 3 (indoor scenes), including and , as shown in Equation (17) and Equation (18) for all test frames. We also evaluate the percentage of test images with pose predicted with high (), medium (), and low () precision levels proposed by [39] in Table 4 (outdoor scenes) and Table 5 (indoor scenes). The higher the percentage of each precision level, the better the performance.
| (17) |
| (18) |
6.1 Experiments on the outdoor dataset
Keyframes: PNvio and MS-Tvio significantly improve accuracy over PN and MS-T alone. Median APEs are greatly reduced as shown in Table 2. In the three outdoor scenes, the keyframes preserved by PNvio reduce the position error by 25% to 39%. Orientation accuracy improved by 17% to 32%. The keyframes preserved by MS-Tvio reduce the position error by 33% to 48%. Orientation accuracy improved by 21% to 24%. Table 4 shows that the percentage of each precision level is greatly increased by filtering out the unreliable poses that amount for 60 to 70% of the total pose estimations. Pose estimates below the low accuracy level are greatly reduced in three scenes. Almost no pose estimates of MS-Tvio have more than 5 meters and 10 degrees pose error on the church scene. These results indicate that APR accuracy is partly pulled down by a significant portion of pose estimates that present a large error. Our pipeline uses VIO to identify and discard these pose estimates, resulting in significantly higher accuracy.
Optimized Poses: Tables 2 and 4 confirm that 23% to 33% of the pose estimates that do not pass the relative pose checker in the pose optimization stage have larger error compared with the median pose error of all predictions. The percentage of almost all precision levels is increased by Algorithm 1 based on the reference poses from the Period alignment stage. Pose estimates below the low accuracy level are greatly reduced for both PNvio and MS-Tvio. No pose estimates after optimizing of MS-Tvio have more than 5 meters and 10 degrees pose error in the church scene. Optimizing unreliable poses may improve the median accuracy compared to filtering them out, while filtering keyframes may be beneficial in other scenarios. For instance, optimizing poses in MS-Tvio results in higher orientation accuracy over all scenes compared to filtering keyframes at the cost of lower position accuracy. On the outdoor dataset, filtering keyframes and pose optimization thus address different issues with APR unreliable poses.
Total results: Combining keyframe selection with pose optimization leads to a much higher median accuracy than with keyframe selection or pose optimization alone, as shown in Tables 2 and 4. MS-Tvio increases the percentage of frames in the high () accuracy level by up to 112% in Church. Figure 8 shows how PNvio improves accuracy. Compared to PN alone, PNvio reduces the incidence of outliers with large error, and reduces the noisiness of the prediction. It also reduces the impact of VIO drift.
6.2 Experiments on the indoor dataset
Keyframes: Filtering out unreliable poses significantly improves median accuracy (see Table 3). The keyframes preserved by PNvio reduce the position error by 17% to 35%. Median orientation accuracy improves by 9% to 23%. As shown in Table 5, pose estimates below the low accuracy level are significantly reduced in three scenes. Less than 4% pose estimates of PNvio and MS-Tvio have more than 5 meters and 10 degrees pose error for all indoor scenes. Despite a smaller-scale, constrained environment, some APR pose estimations still present a large error that lowers accuracy. Our method identifies these poses and retains those with a lower error.
Optimized Poses: Tables 3 and 5 show that the pose estimates that do not pass the relative pose checker in the pose optimization stage (21 to 33% of all poses) have larger error than the median pose error. No pose estimates of PNvio have more than 5 meters and 10 degrees pose error on Stairs. The optimization on median pose error also has a bigger improvement than simply filtering out unreliable output. The percentage of almost all precision levels is increased.
Total results: Tables 3 and 5 demonstrate that keeping only the keyframes’ estimated poses and optimizing some unreliable predicted poses achieves much higher median accuracy than all the original test frames, and the performance is improved at almost every precision level. Similar to the outdoor set, Figure 8 shows that PNvio achieves higher accuracy by filtering out outliers, improving accuracy of PN poses, and reducing the impact of VIO drift.
6.3 Analysis
Table 4 shows that PN and MS-T have 10% to 20% estimates that are very inaccurate in outdoor scenes. However, the probability of encountering large errors in three consecutive images while maintaining an odometry that closely matches VIO’s is quite low. As such, VIO-APR uses the VIO system to identify the accurate APR pose estimates. These reliable poses are then used to calculate the reference pose. Outdoor, our framework improves the accuracy of MS-T by on median position error and on median orientation error over all scenes average. Indoor, it improves the accuracy of PN by on median position error and on median orientation error on all scenes average. The performance of MS-Tvio is similar. According to Figure 7, the indoor VIO pose performs slightly better than that of the outdoor, but our framework achieves better results on outdoor datasets. This is due to the APR presenting a low accuracy on indoor datasets. This leads to inaccurate poses being identified as accurate during period alignment (see case (3) in Section 3.2). As such, calculating the reference pose becomes difficult, leading to further inaccuracies during pose optimization.
6.4 System efficiency
We assess the performance of the proposed pipeline on an iPhone 14 Pro Max device on the setup described in Section 5.2. We measure each parameter over 200 samples. The average processing time per image is 37 milliseconds while the average time for PoseNet to infer an image is 39.5 milliseconds. Therefore, our pipeline can perform absolute camera localization on a mobile device in less than 100 milliseconds. The ResNet34-based PoseNet requires only 85 MB for weight storage. We also measure energy consumption as follows. We start with a battery percentage of 100% and a battery health of 97%. After 20 minutes of using our application in the Stairs scene, the battery percentage drops to 98%. With such low computation cost, storage usage, and energy consumption, our framework is realistically usable for AR applications.
7 Conclusion
This paper introduces VIO-APR, a framework that combines an APR with a local VIO tracking system to improve the accuracy and stability of localization for markerless mobile AR. The VIO evaluates and optimizes the APR’s accuracy while the APR corrects VIO drift, resulting in improved positioning. We introduce a new dataset that includes VIO data. Over this dataset, our framework displays up to 36% higher position accuracy and 29% higher orientation accuracy, with a significant reduction of low-accuracy frames. We also demonstrate VIO-APR ’s real-life applicability by implementing it into a mobile AR app. The mobile app performs absolute pose estimation in less than 100 ms with minimal storage and energy consumption.
References
- [1] C. Arth, M. Klopschitz, G. Reitmayr, and D. Schmalstieg. Real-time self-localization from panoramic images on mobile devices. In 2011 10th ieee international symposium on mixed and augmented reality, pp. 37–46. IEEE, 2011.
- [2] C. Arth, C. Pirchheim, J. Ventura, D. Schmalstieg, and V. Lepetit. Instant outdoor localization and slam initialization from 2.5 d maps. In International Symposium on Mixed and Augmented Reality, 2015.
- [3] H. Bao, W. Xie, Q. Qian, D. Chen, S. Zhai, N. Wang, and G. Zhang. Robust tightly-coupled visual-inertial odometry with pre-built maps in high latency situations. IEEE Transactions on Visualization and Computer Graphics, 28(5):2212–2222, 2022.
- [4] E. Brachmann, M. Humenberger, C. Rother, and T. Sattler. On the limits of pseudo ground truth in visual camera re-localisation. In Proceedings of the IEEE/CVF International Conference on Computer Vision, pp. 6218–6228, 2021.
- [5] S. Brahmbhatt, J. Gu, K. Kim, J. Hays, and J. Kautz. Geometry-aware learning of maps for camera localization. In Proceedings of the IEEE conference on computer vision and pattern recognition, pp. 2616–2625, 2018.
- [6] B. Brand, M. Bätz, and J. Keinert. Camorph: A toolbox for conversion between camera parameter conventions. The International Archives of the Photogrammetry, Remote Sensing and Spatial Information Sciences, 2022.
- [7] M. Bui, T. Birdal, H. Deng, S. Albarqouni, L. Guibas, S. Ilic, and N. Navab. 6d camera relocalization in ambiguous scenes via continuous multimodal inference. In Computer Vision–ECCV 2020: 16th European Conference, Glasgow, UK, August 23–28, 2020, Proceedings, Part XVIII 16, pp. 139–157. Springer, 2020.
- [8] R. Castle, G. Klein, and D. W. Murray. Video-rate localization in multiple maps for wearable augmented reality. In 2008 12th IEEE International Symposium on Wearable Computers, pp. 15–22. IEEE, 2008.
- [9] S. Chen, Y. Bhalgat, X. Li, J. Bian, K. Li, Z. Wang, and V. A. Prisacariu. Refinement for absolute pose regression with neural feature synthesis. arXiv preprint arXiv:2303.10087, 2023.
- [10] S. Chen, X. Li, Z. Wang, and V. A. Prisacariu. Dfnet: Enhance absolute pose regression with direct feature matching. In Computer Vision–ECCV 2022: 17th European Conference, Tel Aviv, Israel, October 23–27, 2022, Proceedings, Part X, pp. 1–17. Springer, 2022.
- [11] S. Chen, Z. Wang, and V. Prisacariu. Direct-posenet: absolute pose regression with photometric consistency. In 2021 International Conference on 3D Vision (3DV), pp. 1175–1185. IEEE, 2021.
- [12] S. Cortés, A. Solin, E. Rahtu, and J. Kannala. Advio: An authentic dataset for visual-inertial odometry. In Proceedings of the European Conference on Computer Vision (ECCV), pp. 419–434, 2018.
- [13] H. Deng, M. Bui, N. Navab, L. Guibas, S. Ilic, and T. Birdal. Deep bingham networks: Dealing with uncertainty and ambiguity in pose estimation. International Journal of Computer Vision, 130(7):1627–1654, 2022.
- [14] T. Do, O. Miksik, J. DeGol, H. S. Park, and S. N. Sinha. Learning to detect scene landmarks for camera localization. In Proceedings of the IEEE/CVF Conference on Computer Vision and Pattern Recognition, pp. 11132–11142, 2022.
- [15] M. Dusmanu, I. Rocco, T. Pajdla, M. Pollefeys, J. Sivic, A. Torii, and T. Sattler. D2-net: A trainable cnn for joint description and detection of local features. In Proceedings of the ieee/cvf conference on computer vision and pattern recognition, pp. 8092–8101, 2019.
- [16] J. Engel, V. Koltun, and D. Cremers. Direct sparse odometry. IEEE transactions on pattern analysis and machine intelligence, 40(3):611–625, 2017.
- [17] B. Glocker, S. Izadi, J. Shotton, and A. Criminisi. Real-time rgb-d camera relocalization. In 2013 IEEE International Symposium on Mixed and Augmented Reality (ISMAR), pp. 173–179. IEEE, 2013.
- [18] C. Gramkow. On averaging rotations. Journal of Mathematical Imaging and Vision, 15(1-2):7–16, 2001.
- [19] R. Hartley, J. Trumpf, Y. Dai, and H. Li. Rotation averaging. International journal of computer vision, 103:267–305, 2013.
- [20] L. Heng, B. Choi, Z. Cui, M. Geppert, S. Hu, B. Kuan, P. Liu, R. Nguyen, Y. C. Yeo, A. Geiger, et al. Project autovision: Localization and 3d scene perception for an autonomous vehicle with a multi-camera system. In 2019 International Conference on Robotics and Automation (ICRA), pp. 4695–4702. IEEE, 2019.
- [21] Z. Huang, Y. Xu, J. Shi, X. Zhou, H. Bao, and G. Zhang. Prior guided dropout for robust visual localization in dynamic environments. In Proceedings of the IEEE/CVF international conference on computer vision, pp. 2791–2800, 2019.
- [22] A. Kendall and R. Cipolla. Modelling uncertainty in deep learning for camera relocalization. In 2016 IEEE international conference on Robotics and Automation (ICRA), pp. 4762–4769. IEEE, 2016.
- [23] A. Kendall and R. Cipolla. Geometric loss functions for camera pose regression with deep learning. In Proceedings of the IEEE conference on computer vision and pattern recognition, pp. 5974–5983, 2017.
- [24] A. Kendall, M. Grimes, and R. Cipolla. Posenet: A convolutional network for real-time 6-dof camera relocalization. In Proceedings of the IEEE international conference on computer vision, pp. 2938–2946, 2015.
- [25] H. Lim, S. N. Sinha, M. F. Cohen, and M. Uyttendaele. Real-time image-based 6-dof localization in large-scale environments. In 2012 IEEE conference on computer vision and pattern recognition, pp. 1043–1050. IEEE, 2012.
- [26] S. Lynen, T. Sattler, M. Bosse, J. A. Hesch, M. Pollefeys, and R. Siegwart. Get out of my lab: Large-scale, real-time visual-inertial localization. In Robotics: Science and Systems, vol. 1, p. 1, 2015.
- [27] W. Maddern, G. Pascoe, C. Linegar, and P. Newman. 1 year, 1000 km: The oxford robotcar dataset. The International Journal of Robotics Research, 36(1):3–15, 2017.
- [28] I. Melekhov, J. Ylioinas, J. Kannala, and E. Rahtu. Image-based localization using hourglass networks. In Proceedings of the IEEE international conference on computer vision workshops, pp. 879–886, 2017.
- [29] A. Moreau, N. Piasco, D. Tsishkou, B. Stanciulescu, and A. de La Fortelle. Coordinet: uncertainty-aware pose regressor for reliable vehicle localization. In Proceedings of the IEEE/CVF Winter Conference on Applications of Computer Vision, pp. 2229–2238, 2022.
- [30] A. Moreau, N. Piasco, D. Tsishkou, B. Stanciulescu, and A. de La Fortelle. Lens: Localization enhanced by nerf synthesis. In Conference on Robot Learning, pp. 1347–1356. PMLR, 2022.
- [31] R. Mur-Artal, J. M. M. Montiel, and J. D. Tardos. Orb-slam: a versatile and accurate monocular slam system. IEEE transactions on robotics, 31(5):1147–1163, 2015.
- [32] R. Mur-Artal and J. D. Tardós. Orb-slam2: An open-source slam system for monocular, stereo, and rgb-d cameras. IEEE transactions on robotics, 33(5):1255–1262, 2017.
- [33] T. Naseer and W. Burgard. Deep regression for monocular camera-based 6-dof global localization in outdoor environments. In 2017 IEEE/RSJ International Conference on Intelligent Robots and Systems (IROS), pp. 1525–1530. IEEE, 2017.
- [34] H. Noh, A. Araujo, J. Sim, T. Weyand, and B. Han. Large-scale image retrieval with attentive deep local features. In Proceedings of the IEEE international conference on computer vision, pp. 3456–3465, 2017.
- [35] A. Paszke, S. Gross, F. Massa, A. Lerer, J. Bradbury, G. Chanan, T. Killeen, Z. Lin, N. Gimelshein, L. Antiga, et al. Pytorch: An imperative style, high-performance deep learning library. Advances in neural information processing systems, 32, 2019.
- [36] N. Radwan, A. Valada, and W. Burgard. Vlocnet++: Deep multitask learning for semantic visual localization and odometry. IEEE Robotics and Automation Letters, 3(4):4407–4414, 2018.
- [37] P.-E. Sarlin, C. Cadena, R. Siegwart, and M. Dymczyk. From coarse to fine: Robust hierarchical localization at large scale. In Proceedings of the IEEE/CVF Conference on Computer Vision and Pattern Recognition, pp. 12716–12725, 2019.
- [38] P.-E. Sarlin, M. Dusmanu, J. L. Schönberger, P. Speciale, L. Gruber, V. Larsson, O. Miksik, and M. Pollefeys. Lamar: Benchmarking localization and mapping for augmented reality. In Computer Vision–ECCV 2022: 17th European Conference, Tel Aviv, Israel, October 23–27, 2022, Proceedings, Part VII, pp. 686–704. Springer, 2022.
- [39] T. Sattler, W. Maddern, C. Toft, A. Torii, L. Hammarstrand, E. Stenborg, D. Safari, M. Okutomi, M. Pollefeys, J. Sivic, et al. Benchmarking 6dof outdoor visual localization in changing conditions. In Proceedings of the IEEE conference on computer vision and pattern recognition, pp. 8601–8610, 2018.
- [40] T. Sattler, Q. Zhou, M. Pollefeys, and L. Leal-Taixe. Understanding the limitations of cnn-based absolute camera pose regression. In Proceedings of the IEEE/CVF conference on computer vision and pattern recognition, pp. 3302–3312, 2019.
- [41] T. Scargill, G. Premsankar, J. Chen, and M. Gorlatova. Here to stay: A quantitative comparison of virtual object stability in markerless mobile ar. In 2022 2nd International Workshop on Cyber-Physical-Human System Design and Implementation (CPHS), pp. 24–29. IEEE, 2022.
- [42] J. L. Schönberger and J.-M. Frahm. Structure-from-Motion Revisited. In Conference on Computer Vision and Pattern Recognition (CVPR), 2016.
- [43] J. L. Schonberger and J.-M. Frahm. Structure-from-motion revisited. In Proceedings of the IEEE conference on computer vision and pattern recognition, pp. 4104–4113, 2016.
- [44] Y. Shavit, R. Ferens, and Y. Keller. Learning multi-scene absolute pose regression with transformers. In Proceedings of the IEEE/CVF International Conference on Computer Vision, pp. 2733–2742, 2021.
- [45] J. Shotton, B. Glocker, C. Zach, S. Izadi, A. Criminisi, and A. Fitzgibbon. Scene coordinate regression forests for camera relocalization in rgb-d images. In Proceedings of the IEEE conference on computer vision and pattern recognition, pp. 2930–2937, 2013.
- [46] J. Sturm, N. Engelhard, F. Endres, W. Burgard, and D. Cremers. A benchmark for the evaluation of rgb-d slam systems. In 2012 IEEE/RSJ international conference on intelligent robots and systems, pp. 573–580. IEEE, 2012.
- [47] H. Taira, M. Okutomi, T. Sattler, M. Cimpoi, M. Pollefeys, J. Sivic, T. Pajdla, and A. Torii. Inloc: Indoor visual localization with dense matching and view synthesis. In Proceedings of the IEEE Conference on Computer Vision and Pattern Recognition, pp. 7199–7209, 2018.
- [48] W. Tan, H. Liu, Z. Dong, G. Zhang, and H. Bao. Robust monocular slam in dynamic environments. In 2013 IEEE International Symposium on Mixed and Augmented Reality (ISMAR), pp. 209–218. IEEE, 2013.
- [49] A. Valada, N. Radwan, and W. Burgard. Deep auxiliary learning for visual localization and odometry. In 2018 IEEE international conference on robotics and automation (ICRA), pp. 6939–6946. IEEE, 2018.
- [50] J. Valentin, A. Dai, M. Nießner, P. Kohli, P. Torr, S. Izadi, and C. Keskin. Learning to navigate the energy landscape. In 2016 Fourth International Conference on 3D Vision (3DV), pp. 323–332. IEEE, 2016.
- [51] J. Wu, L. Ma, and X. Hu. Delving deeper into convolutional neural networks for camera relocalization. In 2017 IEEE International Conference on Robotics and Automation (ICRA), pp. 5644–5651. IEEE, 2017.
- [52] H. Yu, Y. Feng, W. Ye, M. Jiang, H. Bao, and G. Zhang. Improving feature-based visual localization by geometry-aided matching. arXiv preprint arXiv:2211.08712, 2022.
- [53] F. Zangeneh, L. Bruns, A. Dekel, A. Pieropan, and P. Jensfelt. A probabilistic framework for visual localization in ambiguous scenes. arXiv preprint arXiv:2301.02086, 2023.
- [54] Z. Zhang, T. Sattler, and D. Scaramuzza. Reference pose generation for long-term visual localization via learned features and view synthesis. International Journal of Computer Vision, 129:821–844, 2021.