Non-Parametric Analysis for the Dark Matter Density Evolution
Abstract
In this paper, we investigate a potential departure in the standard dark matter density evolution law, . The method involves considering a deformed evolution model, denoted as , and searching the presence of any deviation (). As one may see, is a general function that parametrizes a digression from the standard law. We use data of baryon acoustic oscillations, type I Supernovae luminosity distances, and galaxy cluster gas mass fraction observations to reconstruct by Gaussian process regression. Unlike previous works, it enables us to investigate a possible deviation without using a specific function to describe it. We have obtained , the standard model scenario, within c.l. in all the considered cases.
pacs:
PACS-keydiscribing text of that key and PACS-keydiscribing text of that key1. Introduction
Since the discovery of accelerated expansion riess1998observational ; perlmutter1999measurements ; Weinberg_2013 , the physical origin of the mechanism driving this effect remains unknown Weinberg_2013 . In this context, the dark energy is the primary component that characterizes the standard model, known as CDM, followed by dark matter, which is responsible for the formation and dynamics of large-scale structures in the universe ozer1986possible ; sahni2004dark ; caldera2009growth . The standard model exhibits good predictive power and agrees with observations, such as the cosmic microwave background observations by the Planck satellite ade2016planck . However, despite its robustness, there are several observational discrepancies, including the tension in kamionkowski2022hubble ; Di_Valentino_2021 , the cosmological constant problem RevModPhys.61.1 ; padmanabhan2003cosmological ; Lombriser_2023 , the cosmic coincidence problem zlatev1999quintessence , among others (for a review of some tensions see Di_Valentino_2021 ; perivolaropoulos2022challenges ). Therefore, exploring alternative theories to the standard model is imperative to address these observational discrepancies and advance our understanding of the universe’s fundamental principles 2022JHEAp..34…49A .
A range of proposals to address these issues involve considering extensions to the standard model joyce2015beyond , allowing, for example, for non-gravitational interactions between the dark sector components wang2016dark . In this scenario, the dark matter and dark energy dominating the current evolution of the universe interact with each other. As their densities coevolve, a natural explanation for the coincidence problem is provided (See Amendola2000 and references therein).
Generally, interaction models follow a phenomenological motivation (despite sometimes a more fundamental argument being used Sol2011 ). Furthermore, each model is entirely independent of the others, and several models exist. Theoretically, the second law of thermodynamics and the Le Chatelier-Braun principle impose constraints on how these components interact, suggesting that dark energy decays into dark matter 2005PhRvD..72f3516A . Moreover, in the opposite scenario, the cosmic coincidence problem is exacerbated jesus2022can . Although, pereira2009can show that, assuming both fluids have different temperatures, if at least one has a non-vanishing chemical potential, the decay of dark matter into dark energy is possible. However, there is also no consensus, with results suggesting both scenarios wang2016dark . Despite the theoretical issues, a common approach is to consider phenomenological models of interaction and explore their consequences for cosmological dynamics by comparing them with observational data wang2016dark ; bolotin2015cosmological ; amendola2007 ; tamanini2015phenomenological . Many models following phenomenological arguments are observationally tested in order to capture the possible interactions among dark components, e.g., in nunes2022new , a strong constraint on the interaction is imposed through a joint analysis of the galaxy power spectrum, Baryonic Acoustic Oscillations (BAO), and Cosmic Microwave Background (CMB), this study obtains a constraint on the interaction parameter of for the considered interaction model; in Yang_2019 , BAO data indicate a preference for , implying a lower value for the matter density today; the tension in is alleviated in Lucca_2020 by employing an interaction model in analysis with Planck, BAO, and Pantheon data.
Other recent works include another approach to investigate a variation in the evolution law of matter density caused by some interaction between the components of the dark sector. In this context, the evolution law of matter density is modified phenomenologically to be (if the standard relation is recovered)111This kind of deviation was present years ago in Ref.2005CQGra..22..283W . It was shown that this simple modified dark matter expansion rate could describe almost all the vacuum decaying models.. For instance, in bora2022test , galaxy cluster data from Chandra X-ray observations and cosmic chronometers were used to put constraints on , while in Holanda_2019 Type Ia supernovae data were considered. In Bora_2021 , in addition to gas mass fraction data, strong gravitational lensing data are used (obtained from a combination of SLOAN Lens ACS, BOSS Emission-line Lens Survey, Strong Legacy Survey SL2S along with systems discovered by SLACS) to impose constraints on the same relation. As general results, these works indicated a non-interaction scenario, but not sufficient to discard this possibility entirely.
In this work, we use data of baryon acoustic oscillations within the redshift range of , type I Supernovae with redshift in the range and galaxy cluster gas mass fraction observations with redshifts in the range of to propose a new approach to investigate a possible deviation in the dark matter density evolution standard law. However, unlike Holanda_2019 ; Bora_2021 ; bora2022test , no specific function is used to parameterize such possible deviation. In this hypothesis, the evolution law of dark matter density is considered to be and the quantity is reconstructed in a non-parametric form using Gaussian process regression.
Our paper is organized as follows: Section II briefly discusses the interacting model. Section III presents a brief theoretical review of the adopted methodology, while Section IV describes the dataset used in this work. The statistical analysis is described in Section V. In Section VI, we present the results, and in Section VII, we provide a summary of the study’s main conclusions.
2. Interacting Model
Considering a homogeneous, isotropic, and flat cosmological background described by the Friedmann-Lemaître-Robertson-Walker metric (FLRW) and assuming that the cosmic budget is composed of baryons (b), dark matter (dm), radiation (r), and dark energy (de). The interacting model considers the dark matter and dark energy as interacting fluids with the energy-momentum tensor of the dark sector given by
| (1) |
The covariant conservation of energy-momentum tensor, , leads to
| (2) |
where and represent the energy density of cold dark matter and dark energy, respectively, while is the phenomenological interaction term. Note that indicates the dark energy decaying into the dark matter while implies the opposite.
The evolution of the dark components can be found by solving the system of equations (2). Generally, this can be done by assuming a form for 2005CQGra..22..283W ; 2005PhRvD..72f3516A ; marttens2019cosmological or by assuming a relation between the energy densities of the components cid2019 ; marttens2020unphysical . Since in the standard description, the dark matter density evolves as , such a model considers a deviation from the standard evolution characterized by the following function costa2010cosmological ; costa2010coupled
| (3) |
where is the today dark matter energy density calculated in and is a function that depends of redshift. Indeed, there are some parametrizations for as well as thermodynamical constraints associated with the signal of daSilva2020 . However, we relax these conditions, allowing the data to constrain the possibility of interaction in the dark sector through the Gaussian process regression for .
3. Methodology
Galaxy clusters, the largest gravitationally bound structures in the universe, hold significant potential for providing a wealth of cosmological information Allen_2011 . In recent years, their observations have been extensively utilized to conduct various cosmological tests qiu2023cosmology ; chaubal2022improving ; mantz2022cosmological ; corasaniti2021cosmological ; wu2021cosmology ; holanda2020low ; lesci2022amico . The gas mass fraction () provides important insights into the baryonic content and the physical processes occurring within galaxy clusters. It is expected that the mass fraction of galaxy clusters approximately matches the cosmic baryon fraction, , where the subindex corresponds to total matter sasaki1996new ; allen2008improved ; Allen_2011 ; holanda2020low ; mantz2022cosmological , and then, to be used to constrain cosmological parameters. In our work, we followed the modeling of the given by allen2008improved , where
| (4) |
Here, is the angular diameter distance to the galaxy cluster, is the angular diameter distance of the fiducial cosmological model used to infer the gas mass measurement ( km/sec/Mpc, and in a flat curvature). is the calibration constant, which accounts for any inaccuracies in instrument calibration, bias in measured masses due to substructure, bulk motions, and/or non-thermal pressure in the cluster gas Mantz_2014 . represents the gas depletion factor, a measurement of how much baryonic gas is thermalized within the cluster potential and thereby depleted compared to the cosmic mean battaglia2013cluster ; applegate2016cosmology ; Holanda_2017 . and are the baryonic and total mass density parameters, respectively. The stellar fraction, , represents the proportion of baryonic matter within the cluster that exists in the stellar form, comprising the mass contributed by stars.
Therefore, taking into account the proposed evolution law, such as , and that , the Eq. 4 can be reformulated in the following manner:
| (5) |
The regression method via Gaussian processes can reconstruct the behaviour in the Eq. 5 and, then, the reconstruction of becomes independent of a specific function, differently of previous works. As one may see, we have access to almost all terms on the right-hand side, except for the angular diameter distance for each cluster in the sample. We perform another reconstruction using BAO data (see the following subsection) to obtain this quantity for each galaxy cluster. In other words, using BAO data, estimating the angular distance for clusters is possible by reconstructing a non-parametric function for . The same method can be employed to obtain by using type Ia supernovae and considering the cosmic distance duality relation . Then, we can have two reconstructions to .
4. Dataset
4.1. Gas mass fraction
The gas mass fraction observations consist of 103 data on a redshift range of . Estimates of this quantity can be derived by observing and analyzing the temperature and density of the X-ray emissions emanating from the intra-cluster medium within galaxy clusters. Here, our focus lies on the measurements of within , which represents the radius of the cluster where the density of the medium exceeds 500 times the critical energy density. This dataset comprises 12 clusters at obtained from X-COP eckert2019non ; a set of 44 clusters within the range ettori2010mass ; and observations at high redshifts, consisting of 47 clusters obtained byghirardini2017evolution in the range . This dataset was curated by corasaniti2021cosmological . It is important to stress that Ref.corasaniti2021cosmological did not find a significant redshift evolution to the factor. This fact will be used here. Moreover, these samples are restricted to the most relaxed clusters in order to minimize systematic uncertainty and scatter associated with possible departures from hydrostatic equilibrium and spherical symmetry. Fig. 1 shows a plot of the sample cited.
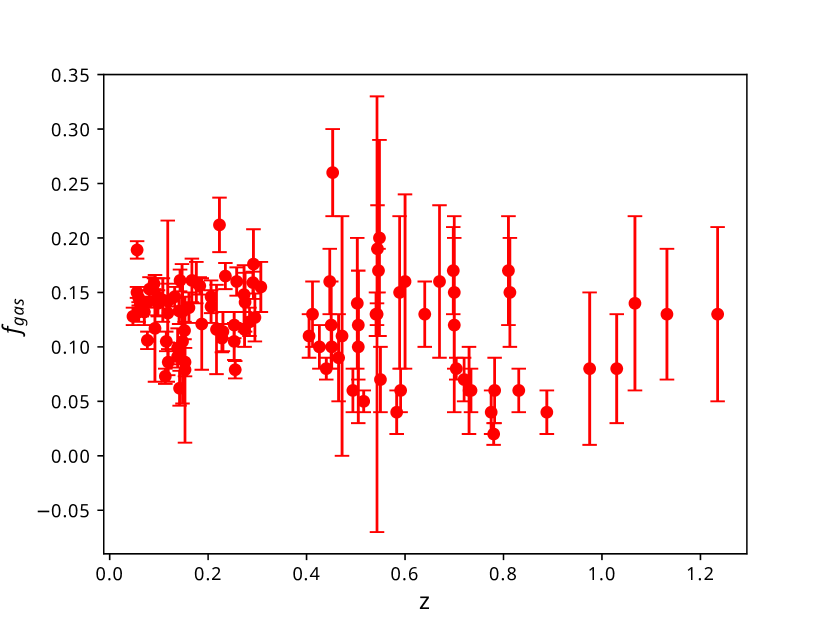
In our method, 11 clusters with were utilized to derive constraints for and . In other words, any constraint obtained with these data is not significantly sensitive to the nature of dark energy Mantz_2014 . Additionally, we can consider . Hence, Eq. 4 can be rewritten as:
| (6) |
By combining this relation with constraints on the reduced Hubble constant riess20162 , and with the value obtained from Big Bang nucleosynthesis for the quantity, cooke2018one , it is possible to derive constraints for and for each combination of and used.
4.2. Baryon acoustic oscillations
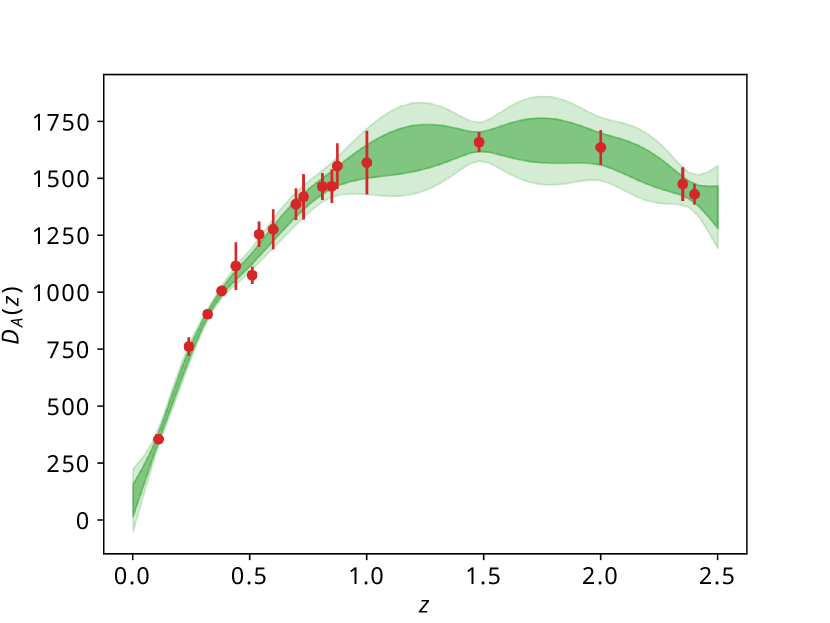
We utilize a dataset of baryon acoustic oscillations consisting of 18 samples in a redshift range of compiled by staicova2022constraining to derive the angular diameter distances of the galaxy clusters. The sound horizon distance employed is Mpc, a value obtained in late-time estimate using H0LiCOW+SN+BAO+SH0ES Arendse_2020 . Then, we reconstruct the function using Gaussian processes and estimate the angular diameter distance for each galaxy cluster. As shown in Fig. 2, the entire gas mass fraction sample falls within the redshift range of the BAO data, allowing robust estimates of . Fig. 2 shows the angular diameter distance reconstruction function. It can be observed that the reconstruction adequately covers the data points and exhibits the expected behavior for the angular distance.
4.3. Type Ia Supernovae
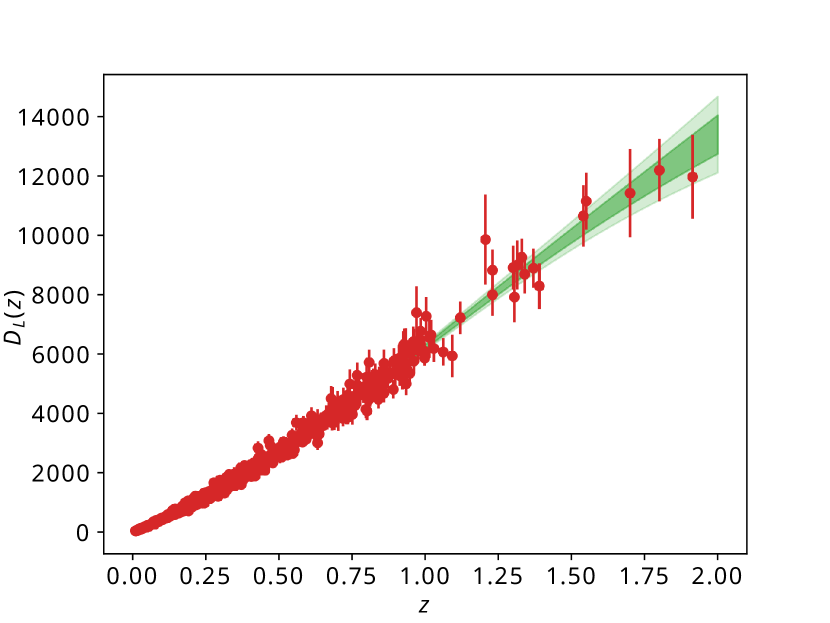
Finally, we consider the 1048 data from the Pantheon sample panteon . It is one of the largest combined samples of Supernovae, with redshift in the range . Here, we need to assume a value for the supernova absolute magnitude () to turn the distance modulus into measurements of luminosity distance. The value has been used (SH0ES team)camarena to keep our methodology independent of the cosmological model. The luminosity distance from the reconstruction function using SNe Ia data can be seen in Fig. 3. Again, it can be observed that the reconstruction adequately covers the galaxy cluster data points and exhibits the expected behavior for the luminosity distance. As commented earlier, one may obtain by using type Ia supernovae by considering the cosmic distance duality relation .
5. Priors and analysis
We employed the Markov Chain Monte Carlo (MCMC) method, specifically the Affine-Invariant Ensemble Sampler from the emcee library foreman2013emcee , to impose constraints on the parameters of Eq. 6 and obtain the values for and . The quality of the chains was analyzed using the Gelman-Rubin test gelman1992inference , with a threshold value of , and they exhibited rapid convergence.
The chosen kernel for both regressions was the Matérn kernel with , a reasonably general covariance function, multiplied by the constant kernel for scaling. For the reconstruction of , the length scale was chosen to be to avoid underfitting or overfitting due to the scattered nature of the data and its significant uncertainties.
We considered several combinations for and obtained from the literature. From the CLASH sample sereno2015comparing , we adopted the prior . From the Canadian Cluster Comparison Project (CCCP) herbonnet2020cccp ; hoekstra2015canadian , we used . A joint analysis of the Planck primary CMB, Planck-SZ number counts, Planck-thermal SZ power spectrum, and BAO provided the value as reported in salvati2018constraints . For the depletion factor, we utilized inferred from samples of The Three Hundred projecteckert2019non ; cui2018three . Another prior was obtained from the FABLE simulations henden2020baryon , where we adopted a constant value of . Finally, the value used for the stellar fraction was eckert2019non .
6. Results and discussion
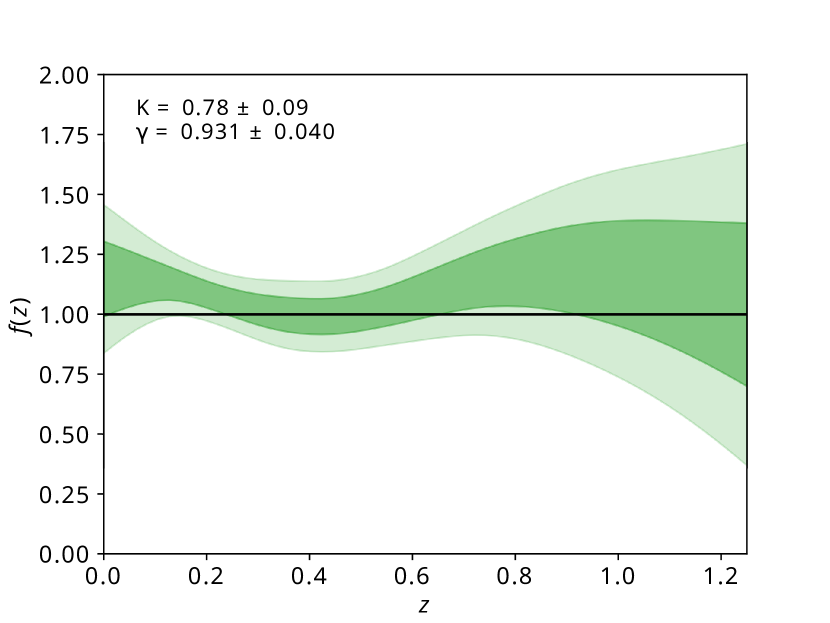
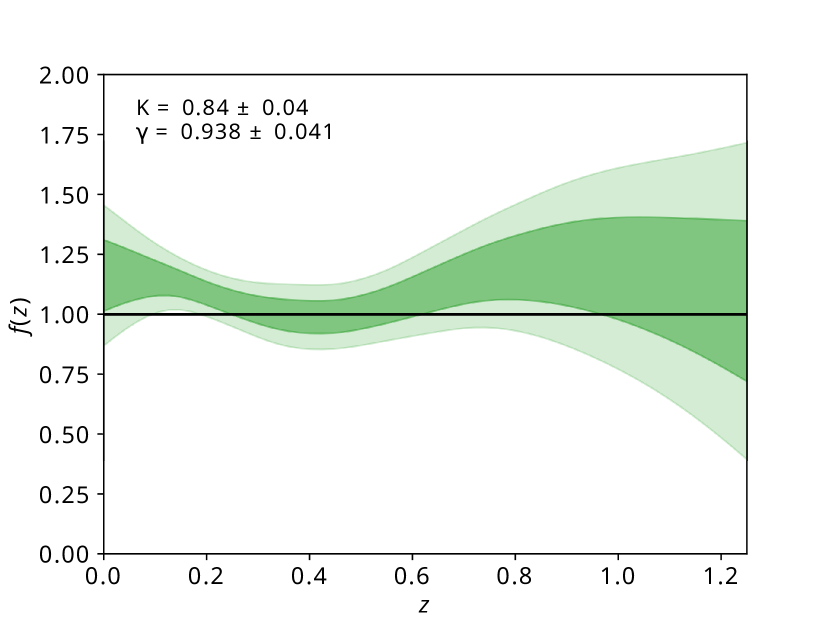
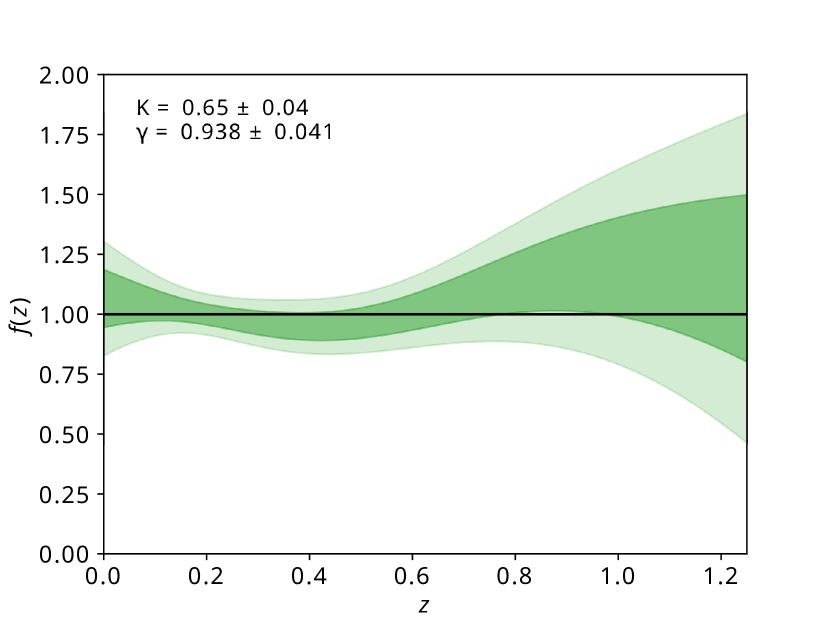
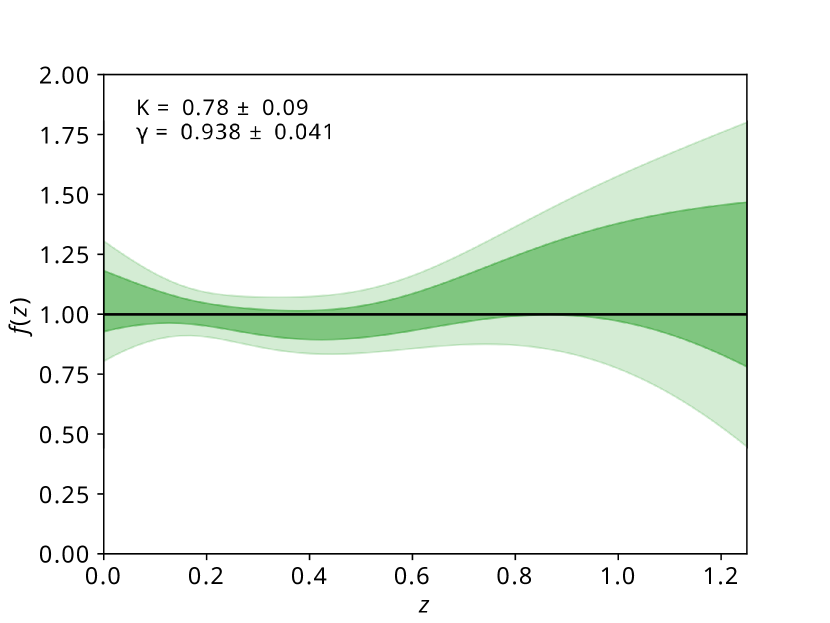
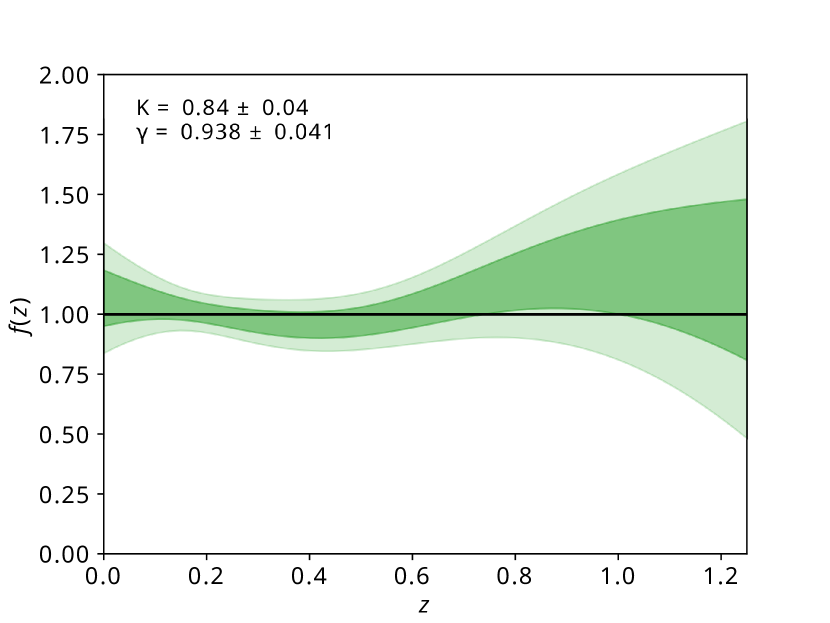
Regarding behaviour, the results are presented in Fig. 4 and Fig. 5 by using BAO data and type Ia supernovae measurements, respectively. It can be observed, for both cases, that the reconstruction aligns with , representing the case of no interaction within c.l. across the entire range of data points. The results were approximately similar for all cases considered for and parameters, indicating a weak dependence on these parameters in constraining the digression of the standard evolution law .
However, the uncertainties in the reconstruction do not allow us to exclude the scenario with a high statistical confidence level. It occurs because galaxy cluster data have relatively high uncertainties (around ). Tables 1 and 2 present values obtained from the reconstruction of for redshifts 0.3, 0.6, and 1.1 for each analysis and observable analysis.
| Combination | |||
|---|---|---|---|
| Combination | |||
|---|---|---|---|
| 0.256 | |||


7. conclusions
Several interaction models have been proposed to capture possible interactions among components of the dark sector of the universe. The interaction typically follows different parametrizations for interaction parameter (). In this paper, using only observable data and without considering any parametrization of interaction parameter , we implement the Gaussian process regression to investigate a possible interaction between dark matter and energy. Specifically, the interaction follows a possible deviation from the standard dark matter density evolution law. This possibility is investigated using galaxy cluster data, BAO measurements, and type Ia supernovae. A generic function representing this hypothesis was non-parametrically reconstructed using Gaussian process regression. For this purpose, we utilized a sample of 103 gas mass fraction data from galaxy clusters (see Fig.1), 18 Baryon Acoustic Oscillation data points (see Fig. 2), and 1048 type Ia supernovae (see Fig. 3). The BAO measurements and the type Ia supernovae luminosity distances were necessary to obtain the angular diameter distance for each galaxy cluster in a cosmological model-independent way. Naturally, the cosmic distance duality relation was used in our analysis with galaxy clusters and SNe Ia to obtain for each galaxy cluster. The BAO and SNe Ia data covered a more extensive redshift range than the data, enabling robust estimates.
We tested a set of parameter pairs ( and ) which appears in the equation for the gas mass fraction (see Sec. 3.). In all scenarios, exhibited behavior consistent within with the standard model (see Figs. 4 and 5). However, the results did not significantly rule out a potential departure from the dark matter density standard evolution.
In the coming years, there will be a significant increase in the quantity and quality of observations facilitated by instruments such as the Russian-German collaboration telescope eROSITA. This advancement will allow a more robust statistical analysis. As a result, it will be possible to obtain more conclusive results regarding the behavior of dark matter using the methodology employed in this article.
Acknowledgements.
Acknowledgements Z. C. Santana Junior acknowledges the Coordenação de Aperfeiçoamento de Pessoal de Nível Superior (CAPES) for financial support. R. F. L. Holanda and R. Silva acknowledge the financial support from the Conselho Nacional de Desenvolvimento Científico e Tecnológico (CNPq).References
- (1) A. G. Riess et al., Observational evidence from supernovae for an accelerating universe and a cosmological constant, Astron. J. 116, 1009 (1998). https://doi.org/10.1086/300499.
- (2) S. Perlmutter et al., Measurements of and from high-redshift supernovae, Astrophys. J. 517, 565 (1999). https://doi.org/10.1086/307221.
- (3) D. H. Weinberg, M. J. Mortonson, D. J. Eisenstein, C. Hirata, A. G. Riess, E. Rozo, Observational probes of cosmic acceleration, Phys. Rep. 530, 87 (2013). https://doi.org/10.1016/j.physrep.2013.05.001.
- (4) M. Özer, M. O. Taha, A possible solution to the main cosmological problems, Phys. Lett. B 171, 363 (1986). https://doi.org/10.1016/0370-2693(86)91421-8.
- (5) V. Sahni, Dark matter and dark energy, The Physics of the Early Universe, 141 (2004). https://doi.org/10.1007/978-3-540-31535-3_5.
- (6) G. Caldera-Cabral, R. Maartens, B. M. Schaefer, The growth of structure in interacting dark energy models, J. Cosmol. Astropart. Phys. 07, 027 (2009). https://doi.org/10.1088/1475-7516/2009/07/027.
- (7) P. A. Ade et al., Planck 2015 results-xiii. cosmological parameters, Astron. Astrophys. 594, A13 (2016) . https://doi.org/10.1051/0004-6361/201525830.
- (8) M. Kamionkowski, A. G. Riess, The Hubble tension and early dark energy, arXiv preprint arXiv:2211.04492.
- (9) E. Di Valentino et al., In the realm of the Hubble tension—a review of solutions, Class. Quantum Gravity 38, 153001 (2021). https://doi.org/10.1088/1361-6382/ac086d.
- (10) S. Weinberg, The cosmological constant problem, Rev. Mod. Phys. 61, 1 (1989). https://doi.org/10.1103/RevModPhys.61.1.
- (11) T. Padmanabhan, Cosmological constant—the weight of the vacuum, Phys. Rep. 380 235 (2003). https://doi.org/10.1016/S0370-1573(03)00120-0.
- (12) L. Lombriser, Cosmology in Minkowski space, Class. Quantum Gravity, (2023). https://doi.org/10.1088/1361-6382/acdb41.
- (13) I. Zlatev, L. Wang, P. J. Steinhardt, Quintessence, cosmic coincidence, and the cosmological constant, Phys. Rev. Lett. 82, 896 (1999). https://doi.org/10.1103/PhysRevLett.82.896.
- (14) L. Perivolaropoulos, F. Skara, Challenges for CDM: An update, New Astron. Rev. 95, 101659 (2022). https://doi.org/10.1016/j.newar.2022.101659.
- (15) E. Abdalla et al., Cosmology intertwined: A review of the particle physics, astrophysics, and cosmology associated with the cosmological tensions and anomalies, J. High Energy Phys. 34, 49 (2022). https://doi.org/10.1016/j.jheap.2022.04.002.
- (16) A. Joyce, B. Jain, J. Khoury, M. Trodden, Beyond the cosmological standard model, Phys. Rep. 568, 1 (2015). https://doi.org/10.1016/j.physrep.2014.12.002.
- (17) B. Wang, E. Abdalla, F. Atrio-Barandela, D. Pavon, Dark matter and dark energy interactions: theoretical challenges, cosmological implications and observational signatures, Rep. Prog. Phys. 79, 096901 (2016). https://doi.org/10.1088/0034-4885/79/9/096901.
- (18) L. Amendola, Coupled quintessence, Phys. Rev. D 62, 043511 (2000). https://doi.org/10.1103/PhysRevD.62.043511.
- (19) Joan Solà, Cosmologies with a time dependent vacuum, Journal of Physics: Conference Series 283, 012033 (2011). https://doi.org/10.1088/1742-6596/283/1/012033
- (20) J. S. Alcaniz, J. A. S. D. Lima, Interpreting cosmological vacuum decay, Phys. Rev. D 72, 063516 (2005). https://doi.org/10.1103/PhysRevD.72.063516.
- (21) J. F. Jesus, A. A. Escobal, D. Benndorf, S. H. Pereira, Can dark matter–dark energy interaction alleviate the cosmic coincidence problem?, Eur. Phys. J. C. 82, 273 (2022). https://doi.org/10.1140/epjc/s10052-022-10234-y.
- (22) S. H. Pereira, J. F. Jesus, Can dark matter decay in dark energy?, Phys. Rev. D 79, 043517 (2009). https://doi.org/10.1103/PhysRevD.79.043517.
- (23) Y. L. Bolotin, A. Kostenko, O. A. Lemets, D. A. Yerokhin, Cosmological evolution with interaction between dark energy and dark matter, Int. J. Mod. Phys. D 24, 1530007 (2015). https://doi.org/10.1142/S0218271815300074.
- (24) L. Amendola, G. C. Campos, R. Rosenfeld, Consequences of dark matter-dark energy interaction on cosmological parameters derived from type Ia supernova data, Phys. Rev. D 75, 083506 (2007). https://doi.org/10.1103/PhysRevD.75.083506.
- (25) N. Tamanini, Phenomenological models of dark energy interacting with dark matter, Phys. Rev. D 92, 043524 (2015). https://doi.org/10.1103/PhysRevD.92.043524.
- (26) R. C. Nunes, S. Vagnozzi, S. Kumar, E. Di Valentino, O. Mena, New tests of dark sector interactions from the full-shape galaxy power spectrum, Phys. Rev. D 105, 123506 (2022). https://doi.org/10.1103/PhysRevD.105.123506.
- (27) W. Yang, O. Mena, S. Pan, E. Di Valentino, Dark sectors with dynamical coupling, Phys. Rev. D 100, 083509 (2019). https://doi.org/10.1103/PhysRevD.100.083509
- (28) M. Lucca, D. C. Hooper, Shedding light on dark matter-dark energy interactions, Phys. Rev. D 102, 123502 (2020). https://doi.org/10.1103/PhysRevD.102.123502
- (29) P. Wang, X. H. Meng, Can vacuum decay in our universe?, Class Quantum Gravity. 22, 283 (2004). https://doi.org/10.1088/0264-9381/22/2/003.
- (30) K. Bora, R. F. L. Holanda, S. Desai, S. H. Pereira, A test of the standard dark matter density evolution law using galaxy clusters and cosmic chronometers, Eur. Phys. J. C 82, 17 (2022). https://doi.org/10.1140/epjc/s10052-022-09987-3.
- (31) R. F. L. Holanda, R. S. Gonçalves, J. E. Gonzalez, J. S. Alcaniz, An estimate of the dark matter density from galaxy clusters and supernovae data, J. Cosmol. Astropart. Phys. 2019, 032 (2019). https://doi.org/10.1088/1475-7516/2019/11/032.
- (32) K. Bora, R. F. L. Holanda, S. Desai, Probing the dark matter density evolution law with large scale structures, Eur. Phys. J. C 81, 1 (2021). https://doi.org/10.1140/epjc/s10052-021-09421-0.
- (33) R. Von marttens, L. Casarini, D.mota, W. Zilmdahl, Cosmological constraints on parametrized interacting dark energy, Phys. Dark Univ. 23, 100248 (2019). https://doi.org/10.1016/j.dark.2018.10.007.
- (34) A. Cid, B. Santos, C. Pigozzo, T. Ferreira, J. Alcaniz, Bayesian comparison of interacting scenarios, J. Cosmol. Astropart. Phys. 2019, 030 (2019). https://doi.org/10.1088/1475-7516/2019/03/030.
- (35) R. von Marttens, H. A. Borges, S. Carneiro, J. S. Alcaniz, W. Zimdahl, Unphysical properties in a class of interacting dark energy models, Eur. Phys. J. C 80, 1110 (2020). https://doi.org/10.1140/epjc/s10052-020-08682-5.
- (36) F. E. M. Costa, J. S. Alcaniz, Cosmological consequences of a possible -dark matter interaction, Phys. Rev. D 81, 043506 (2010). https://doi.org/10.1103/PhysRevD.81.043506.
- (37) F. E. M. Costa, Coupled quintessence with a possible transient accelerating phase,Phys. Rev. D 82, 103527 (2010). https://doi.org/10.1103/PhysRevD.82.103527.
- (38) W. J. C. da Silva and J. E. Gonzalez and R. Silva and J. S. Alcaniz, Thermodynamic constraints on the dark sector, Eur. Phys. J. Plus 135, 11 (2022). https://doi.org/10.1140/epjp/s13360-020-00939-y.
- (39) S. W. Allen, A. E. Evrard, A. B. Mantz, Cosmological parameters from observations of galaxy clusters, Annu. Rev. Astron. Astrophys. 49, 409 (2011). https://doi.org/10.1146/annurev-astro-081710-102514.
- (40) L. Qiu, N. R. Napolitano, S. Borgani, et al., Cosmology with Galaxy Cluster Properties using Machine Learning, arXiv preprint arXiv:2304.09142 (2023).
- (41) P. S. Chaubal, C. L. Reichardt, N. Gupta, et al., Improving cosmological constraints from galaxy cluster number counts with CMB-cluster-lensing data: Results from the SPT-SZ survey and forecasts for the future, Astrophys. J. 931, 139 (2022). https://doi.org/10.3847/1538-4357/ac6a55.
- (42) A. B. Mantz, et al., Cosmological constraints from gas mass fractions of massive, relaxed galaxy clusters, Mon. Notices Royal Astron. Soc. 510, 131 (2022). https://doi.org/10.1093/mnras/stab3390.
- (43) P. S. Corasaniti, M. Sereno, S. Ettori, Cosmological constraints from galaxy cluster sparsity, cluster gas mass fraction, and baryon acoustic oscillation data, Astrophys. J. 911, 82 (2021). https://doi.org/10.3847/1538-4357/abe9a4.
- (44) H. Y. Wu, D. H. Weinberg, A. N. Salcedo, B. D. Wibking, Cosmology with galaxy cluster weak lensing: statistical limits and experimental design, Astrophys. J. 910, 28 (2021). https://doi.org/10.3847/1538-4357/abdc23.
- (45) R. F. L. Holanda, G. Pordeus-da-Silva, S. H. Pereira, A low Hubble constant from galaxy distribution observations, J. Cosmol. Astropart. Phys. 2020, 053 (2020). https://doi.org/10.1088/1475-7516/2020/09/053.
- (46) G. F. Lesci, et al., AMICO galaxy clusters in KiDS-DR3: Constraints on cosmological parameters and on the normalization of the mass-richness relation from clustering, Astron. Astrophys. 665, A100 (2022). https://doi.org/10.1051/0004-6361/202243538.
- (47) S. Sasaki, A new method to estimate cosmological parameters using the baryon fraction of clusters of galaxies, Publ. Astron. Soc. Jpn. 48, L119 (1996). https://doi.org/10.1093/pasj/48.6.L119.
- (48) S. W. Allen, D. A. Rapetti, R. W. Schmidt, H. Ebeling, R. G. Morris, A. C. Fabian, Improved constraints on dark energy from Chandra X-ray observations of the largest relaxed galaxy clusters, Mon. Notices Royal Astron. 383, 879 (2008). https://doi.org/10.1111/j.1365-2966.2007.12610.x.
- (49) A. B. Mantz, S. W. Allen, R. G. Morris, D. A. Rapetti, D. E. Applegate, P. L. Kelly, …, R. W. Schmidt, Cosmology and astrophysics from relaxed galaxy clusters–II. Cosmological constraints, Mon. Notices Royal Astron. 440, 2077 (2014). https://doi.org/10.1093/mnras/stu368.
- (50) N. Battaglia, J. R. Bond, C. Pfrommer, J. L. Sievers, On the cluster physics of Sunyaev-Zel’dovich and X-ray surveys. III. Measurement biases and cosmological evolution of gas and stellar mass fractions, Astrophys. J. 777, 123 (2013). https://doi.org/10.1088/0004-637X/777/2/123.
- (51) D. E. Applegate, A. Mantz, S. W. Allen, A. van der Linden, R. G. Morris, S. Hilbert, R. W. Schmidt, Cosmology and astrophysics from relaxed galaxy clusters–IV. Robustly calibrating hydrostatic masses with weak lensing, Mon. Notices Royal Astron. Soc. 457, 1522 (2016). https://doi.org/10.1093/mnras/stw005.
- (52) R. F. L. Holanda, V. C. Busti, J. E. Gonzalez, F. Andrade-Santos, J. S. Alcaniz, Cosmological constraints on the gas depletion factor in galaxy clusters, J. Cosmol. Astropart. Phys. 2017, 016 (2017). https://doi.org/10.1088/1475-7516/2017/12/016.
- (53) D. Eckert, et al., Non-thermal pressure support in X-COP galaxy clusters, Astron. Astrophys. 621, A40 (2019). https://doi.org/10.1051/0004-6361/201833324.
- (54) S. Ettori, F. Gastaldello, A. Leccardi, S. Molendi, M. Rossetti, D. Buote, Mass profiles and c-MDM relation in X-ray luminous galaxy clusters, Astron. Astrophys. 524, A68 (2010). https://doi.org/10.1051/0004-6361/201015271.
- (55) V. Ghirardini, et al., On the evolution of the entropy and pressure profiles in X-ray luminous galaxy clusters at z > 0.4, Astron. Astrophys. 604, A100 (2017). https://doi.org/10.1051/0004-6361/201630209.
- (56) A. G. Riess, et al., A 2.4% determination of the local value of the Hubble constant, Astrophys. J. 826, 56 (2016). https://doi.org/10.3847/0004-637X/826/1/56.
- (57) R. J. Cooke, M. Pettini, C. C. Steidel, One percent determination of the primordial deuterium abundance, Astrophys. J. 855, 102 (2018). https://doi.org/10.3847/1538-4357/aaab53.
- (58) D.Staicova, D.Benisty, Constraining the dark energy models using baryon acoustic oscillations: An approach independent of , Astron. Astrophys. 668 A135 (2022). https://doi.org/10.1051/0004-6361/202244366.
- (59) N. Arendse, R. J. Wojtak, A. Agnello, G. C. F. Chen, C. D. Fassnacht, D. Sluse, et al., Cosmic dissonance: are new physics or systematics behind a short sound horizon?, Astron. Astrophys. 639, A57 (2020). https://doi.org/10.1051/0004-6361/201936720.
- (60) D. M. Scolnic, et al., The Complete Light-curve Sample of Spectroscopically Confirmed SNe Ia from Pan-STARRS1 and Cosmological Constraints from the Combined Pantheon Sample, Astrophys. J. 859, 2 (2018).
- (61) D. Camarena and V. Marra, On the use of the local prior on the absolute magnitude of Type Ia supernovae in cosmological inference, 504, 5164 (2021) .
- (62) D. Foreman-Mackey, et al., emcee: the MCMC hammer, Publ. Astron. Soc. Pac. 125, 306 (2013). https://doi.org/10.1086/670067.
- (63) A. Gelman, D. B. Rubin, Inference from iterative simulation using multiple sequences, Stat. Sci. 7, 457 (1992). https://doi.org/10.1214/ss/1177011136.
- (64) M. Sereno, S. Ettori, Comparing masses in literature (CoMaLit)–I. Bias and scatter in weak lensing and X-ray mass estimates of clusters, Mon. Notices Royal Astron. Soc. 450, 3633 (2015). https://doi.org/10.1093/mnras/stv810.
- (65) R. Herbonnet et al., CCCP and MENeaCS: (updated) weak-lensing masses for 100 galaxy clusters, Mon. Notices Royal Astron. Soc. 497, 4684 (2020). https://doi.org/10.1093/mnras/staa2303.
- (66) H. Hoekstra et al., The Canadian Cluster Comparison Project: detailed study of systematics and updated weak lensing masses, Mon. Notices Royal Astron. Soc. 449, 685 (2015). https://doi.org/10.1093/mnras/stv275.
- (67) L. Salvati, M. Douspis, N. Aghanim, Constraints from thermal Sunyaev-Zel’dovich cluster counts and power spectrum combined with CMB, Astron. Astrophys. 614, A13 (2018). https://doi.org/10.1051/0004-6361/201731990.
- (68) W. Cui, et al., The Three Hundred project: a large catalogue of theoretically modelled galaxy clusters for cosmological and astrophysical applications, Mon. Notices Royal Astron. Soc. 480, 2898 (2018). https://doi.org/10.1093/mnras/sty2111.
- (69) N. A. Henden, E. Puchwein, D. Sijacki, The baryon content of groups and clusters of galaxies in the FABLE simulations, Mon. Notices Royal Astron. Soc. 498, 2114 (2020). https://doi.org/10.1093/mnras/staa2235.