Kairos: Practical Intrusion Detection and Investigation
using Whole-system Provenance
Abstract
Provenance graphs are structured audit logs that describe the history of a system’s execution. Recent studies have explored a variety of techniques to analyze provenance graphs for automated host intrusion detection, focusing particularly on advanced persistent threats. Sifting through their design documents, we identify four common dimensions that drive the development of provenance-based intrusion detection systems (PIDSes): scope (can PIDSes detect modern attacks that infiltrate across application boundaries?), attack agnosticity (can PIDSes detect novel attacks without a priori knowledge of attack characteristics?), timeliness (can PIDSes efficiently monitor host systems as they run?), and attack reconstruction (can PIDSes distill attack activity from large provenance graphs so that sysadmins can easily understand and quickly respond to system intrusion?). We present Kairos, the first PIDS that simultaneously satisfies the desiderata in all four dimensions, whereas existing approaches sacrifice at least one and struggle to achieve comparable detection performance.
Kairos leverages a novel graph neural network based encoder-decoder architecture that learns the temporal evolution of a provenance graph’s structural changes to quantify the degree of anomalousness for each system event. Then, based on this fine-grained information, Kairos reconstructs attack footprints, generating compact summary graphs that accurately describe malicious activity over a stream of system audit logs. Using state-of-the-art benchmark datasets, we demonstrate that Kairos outperforms previous approaches.
Note: This is a preprint version of the paper accepted at the 45th IEEE Symposium on Security and Privacy (S&P’24) [1].
1 Introduction
Recent work on intrusion detection [2, 3, 4, 5, 6, 7, 8] uses kernel-level causal dependency graphs, or provenance graphs, to combat today’s increasingly sophisticated system intrusions, such as advanced persistent threats (APTs) [9]. These graphs, constructed from system-level logs, describe interactions (represented by edges) between kernel objects (represented by nodes), such as processes, files, and sockets, to structurally represent the history of a system’s execution.
Various aspects govern the design of prior provenance-based intrusion detection systems (PIDSes). In particular, we identify four key dimensions of PIDSes emerging from a large body of work in this line of research:
Scope: System provenance tracks an entire system’s activity, as well as cross-host interactions through sockets [10]. Leveraging provenance’s system-wide visibility, PIDSes that scale to a network of systems are better equipped to detect intrusions that span multiple applications and hosts [3].
Attack Agnosticity: As zero-day exploits (i.e., malware or vulnerabilities that are not known by security analysts) become increasingly common [11], PIDSes can better generalize to detect new attacks if they do not rely on any attack signatures or signals known a priori. Security practitioners have repeatedly discovered new attacks that easily bypass signal-based detectors deployed in the wild [12, 13]. In contrast, anomaly-based PIDSes [6, 2, 14] extract distinguishing features from graphs of known benign system execution and use these features to determine whether a system is under attack. These PIDSes not only outperform non-provenance-based approaches (e.g., log analysis [15, 16]), but more importantly, demonstrate great detection performance in the face of unknown attacks. This is because system provenance provides rich contextual information (both spatial and temporal) through its dynamic graph topology. Such contexts separate a benign system event from a malicious event, even if they look almost identical in isolation [2]. For example, repeated connections to a system (represented spatially in a provenance graph as a large number of edges connected to socket nodes) in a short period of time (rapid temporal changes in the graph) could suggest a DoS attack, which might differ significantly from a graph describing legitimate socket connections.
Timeliness: A provenance graph evolves to record system activity as the system runs. PIDSes that analyze the graph in a streaming fashion [2] as it evolves provide more timely protection than offline systems [17] that introduce delays between provenance capture and threat detection.
Attack Reconstruction: System provenance is instrumental in understanding intrusions [18, 19]. We can reason about chains of events that could have led to an intrusion and the potential damage inflicted on the system by the intrusion by navigating back and forth along the edges in the graph. However, it is impractical to manually investigate the entire graph, given the large size of a typical provenance graph and the fast growth rate of the graph over time [10]. Instead, more practical PIDSes provide minimum graph data that reconstructs attack scenarios through the dependencies between kernel objects. Such PIDSes can greatly reduce the manual effort, enabling sysadmins to quickly understand an intrusion and devise a timely response. For example, Holmes [3] correlates edges that match the behavior of known attacks to identify APTs and uses the subgraphs of the correlated edges to facilitate attack comprehension.
Unfortunately, no existing PIDSes achieve the desiderata simultaneously in all four dimensions. Solutions meeting the first three properties [20, 21, 2, 7, 8] provide little information to help sysadmins understand their decisions and reconstruct the attack, while systems satisfying the last either consider single applications [5, 14], detect only known attacks [3, 22, 17], or require offline analysis [17].
We introduce Kairos, the first PIDS that fulfills all four desiderata while achieving high detection performance. It leverages fine-grained, temporal-spatial graph learning that scales to provenance graphs of a network of systems to monitor run-time system behavior. Specifically, Kairos quantifies the degree of anomalousness for individual edges (i.e., system events) as they appear in the streaming graph, based on how much the historical behavioral patterns of their corresponding nodes (i.e., system entities) deviate from the patterns learned from known benign executions in the past. Kairos’ graph analysis is highly contextualized, taking into account dynamic changes (i.e., temporality) of the edges surrounding a node and the node’s neighborhood structure (i.e., spatiality). Edge-level anomalousness provides the basis for a graph-level causality analysis that Kairos performs periodically at run time. This analysis correlates only highly anomalous edges based on information flow and constructs compact but meaningful summary graphs from original provenance graphs to fully and concisely describe attack scenarios (like the one shown in Fig. 1), without any a priori knowledge of attack characteristics.
We evaluate Kairos on recent, publicly available benchmark datasets from DARPA that simulate APT campaigns, as well as datasets that allow us to fairly compare Kairos with state-of-the-art open-source PIDSes, Unicorn [2] and ThreaTrace [8]. Our results show that Kairos achieves high detection accuracy, outperforming both systems while incurring low computational and memory overhead. More importantly, Kairos accurately reconstructs attack footprints, significantly reducing the number of graph edges that sysadmins must inspect to understand an attack. Kairos is available online at https://github.com/ProvenanceAnalytics/kairos.
2 Background & Motivation
We introduce the concept of system-level data provenance in § 2.1. In § 2.2, we use a real attack scenario from DARPA to motivate our design.
2.1 System-level Data Provenance
System-level data provenance records data flows between kernel-level objects, e.g., processes, files, and sockets. Data provenance can be represented as a directed graph, called a provenance graph, where nodes represent kernel-level objects and edges represent various types of interactions (i.e., dependency relationships) between these objects. These interactions are typically the results of system calls. Fig. 1 shows an example of a provenance graph.
We can capture system-level data provenance using kernel event logging mechanisms, such as Windows ETW and Linux Audit, that are natively supported by different operating systems. Alternatively, specialized in-kernel reference monitors, such as Hi-Fi [23] and CamFlow [10], track fine-grained data flows between low-level kernel abstractions (e.g., inodes and processes) to capture data provenance.
Kairos is agnostic to the underlying provenance capture mechanism, analyzing all kernel interactions of an entire network of systems. This whole-system (rather than application-specific) visibility is particularly crucial in detecting modern sophisticated intrusions such as APTs, because APTs often infect multiple applications on a single host and migrate from one infected host to another.
2.2 A Motivating Example
We use a large-scale APT campaign simulated by DARPA [24] to illustrate the challenges faced by existing PIDSes along the four desiderata (§ 1). For comparison, we briefly describe Kairos’ output in this scenario at the end. In § 4, we provide an in-depth discussion of Kairos’ design, and in § 5, we give details of this experiment (among others).
2.2.1 Scenario (Fig. 1)
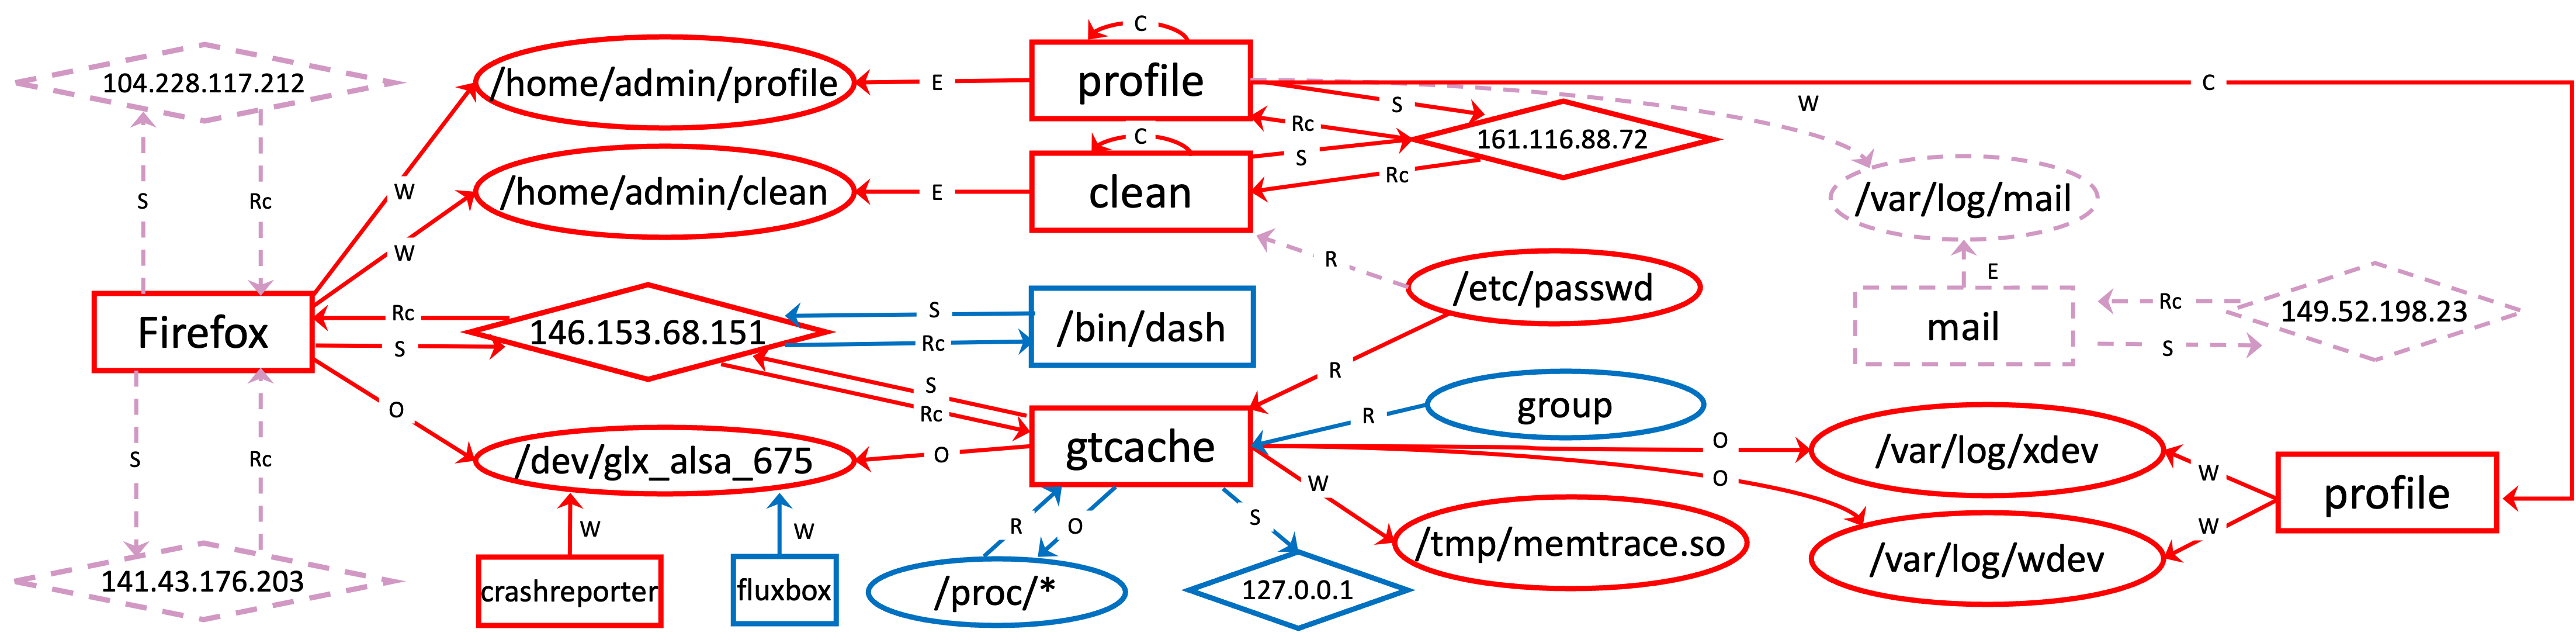
The attacker leverages a Firefox vulnerability to establish a foothold on a victim machine, which enables the attacker to write a malicious payload called clean to /home/admin/ on disk. The attacker then executes the payload with escalated privileges. This new attack process (with root privileges) communicates with the attacker’s command-and-control (C&C) server at 161.116.88.72 to download and execute another malicious payload called profile, again with root privileges. profile, in turn, fetches a third payload called xdev from the C&C server and stores the payload in /var/log/. profile and xdev lurk in the victim host to prepare for subsequent attacks. A few days later, the attacker uses profile to inject malicious code in the mail process and executes mail with root privileges. mail then performs port scans of all known hosts on the victim’s network.
2.2.2 Challenges
APTs stealthily infiltrate their targeted systems and maintain their presence in victim hosts for extended periods of time, exhibiting a unique low-and-slow attack pattern. During the lifecycle of an APT, it is common for attackers to leverage various zero-day exploits, some of which might even be tailored to the targeted victim systems [25]. Because of these characteristics, existing PIDSes are forced to make the following trade-offs:
Attack Agnosticity: APTs’ low-and-slow attack pattern makes anomaly-based detection difficult, because attack activity can hide among a large amount of benign activity and appear similar to normal behavior if execution context is not sufficiently considered [2]. For instance, in our scenario, among million log entries, we identify approximately only entries related to the attack, which make up merely of the entire log. To circumvent this challenge, PIDSes such as Holmes [3] and RapSheet [22] use existing threat intelligence knowledge to manually craft graph-matching rules that indicate the presence of an APT. However, as new exploits continue to surface, they must constantly update their knowledge base to include additional rules. By construction, they will always lag behind sophisticated adversaries launching previously unknown attacks.
Attack Reconstruction: PIDSes such as Unicorn [2] and ThreaTrace [8] take an anomaly-based approach to detecting system activity that deviates significantly from known benign behavior. While they require no a priori knowledge of APT characteristics (unlike Holmes), their detection provides little information to help sysadmins understand the attack. Consequently, forensic investigation that follows typically involves prolonged manual inspection of large provenance graphs. For example, Unicorn reduces a provenance graph to a compact feature vector to model system behavior, but an anomalous feature vector corresponds to an entire provenance graph. In our example, sysadmins must sift through millions of edges to identify the attack activity. ThreaTrace, on the other hand, pinpoints only anomalous nodes (e.g., the Firefox and clean process nodes in Fig. 1) that might be involved in the attack. While these nodes can be useful starting points, sysadmins still need to manually trace through thousands of edges to understand the complete attack story. ThreaTrace recognizes this limitation and acknowledges the gap between anomaly-based detection and attack construction. Kairos fills this gap.
Scope: PIDSes such as Winnower [5] construct benign graph templates to highlight anomalous subgraphs that do not fit into the templates. While this facilitates forensic analysis, Winnower is unsuitable for APT detection, because it cannot scale to large graphs. Rather, Winnower focuses on an application-wide scope and analyzes much smaller provenance graphs than the ones that can realistically describe whole-system activity under APTs. As such, we must run at a minimum multiple instances of Winnower targeting various applications (e.g., Firefox and mail) to potentially detect the APT in our scenario. In practice, a workstation could run many dozens of applications, all of which must be individually monitored by Winnower, since we do not know a priori what application(s) would be involved in an APT. However, even then, it is unclear whether Winnower’s isolated, application-centered approach would be effective. This is because inter-process information flows are critical to detecting APTs [2], but Winnower is oblivious to them. Like Winnower, SIGL [14] limits its detection to anomalies during software installations; therefore, it also cannot analyze a provenance graph of millions of edges in our scenario. Moreover, like ThreaTrace, SIGL pinpoints only anomalous nodes, thus incapable of reconstructing attack activity.
Timeliness: Timely APT detection and forensic analysis is important to quickly identify the attack and take remedial actions. PIDSes such as Poirot [17] match complex graph signatures, each describing the behavior of a specific malware program. This expedites threat understanding after a threat is matched. However, even if we dismiss the issue of attack agnosticity, Poirot’s matching process is slow and thus unsuitable for run-time detection, for two reasons. First, Poirot takes minutes to search for each signature in a provenance graph. Therefore, the approach cannot scale as the number of signatures grows. Second, matching only succeeds if a malware program exhibits its complete behavior as described in the signature. As such, Poirot must repeatedly try to match the same graph signatures as the graph evolves over time, which exacerbates the scaling issue even further.
2.2.3 Kairos’ Result
Kairos accurately identifies the attack and reconstructs the APT scenario at run time without relying on any a priori attack knowledge, even though the malicious activity blends in with the benign activity in the background. Note that the size of the logs capturing the benign activity is several orders of magnitude larger. Fig. 1 shows the attack summary graph automatically generated by Kairos from the original provenance graph that describes whole-system host behavior (of all participating hosts).
The provenance data in this scenario is captured by THEIA [26], which performs system-wide audit to track fine-grained information flow between kernel-level entities. Kairos analyzes THEIA’s audit data to monitor all applications running on victim hosts (scope). Kairos’ model is trained only on benign system behavior that is observed before the APT campaign is launched (attack agnosticity). As the attack slowly unfolds, Kairos gradually constructs the graph we see in Fig. 1, as highly-anomalous edges that are deemed relevant to the attack appear in the provenance graph (timeliness). This compact graph succinctly describes the attack, summarizing the malicious activity extracted from the anomalous edges for clarity. The original graph contains million edges and nodes; in contrast, Kairos’ summary graph contains only edges and nodes. More importantly, Kairos’ output almost perfectly aligns with the ground truth of our experiment, which is provided by DARPA alongside the dataset [24]. This helps sysadmins quickly understand the APT attack (attack reconstruction).
3 Threat Model
Similar to prior PIDSes [2, 27, 3, 17], our work considers attackers attempting to take control of a system and maintain a persistent presence by e.g., exploiting software vulnerabilities and deploying communication backdoors. However, we do not consider hardware-level, side-channel, or covert-channel attacks, since their behavior is typically not explicitly captured by kernel-level audit systems. Kairos is an anomaly-based detection system; therefore, we further assume that host systems are not under the influence of an attacker when Kairos learns from provenance graphs of benign system execution and that Kairos thoroughly observes system activity during this initial learning period. If system behavior changes in the future (or if Kairos did not fully observe all benign behavior), concept drift might occur [28]. While we exclude concept drift from our threat model, as is standard in anomaly-based detectors [14, 8], we show empirically how Kairos can mitigate this issue in § 5.2.
Our trusted computing base (TCB) includes the underlying OS, the audit framework, and Kairos’ analysis code, which is also standard among existing PIDSes. As such, we do not consider kernel-level attacks and assume the use of existing system hardening techniques to mitigate any potential audit framework compromise [29, 10].
4 Kairos Framework
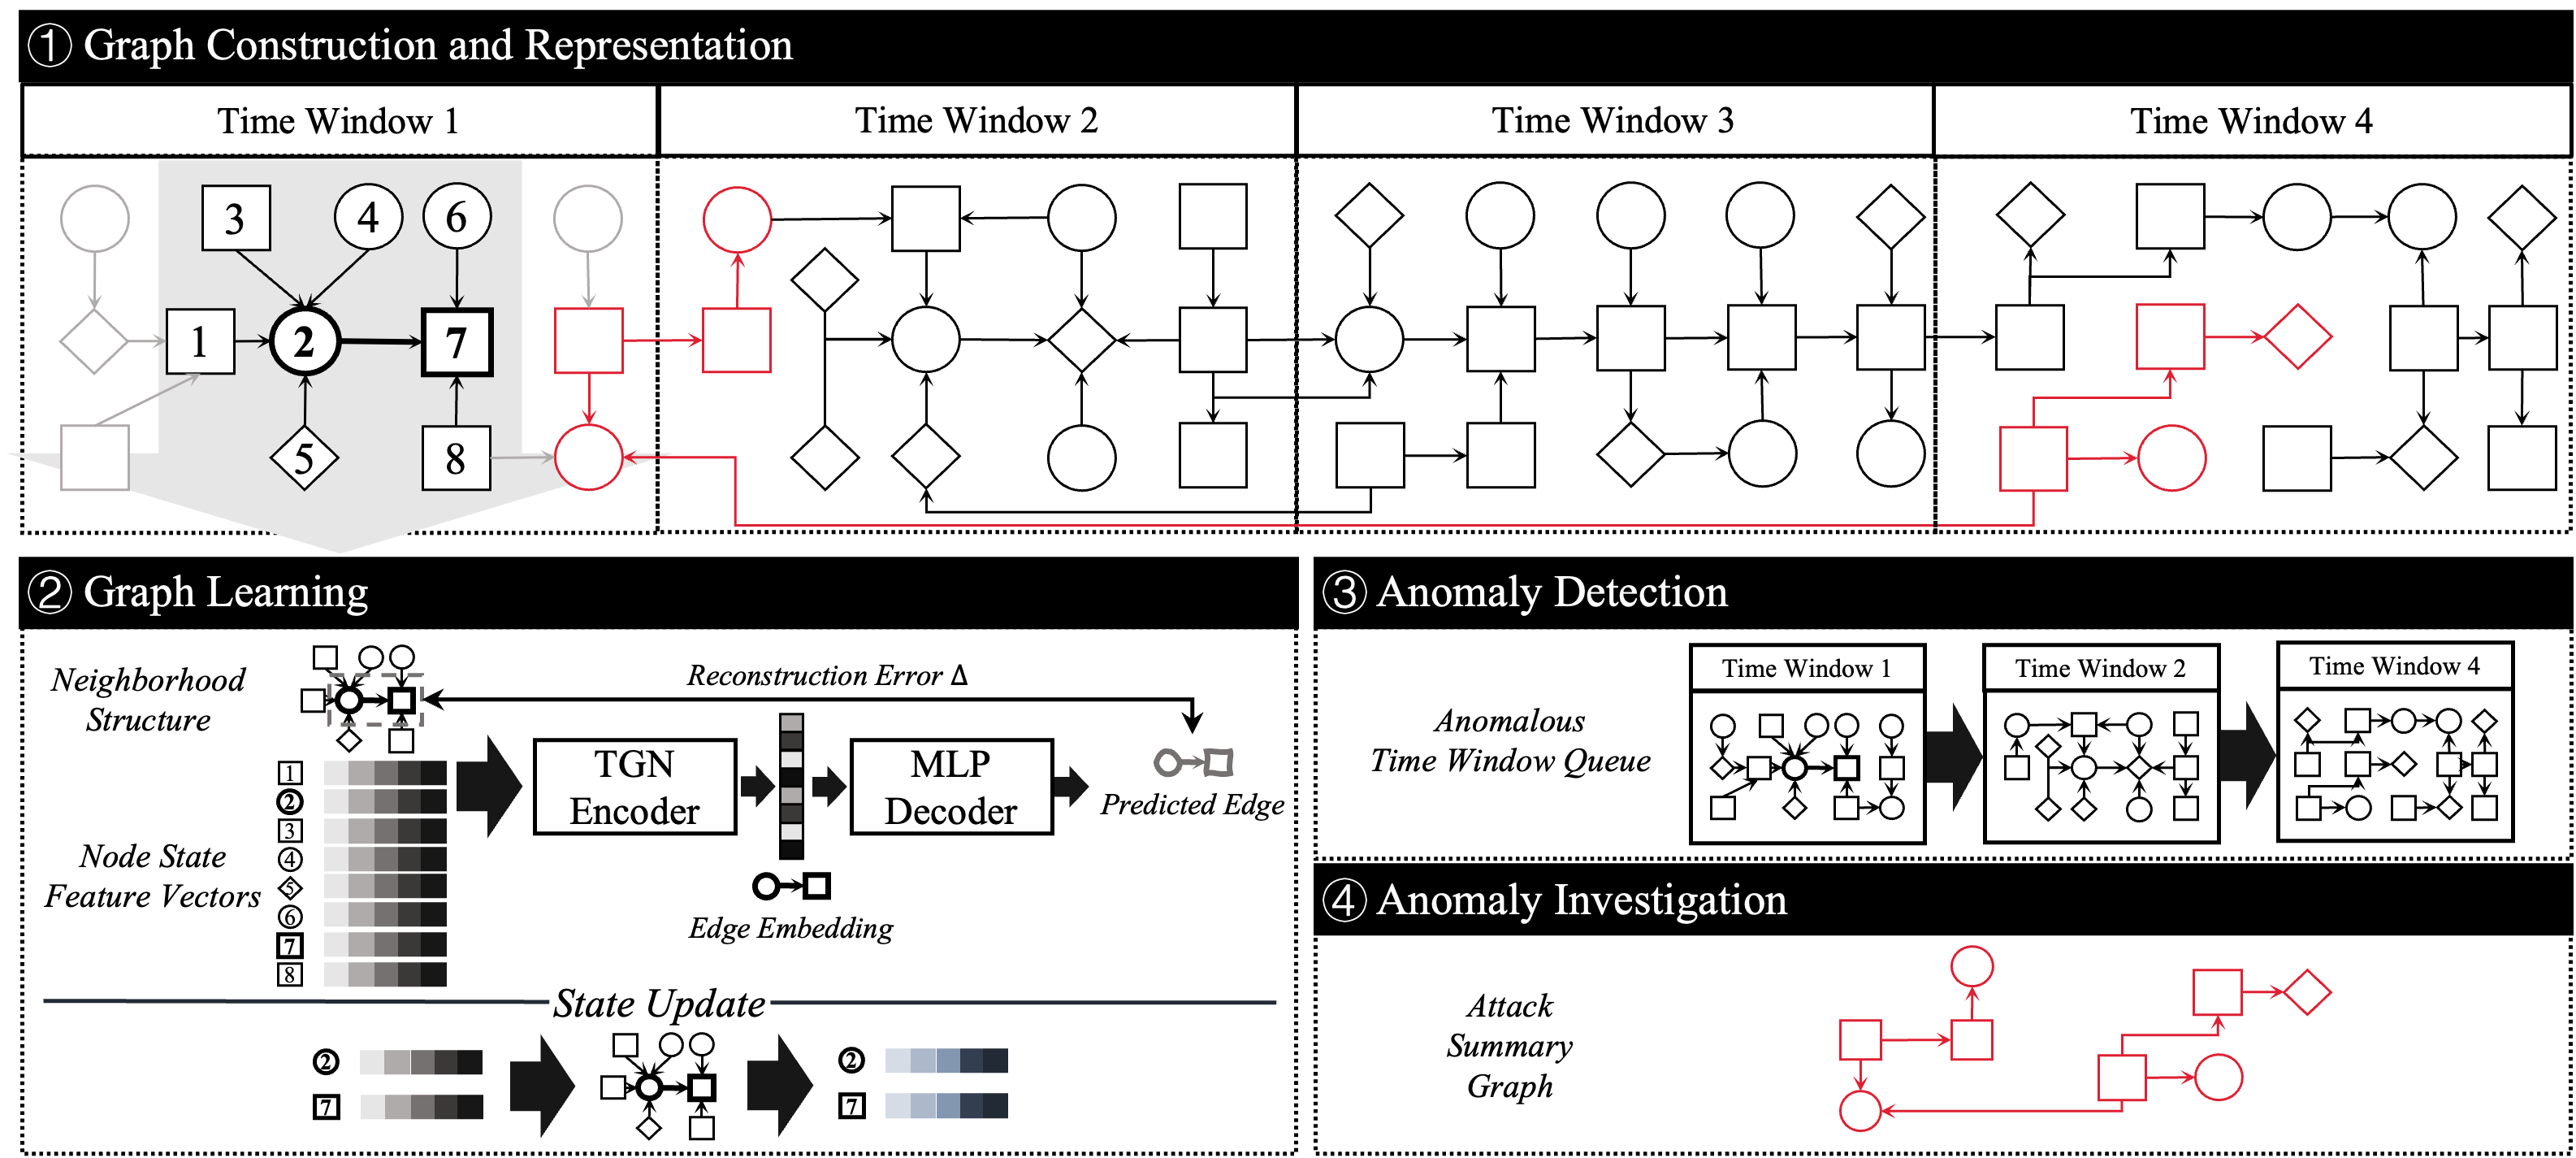
Kairos is an anomaly-based intrusion detection and attack investigation system. It leverages state-of-the-art deep graph learning and community discovery through causal dependencies in a provenance graph to (1) detect anomalous system behavior without prior knowledge of any specific attack characteristics, and (2) correlate detected anomalies based on information flows between kernel objects. Kairos provides concise and meaningful summary graphs for labor-saving human-in-the-loop forensic analysis. Fig. 2 depicts Kairos’ architecture consisting of four major components:
\raisebox{-.9pt} {1}⃝ Graph Construction and Representation (§ 4.1). Kairos analyzes a graph in a streaming fashion, chronologically ingesting edges as they appear in the graph.
\raisebox{-.9pt} {2}⃝ Graph Learning (§ 4.2). When a new edge (e.g., the bold edge \raisebox{-.9pt} {2}⃝ in Fig. 2) appears in the graph, Kairos uses an encoder-decoder architecture to reconstruct the edge. The encoder takes as input the neighborhood structure around the edge and the states of the nodes in the neighborhood. A node’s state is a feature vector associated with each node that describes the history of the changes in the node’s neighborhood. The decoder then reconstructs the edge from the edge embedding output by the encoder. The difference between the original edge and the reconstructed edge is called the reconstruction error. In the training phase, Kairos simultaneously trains the encoder and the decoder to minimize reconstruction errors of benign edges. During deployment, reconstruction errors of individual edges are used as the basis for anomaly detection and investigation. Additionally, Kairos updates the states of the source and destination nodes (node \raisebox{-.9pt} {2}⃝ and 7) of the new edge.
\raisebox{-.9pt} {3}⃝ Anomaly Detection (§ 4.3). Kairos constructs time window queues to detect anomalies during deployment. To do so, Kairos identifies a set of suspicious nodes in each time window based on the edges’ reconstruction errors. Two time windows with overlapping suspicious nodes are enqueued together. When a new time window is added to a queue, Kairos updates the anomaly score of the queue, based also on reconstruction errors. If the score exceeds a threshold, Kairos considers the queue to be anomalous and triggers an alert. Thus, Kairos performs anomaly detection periodically at intervals of a time window. In Fig. 2, Kairos detects an anomalous queue consisting of time windows 1, 2, and 4.
\raisebox{-.9pt} {4}⃝ Anomaly Investigation (§ 4.4). To help sysadmins reason about the alarm, Kairos automatically generates compact attack summary graphs from anomalous time window queues. This involves identifying communities of edges with high reconstruction errors to improve legibility. Graph reduction is necessary, because unlike images and texts, graphs are hard to visualize and interpret even by human experts [32]. In Fig. 2, sysadmins need only to understand a small, summarized graph from Kairos, instead of tracing through a much larger one in the anomalous time window queue that triggered the alarm.
4.1 Graph Construction and Representation
| Subject | Object | Relationships | Entity Attributes |
|---|---|---|---|
| Process | Start, Close, Clone | Image pathname | |
| File | Read, Write, Open, Exec | File pathname | |
| Process | Socket | Send, Receive | Src/Dst IP/port |
Kairos constructs a whole-system provenance graph from audit data collected by logging infrastructures, such as Windows ETW, Linux Audit, and CamFlow (§ 2.1). Kairos considers three types of kernel objects and nine types of interactions (i.e., system events). Kairos transforms each event into a directed, time-stamped edge, in which the source node represents the subject of the event and the destination node the object being acted upon. Table I shows the types of relationships (i.e., interactions) between kernel subjects and objects and the node attributes we consider.
Kairos encodes a node’s feature using a hierarchical feature hashing technique [33] based on node attributes. Hierarchical feature hashing projects high-dimensional input vectors into a lower-dimensional feature space while preserving the hierarchical similarity between the original input. As a result, two files located in the same parent directory (e.g., /var/log/wdev and /var/log/xdev), for example, are mapped closer in the feature space than a file in a different directory (e.g., /home/admin/profile).
To perform hierarchical feature hashing, Kairos encodes a node’s attribute multiple times, each at a different level of hierarchy. For example, for a file node with a pathname /home/admin/clean, Kairos creates three substrings of the pathname attribute: /home, /home/admin, and /home/admin/clean; for a socket node with an IP address 161.116.88.72, it creates four substrings: 161, 161.116, 161.116.88, and 161.116.88.72. Kairos then projects each substring into the feature space. The -th dimension of ’ feature vector is computed by where is a character in the substring, is a hash function that maps each character to one of the dimensions in the feature space, and is another hash function that hashes a character to . Therefore, we add to dimension in ’ feature vector if is . is the feature vector of the substring . The attribute ’s feature vector is the sum of the feature vectors of all its substrings, where represents each substring’s encoded vector, and represents the final encoding of a node’s attribute.
Hierarchical feature hashing assumes that two kernel entities of similar semantics have similar hierarchical features. While this is often the case, it is possible that an adversary attempts to manipulate an entity’s attribute to evade detection. However, Kairos’ graph learning (§ 4.2) will update these initial feature vectors based on temporal and structural equivalence, which is hard to manipulate, to overcome such issues. Kairos can also leverage other node embedding techniques [14], but all approaches make some assumptions about the similarity between two system entities.
4.2 Graph Learning
Node featurization in § 4.1 captures only attributes of system entities, without considering any structural (i.e., interactions between an entity and other entities) or temporal (i.e., sequences of events involving an entity) relationships between individual entities and the rest of the provenance graph. This is unfortunate, because the evolving provenance graph itself, which describes the dynamic behavior of a system, clearly manifests such relationships. More importantly, these relationships provide rich contextual information that enables us to model distinctive baseline (benign) system behavior and distinguish anomalies from the baseline.
For example, process injection leads to arbitrary code execution in the address space of a legitimate process. While malicious execution is masked under the legitimate process (i.e., the attribute of the process remains the same), under the influence of the adversary, the compromised process would exhibit interactions that deviate from its normal activity (e.g., accessing privileged system resources that the process typically does not require). These interactions are reflected as anomalous structural relationships in a provenance graph.
Temporal information can further reveal subtle behavioral differences; these differences are hard, if not impossible, to identify if one looks at only static snapshots of a dynamic provenance graph. For example, a DDoS attack that quickly overwhelms a victim system with a large number of network connections may result in the same graph structure as an unattacked system handling the same number of connections over a reasonable period of time. Without taking temporal relationships into account, it is difficult to detect the attack by comparing only graph structures.
Kairos learns both temporal and structural relationships in a provenance graph. Kairos’ graph learning follows an encoder-decoder architecture [34]. When a new edge appears in the streaming graph at time , the encoder embeds into a latent representation based on the state of its neighborhood immediately before (which we denote as ). That is, the edge embedding summarizes graph features in . The decoder then takes as input the edge embedding from the encoder and predicts the type of the edge as a probability distribution, i.e., the probability of the edge belonging to each of the nine possible types (§ 4.1).
Kairos simultaneously trains the encoder and the decoder using only benign provenance graphs. The goal of training is to minimize the difference between the actual edge type (when a new edge appears in the graph) and the type predicted by the decoder from its embedding. We call this difference the reconstruction error. At test time, the decoder assigns a small reconstruction error to an edge if its embedding encodes graph structures that resemble the structural context observed from benign system activity in a similar temporal context. Otherwise, a large reconstruction error is assigned, the magnitude of which depends on the extent of the deviation in both contexts.
Encoder. Kairos’ encoder uses a temporal graph network (TGN) [35] architecture to encode provenance graph features into edge embeddings. At time , Kairos generates an edge embedding for the new edge using a graph neural network (GNN) based model called UniMP [36]:
denotes the state of the graph structure surrounding at . In Kairos, a graph structure’s state is represented by the states of all the nodes in the structure. Each node state is a feature vector that describes the history of graph changes involving the node. When a new node appears in the graph, its state is initialized to a feature vector with all zeros, because there is no historical information on the node. As new edges change the node’s neighborhood , Kairos updates the node state (which we discuss later). thus describes the states of ’s source and destination nodes and , as well as the states of sampled nodes in and . represents the edges in and from sampled nodes. Each edge is encoded as a concatenation of the source and destination node’s feature embedding (§ 4.1) and the one-hot encoding of the edge type. is a vector of timestamps corresponding to the edges in . provides the structural context of , similar to the only information that prior PIDSes [2, 37] use to learn provenance graphs.
State Update. Kairos needs to update the states of and , since their neighborhoods have changed. To do so, Kairos trains a gated recurrent unit (GRU) model [38]:
Note that the new edge ’s information is propagated to ’s and ’s updated states and , so that future edge embeddings (of new edges appearing after ) can incorporate if is in their neighborhoods. However, ’s information is not propagated to the current edge embedding at , because should not be leaked to the decoder from when the decoder is used to predict . We refer interested readers to Rossi et al. [35] for technical details on TGNs.
Decoder. Kairos’ decoder uses a multilayer perceptron (MLP) to predict the type of the edge connecting and . In other words, the decoder learns to reconstruct from the encoder’s output , which provides both structural and temporal contexts for the decoder to reconstruct edges. The dimension of the MLP’s last (i.e., output) layer is nine, which is the number of all possible edge types (§ 4.1). The decoder outputs a vector of the probabilities of being each of the nine types:
During training, Kairos minimizes the reconstruction error (RE) between and the observed edge type from benign provenance graphs:
is an one-hot vector where the probability of ’s actual edge type is 1 and the rest 0. At test time, Kairos assigns low REs to edges whose structural and temporal contexts are similar to those learned from benign graphs but high REs if they deviate significantly from known normal system behavior. As we see next, Kairos uses these suspicious edges to detect (§ 4.3) and investigate (§ 4.4) anomalies.
4.3 Anomaly Detection
At a high level, Kairos performs anomaly detection at the level of time windows. A time window contains all system events (i.e., provenance edges) whose timestamps fall within a specific period of wall-clock time. Within a time window, Kairos identifies a set of suspicious nodes based on the reconstruction errors of graph edges (§ 4.2) and the rareness of the nodes. Kairos then incrementally builds queues of time windows based on each time window’s . More specifically, time windows within a queue are correlated through their suspicious nodes; therefore, a queue captures the activity of suspicious nodes over time and between each other. Kairos can construct many time window queues, and each time window can belong to multiple queues as long as correlation exists between time windows in those queues. Kairos assigns an anomaly score to each queue and flags a queue as anomalous if its anomaly score is above an anomaly threshold. Consequently, all time windows in an anomalous queue are deemed abnormal.
Kairos analyzes time window queues, instead of only individual edges or individual time windows, because Kairos is cognizant of the distinctive characteristics of modern attacks. Advanced adversaries today frequently leverage the “low-and-slow” attack pattern (§ 2.2), so that it is difficult to distinguish malicious events from benign but unusual system activities in the background. However, while these unusual activities are typically discrete, events belonging to an attack are connected via information flow over a long time period [3]. Time window queues provide Kairos with additional context necessary to distinguish attack behavior from unusual but benign activity and further, to reconstruct series of events constituting the attack (§ 4.4).
In the remainder of this section, we describe in detail the process of identifying suspicious nodes within a time window (§ 4.3.1), constructing queues of time windows (§ 4.3.2), and identifying abnormal queues (§ 4.3.3).
4.3.1 Identifying Suspicious Nodes
Kairos considers a node in a time window to be suspicious if the node satisfies the following two properties:
Anomalousness: A node is anomalous if it is a source or a destination node of an edge that has a reconstruction error (§ 4.2) greater than a reconstruction threshold. Kairos computes a reconstruction threshold for each time window based on the reconstruction errors of all the edges in . In our experiments, is standard deviations (SDs) above the mean of all reconstruction errors in a time window.
Rareness: A node is rare if its corresponding system entity does not appear frequently in a benign execution. We use the inverse document frequency (IDF) [39] to compute a node’s rareness. That is, for a given node , we calculate:
where is the total number of time windows and the number of time windows that contain the node . A node receives the maximum IDF if it does not exist in the past, i.e., . Note that the higher a node’s IDF, the rarer it is. Kairos considers a node to be rare if its IDF value is above the rareness threshold . Kairos identifies a set of suspicious nodes satisfying both anomalousness and rareness for each time window .
Prior work, such as NoDoze [19] and PrioTracker [40], also explored frequency-based approaches to measuring rareness. However, Kairos’s approach is novel, because (1) Kairos combines frequency with graph learning to identify suspicious nodes, while prior work either considers only frequency or with node fan-outs, which discounts important structural and temporal anomalies; and (2) Kairos leverages frequency in the context of anomaly detection while both systems focus only on forensic analysis.
4.3.2 Constructing Queues of Time Windows
Kairos constructs time window queues iteratively, as new time windows appear in a streaming provenance graph. For a new time window , Kairos either assigns to one or more existing queues or creates a new queue containing only . That is, is appended to an existing queue if:
where represents any time window in . If is not correlated to any existing queues through suspicious nodes, itself becomes the start of a new queue.
4.3.3 Detecting Anomalous Queues
The anomaly score of a queue is the product over the anomaly scores of all the time windows in the queue:
The anomaly score of a time window is the mean of the reconstruction errors of the edges in whose reconstruction errors are above the reconstruction threshold (§ 4.3.1).
Kairos incrementally updates the anomaly score of a queue at run time when a new time window is appended to the queue. Each time a queue’s anomaly score is updated, Kairos compares the updated anomaly score with the anomaly threshold to determine whether the queue is abnormal. Kairos uses benign validation data to set after model training. If a queue’s anomaly score at run time (during test) exceeds , the queue (and thus all time windows in the queue) are considered to be anomalous.
4.4 Anomaly Investigation
While anomalous time window queues (§ 4.3) significantly reduce the size of the graph that sysadmins must inspect in case of an intrusion alarm, they can still contain thousands of nodes and edges. To further lessen the burden on the analyst, Kairos automates the attack investigation process by constructing candidate summary graphs from anomalous time window queues. Kairos does so without relying on any prior attack knowledge; therefore, its ability to reconstruct more precise attack footprints is not limited to previously known attacks.
Given an anomalous queue , Kairos first applies standard provenance graph reduction techniques [41] to reduce the size of the graph in without changing its semantics. For example, Kairos merges edges from the same source and destination nodes if they are of the same type. Kairos’ graph reduction does not affect anomaly detection, because Kairos performs reduction only after it detects an anomalous queue.
Similar to prior work [42], we observe that attack activities typically form a dense community of nodes that are connected via edges of high reconstruction errors, separating them from other, non-attack-related nodes. Thus, after graph reduction, Kairos leverages the community discovery algorithm Louvain [43] to identify those communities.
To do so, Kairos first constructs a weighted graph from all the anomalous queues by adding to any edge that has a greater than the reconstruction threshold (§ 4.3.1) of its corresponding time window :
is the input graph to Louvain, and the reconstruction error of each edge in is the weight of the edge.
Then, Louvain starts with each node in representing a separate community. For every node , it moves from its current community to one of its neighboring communities that leads to the largest improvement (if any) of modularity, which measures the degree of connection density within communities compared to that between communities:
where is the sum of the s of the edges in the community , and is the sum of the s of ’s neighboring edges (i.e., edges with one of their incident nodes inside and the other one outside). is the sum of the s of all edges in . Note that remains in its community if relocating it achieves no modularity gain. Louvain runs this process repeatedly until modularity no longer increases.
To the best of our knowledge, Kairos is the first to bridge graph learning and community detection in the context of anomaly detection. For example, HERCULE [42] also leverages community detection but pre-defines 29 edge features to cluster edges. In contrast, Kairos avoids manual feature engineering by using learned anomaly scores.
The resulting communities are then simplified to create candidate summary graphs. These graphs concisely describe malicious behavior that spans long time periods and involves multiple stages of an attack kill-chain [3], although sometimes, they might also represent abnormal but otherwise benign system activity (due to the nature of anomaly-based detection [44]). However, as we see in § 5.5, sysadmins can easily dismiss benign candidate graphs (i.e., false alarms) and quickly identify the attacker’s footprints from small but attack-revealing graphs without the need to backtrack [18] or forward-track [45] the entire provenance graph. In fact, analyzing those small graphs is the only time Kairos requires expert knowledge in its entire intrusion detection pipeline. Unlike prior systems [3, 17, 22] that require expert-crafted attack signatures and manual exploration of the whole provenance graph, Kairos greatly reduces human involvement. Sysadmins still have the option to inspect the entire graph for further, in-depth analysis, but only if they choose to do so.
In § 5.2, we show how sysadmins can update Kairos’ model based on benign candidate graphs to continuously improve the quality of detection and investigation.
5 Evaluation
We implemented a Kairos prototype in Python. We use scikit-learn [46] to implement hierarchical feature hashing (§ 4.1) and PyG [47] to implement Kairos’ graph learning framework (§ 4.2). Louvain is implemented using NetworkX [48]. Finally, we use GraphViz [49] to visualize summary graphs for manual inspection.
We evaluate Kairos on eight publicly available datasets,
analyzing kernel-level provenance data
that captures
whole-system behavior of various platforms
(namely Linux, FreeBSD, and Android)
with and without attacks.
§ 5.1
describes the experimental datasets
in detail.
All experiments are performed on a server
running CentOS 7.9
with 2.20GHz 20-core Intel Xeon Silver 4210 CPU
and 64 GB of memory.
Unless otherwise stated,
we set the following hyperparameters
in all the experiments
except those in § 5.4,
where we examine
the effect of hyperparameters
on Kairos’ performance:
node feature embedding dimension = ,
node state dimension ,
neighborhood size ,
edge embedding dimension ,
and time window length
minutes.
Our evaluation focuses on
answering the following research questions:
Q1. Can Kairos accurately detect anomalies
in a running system under attack,
especially when they are low-and-slow
e.g.,
the APT in § 2.2)
and thus difficult to detect? (§ 5.2)
Q2. How does Kairos compare
to state-of-the-art? (§ 5.3)
Q3. How do hyperparameters
affect Kairos’ detection
and run-time performance? (§ 5.4)
Q4. Can Kairos accurately
reconstruct attack behavior
from the original provenance graph?
(§ 5.5)
Q5. What is Kairos’ end-to-end performance?
(§ 5.6)
5.1 Datasets
We obtain our experimental datasets from two sources, Manzoor et al. [50] and DARPA [24, 51, 52]. They are the few open-source datasets widely used in evaluating provenance-based systems [2, 3, 21, 17, 53, 54, 55, 56, 57]. Table II summarizes the statistics of the graphs in those datasets.
| Dataset | # of Nodes |
|
|
|
||||||
|---|---|---|---|---|---|---|---|---|---|---|
| Manzoor et al. | 999,999 | 89.8 | 2,842,345 | 3.165% | ||||||
| DARPA-E3-THEIA | 690,105 | 32.4 | 3,119 | 0.010% | ||||||
| DARPA-E3-CADETS | 178,965 | 10.1 | 1,248 | 0.012% | ||||||
| DARPA-E3-ClearScope | 68,549 | 9.7 | 647 | 0.006% | ||||||
| DARPA-E5-THEIA | 739,329 | 55.4 | 86,111 | 0.156% | ||||||
| DARPA-E5-CADETS | 90,397 | 26.5 | 793 | 0.003% | ||||||
| DARPA-E5-ClearScope | 91,475 | 40.0 | 4,044 | 0.010% | ||||||
| DARPA-OpTC | 9,485,265 | 75.0 | 33,504 | 0.045% |
5.1.1 Manzoor et al. Dataset
| Scenarios | # of Graphs |
|
|
||||
|---|---|---|---|---|---|---|---|
| YouTube | 100 | 8,292 | 113,229 | ||||
| Gmail | 100 | 6,827 | 37,382 | ||||
| Video Game | 100 | 8,831 | 310,814 | ||||
| Attack | 100 | 8,891 | 28,423 | ||||
| Download | 100 | 8,637 | 112,958 | ||||
| CNN | 100 | 8,990 | 294,903 |
This dataset contains provenance graphs captured by SystemTap [58] from six activity scenarios in a controlled lab environment. Five of them (i.e., watching YouTube, checking Gmail, playing a video game, downloading files, and browsing cnn.com) contain only benign activity. The attack scenario involves a drive-by download from a malicious URL that exploits a Flash vulnerability, which allows the attacker to gain root access. Manzoor et al. repeatedly ran each scenario to generate graphs per scenario. Table III details the graph statistics.
This dataset allows us to demonstrate Kairos’ high efficacy on traditional, “smash-and-grab” attacks, where the attacker quickly subverts a system. It also allows us to fairly compare Kairos with Unicorn [2] and ThreaTrace [8], two state-of-the-art PIDSes that perform anomaly detection on whole-system provenance graphs. Both systems used this dataset for their own evaluations. However, it is difficult to demonstrate Kairos’ ability to reconstruct attack activity with this dataset, as the fine-grained attack ground truth (i.e., the exact attack procedure) is not public and thus unknown to us. We use DARPA datasets (§ 5.1.2) for such evaluation.
Data Labeling. We label the Attack scenario graphs as attack and the remaining graphs as benign. Due to the lack of attack knowledge, we use a single time window (§ 4.3) for each graph (i.e., the time window queue length is 1). Thus, an attack graph corresponds to a single attack time window. From each benign scenario, we use only one graph to train Kairos and 24 graphs as validation data to configure detection thresholds (§ 4.3) to not introduce bias in their selection [59]. We use the remaining benign graphs ( for each scenario) and all attack graphs as test data.
5.1.2 DARPA Datasets
We use datasets from DARPA’s Transparent Computing (TC) and Operationally Transparent Cyber (OpTC) programs. TC organized several adversarial engagements that simulated real-world APTs on enterprise networks. During the engagements, a red team launched a series of attacks towards an enterprise’s security-critical services (e.g., web, email, and SSH servers) while engaging in benign activities such as browsing websites, checking emails, and SSH log-ins. A separate team deployed various provenance capture systems (e.g., CADETS, ClearScope, and THEIA) on different platforms to record whole-system host activity. The provenance data from the third (E3) and the fifth (E5) engagement is publicly available [24, 51].
The OpTC dataset contains benign activities of Windows hosts over seven days and additional three days of a mixture of benign and APT activities. The red team simulated a three-day long APT attack using a number of known CVEs on a small subset of hosts. The large scale of this dataset (with its total size in the order of a few dozen TBs) enables us to evaluate Kairos under a more “real” setting, where the amount of test data is much larger than that of training data. Specifically, we randomly select six hosts and use only one day of the benign data from them for training, one additional benign day for validation, but all three attack days from all hosts for testing. Table II details the graph statistics from different provenance systems. Table XI in Appendix A summarizes all DARPA attacks.
We use DARPA datasets to show that Kairos can (1) accurately detect anomalies even though they are hidden among a large amount of benign activity across a long time span, and (2) precisely distill the original provenance graph (that describes both benign and attack activity) into a compact attack summary graph without prior attack knowledge, even though attack activity is several orders of magnitude rarer (see Table II). Moreover, we use (3) the TC dataset to compare Kairos with Unicorn and ThreaTrace, and (4) the OpTC dataset to demonstrate that Kairos can be realistically deployed in a large-scale network of systems. Our motivating example (§ 2.2) uses the E3 dataset.
Data Labeling. Unlike Manzoor et al., DARPA provides attack ground truth, which enables us to label individual nodes and edges related to the attack. Thus, we can manually compare Kairos’ reconstructed attack graph with the ground-truth graph. It is worth noting that the ground truth is used only by us to verify Kairos’ efficacy; Kairos does not leverage any attack knowledge in its own analysis.
In both TC and OpTC, attack activity occurred only in a subset of time windows within an attack day. For instance, in our motivating example (§ 2.2), the ground truth shows some attack activity on April , 2018 at : when the attacker attempted to manipulate Firefox. The next attack activity occurred almost an hour later. As such, we mark the time window that includes the Firefox event as an attack time window. Since each time window is -minute long in our experiments, the next several time windows are therefore benign time windows, until the attack activity resumes.
Table XII in Appendix A summarizes specific benign and attack days we use for training, validation, and detection.
5.2 Detection Performance
| Datasets | TP | TN | FP | FN | Precision | Recall | Accuracy | AUC |
|---|---|---|---|---|---|---|---|---|
| Manzoor et al. | 100 | 375 | 0 | 0 | 1.000 | 1.000 | 1.000 | 1.000 |
| E3-THEIA | 9 | 216 | 2 | 0 | 0.818 | 1.000 | 0.991 | 0.995 |
| E3-CADETS | 4 | 174 | 1 | 0 | 0.800 | 1.000 | 0.994 | 0.997 |
| E3-ClearScope | 5 | 112 | 2 | 0 | 0.714 | 1.000 | 0.983 | 0.991 |
| E5-THEIA | 2 | 173 | 1 | 0 | 0.667 | 1.000 | 0.994 | 0.997 |
| E5-CADETS | 7 | 238 | 9 | 0 | 0.438 | 1.000 | 0.965 | 0.982 |
| E5-ClearScope | 10 | 217 | 5 | 0 | 0.667 | 1.000 | 0.978 | 0.989 |
| OpTC | 22 | 1210 | 16 | 0 | 0.579 | 1.000 | 0.987 | 0.993 |
| Datasets | TP | TN | FP | FN | Precision | Recall | Accuracy | AUC |
|---|---|---|---|---|---|---|---|---|
| Manzoor et al. | 100 | 375 | 0 | 0 | 1.000 | 1.000 | 1.000 | 1.000 |
| E3-THEIA | 10 | 216 | 1 | 0 | 0.909 | 1.000 | 0.996 | 0.998 |
| E3-CADETS | 4 | 174 | 1 | 0 | 0.800 | 1.000 | 0.994 | 0.997 |
| E3-ClearScope | 5 | 112 | 2 | 0 | 0.714 | 1.000 | 0.983 | 0.991 |
| E5-THEIA | 2 | 173 | 1 | 0 | 0.667 | 1.000 | 0.994 | 0.997 |
| E5-CADETS | 16 | 238 | 0 | 0 | 1.000 | 1.000 | 1.000 | 1.000 |
| E5-ClearScope | 10 | 217 | 5 | 0 | 0.667 | 1.000 | 0.978 | 0.989 |
| OpTC | 32 | 1210 | 6 | 0 | 0.842 | 1.000 | 0.995 | 0.998 |
To evaluate Kairos’ detection performance, we replay test data in each dataset as if Kairos was monitoring the behavior of the host system as it runs. Model training is performed offline using only benign data. Note that this experimental setup automatically ensures two desiderata of PIDSes introduced in § 1: scope and attack agnosticity.
Table IV shows the precision, recall, accuracy, and area under ROC curve (AUC) results for all datasets. We compute these metrics based on time windows. As mentioned in § 5.1, we manually label each time window in a provenance graph as either benign or attack according to the ground truth. If Kairos marks a benign time window as anomalous (i.e., if Kairos mistakenly includes a benign time window in an anomalous queue), we consider the time window to be a false positive (FP). On the other hand, if Kairos correctly marks an attack time window as anomalous, it is counted as a true positive (TP). False negatives (FN) and true negatives (TN) are calculated in a similar fashion. Table IV also shows the number of TP, TN, FP, and FN time windows.
We see in Table IV that Kairos can accurately detect all attacks, achieving recall. Kairos reports FPs (which lead to lower precision) in a subset of experiments for several reasons. First, Kairos continues to assign high reconstruction errors to edges whose nodes were under the attacker’s influence even after the attacker stops actively manipulating them. Kairos still considers these entities to be compromised, because Kairos remembers the history of their states (§ 4.2), part of which indeed involves the attacker. However, in the ground truth, entities that remain active after the attack are often dismissed, since they are no longer part of the attack. For example, in E5-CADETS, the attacker exploited a vulnerable Nginx process to download and execute a malicious payload. Once the payload was executed, subsequent attack activity no longer involved Nginx, but Nginx continued to serve benign requests. Any entity, once compromised by an attacker, should be considered problematic. We manually identify these “fake” FPs (i.e., processes that potentially remain under an attacker’s control but whose subsequent behavior is not part of the ground truth), and we show the adjusted results in Table V. Notice the significant improvement for E3-THEIA, E5-CADETS, and OpTC.
Second, Kairos assigns high reconstruction errors to novel activities of new applications that were introduced only in the test data. Since their behavior is completely unknown, it is abnormal to Kairos, albeit non-malicious. This is an example of concept drift [28], where new benign behavior does not fit into the underlying statistical properties learned by the model. For example, in E5-ClearScope, we test Kairos on May and , when the attack took place. Kairos reports FPs on both days. Upon inspection of the candidate summary graphs from Kairos (Fig. 5), we easily conclude that all the FPs are caused by the behavior of screencap, which does not appear in the training data. We next show how sysadmins can effectively mitigate FPs by incrementally retraining Kairos’ model.
| E5-ClearScope | TP | TN | FP | FN | Precision | Recall | Accuracy | AUC |
|---|---|---|---|---|---|---|---|---|
| Without retraining | 6 | 87 | 2 | 0 | 0.750 | 1.000 | 0.979 | 0.989 |
| With retraining | 6 | 89 | 0 | 0 | 1.000 | 1.000 | 1.000 | 1.000 |
Model Retrain. Kairos makes model retraining more practical, because it enables sysadmins to quickly identify false alarms by providing them with compact candidate summary graphs to inspect (§ 5.5). To update the model, we repeat the same training process (§ 4.2) on the existing model using only the provenance data from the FP time windows. Table VI shows the experimental results on E5-ClearScope before and after we identify FP time windows and update the model. More specifically, in addition to the original training data, we further train the model on the FP data on May , which was previously used as part of the test data. We then evaluate the updated model on the May ’s data, which is the remaining test data. For fair comparison, Table VI reports the results before model update only on May (while Table V reports the results on both days). Kairos can continuously learn from FPs to address concept drift and avoid making similar mistakes in the future.
In practice, Kairos’ model should be regularly updated as new benign behavior emerges. Note that retraining potentially breaks the assumptions made in our threat model (§ 3), since benign training data may not be captured in a controlled environment where the absence of an attacker is guaranteed. As such, attackers may exploit retraining to poison the model [60, 61]. Detecting and preventing model poisoning [62] is further discussed in § 6, along with other possible evasion strategies, but it is beyond the scope of this work. In summary, while Kairos supports retraining, we leave its thorough exploration and evaluation to future work.
5.3 Comparison Study
Fairly comparing Kairos with state-of-the-art PIDSes is hard for several reasons. First, the majority of PIDSes are signature-based [63, 3, 17, 22, 64], while Kairos detects anomalies. The performance of signature-based PIDSes depends on the quality of the signatures, which are often proprietary knowledge unavailable to the public. Comparison between signature- and anomaly-based PIDSes can easily be biased by manipulating signatures that can be matched to the attack. Therefore, we exclude signature-based PIDSes for comparison. Second, most anomaly-based PIDSes [14, 65] are closed-source and evaluated using private datasets. We attempt to re-implement some PIDSes based on published descriptions, but it is challenging to verify correctness with no access to datasets to reproduce the original results. For example, we re-implemented ProvDetector [27] but are unable to compare it against Kairos due to unreasonably long run time on even the smallest DARPA dataset (we attribute this outcome to our lack of skills, not to the original authors). Similarly, ShadeWatcher [7] is not fully open-source. Specifically, we confirm with the authors that a major component of ShadeWatcher is proprietary. Unfortunately, we are unable to replicate the algorithm from the description in its publication alone. Last but not least, PIDSes might use different metrics to report their detection performance, further complicating comparison and giving a misleading impression of performance. We further discuss the issues of evaluating PIDSes in general in § 6 and leave benchmarking PIDSes to future work.
Due to these difficulties, we choose Unicorn [2] and ThreaTrace [8] as the primary PIDSes for comparison, because they are anomaly-based, open-source, and evaluated by the authors using both Manzoor et al. and a subset of DARPA datasets. Similarly, StreamSpot [21] and Frappuccino [20] are also open-source anomaly detection systems. However, Unicorn has been shown to outperform these systems [2]. Our own evaluation of StreamSpot on DARPA’s TC datasets confirmed prior performance analyses by others: StreamSpot cannot detect any anomalies in all TC datasets. Therefore, due to space constraints, we will not further discuss StreamSpot or Frappuccino.
5.3.1 Unicorn
Unicorn builds a behavioral model of a system by featurizing an evolving provenance graph into a series of fixed-size, incrementally-updatable graph sketches. Each sketch represents a snapshot describing the entirety of the graph from the very beginning of system execution till the point where the snapshot is taken. The frequency of generating a new sketch is a hyperparameter, determined by the number of new edges streamed to the graph. At test time, Unicorn can quickly generate and update graph sketches of the system being monitored and compare them with known benign sketches in the model to perform run-time detection.
We use the same evaluation protocol as in Unicorn [2] to ensure fairness. Specifically, Unicorn computes evaluation metrics at the graph level, instead of the finer-grained time-window level (as in Kairos). That is, Unicorn classifies the entire graph as benign or containing an attack, and uses it as a single data point to calculate detection performance. To adopt Unicorn’s way of computing metrics, we consider an entire graph to be malicious if Kairos marks at least one time window as attack. We do not need to modify the experimental results for the Manzoor et al. dataset, because each graph is already a single time window. Since Unicorn was not originally evaluated on the DARPA E5 datasets, we will not compare Unicorn on these datasets for fairness (because extensive hyperparameter tuning might be needed for Unicorn to produce the best results).
| Datasets | System | Precision | Recall | Accuracy |
| Manzoor et al. | Unicorn | 0.98 | 0.93 | 0.96 |
| Kairos | 1.00 | 1.00 | 1.00 | |
| E3-CADETS | Unicorn | 0.98 | 1.00 | 0.99 |
| Kairos | 1.00 | 1.00 | 1.00 | |
| E3-THEIA | Unicorn | 1.00 | 1.00 | 1.00 |
| Kairos | 1.00 | 1.00 | 1.00 | |
| E3-ClearScope | Unicorn | 0.98 | 1.00 | 0.98 |
| Kairos | 1.00 | 1.00 | 1.00 |
Experimental Results. Table VII shows that Kairos either outperforms Unicorn or achieves equally high performance in all datasets. By comparing Table VII with Table V, we also see that a coarse-grained, graph-level evaluation can be misleading, since the detection system might not accurately or completely identify the entirety of attack activity.
Unlike Kairos, Unicorn does not support fine-grained detection or automated post-detection investigation. We notice a time lag between the first occurrence of a malicious event and Unicorn’s detection of system anomalies, which results in additional graph sketches. Since a graph sketch is a vectorized graph representation that describes an entire evolving graph, these additional sketches could represent tens of thousands of more graph elements that sysadmins must inspect on top of the sketch that actually contains attack activity. Consequently, when Unicorn raises an alarm, attack activity can be hidden anywhere within the graph, requiring sysadmins to blindly backtrack the graph to reason about the alarm. In contrast, Kairos not only produces fewer false alarms, but also creates compact summary graphs that highlight possible attack footprints, all without any human intervention (§ 5.5).
| Datasets | System | Precision | Recall | Accuracy |
| Manzoor et al. | ThreaTrace | 0.98 | 0.99 | 0.99 |
| Kairos | 1.00 | 1.00 | 1.00 | |
| E3-CADETS | ThreaTrace | 0.90 | 0.99 | 0.99 |
| Kairos | 1.00 | 0.95 | 0.99 | |
| E3-THEIA | ThreaTrace | 0.87 | 0.99 | 0.99 |
| Kairos | 1.00 | 0.95 | 0.99 | |
| E5-CADETS | ThreaTrace | 0.63 | 0.86 | 0.97 |
| Kairos | 1.00 | 0.85 | 0.98 | |
| E5-THEIA | ThreaTrace | 0.70 | 0.92 | 0.99 |
| Kairos | 1.00 | 0.92 | 0.99 |
5.3.2 ThreaTrace
ThreaTrace builds a model for each type of nodes in a provenance graph to detect anomalous nodes. We use both the Manzoor et al. dataset and a subset of DARPA datasets used by ThreaTrace for fair comparison. ThreaTrace converts its node-level detection to graph-level for the Manzoor et al. dataset, since node-level ground truth is unavailable. It considers a graph to be anomalous if the number of anomalous nodes exceeds a predefined threshold. Kairos and ThreaTrace are thus directly comparable on this dataset. For DARPA datasets, we adopt ThreaTrace’s way of computing metrics and use anomalous nodes in suspicious time windows to compute precision, recall, and accuracy.
Experimental Results. Table VIII shows that Kairos achieves comparable performance to ThreaTrace in all datasets. We note that ThreaTrace authors manually label as anomalous both the nodes in the ground truth and their -hop ancestor and descendant nodes, even though the neighboring nodes were not involved in an attack. More concerningly, benign nodes mistakenly detected by ThreaTrace as anomalous are not considered to be FPs as long as any of their -hop neighbors are labeled as anomalous. Thus, a benign node as far as hops away from a true anomalous node in the ground truth can be misclassified by ThreaTrace but not reported as a FP. This labeling approach likely leads to favorable precision and recall, but even then, Kairos outperforms ThreaTrace in most cases. We further discuss the issues of benchmarking PIDSes in § 6.
Unlike Kairos, ThreaTrace cannot reconstruct a complete attack story. While ThreaTrace’s node-level detection can facilitate attack comprehension to some extent, this approach is impractical when the graph is large and the number of FP nodes is high. For example, ThreaTrace identified over FP nodes in the E5-THEIA experiment (after using the aforementioned labeling strategy), which would undoubtedly overwhelm human analysts. This limitation is explicitly recognized by the ThreaTrace authors.

5.4 Hyperparameter Impact on Performance
In previous sections, we evaluate Kairos with a set of fixed hyperparameters. Here, we vary each independently and report its impact on detection and run-time performance. We show detailed results for E3-THEIA here and include results for all TC datasets in Appendix B due to space constraints.
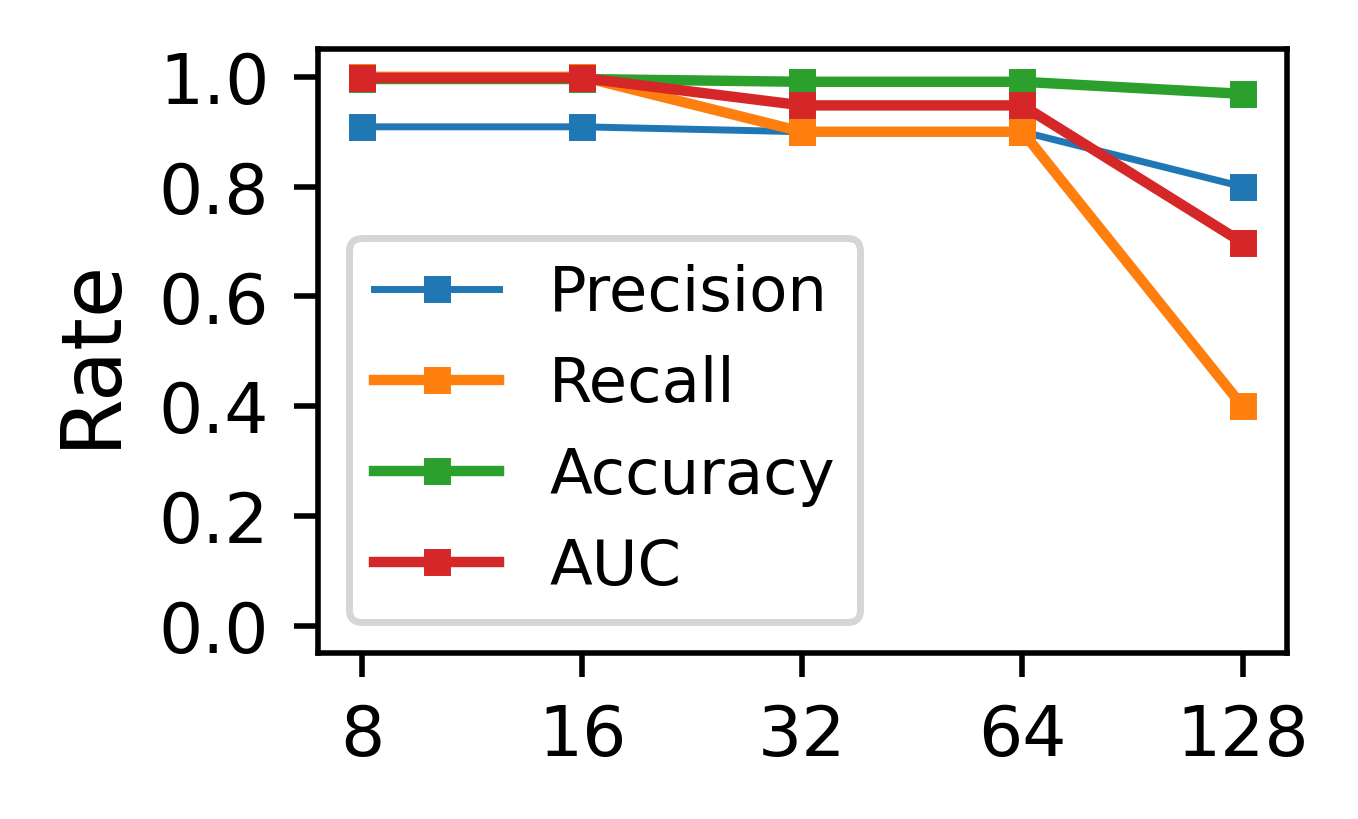
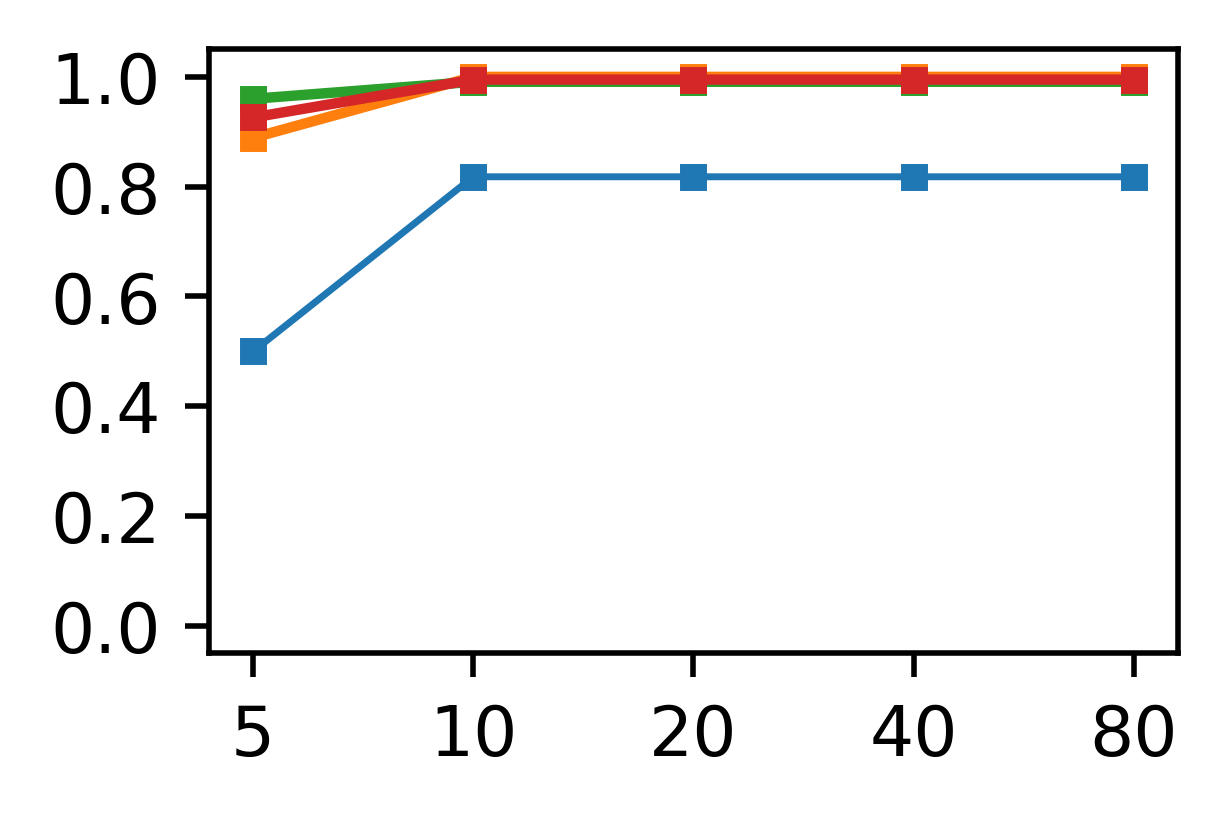
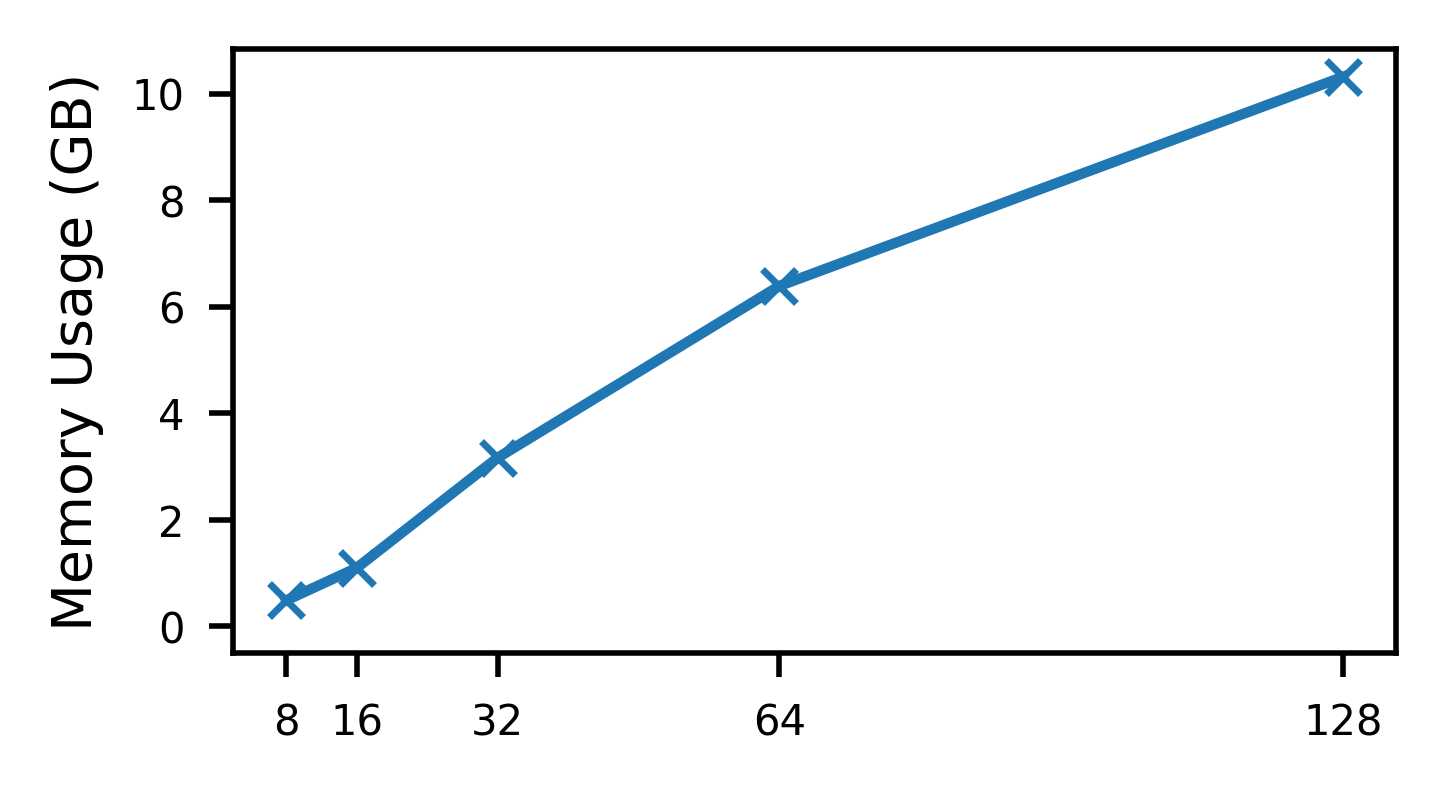
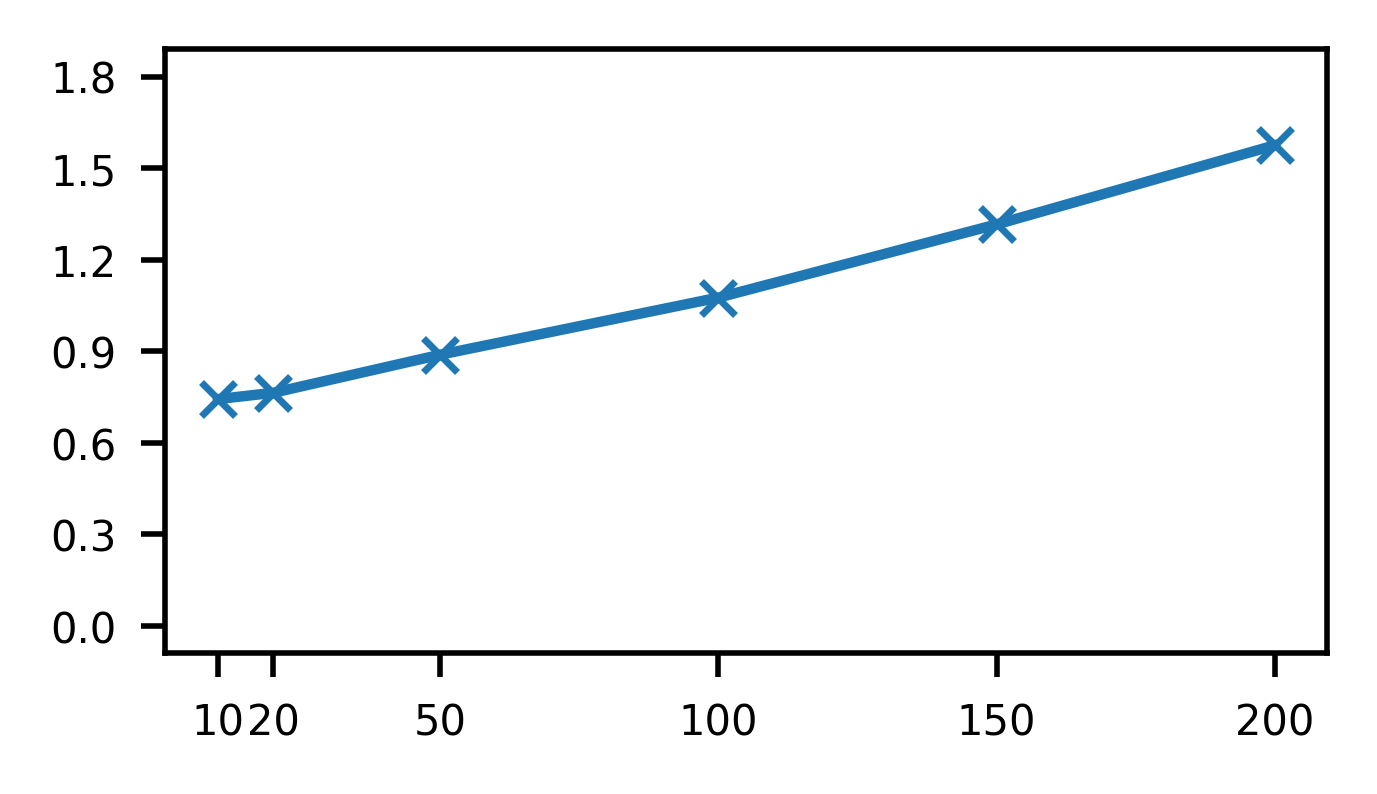
Node Embedding Dimension (). Node embedding encodes initial node features. We see in Fig. 3(a) that a relatively small dimension is sufficient to encode these features. A large dimension leads to sparse features, which could severely affect detection performance and incur large memory overhead (Fig. 4(a)). On the other hand, if is too small, we instead increase the probability of hash collision in hierarchical feature hashing (§ 4.1). We find to be the ideal dimension across all datasets (Fig. 7(a)).
Node State Dimension (). A node’s state captures the temporal evolution of a node’s neighborhood over time. In Fig. 3(b), when is too small, Kairos has difficulties in retaining information about past events. On the other hand, if grows too large, detection performance degrades, because states might contain outdated history irrelevant to current events [2]. also influences memory overhead (Fig. 4(b)), because a state vector is associated with each node. When , across all TC datasets (Fig. 7(b)), Kairos can fully contextualize a new event using a node’s past interactions with other entities, while incurring small run-time overhead.
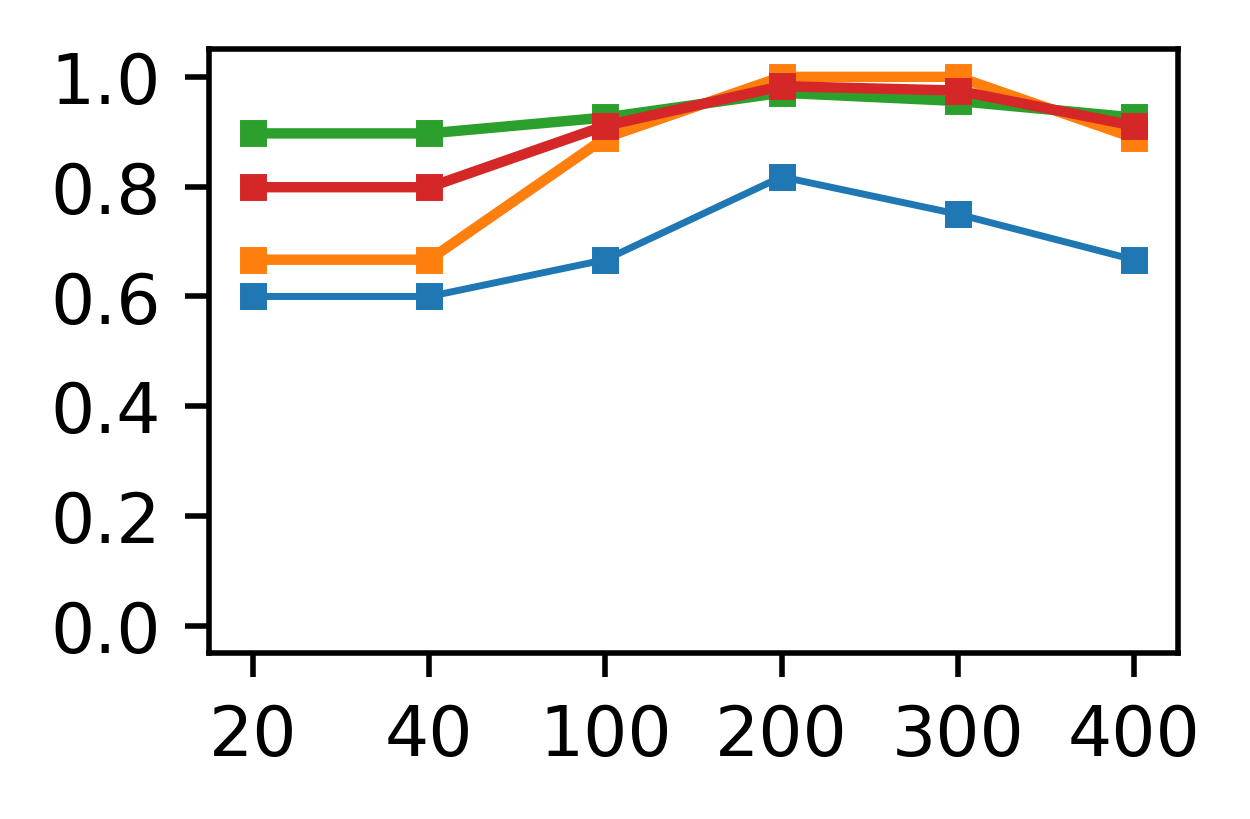
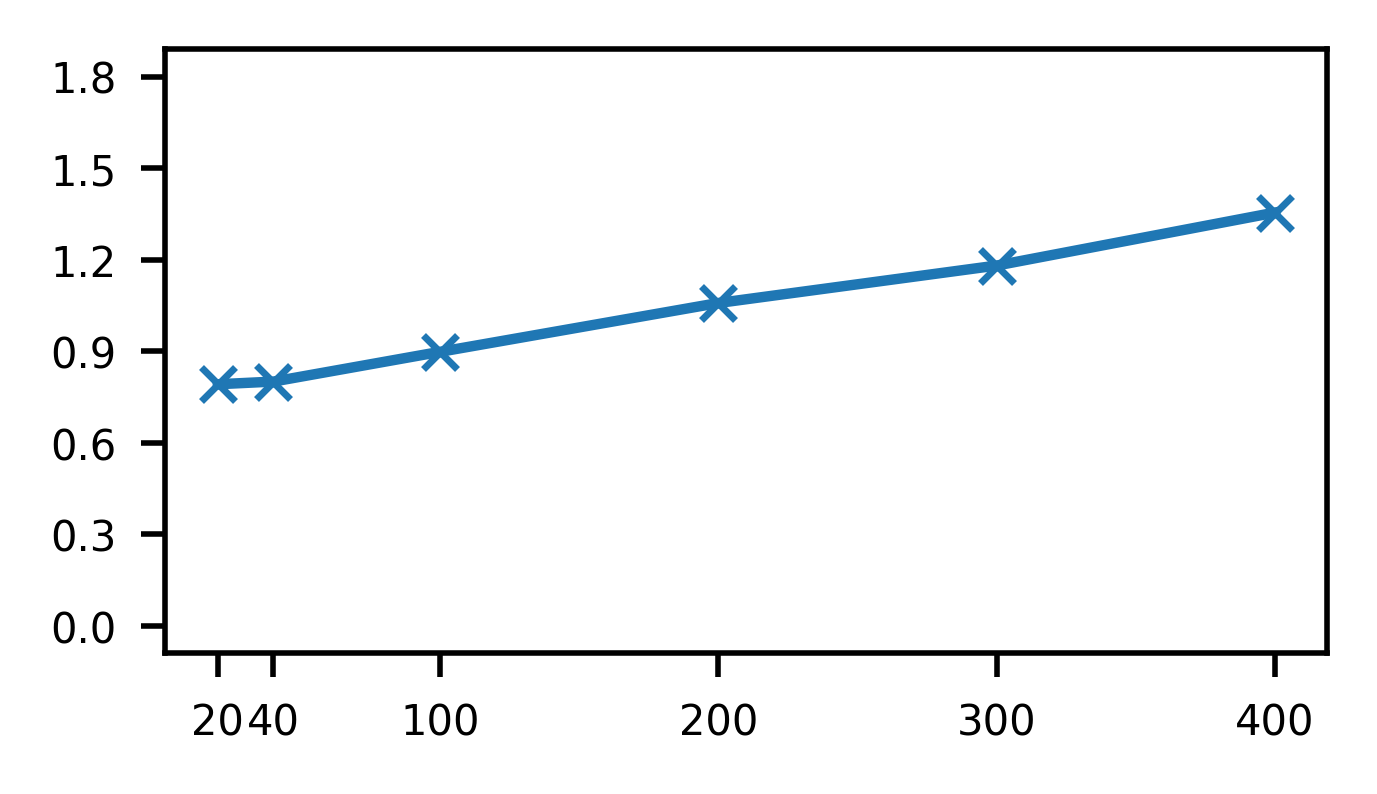
Neighborhood Sampling Size (). A node’s neighborhood captures the structural role of a node, so that two nodes with a similar neighborhood likely have the same structural role [66]. Too small of a neighborhood sampling size makes it difficult for Kairos to understand a node’s structural role. However, as we continue to increase , detection performance no longer improves (Fig. 3(c)). This is because the majority of the nodes in a dataset have fewer neighboring nodes than . For example, in E3-THEIA, about of the nodes have a neighborhood size of or less. As such, increasing above has little to no effect. This also explains why the additional memory overhead we incur is not proportional to the increase in (Fig. 4(c)). We find to be ideal among all datasets (Fig. 7(c)).
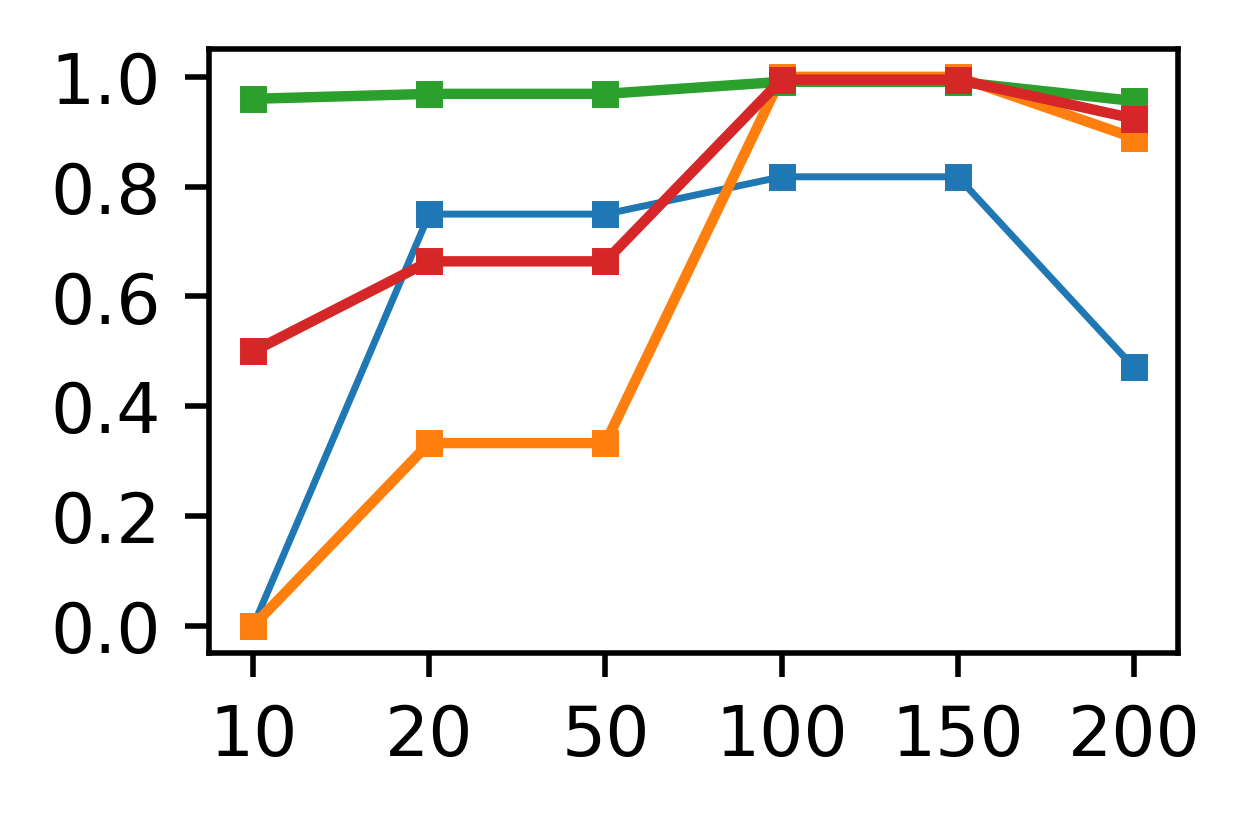
Edge Embedding Dimension (). The edge embedding encodes both the state and the structural information of the graph surrounding an edge. With increasing , the edge embedding can better retain temporal and structural information for the decoder to reconstruct an edge. However, an overly large complicates the model and affects Kairos’ generalization capability. Fig. 3(d) confirms our hypothesis: Within a certain range, increasing improves Kairos’ detection performance, until we reach a point where the performance starts to degrade. Memory overhead (Fig. 4(d)) also increases as grows, as expected. Across all datasets (Fig. 7(d)), gives the best detection performance.
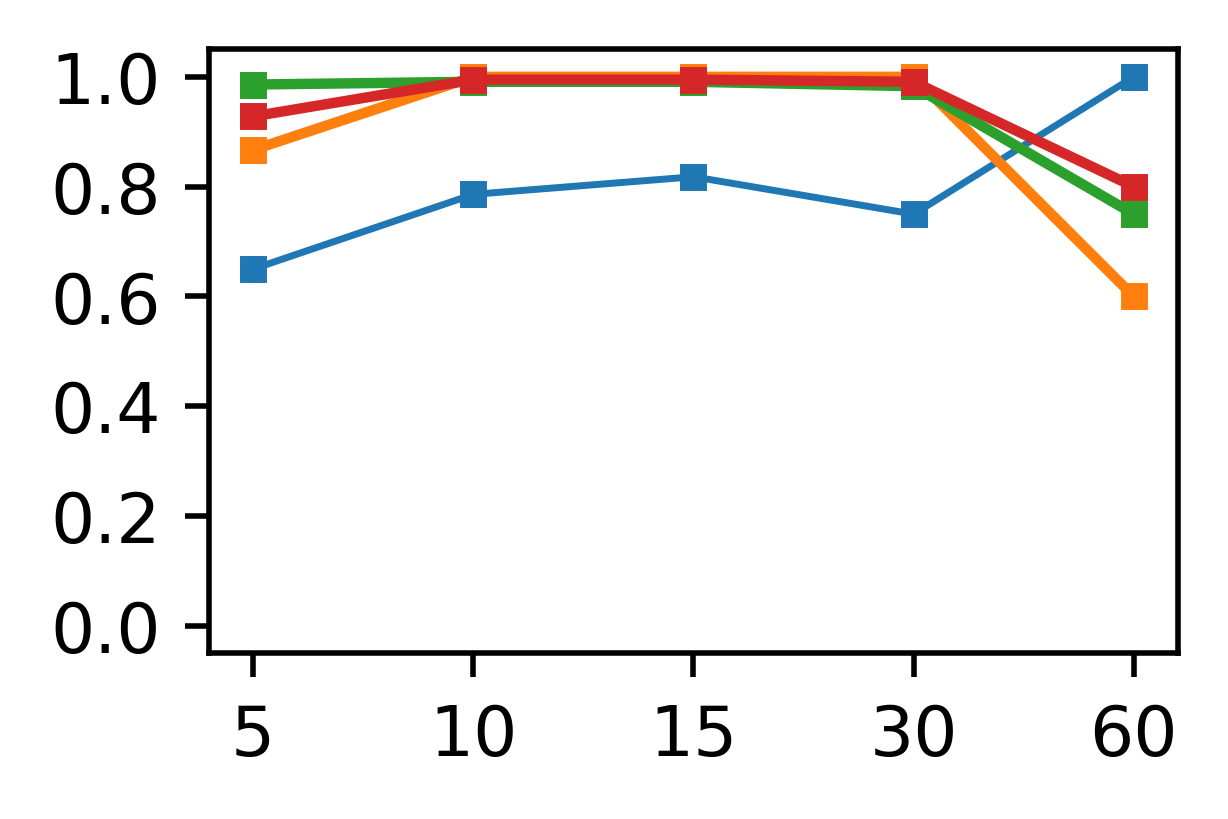
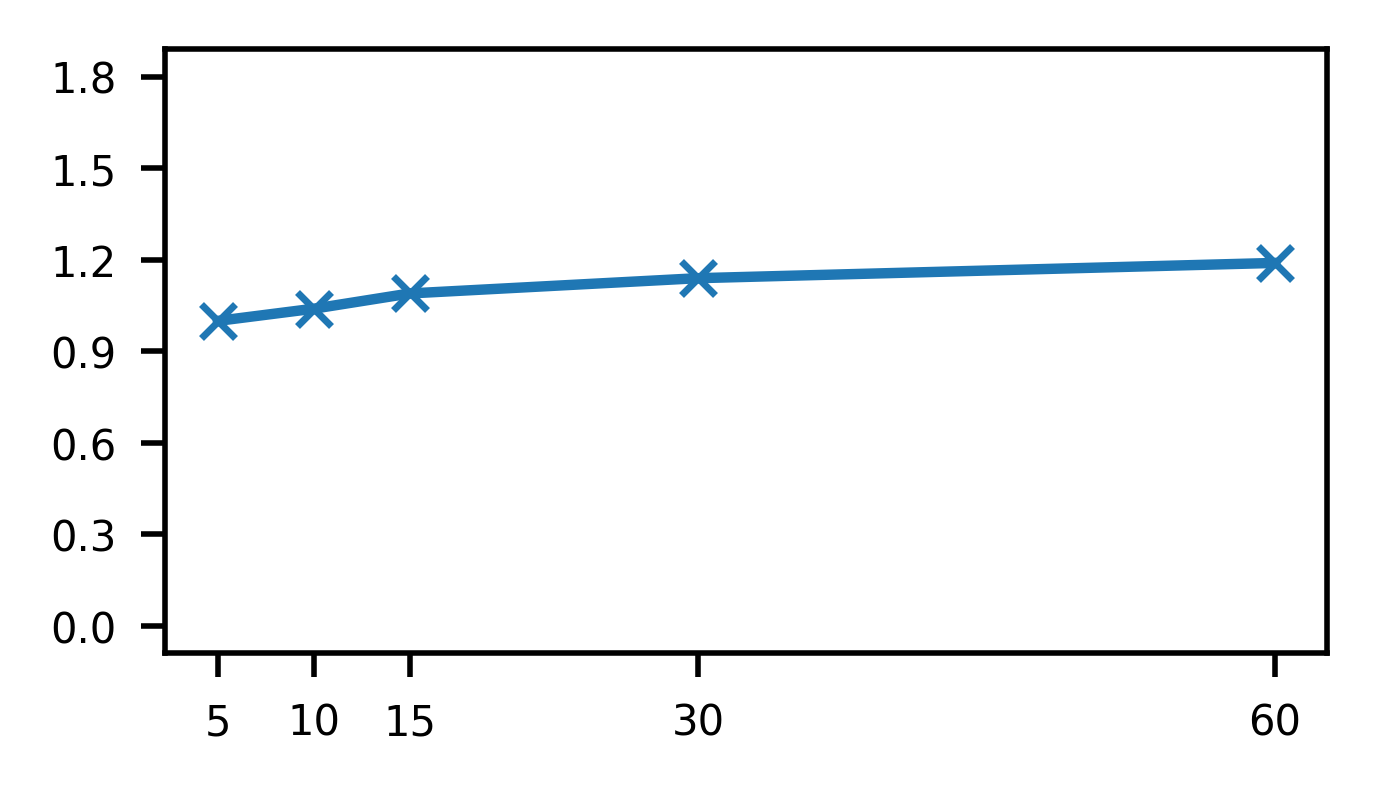
Time Window Length (). The length of a time window determines the frequency of Kairos performing its anomaly detection algorithm (§ 4.3). Generally, a longer time window accumulates a larger number of system events. Since the amount of benign activity overwhelmingly dominates that of attack activity (§ 2.2.2), a large time window can make anomaly detection difficult. As we see in Fig. 3(e), while a time window length between 5-30 minutes has little influence on detection performance, when is too large (60 minutes), Kairos generates more false negatives, which leads to low recall (and high precision) and overall low accuracy. When is small (5 minutes), we see a slight decline in performance, because a short time window can limit Kairos’ ability to accurately contextualize an event. However, it is unnecessary to use small time windows just to improve detection timeliness, because APT actors only slowly infiltrate their target systems (§ 2.2.2). For example, in E3-THEIA, the attacker performed two adjacent attack activities in a kill-chain almost one hour apart (§ 5.1.2). We find minutes to be ideal among all datasets (Fig. 7(e)). Fig. 4(e) shows that increasing the time window length only slightly increases memory overhead, even when the length is large. This is because Kairos processes a provenance graph in a streaming fashion and does not keep the entire graph in memory.
Note that CPU utilization is consistently less than in all E3-THEIA experiments. Varying hyperparameter values only slightly impacts CPU utilization. Fig. 9 shows the percentile CPU utilization for all TC experiments.
| Dataset | # of Nodes | # of Edges |
|
Reduction | ||
|---|---|---|---|---|---|---|
| E3-THEIA | 20 | 31 | 3,393,536 | 109,469X | ||
| E3-CADETS | 18 | 26 | 115,712 | 4,450X | ||
| E3-ClearScope | 10 | 16 | 210,944 | 13,184X | ||
| E5-THEIA | 11 | 17 | 826,368 | 48,610X | ||
| E5-CADETS | 11 | 17 | 351,232 | 20,661X | ||
| E5-ClearScope | 10 | 10 | 344,064 | 34,406X | ||
| OpTC | 77 | 101 | 1,065,984 | 10,554X |
5.5 Attack Reconstruction
The ability to reconstruct complete but concise attack stories is a first-order design metric in Kairos. It is particularly important for anomaly detection systems, especially the ones (like Kairos) that leverage deep learning. This is because attack reconstruction (1) establishes trust on the decisions, (2) facilitates the necessary human-in-the-loop component in understanding system anomalies, and (3) expedites the process of identifying and reducing FPs (§ 5.2) [67].
In the DARPA datasets, Kairos is able to reconstruct the true attack activity describing the APT, while reporting only a couple of benign candidate graphs (§ 4.4). Table IX shows the size of the attack summary graph that Kairos generates from an anomalous time window queue in each DARPA dataset (the OpTC dataset contains three APT scenarios, while each experiment in TC contains only one). We see that candidate summary graphs are small (due to graph reduction, see § 4.4). In fact, compared to the size of the anomalous time window queues from which they are generated, the size of attack summary graphs is up to five orders of magnitude smaller. For example, in E3-THEIA, Kairos achieves X edge reduction, narrowing down the total number of edges that require manual inspection from million in anomalous time window queues to only . This means that sysadmins can quickly and easily reason about candidate summary graphs, eliminate the benign ones, and identify true attack activity. In the remainder of this section, we use an attack and a benign summary graph to illustrate how Kairos’ ability to construct concise graphs enables effective and efficient attack investigation. Due to space constraints, we provide full graph results in Appendix C, Appendix D, and a separate document [68].
The Attack Summary Graph. Fig. 1 shows a candidate summary graph from Kairos that describes APT activity in E3-THEIA. This graph and DARPA’s ground truth match almost perfectly, even though a small number of perhaps extraneous graph elements not mentioned in the ground truth (colored blue) are included in the graph. However, notice that these graph elements are closely connected to system entities that are indeed under the influence of the attacker.
Kairos also misses several entities (colored in pink and dashed) explicitly mentioned in the ground truth. For example, the socket nodes and the edges describing the communications between the compromised Firefox process and two malicious IP addresses are not included. This is because in general, it is common for a Firefox process to read from and write to an external IP. As such, it is difficult to classify those behaviors without providing e.g., a complete allowlist/blocklist. However, Kairos accurately identifies Firefox’s anomalous behavior (colored red) as a result of these communications with the malicious IPs. Therefore, sysadmins familiar with the system environment can easily verify the presence and the progression of an attack, even without the missing components. Note that graph reduction (§ 4.4) does not lead to missing entities; instead, these are the result of low s during anomaly detection.
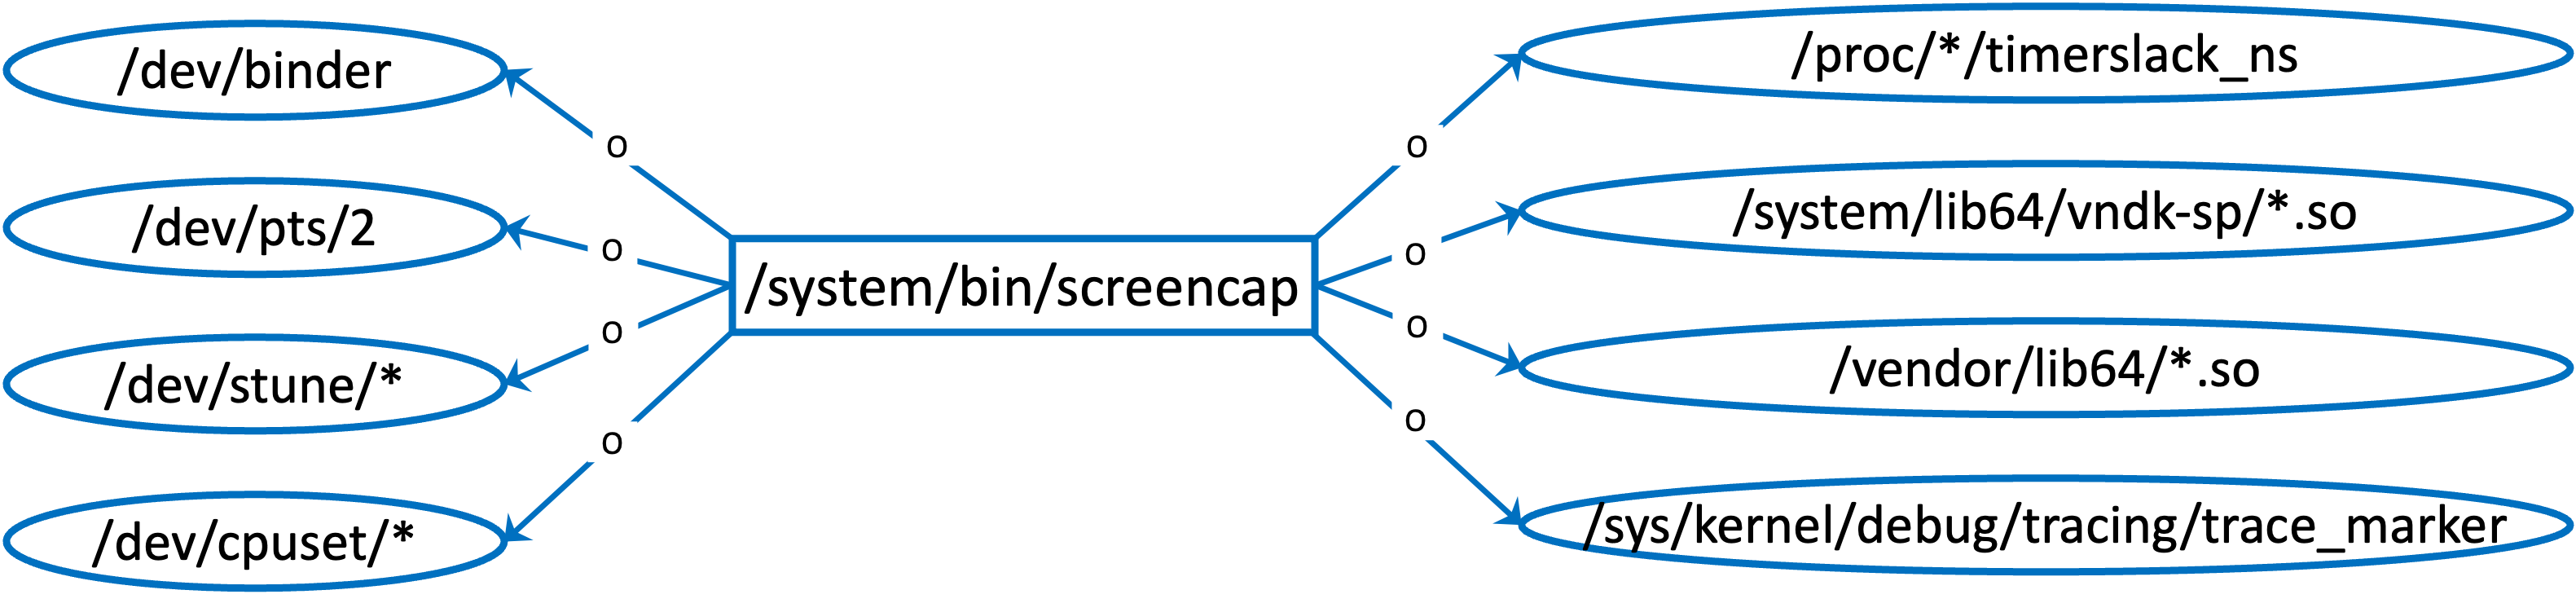
The Benign Summary Graph. Fig. 5 shows a benign candidate summary graph. Unlike attack graphs, benign graphs from Kairos typically have one or two process nodes that are hubs, forming small “communities” with well-defined behavioral boundaries from other processes. These graphs are isolated by Kairos, often because they represent benign but uncommon activity. For example, as discussed in § 5.2, screencap in Fig. 5 never appeared in training, thus resulting in relatively high reconstruction errors among its edges. However, it is easy for sysadmins to quickly disregard this benign candidate summary graph, because it is small and well-structured.
| Dataset | Min (s) | Median (s) | Percentile (s) | Max (s) |
|---|---|---|---|---|
| DARPA-E3-THEIA | 0.9 | 12.1 | 35.2 | 228.8 |
| DARPA-E3-CADETS | 1.3 | 2.5 | 4.9 | 19.7 |
| DARPA-E3-ClearScope | 0.1 | 3.8 | 4.9 | 19.7 |
| DARPA-E5-THEIA | 3.6 | 38.3 | 124.7 | 376.2 |
| DARPA-E5-CADETS | 0.5 | 7.2 | 12.1 | 16.3 |
| DARPA-E5-ClearScope | 0.1 | 8.2 | 40.1 | 68.8 |
| DARPA-OpTC | 3.7 | 19.8 | 35.7 | 111.7 |
5.6 End-to-end Performance
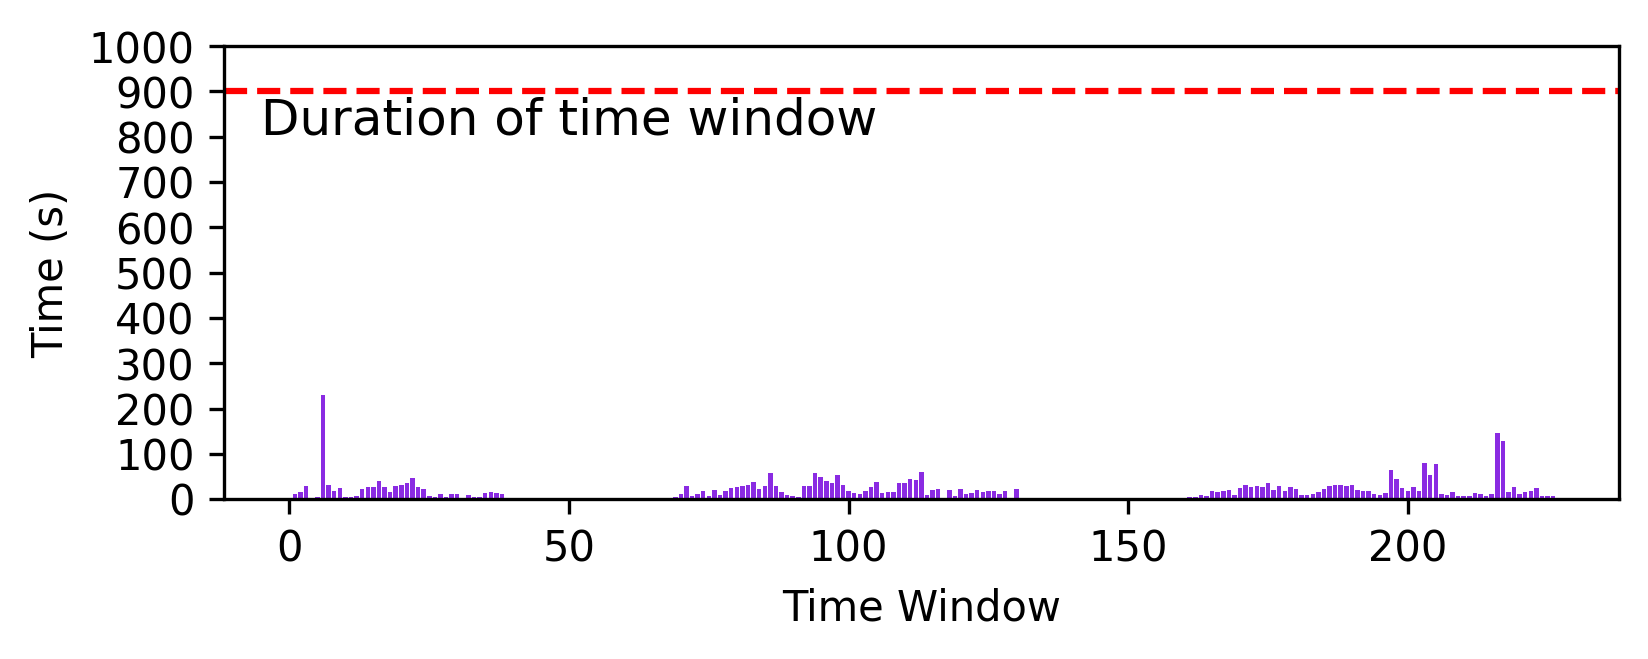
Kairos processes a streaming provenance graph at regular intervals of a time window and raises an intrusion alert when an anomalous time window queue is detected (§ 4). We show in Fig. 6 the time it takes for Kairos to process -minute time windows on E3-THEIA. Throughout this experiment, Kairos takes at most seconds (or of 15 minutes) to process a single time window (which contains about edges), well below the duration of a time window. The median size of time windows in our dataset has edges, which takes only seconds to compute. We cannot clearly show the execution time of many time windows in Fig. 6, because it takes only about one second (or less) to compute each, as they contain fewer than edges. Kairos’ computational cost is proportional to the number of graph elements in a time window. Table X summarizes time window execution times for all DARPA datasets. Compared to StreamSpot [21], which processes around edges per second, Kairos incurs slightly higher latency, processing about edges per second. However, Kairos significantly outperforms StreamSpot in detection accuracy (§ 5.3). Moreover, prior work [2] has shown that a provenance capture system typically generates fewer than edges per second, even when the host system is busy. As such, Kairos can just as easily process a streaming provenance graph without “falling behind”. Furthermore, as we discuss in § 5.4, Kairos’ time window approach, similar to batch processing implemented in Unicorn [2] and ThreaTrace [8], does not affect its detection timeliness. Therefore, Kairos can effectively monitor a host system at run time.
6 Discussion
Data Poisoning. If attackers can poison training data to include malicious activity, which is then learned by a machine learning model, future attacks will remain undetected. Data poisoning poses a serious threat to all anomaly-based intrusion detection systems. To the best of our knowledge, SIGL [14] is the only PIDS that has evaluated its robustness against data poisoning in depth, but its detection algorithm works at a much smaller scale. Others, unfortunately, have much more limited evaluation, if at all. For example, ShadeWatcher [7], which has a system-wide scope equivalent to that of Kairos, attempts to evaluate data poisoning using the DARPA datasets. The authors use one day of the attack data during training and show that ShadeWatcher can detect an attack on the second day. We perform similar evaluation and obtain equally good results showing that detection performance is barely affected. However, such evaluation is misleading, because attack activities performed on one day will be different on another day. To properly evaluate robustness, we need carefully-crafted, open-source datasets. Creating such datasets is beyond the scope of this paper.
Evasion. An adversarial attacker with some knowledge of an intrusion detection system can introduce noise or mimic benign system behavior during an attack to mislead the detection system. While evasion attacks [60, 61, 69], such as mimicry attacks [70], are a threat to all PIDSes, evading deep graph learning based systems like Kairos is nontrivial. Kairos differentiates between benign and malicious activity based on both structural and temporal interactions between system entities. Therefore, to mimic benign behavior, the attacker must carefully orchestrate attack activity such that a malicious process interacts with a similar set of system objects in a similar sequential order while ensuring that the actual attack logic remains unchanged. This requires the attacker to have a great knowledge of the target system’s benign behavior and likely the inner workings of the trained model. Even then, prior work [14] has shown that existing adversarial attacks on graphs cannot evade PIDSes, because provenance graphs have more structural and temporal constraints than other types of graphs (e.g., social networks). We further evaluated Kairos using an evasion dataset based on DARPA’s E3-THEIA published by a recent robustness study [71]. Kairos detected the camouflaged attack, but in the summary graph (§ 4.4), it reported only a small subset of the attack activity described in DARPA’s ground truth. While we at first suspected that the evasion approach proposed in the study was to some extent effective, upon further inspection, we discovered that the published dataset contains only the attack behavior identified by Kairos, rather than the full attack traces included in the original DARPA dataset. This discovery highlights the importance of a meaningful intrusion report; a tool like Kairos would have helped the authors remedy this issue.
Limitations of Evaluation. We identify three major issues in PIDS evaluation in general. First, there lacks open-source implementation of published PIDSes for comparison. Second, only limited publicly-accessible datasets exist, and almost all of them are poorly documented. It is thus difficult to identify any bias in datasets that might produce misleading results. Third, no single performance metric exists to ensure meaningful comparison. PIDSes differ in their detection granularity; in § 5.3, ad-hoc conversion for the sake of comparison inadvertently introduces biases. These issues weaken the conclusion of our own evaluation (and potentially that of others) and significantly hinder independent reproduction of results. We encourage the community to advocate public releases of software artifacts and datasets.
7 Related Work
Historically, PIDSes have had to make trade-offs along four dimensions: scope, attack agnosticity, timeliness, and attack reconstruction (§ 1). Kairos is the first to reconcile these dimensions while providing comparable, if not superior, detection performance. It is also the first to efficiently integrate the reduction, detection, and investigation layers of the system auditing stack [72] with minimal overhead.
Provenance-based Intrusion Detection. A number of prior PIDSes have used signature-based techniques to match known attack behavior in provenance graphs [64, 19, 3, 17, 22]. However, these approaches are not attack agnostic and therefore have difficulties in detecting unknown attacks. Other approaches leverage anomaly-based detection techniques, but they either (1) fail to scale to the entire system [5, 14], (2) cannot reconstruct attack stories [21, 20, 2, 27, 7], and/or (3) require offline analysis [40]. Kairos overcomes all these limitations simultaneously, while achieving similar or better detection and computational performance.
Provenance-based Investigation. PIDSes [3, 22] have often relied on known attack signatures to provide attack attribution for detection. Prior anomaly-based PIDSes [10, 20, 21] require sysadmins to manually inspect large anomalous graphs, thus difficult to use in practice. Recently, ShadeWatcher [7] and ThreaTrace [8] take a step in the right direction, identifying individual anomalies at the node level. However, unlike Kairos, they fail to reconstruct complete and coherent attack stories but merely provide a starting point for sysadmins to sift through a large amount of data. Similarly but perhaps more problematically, SIGL [14] not only identifies just anomalous nodes, but also has limited scalability, which makes it unsuitable to analyze provenance graphs of a whole-system scope to detect advanced attacks. Recently, Yang et al. [73] proposed ProGrapher that, similar to Unicorn, detects anomalies at the graph level. To support finer-grained attack investigation, it ranks graph nodes based on their degrees of anomalousness, which is similar to SIGL [14]. Therefore, post-detection investigation remains labor-intensive. Note that ProGrapher is closed-source and reports worse overall detection accuracy than Kairos. DepComm [74] partitions a provenance graph into process-centric communities based on pre-defined random walk schemes and extracts for each community paths that describes how information flows through it. While paths provide more useful context for attack investigation than nodes, DepComm requires point-of-interest events or attack signatures from an IDS (e.g., Holmes [3]) to reconstruct an attack story.
Provenance Reduction. Different techniques [41, 75, 5] have been proposed to reduce the size of provenance graphs. Reduction is performed either before intrusion detection or during attack investigation to reduce computational and memory overhead [72]. For example, ShadeWatcher [7] performs causality preserving reduction [41] before intrusion detection. In contrast, Kairos leverages reduction techniques post-detection only to minimize a sysadmin’s mental load but performs detection efficiently at scale on the entire graph. Thus, Kairos’ graph reduction does not affect detection.
8 Conclusion
Kairos is the first provenance-based intrusion detection system that detects system-wide anomalies and generates succinct attack graphs to describe them without prior attack knowledge. Our evaluation demonstrates that Kairos can effectively monitor long-running systems at run time, outperforms the state-of-the-art, and incurs minimal performance overhead.
Acknowledgments
We thank S&P 2023 and 2024 anonymous reviewers for their insightful comments. We acknowledge the support of the Natural Sciences and Engineering Research Council of Canada (NSERC). Nous remercions le Conseil de recherches en sciences naturelles et en génie du Canada (CRSNG) de son soutien. This work was partially supported by research funding from the National Research Council Canada (NRC). This material is based upon work supported by the U.S. National Science Foundation under Grant CNS-2245442. Any opinions, findings, and conclusions or recommendations expressed in this material are those of the author(s) and do not necessarily reflect the views of the National Science Foundation.
References
- [1] Z. Cheng, Q. Lv, J. Liang, Y. Wang, D. Sun, T. Pasquier, and X. Han, “Kairos: Practical Intrusion Detection and Investigation using Whole-system Provenance,” in Symposium on Security and Privacy (S&P’24). IEEE, 2024.
- [2] X. Han, T. Pasquier, A. Bates, J. Mickens, and M. I. Seltzer, “Unicorn: Runtime provenance-based detector for advanced persistent threats,” in Network and Distributed System Security Symposium (NDSS’20). The Internet Society, 2020.
- [3] S. M. Milajerdi, R. Gjomemo, B. Eshete, R. Sekar, and V. N. Venkatakrishnan, “HOLMES: real-time APT detection through correlation of suspicious information flows,” in Symposium on Security and Privacy, (S&P’19). IEEE, 2019.
- [4] M. Barré, A. Gehani, and V. Yegneswaran, “Mining Data Provenance to Detect Advanced Persistent Threats,” in International Workshop on Theory and Practice of Provenance (TaPP’19). USENIX, 2019.
- [5] W. U. Hassan, M. Lemay, N. Aguse, A. Bates, and T. Moyer, “Towards Scalable Cluster Auditing through Grammatical Inference over Provenance Graphs,” in Network and Distributed System Security Symposium (NDSS’18). The Internet Society, 2018.
- [6] Y. Xie, D. Feng, Z. Tan, and J. Zhou, “Unifying intrusion detection and forensic analysis via provenance awareness,” Future Generation Computer Systems, vol. 61, pp. 26–36, 2016.
- [7] J. Zengy, X. Wang, J. Liu, Y. Chen, Z. Liang, T.-S. Chua, and Z. L. Chua, “ShadeWatcher: Recommendation-guided cyber threat analysis using system audit records,” in Symposium on Security and Privacy (S&P’22). IEEE, 2022.
- [8] S. Wang, Z. Wang, T. Zhou, X. Yin, D. Han, H. Zhang, H. Sun, X. Shi, and J. Yang, “Threatrace: Detecting and tracing host-based threats in node level through provenance graph learning,” IEEE Transactions on Information Forensics and Security, 2022.
- [9] P. Chen, L. Desmet, and C. Huygens, “A study on advanced persistent threats,” in International Conference on Communications and Multimedia Security (CMS’14). Springer, 2014.
- [10] T. Pasquier, X. Han, M. Goldstein, T. Moyer, D. M. Eyers, M. I. Seltzer, and J. Bacon, “Practical whole-system provenance capture,” in Symposium on Cloud Computing (SoCC’17). ACM, 2017, pp. 405–418.
- [11] Google Project Zero, “The More You Know, The More You Know You Don’t Know,” 2022, https://googleprojectzero.blogspot.com/2022/04/the-more-you-know-more-you-know-you.html.
- [12] M. Sohm, “Research on various techniques to bypass default falco ruleset,” https://github.com/blackberry/Falco-bypasses.
- [13] “Container runtime security bypasses on falco,” https://www.antitree.com/2019/09/container-runtime-security-bypasses-on-falco/.
- [14] X. Han, X. Yu, T. Pasquier, D. Li, J. Rhee, J. W. Mickens, M. I. Seltzer, and H. Chen, “SIGL: securing software installations through deep graph learning,” in Security Symposium (Sec’21). USENIX, 2021.
- [15] F. Liu, Y. Wen, D. Zhang, X. Jiang, X. Xing, and D. Meng, “Log2vec: A heterogeneous graph embedding based approach for detecting cyber threats within enterprise,” in Conference on Computer and Communications Security (CCS’19). ACM, 2019.
- [16] M. Du, F. Li, G. Zheng, and V. Srikumar, “Deeplog: Anomaly detection and diagnosis from system logs through deep learning,” in Conference on Computer and Communications Security (CCS’17). ACM, 2017.
- [17] S. M. Milajerdi, B. Eshete, R. Gjomemo, and V. N. Venkatakrishnan, “POIROT: Aligning Attack Behavior with Kernel Audit Records for Cyber Threat Hunting,” in Conference on Computer and Communications Security (CCS’19). ACM, 2019.
- [18] S. T. King and P. M. Chen, “Backtracking intrusions,” in Symposium on Operating Systems Principles (SOSP’03). ACM, 2003.
- [19] W. U. Hassan, S. Guo, D. Li, Z. Chen, K. Jee, Z. Li, and A. Bates, “Nodoze: Combatting threat alert fatigue with automated provenance triage,” in Network and Distributed System Security Symposium (NDSS’19). The Internet Society, 2019.
- [20] X. Han, T. Pasquier, T. Ranjan, M. Goldstein, and M. I. Seltzer, “Frappuccino: Fault-detection through runtime analysis of provenance,” in Workshop on Hot Topics in Cloud Computing (HotCloud’17). USENIX, 2017.
- [21] E. Manzoor, S. Momeni, V. Venkatakrishnan, and L. Akoglu, “Fast memory-efficient anomaly detection in streaming heterogeneous graphs,” International Conference on Knowledge Discovery and Data Mining (KDD’16), 2016.
- [22] W. U. Hassan, A. Bates, and D. Marino, “Tactical Provenance Analysis for Endpoint Detection and Response Systems,” in Symposium on Security and Privacy (S&P’20). IEEE, 2020.
- [23] D. J. Pohly, S. McLaughlin, P. McDaniel, and K. Butler, “Hi-fi: collecting high-fidelity whole-system provenance,” in Annual Computer Security Applications Conference (ACSAC’12), 2012.
- [24] A. D. Keromytis, “Transparent Computing Engagement 3 Data Release,” 2018, https://github.com/darpa-i2o/Transparent-Computing/blob/master/README-E3.md.
- [25] Mandiant, “APT1: Exposing One of China’s Cyber Espionage Units,” 2013, https://www.mandiant.com/resources/apt1-exposing-one-of-chinas-cyber-espionage-units.
- [26] M. Fazzini, “Tagging and tracking of multi-level host events for transparent computing,” 2017, https://smartech.gatech.edu/handle/1853/56510.
- [27] Q. Wang, W. U. Hassan, D. Li, K. Jee, X. Yu, K. Zou, J. Rhee, Z. Chen, W. Cheng, C. A. Gunter, and H. Chen, “You Are What You Do: Hunting Stealthy Malware via Data Provenance Analysis,” in Network and Distributed System Security Symposium (NDSS’20). The Internet Society, 2020.
- [28] A. Tsymbal, “The problem of concept drift: definitions and related work,” Computer Science Department, Trinity College Dublin, 2004.
- [29] A. Bates, D. J. Tian, K. R. Butler, and T. Moyer, “Trustworthy Whole-System Provenance for the Linux Kernel,” in Security Symposium. USENIX, 2015.
- [30] R. Paccagnella, P. Datta, W. U. Hassan, A. Bates, C. W. Fletcher, A. Miller, and D. Tian, “Custos: Practical Tamper-Evident Auditing of Operating Systems Using Trusted Execution,” in Network and Distributed System Security Symposium. The Internet Society, 2020.
- [31] R. Paccagnella, K. Liao, D. Tian, and A. Bates, “Logging to the Danger Zone: Race Condition Attacks and Defenses on System Audit Frameworks,” in Conference on Computer and Communications (CCS’20). ACM, 2020.
- [32] P. Li, Y. Yang, M. Pagnucco, and Y. Song, “Explainability in graph neural networks: An experimental survey,” CoRR, vol. abs/2203.09258, 2022.
- [33] Z. Zhang, P. Qi, and W. Wang, “Dynamic malware analysis with feature engineering and feature learning,” AAAI Conference on Artificial Intelligence, 2021.
- [34] S. M. Kazemi, R. Goel, K. Jain, I. Kobyzev, A. Sethi, P. Forsyth, and P. Poupart, “Representation Learning for Dynamic Graphs: A Survey,” Journal of Machine Learning Research, 2020.
- [35] E. Rossi, B. Chamberlain, F. Frasca, D. Eynard, F. Monti, and M. Bronstein, “Temporal graph networks for deep learning on dynamic graphs,” International Conference on Machine Learning (ICML’20), 2020.
- [36] Y. Shi, Z. Huang, W. Wang, H. Zhong, S. Feng, and Y. Sun, “Masked label prediction: Unified massage passing model for semi-supervised classification,” in IJCAI, 2021.
- [37] T. F. J. Pasquier, X. Han, T. Moyer, A. Bates, O. Hermant, D. M. Eyers, J. Bacon, and M. I. Seltzer, “Runtime analysis of whole-system provenance,” in Conference on Computer and Communications Security (CCS’18). ACM, 2018.
- [38] K. Cho, B. van Merrienboer, Çaglar Gülçehre, D. Bahdanau, F. Bougares, H. Schwenk, and Y. Bengio, “Learning phrase representations using rnn encoder–decoder for statistical machine translation,” in EMNLP, 2014.
- [39] K. Church and W. Gale, “Inverse document frequency (idf): A measure of deviations from poisson,” in Natural language processing using very large corpora. Springer, 1999.
- [40] Y. Liu, M. Zhang, D. Li, K. Jee, Z. Li, Z. Wu, J. Rhee, and P. Mittal, “Towards a timely causality analysis for enterprise security,” in Network and Distributed System Security Symposium. The Internet Society, 2018.
- [41] Z. Xu, Z. Wu, Z. Li, K. Jee, J. Rhee, X. Xiao, F. Xu, H. Wang, and G. Jiang, “High fidelity data reduction for big data security dependency analyses,” in Conference on Computer and Communications Security (CCS’16). ACM, 2016.
- [42] K. Pei, Z. Gu, B. Saltaformaggio, S. Ma, F. Wang, Z. Zhang, L. Si, X. Zhang, and D. Xu, “HERCULE: attack story reconstruction via community discovery on correlated log graph,” in Annual Conference on Computer Security Applications. ACM, 2016.
- [43] V. D. Blondel, J.-L. Guillaume, R. Lambiotte, and E. Lefebvre, “Fast unfolding of communities in large networks,” Journal of Statistical Mechanics: Theory and Experiment, 2008.
- [44] L. Akoglu, H. Tong, and D. Koutra, “Graph based anomaly detection and description: a survey,” Data Mining and Knowledge Discovery, 2015.
- [45] S. T. King, Z. M. Mao, D. G. Lucchetti, and P. M. Chen, “Enriching intrusion alerts through multi-host causality,” in Network and Distributed System Security Symposium (NDSS’05). The Internet Society, 2005.
- [46] “scikit-learn: machine learning in Python,” 2021, https://scikit-learn.org/.
- [47] M. Fey and J. E. Lenssen, “Fast graph representation learning with PyTorch Geometric,” in ICLR Workshop on Representation Learning on Graphs and Manifolds, 2019.
- [48] A. Hagberg, P. Swart, and D. S Chult, “Exploring network structure, dynamics, and function using networkx,” Los Alamos National Lab., Tech. Rep., 2008.
- [49] J. Ellson, E. Gansner, L. Koutsofios, S. C. North, and G. Woodhull, “Graphviz—open source graph drawing tools,” in International Symposium on Graph Drawing. Springer, 2001.
- [50] E. Manzoor, S. Momeni, V. Venkatakrishnan, and L. Akoglu, “StreamSpot Code and Data,” 2016, https://sbustreamspot.github.io/.
- [51] J. Torrey, “Transparent Computing Engagement 5 Data Release,” 2020, https://github.com/darpa-i2o/Transparent-Computing.
- [52] M. van Opstal and W. Arbaugh, “Operationally Transparent Cyber (OpTC) Data Release,” 2019, https://github.com/FiveDirections/OpTC-data.
- [53] H. Yu, A. Li, and R. Jiang, “Needle in a haystack: Attack detection from large-scale system audit,” International Conference on Communication Technology (ICCT’19), 2019.
- [54] G. Berrada and J. Cheney, “Aggregating unsupervised provenance anomaly detectors,” in International Workshop on Theory and Practice of Provenance (TaPP’19). USENIX, 2019.
- [55] G. Berrada, S. Benabderrahmane, J. Cheney, W. Maxwell, H. Mookherjee, A. Theriault, and R. Wright, “A baseline for unsupervised advanced persistent threat detection in system-level provenance,” Future Generation of Computer Systems, 2020.
- [56] Y. Xie, Y. Wu, D. Feng, and D. D. E. Long, “P-Gaussian: Provenance-Based Gaussian Distribution for Detecting Intrusion Behavior Variants Using High Efficient and Real Time Memory Databases,” IEEE Transactions on Dependable and Secure Computing, 2021.
- [57] M. N. Hossain, S. Sheikhi, and R. C. Sekar, “Combating dependence explosion in forensic analysis using alternative tag propagation semantics,” Symposium on Security and Privacy (S&P’20), 2020.
- [58] B. Jacob, P. Larson, B. Leitao, and S. Da Silva, “Systemtap: instrumenting the linux kernel for analyzing performance and functional problems,” IBM Redbook, vol. 116, 2008.
- [59] D. Arp, E. Quiring, F. Pendlebury, A. Warnecke, F. Pierazzi, C. Wressnegger, L. Cavallaro, and K. Rieck, “Dos and don’ts of machine learning in computer security,” in Security Symposium (USENIX Sec’22). USENIX, 2022.
- [60] D. Zügner, A. Akbarnejad, and S. Günnemann, “Adversarial attacks on neural networks for graph data,” in International Conference on Knowledge Discovery & Data Mining (KDD’18). ACM, 2018.
- [61] D. Zügner and S. Günnemann, “Adversarial attacks on graph neural networks via meta learning,” in International Conference on Learning Representations, 2019.
- [62] X. Zhang and M. Zitnik, “GNNGuard: Defending Graph Neural Networks against Adversarial Attacks,” in Conference on Neural Information Processing Systems (NeurIPS’20), 2020.
- [63] A. Alsaheel, Y. Nan, S. Ma, L. Yu, G. Walkup, Z. B. Celik, X. Zhang, and D. Xu, “Atlas: A sequence-based learning approach for attack investigation,” in Security Symposium (Sec’21). USENIX, 2021.
- [64] M. N. Hossain, S. M. Milajerdi, J. Wang, B. Eshete, R. Gjomemo, R. Sekar, S. D. Stoller, and V. N. Venkatakrishnan, “SLEUTH: Real-time Attack Scenario Reconstruction from COTS Audit Data,” in Security Symposium, (USENIX Sec’17). USENIX, 2017.
- [65] C. Xiong, T. Zhu, W. Dong, L. Ruan, R. Yang, Y. Cheng, Y. Chen, S. Cheng, and X. Chen, “Conan: A Practical Real-Time APT Detection System With High Accuracy and Efficiency,” IEEE Transactions on Dependable and Secure Computing, 2022.
- [66] A. Grover and J. Leskovec, “node2vec: Scalable Feature Learning for Networks,” in International Conference on Knowledge Discovery and Data Mining (KDD’16). ACM, 2016.
- [67] D. Han, Z. Wang, W. Chen, Y. Zhong, S. Wang, H. Zhang, J. Yang, X. Shi, and X. Yin, “DeepAID: Interpreting and Improving Deep Learning-based Anomaly Detection in Security Applications,” in Conference on Computer and Communications Security (CCS’21). ACM, 2021.
- [68] Z. Cheng, Q. Lv, J. Liang, Y. Wang, D. Sun, T. Pasquier, and X. Han, “KAIROS: Practical Intrusion Detection and Investigation using Whole-system Provenance (Supplementary Material),” 2023, https://github.com/ProvenanceAnalytics/kairos/blob/main/supplementary-material.pdf.
- [69] B. Wang and N. Z. Gong, “Attacking graph-based classification via manipulating the graph structure,” in Conference on Computer and Communications Security (CCS’19), 2019.
- [70] D. A. Wagner and P. Soto, “Mimicry attacks on host-based intrusion detection systems,” in Conference on Computer and Communications Security (CCS’02). ACM, 2002, pp. 255–264.
- [71] A. Goyal, X. Han, G. Wang, and A. Bates, “Sometimes, you aren’t what you do: Mimicry attacks against provenance graph host intrusion detection systems,” in Network and Distributed System Security Symposium, (NDSS’23). The Internet Society, 2023.
- [72] M. A. Inam, Y. Chen, A. Goyal, J. Liu, J. Mink, N. Michael, S. Gaur, A. Bates, and W. U. Hassan, “Sok: History is a vast early warning system: Auditing the provenance of system intrusions,” in Symposium on Security and Privacy. IEEE, 2022.
- [73] F. Yang, J. Xu, C. Xiong, Z. Li, and K. Zhang, “Prographer: An anomaly detection system based on provenance graph embedding,” 2023.
- [74] Z. Xu, P. Fang, C. Liu, X. Xiao, Y. Wen, and D. Meng, “Depcomm: Graph summarization on system audit logs for attack investigation,” in 2022 IEEE Symposium on Security and Privacy (SP). IEEE, 2022, pp. 540–557.
- [75] M. N. Hossain, J. Wang, O. Weisse, R. Sekar, D. Genkin, B. He, S. D. Stoller, G. Fang, F. Piessens, E. Downing et al., “Dependence-Preserving Data Compaction for Scalable Forensic Analysis,” in Security Symposium (USENIX Sec’18). USENIX, 2018.
Appendix A DARPA Dataset Details
Table XI summarizes the attack scenarios in the DAPRA datasets. We describe each attack scenario in detail in a separate document [68]. Table XII summarizes the specific data we use from the datasets for training, validation, and detection. Similar to prior work [7], we also perform noise reduction and define an allow-list of trusted data objects that are removed from the causal analysis.
| Dataset | Duration | Platform | Attack Surface |
|---|---|---|---|
| E3-THEIA | 02d00h12m | Ubuntu 12.04 x64 | Firefox |
| E3-CADETS | 00d00h55m | FreeBSD | Nginx |
| E3-ClearScope | 00d01h08m | Android 6.0.1 | Firefox |
| E5-THEIA | 00d00h21m | Ubuntu 12.04 x64 | Firefox |
| E5-CADETS | 01d01h14m | FreeBSD 13 | Nginx |
| E5-ClearScope | 02d01h02m | Android 8 | Appstarter APK |
| OpTC | 02d03h00m | Windows | PowerShell |
| Datasets |
|
|
|
||||||
|---|---|---|---|---|---|---|---|---|---|
| E3-THEIA |
|
2018-04-09 |
|
||||||
| E3-CADETS |
|
2018-04-05 |
|
||||||
| E3-ClearScope |
|
2018-04-07 |
|
||||||
| E5-THEIA |
|
2019-05-11 |
|
||||||
| E5-CADETS |
|
2019-05-12 |
|
||||||
| E5-ClearScope |
|
2019-05-12 |
|
||||||
| OpTC | 2019-09-22 | 2019-09-23 |
|
Appendix B Hyperparameter Impact on Performance
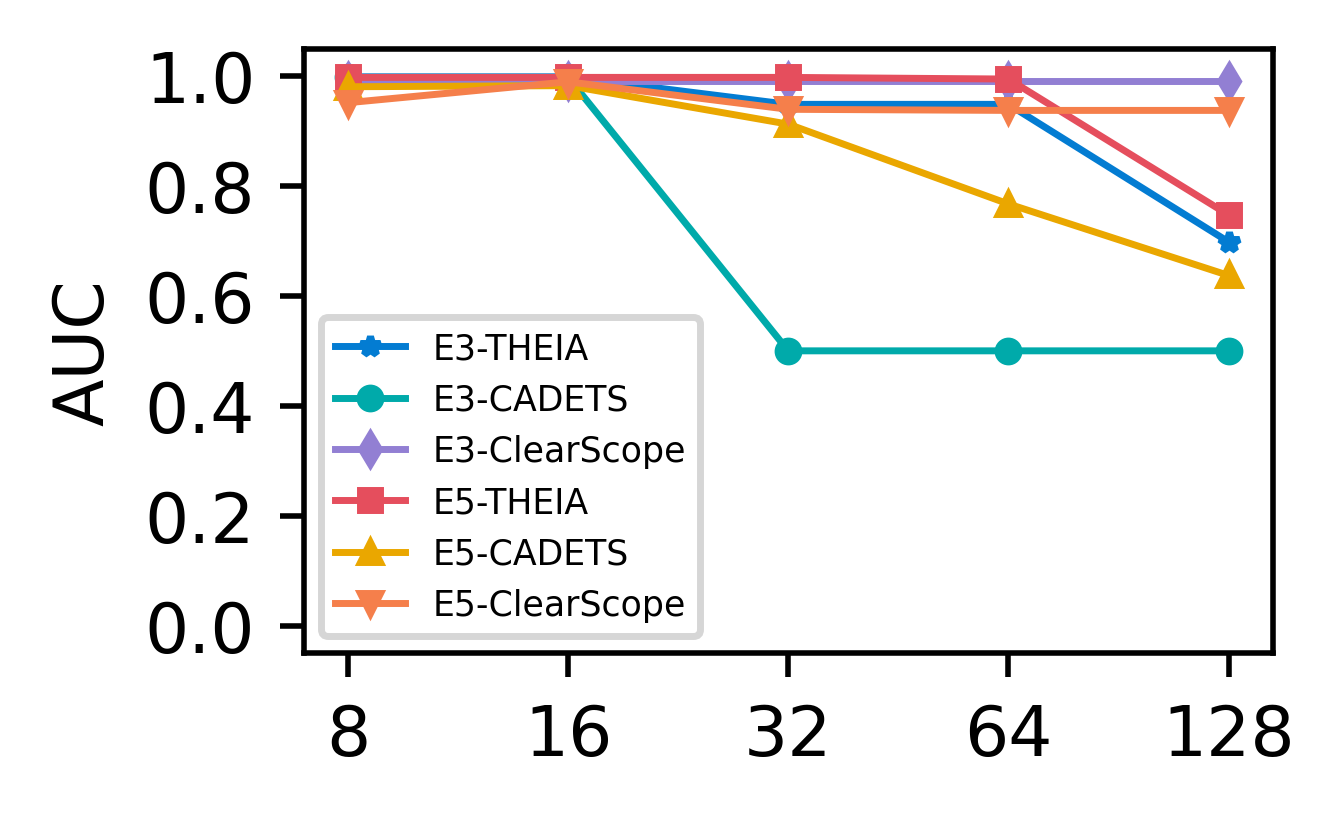
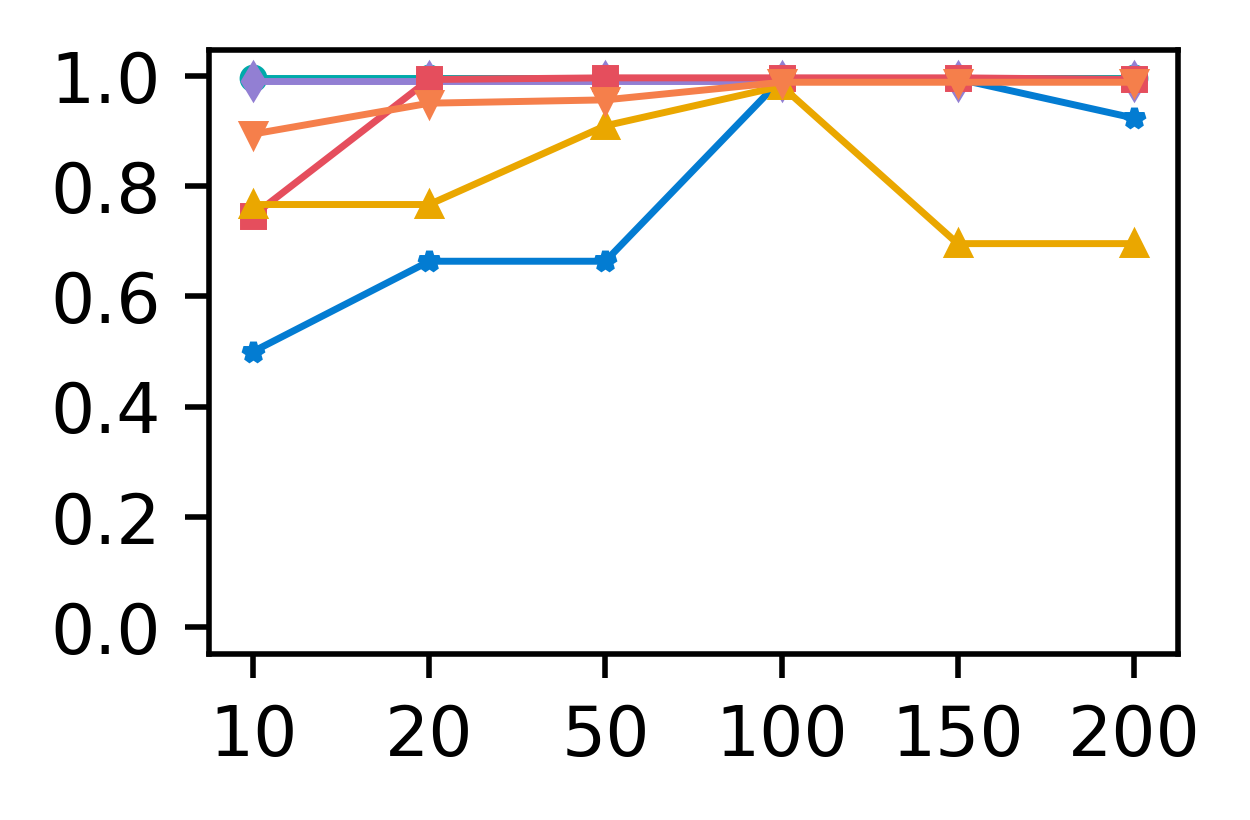
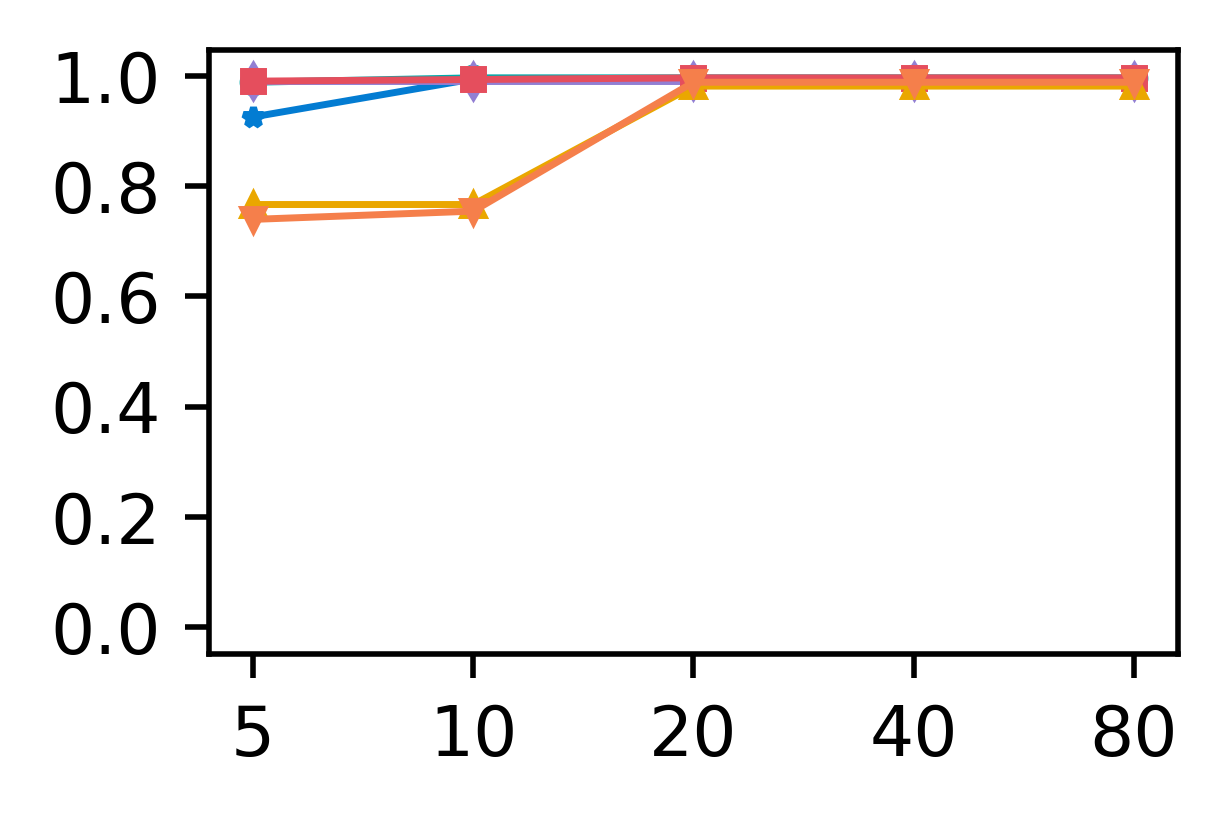
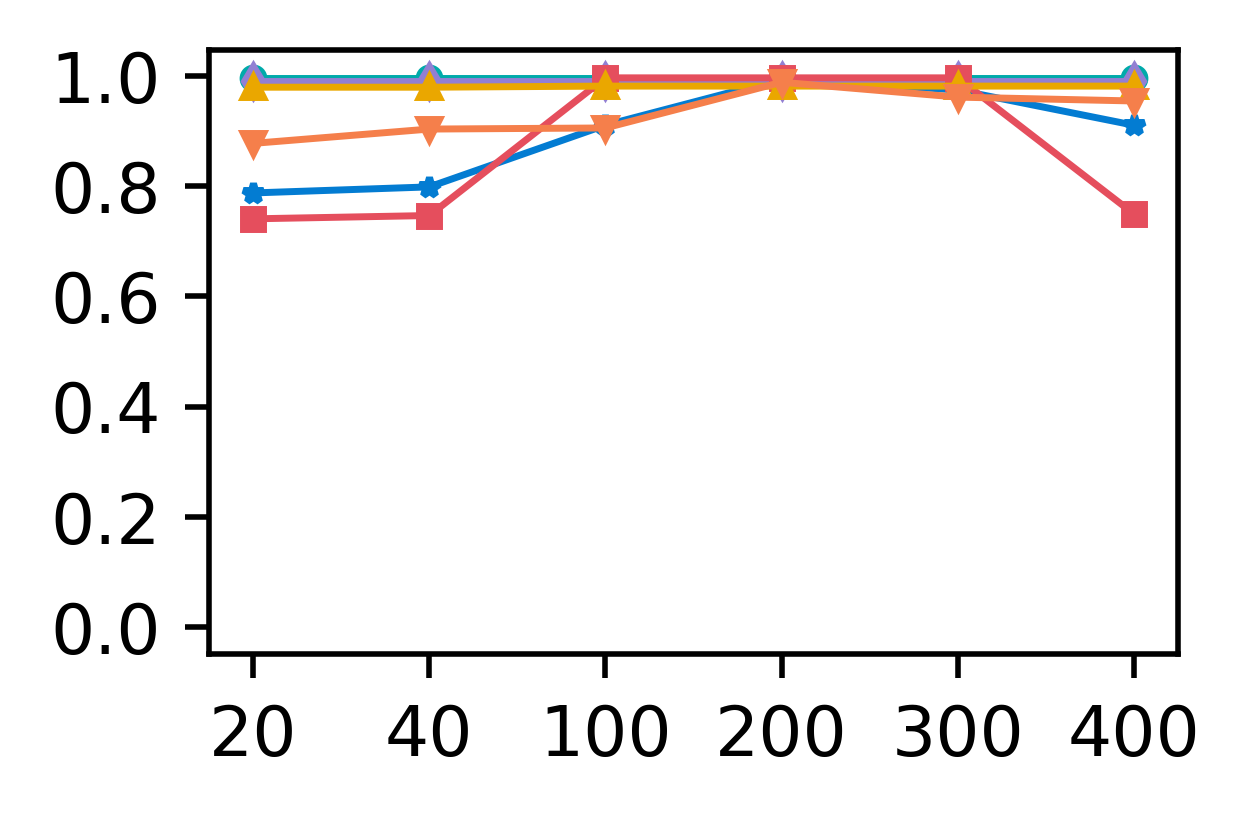
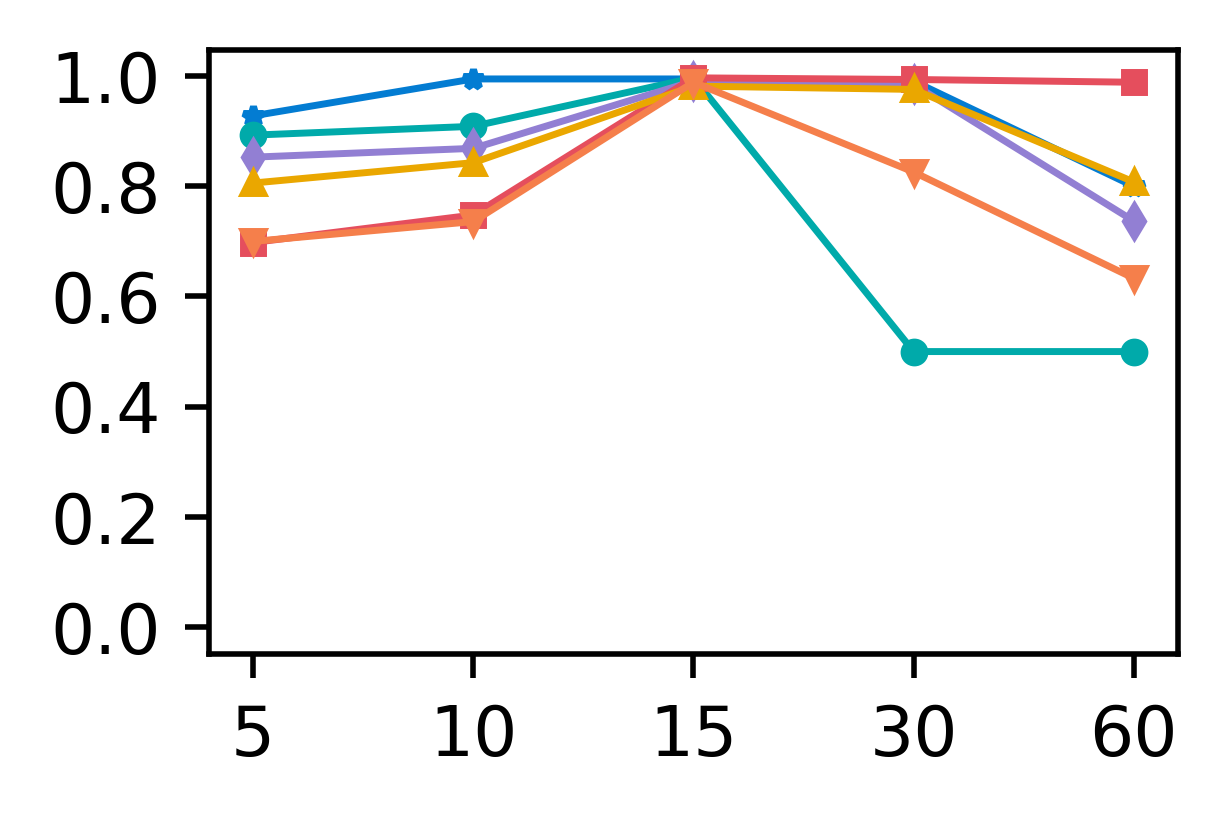
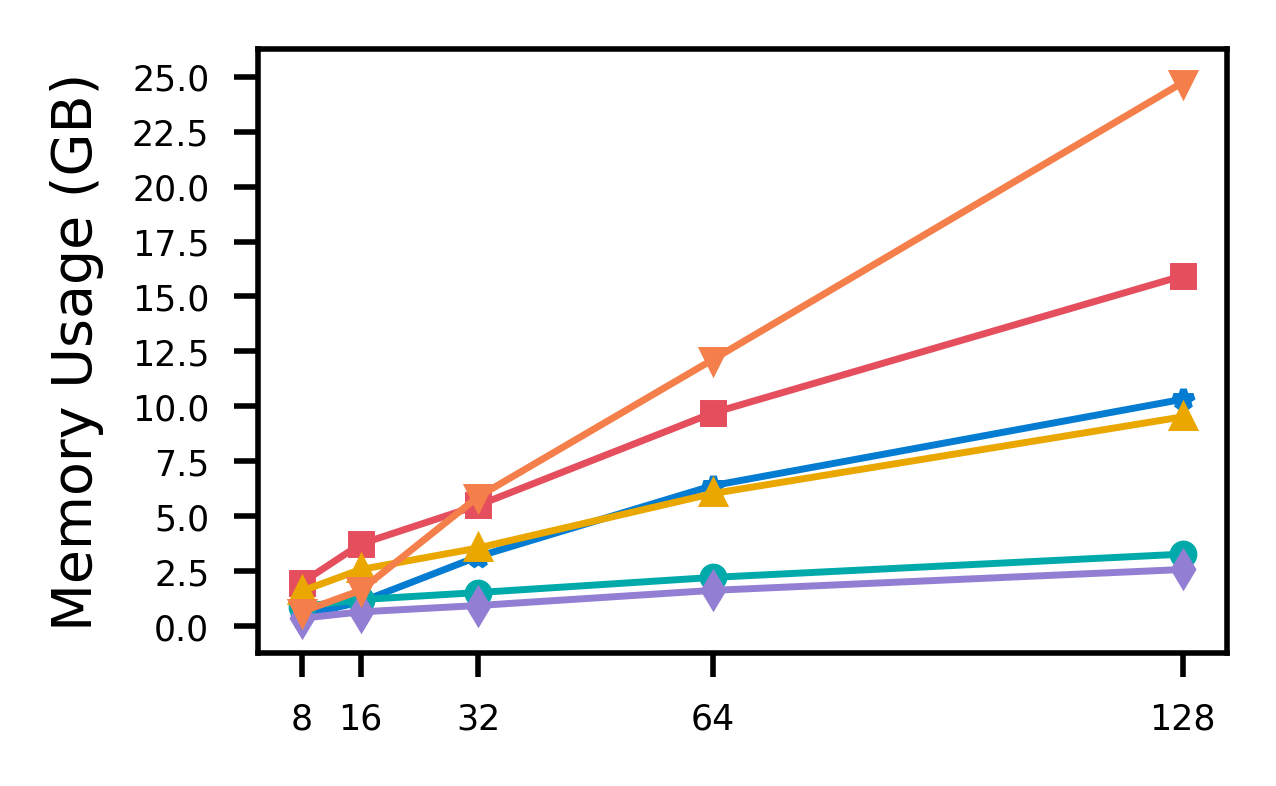
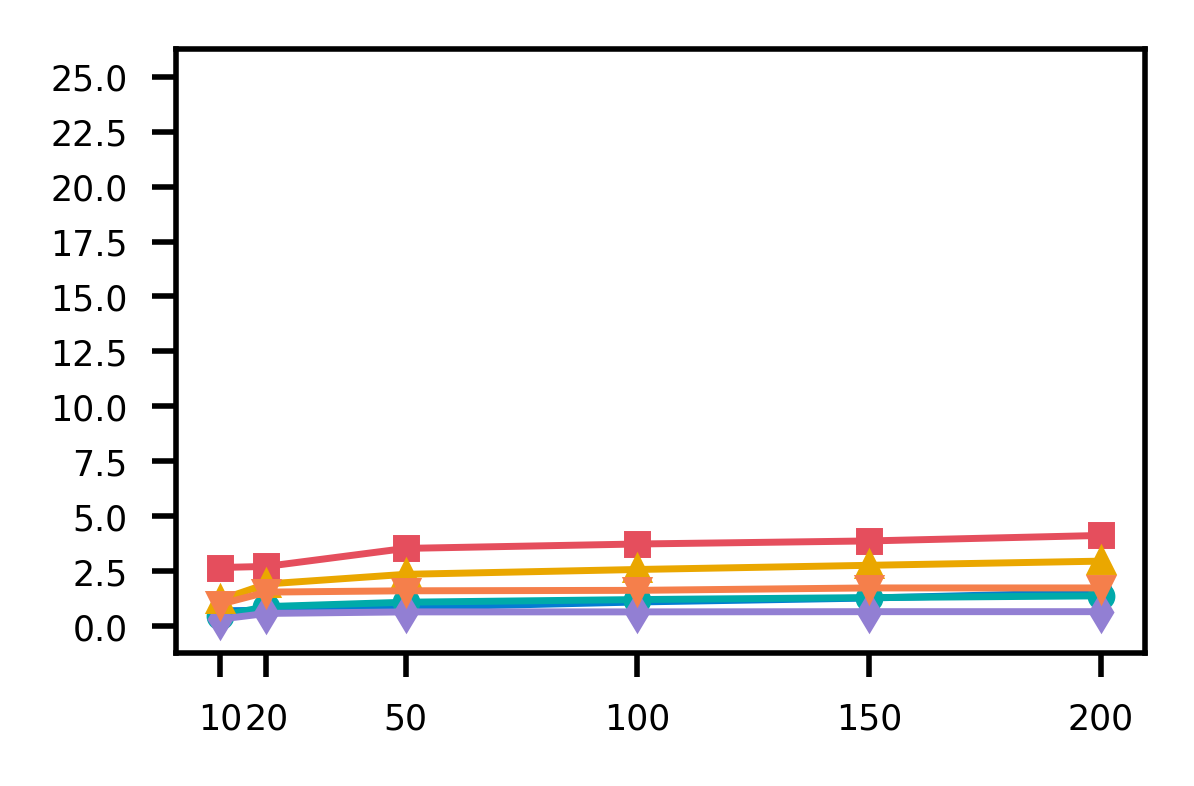
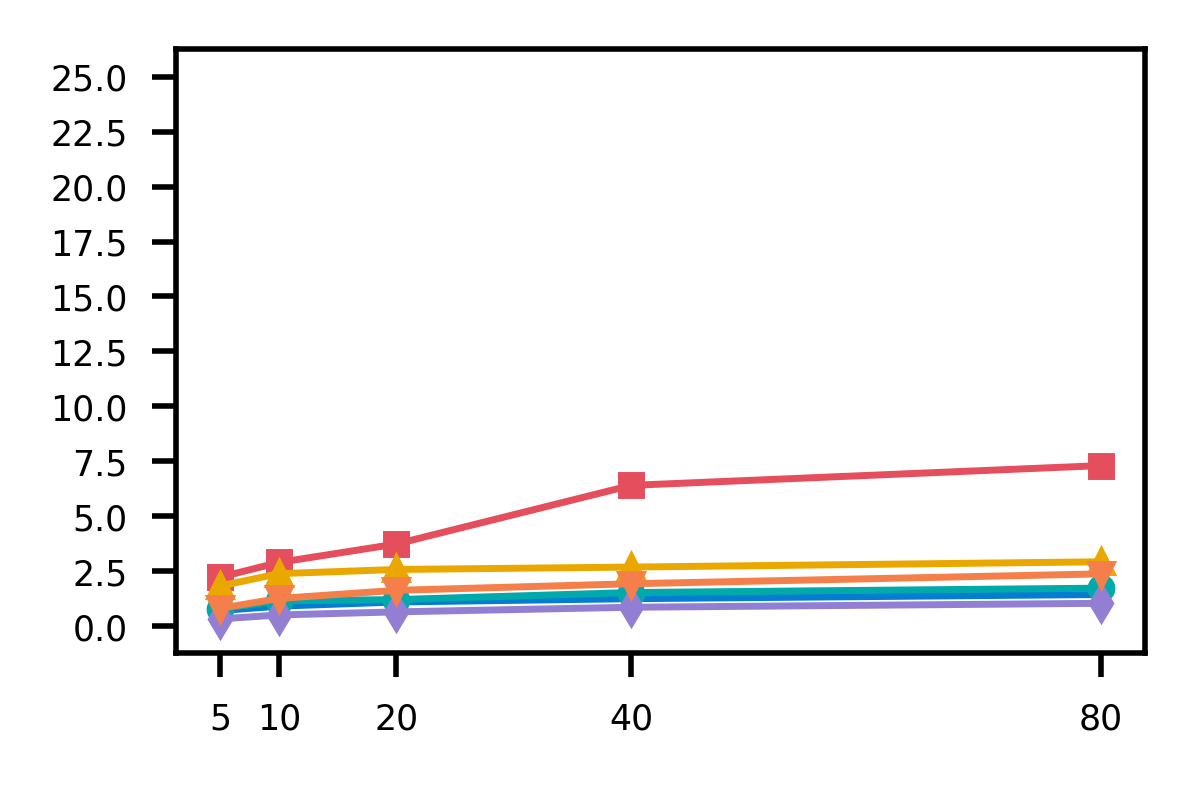
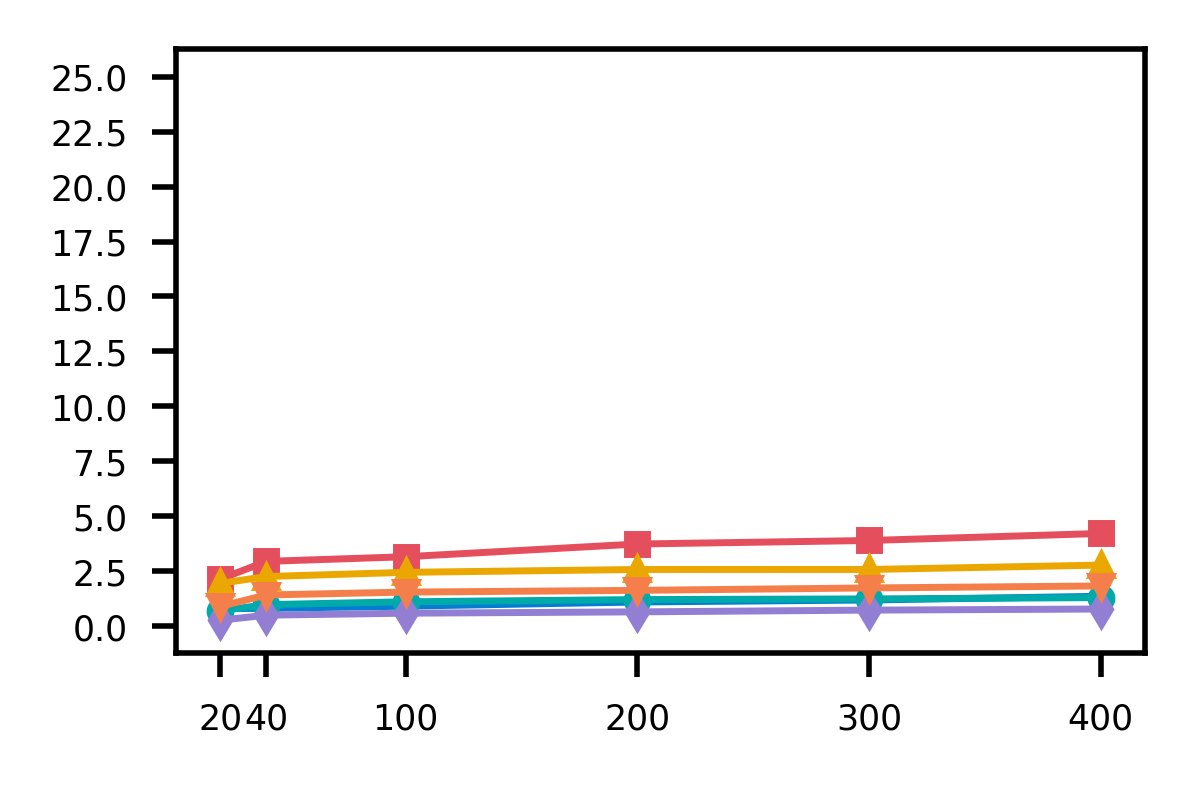
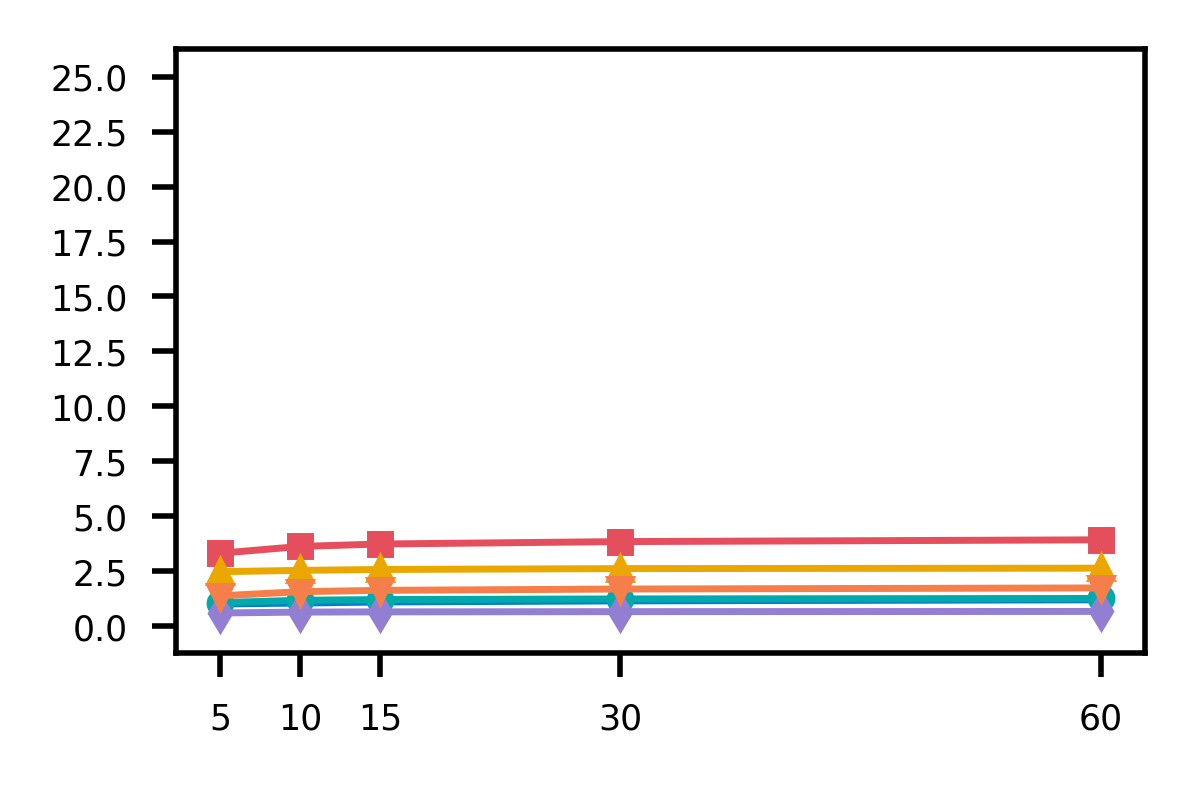
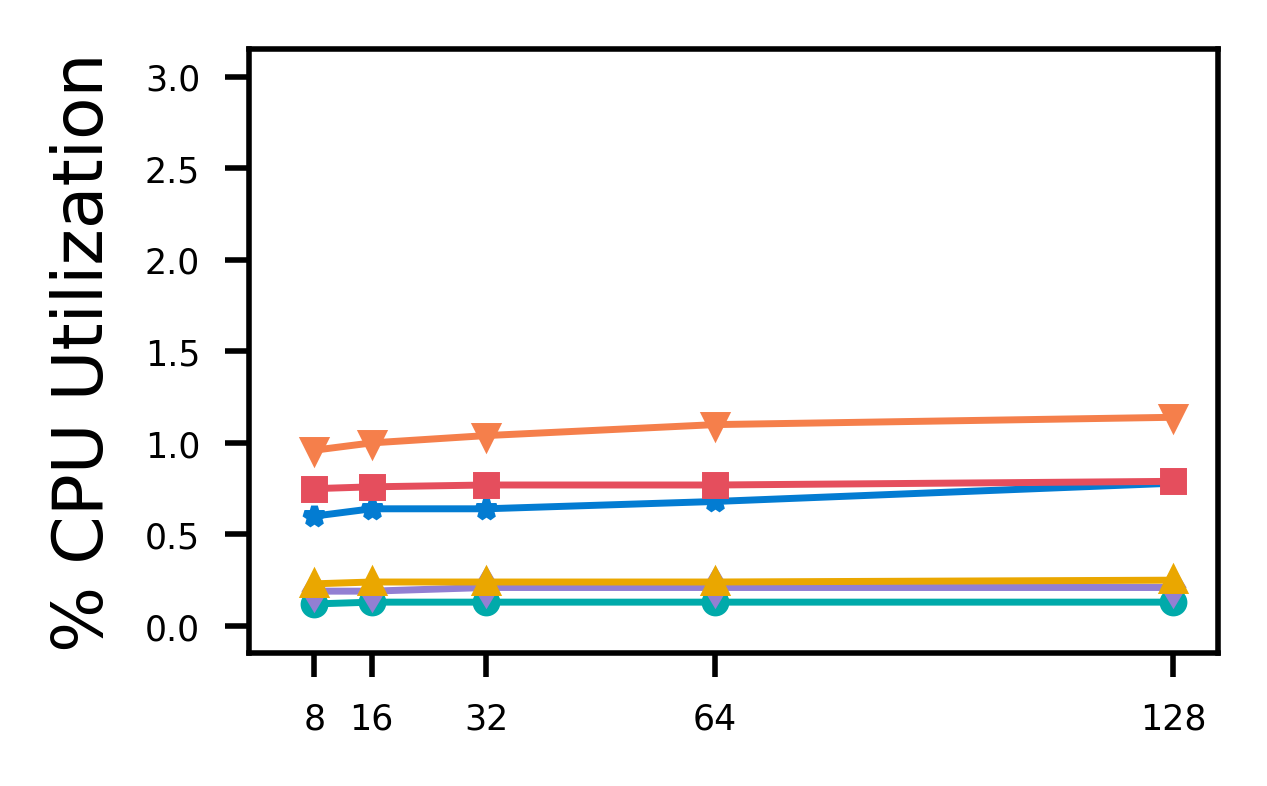
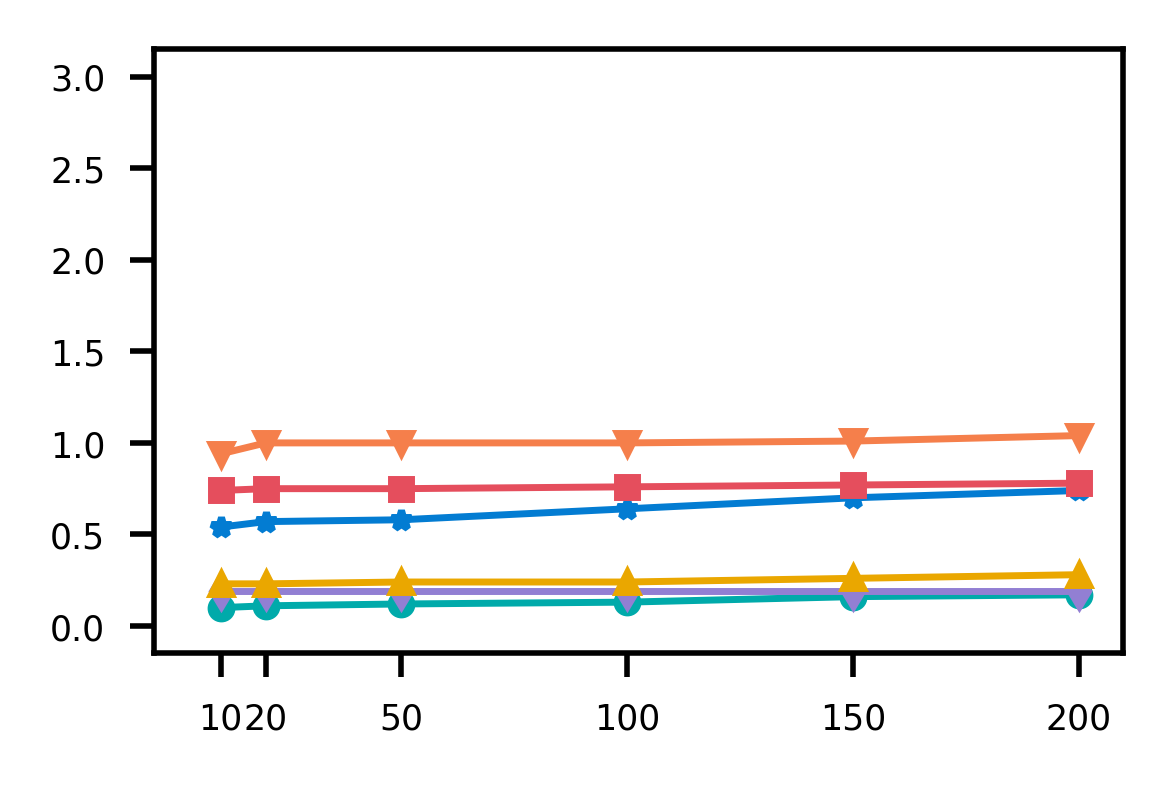
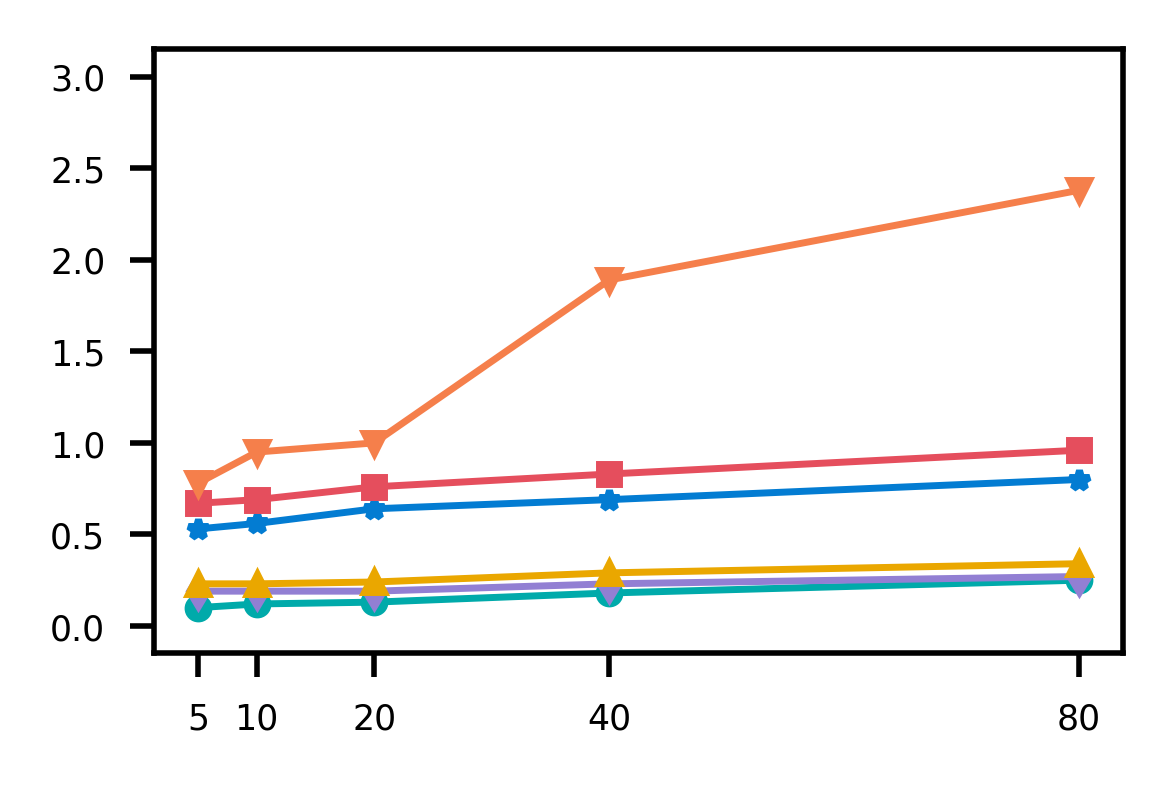
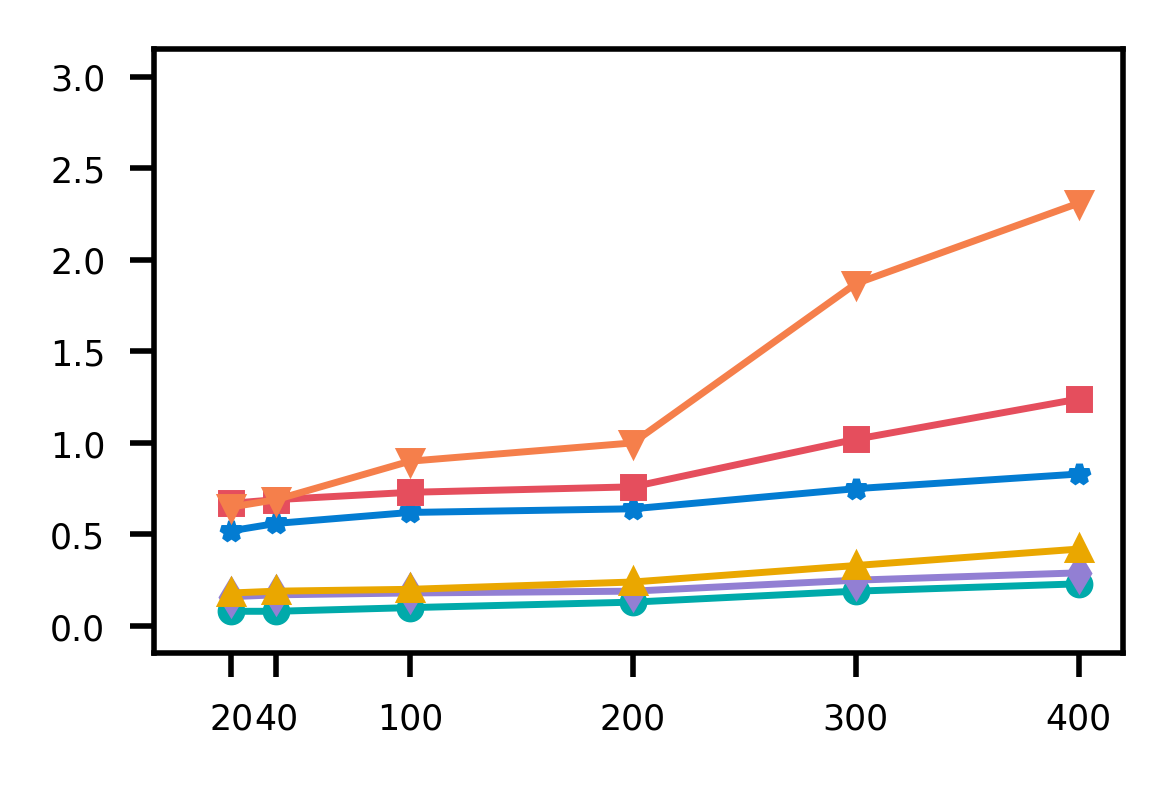

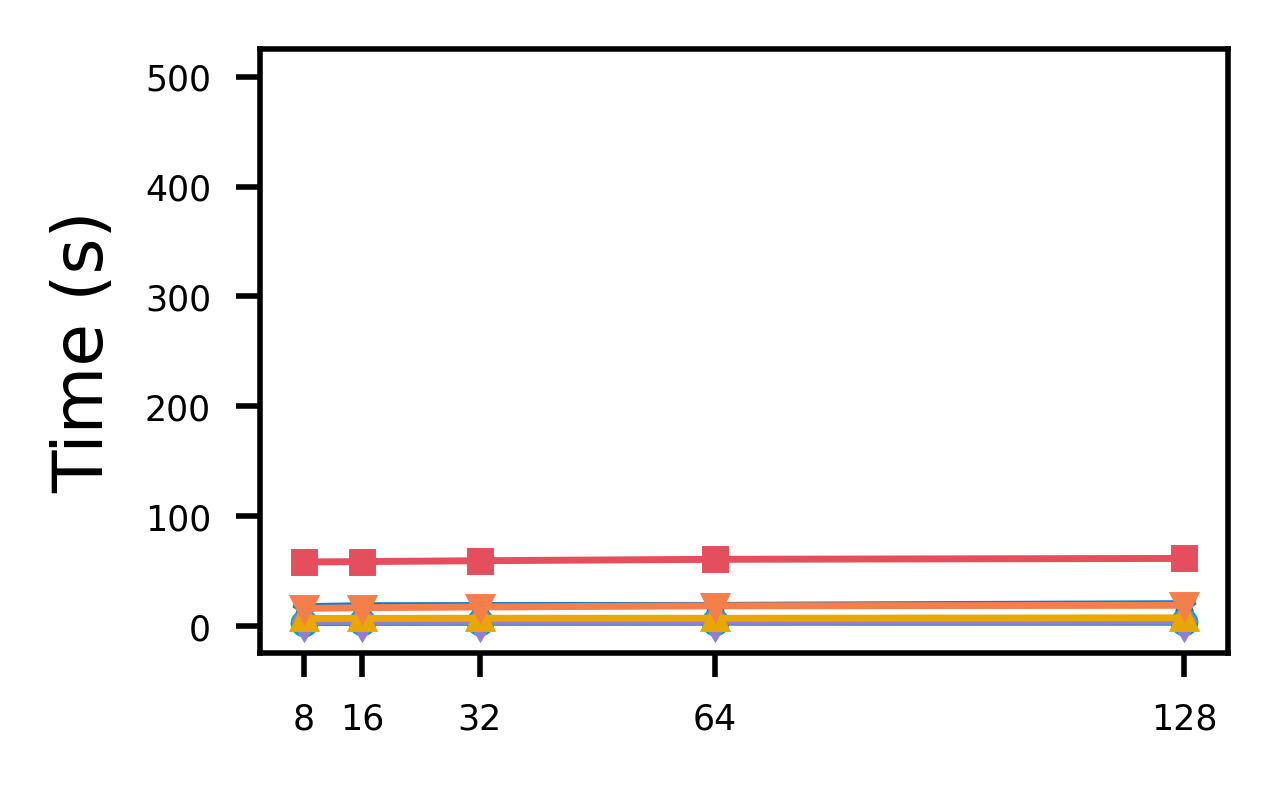
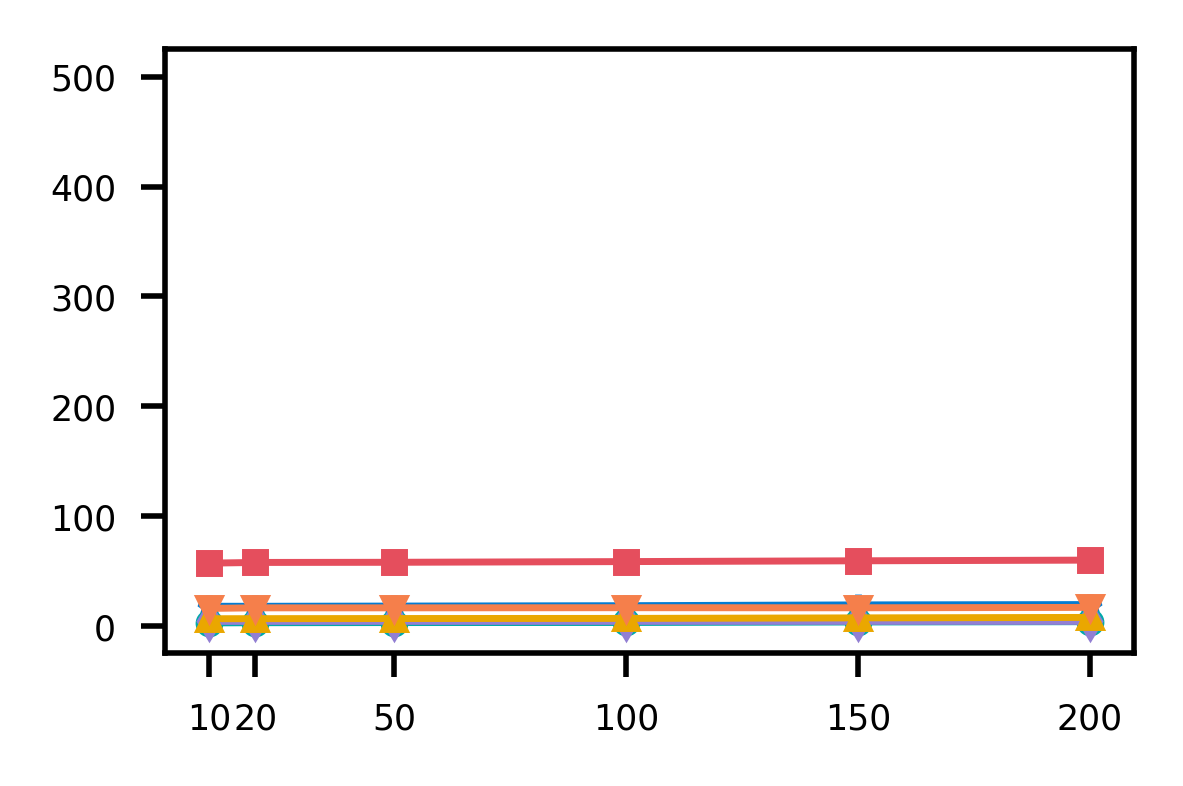
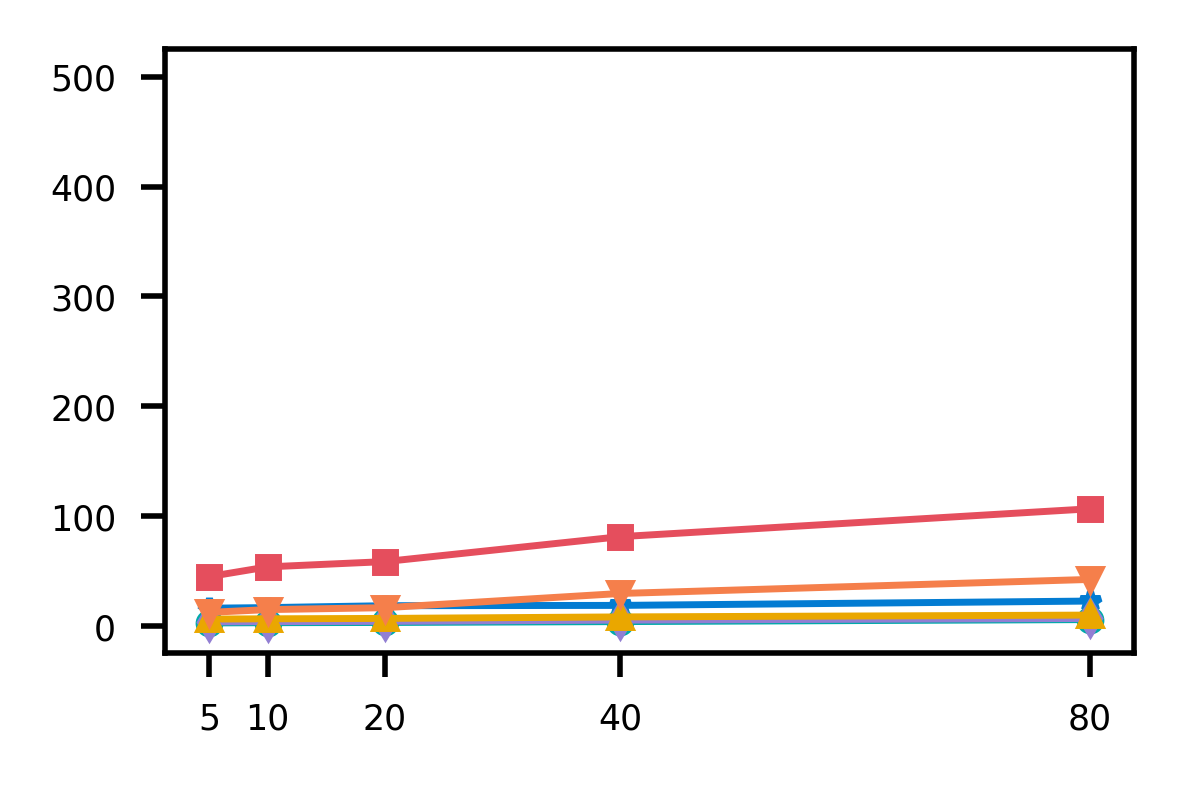
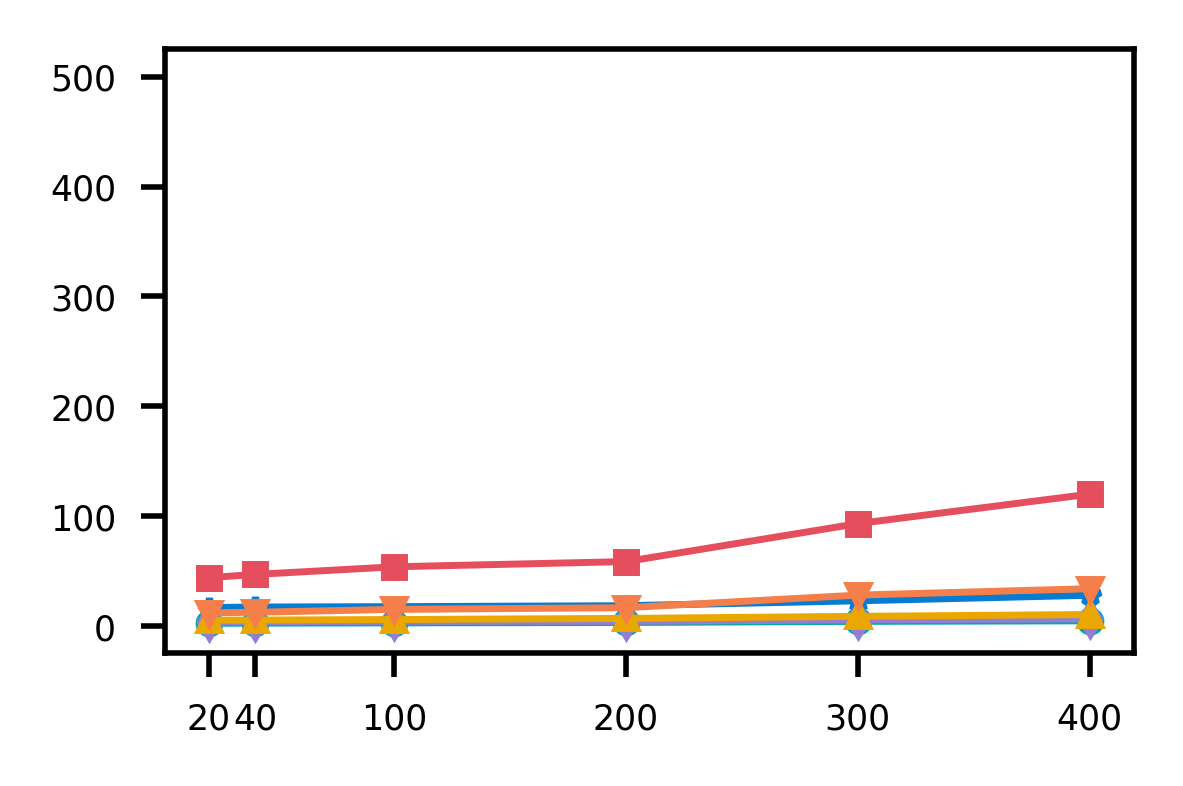
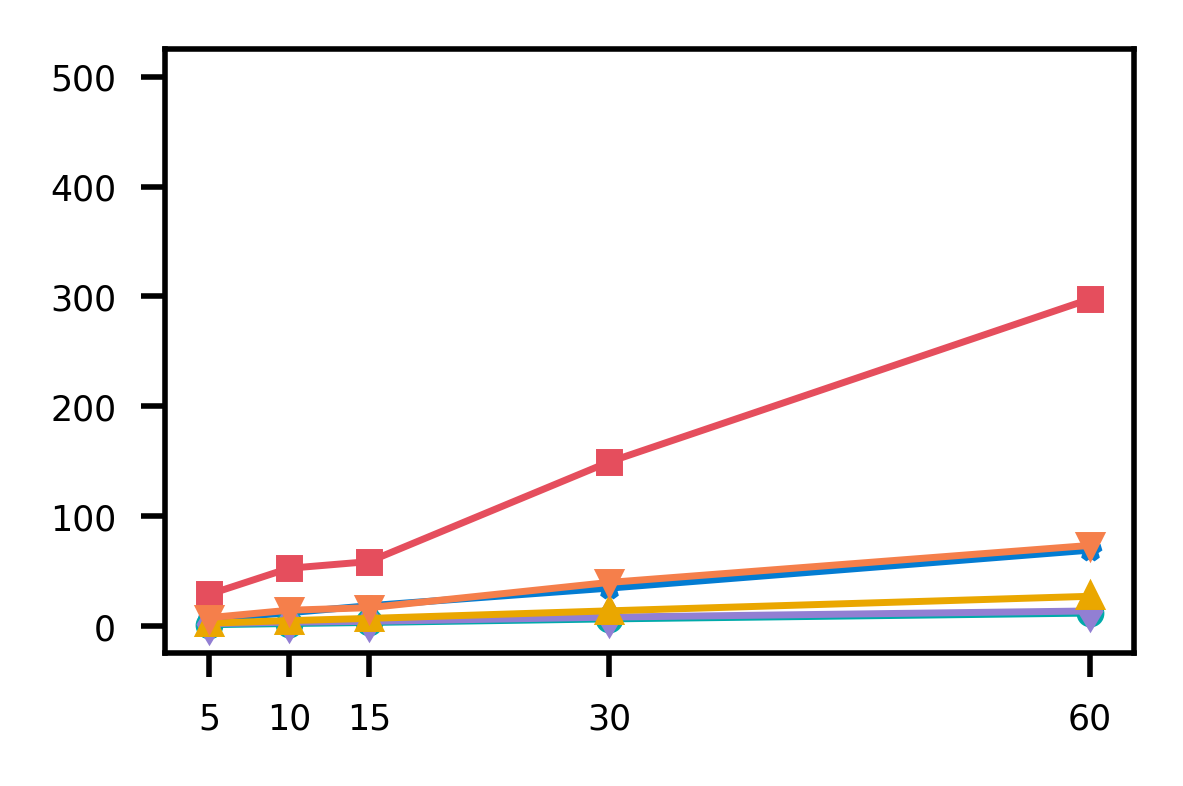
Appendix C Attack Reconstruction Examples
Due to space constraints, we provide a subset of candidate graph examples from DARPA datasets in our experiment. We refer interested readers to the supplementary material [68] for full experimental results. Similarly, we include only benign summary graph examples of the corresponding datasets in Appendix D.
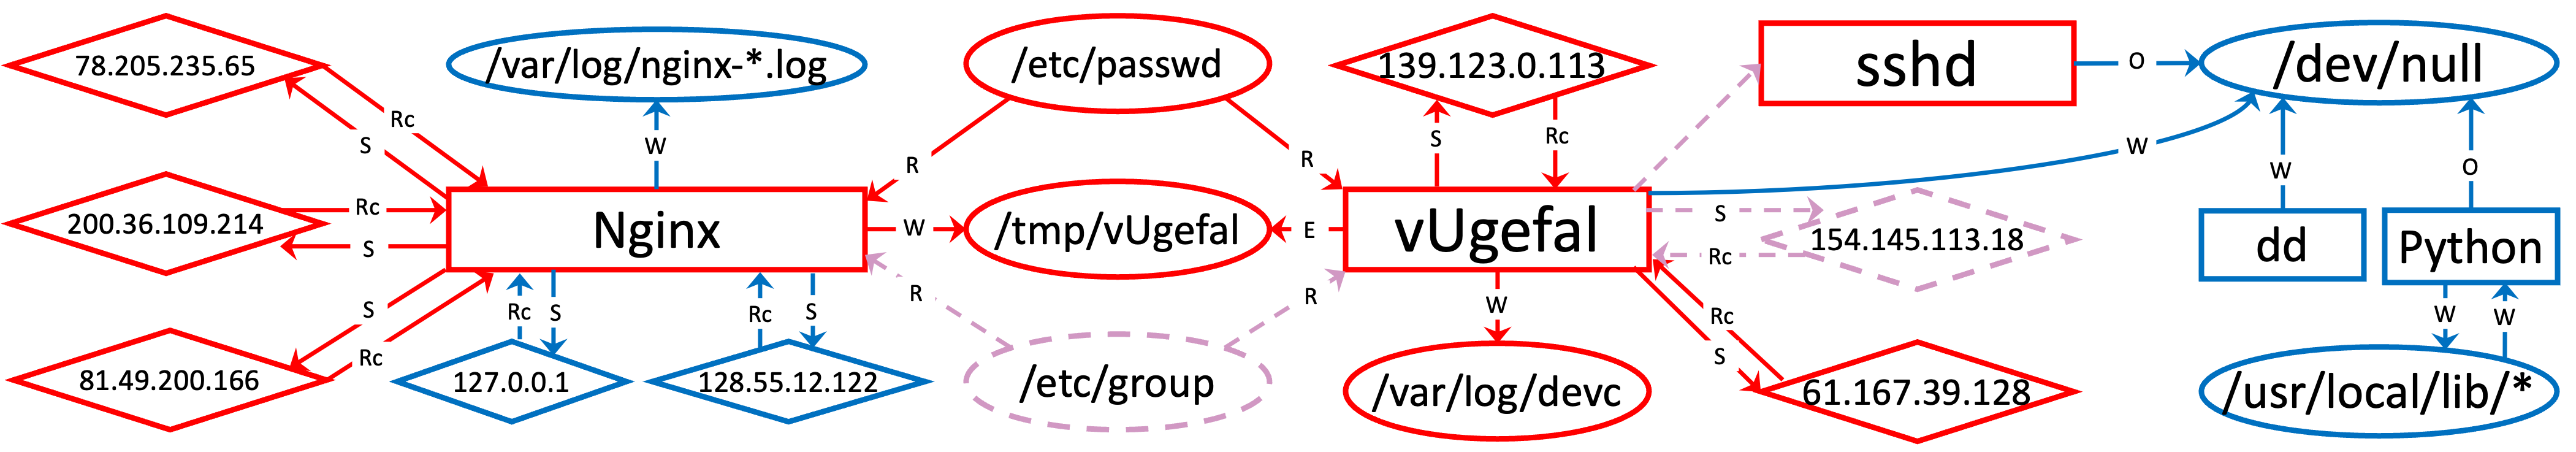
E3-CADETS (Fig. 11). The attacker (81.49.200.166) connects to a vulnerable Nginx server and obtains a shell. Through the shell, the attacker successfully downloads a malicious payload to /tmp/vUgefal and executes the payload with root privileges. The elevated process vUgefal attempts to move laterally to 154.145.113.18 and 61.167.39.128. However, only the attempt at infecting 61.167.39.128 is successful. vUgefal further plans to inject malicious payload to the sshd process. To do so, the attacker downloads the payload to /var/log/devc, but the attempted process injection fails.
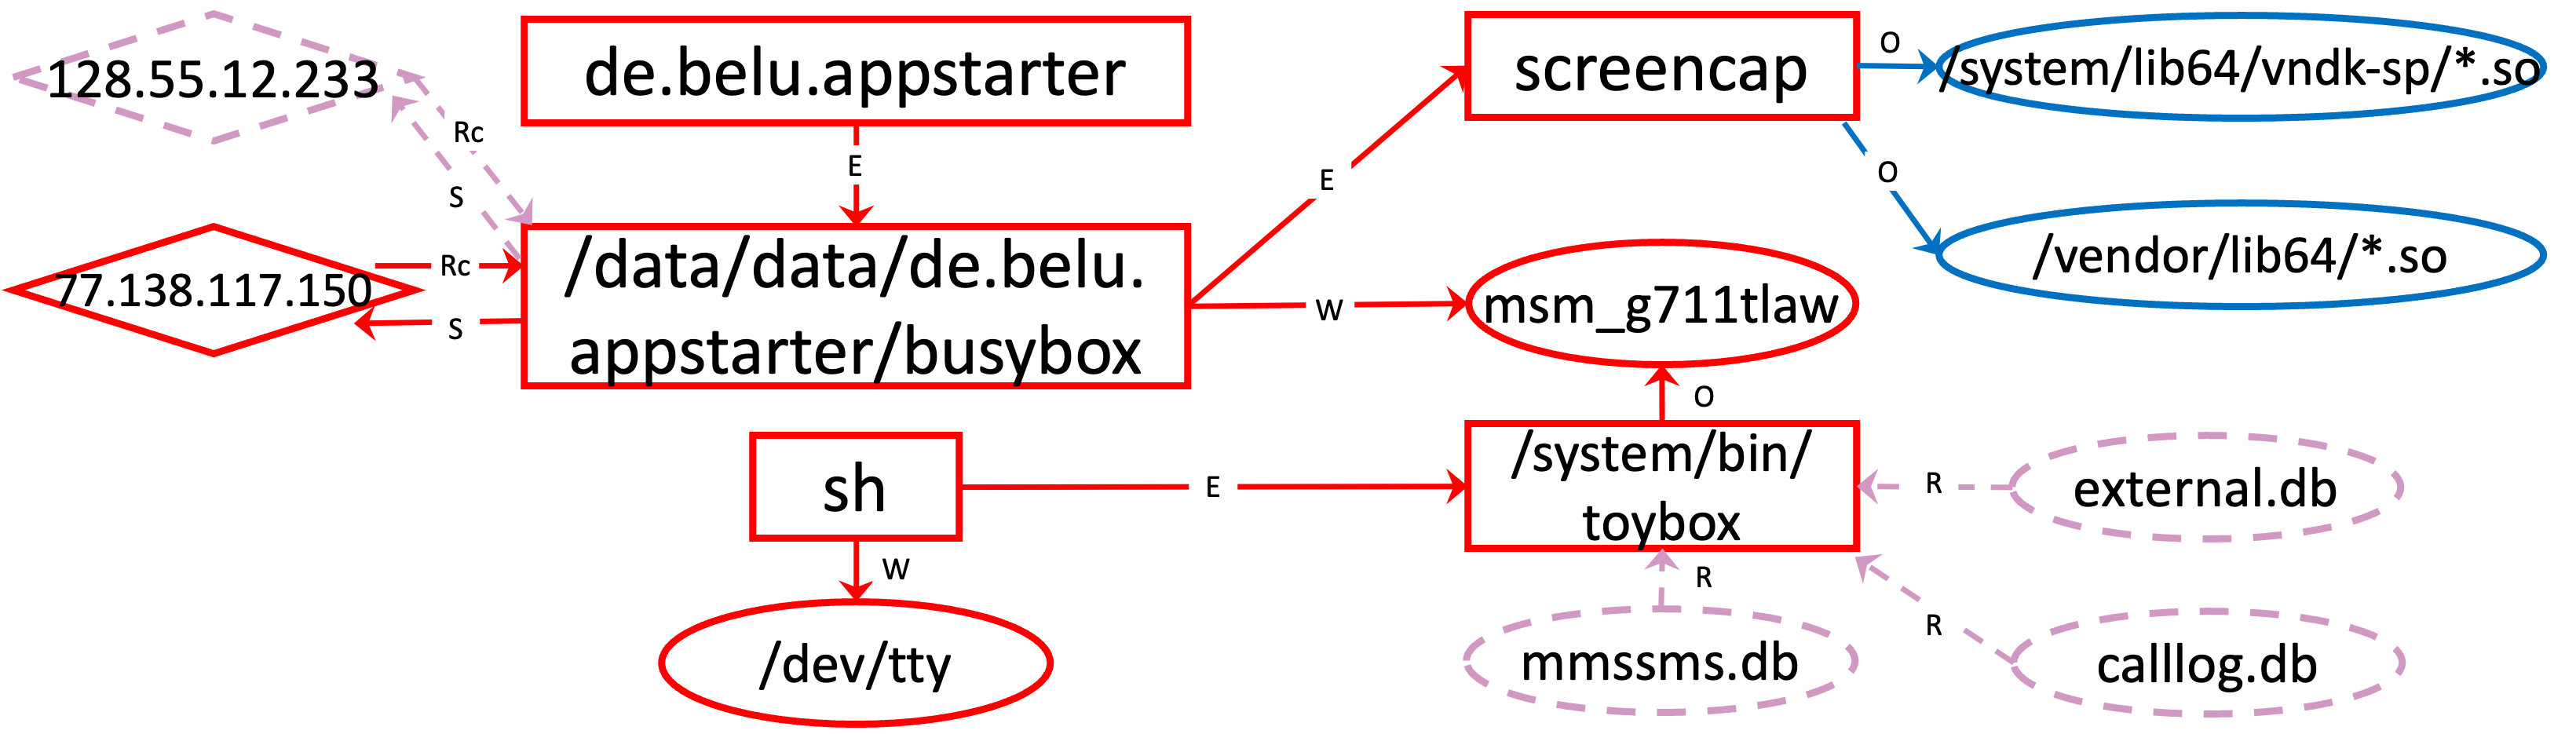
E5-ClearScope (Fig. 12). A user accidentally installs a malicious appstarter APK de.belu.appstarter, which loads an attack module called busybox. This module gives the attacker control from 77.138.117.150. The attacker then installs the driver msm_g711tlaw into the victim host for privilege escalation. The attack exfiltrates calllog.db, calendar.db, and mmssms.db and takes a screenshot. Two days later, the attacker exploits appstarter again to try to connect to the C&C server (128.55.12.233) but failed. The ground truth also describes some malicious activity of attack payloads called lockwatch and mozilla. Upon close inspection, we discover that the provenance data related to the malicious activity is corrupted. We remove the corrupted data and omit the malicious activity in Fig. 12.
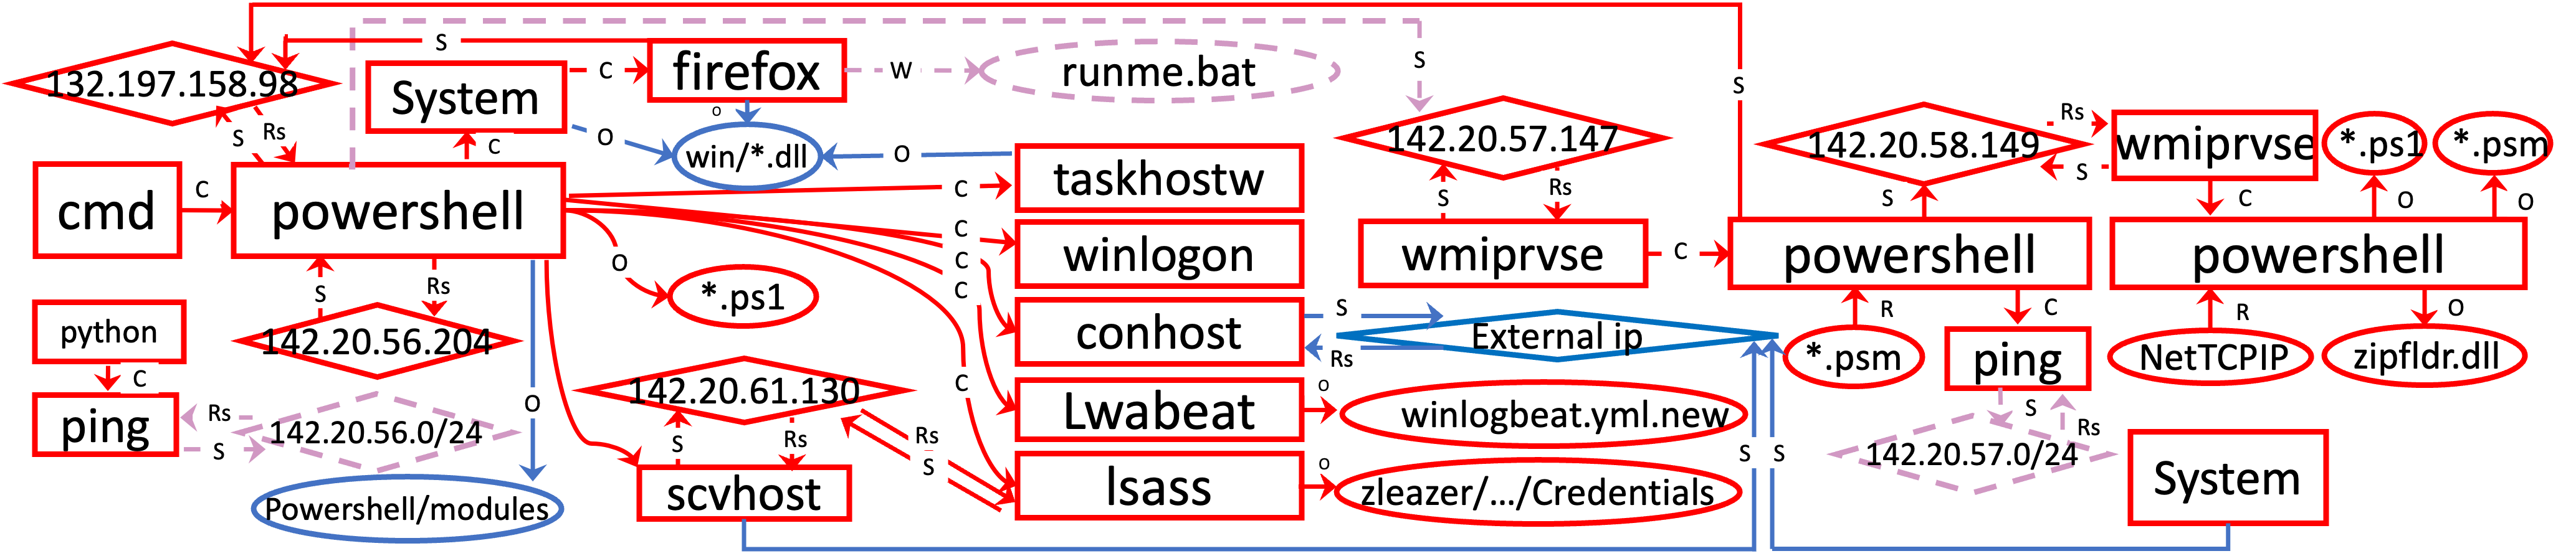
OpTC Day 1 (Fig. 13). The attacker uses a C&C server (132.197.158.98) to connect to the victim host and executes a powershell script runme.bat. The attacker then injects the process lsass to collect the victim’s credential and host information. The attacker also scans the network (e.g., using ping and smb) and uses wmiprvse to move laterally to a host at 142.20.57.147. Eventually, the attacker moves to a host at 142.20.58.149 and runs more powershell scripts *.ps1 to collect information.
Appendix D Benign Summary Graph Examples
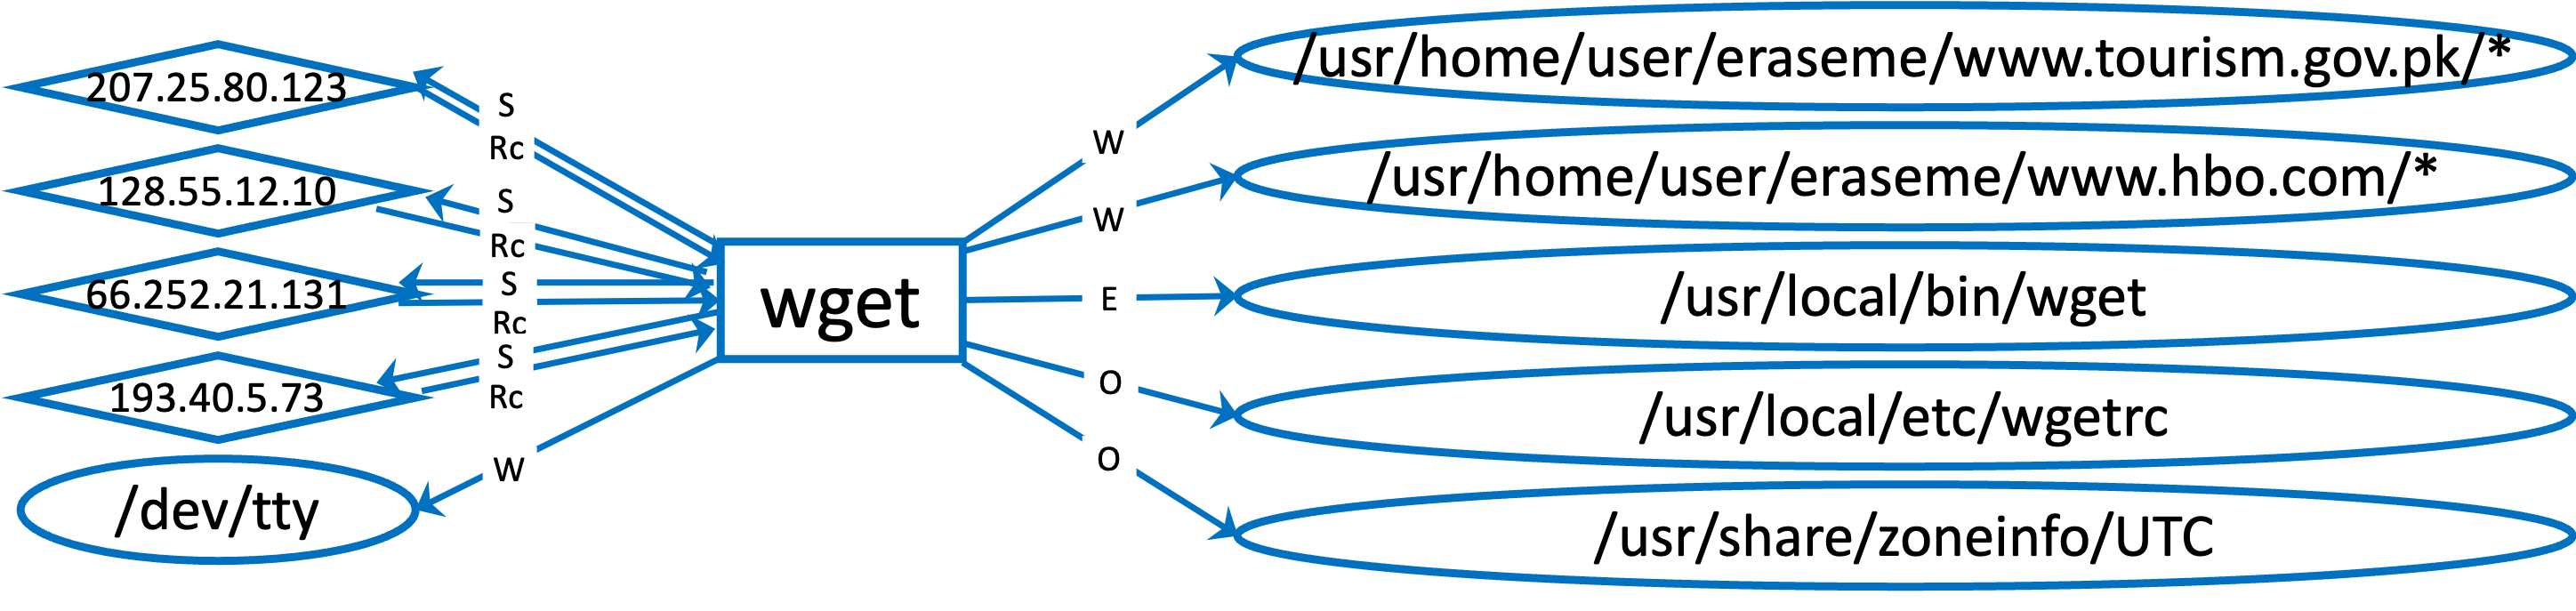
E3-CADETS (Fig. 14). wget is a Linux utility used to download files from the Internet. It might connect to any external IP or URL. To determine whether wget’s behavior is related to attack activity, sysadmins might either check whether any connected IP is in a blocklist or confirm with the user the identities of the files they download. Any file not recognized by the user might be downloaded by the attacker through a C&C server.
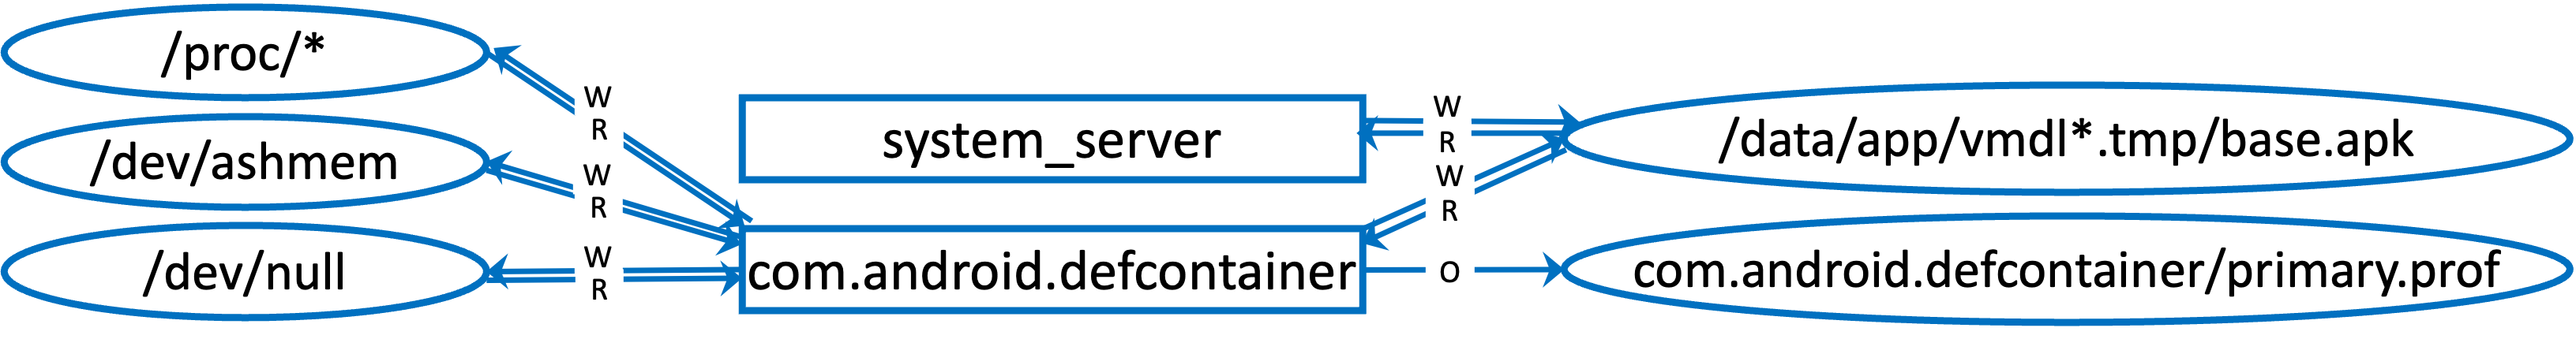
E5-ClearScope (Fig. 15). defcontainer is a system process associated with APK file installation. Sysadmins might confirm with the user the identities of the APK files they install. Sysadmins should further inspect the installed APK files to ensure that they are from legitimate vendors.
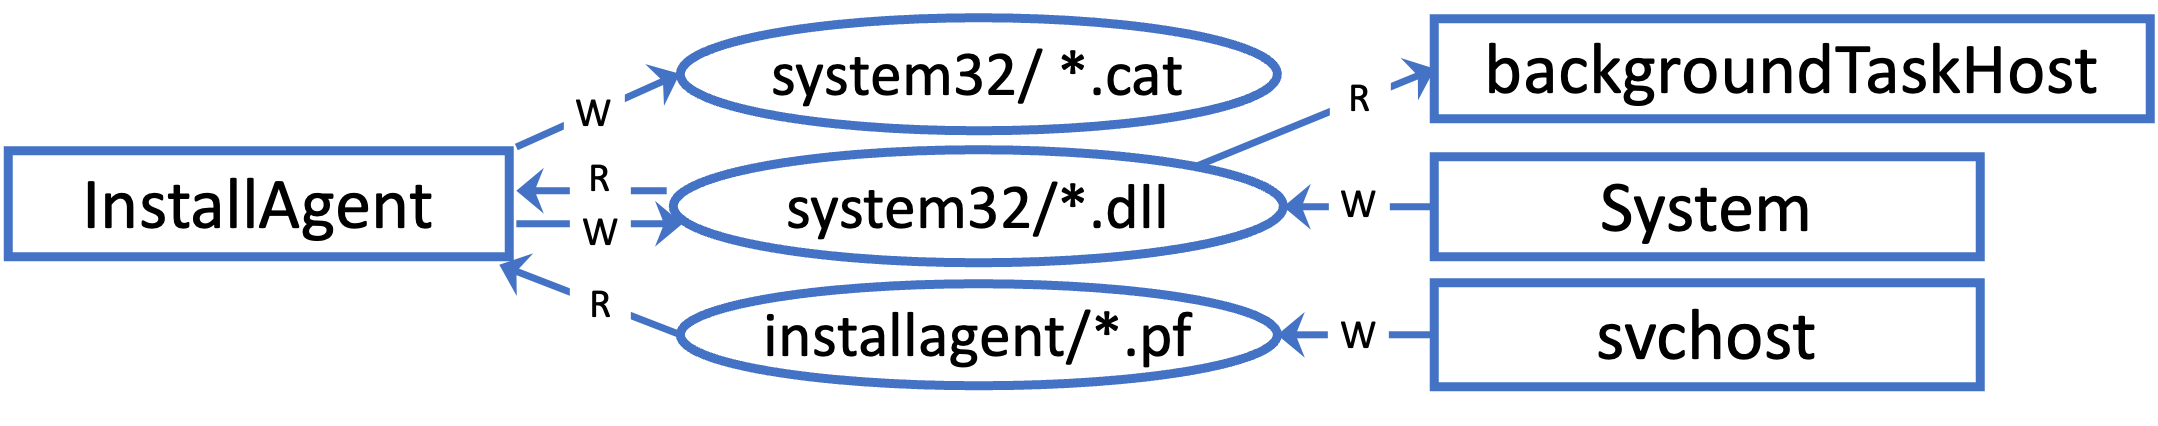
OpTC (Fig. 16). Installagent is Microsoft Windows Store’s update agent, which uses the system services System, backgroundTaskHost, and svchost. Sysadmins need to investigate Installagent only when suspicious files (e.g., files not in the system path) appear in its activity.