ExoMol line lists – LII. Line Lists for the Methylidyne Cation (CH+)
Abstract
Comprehensive and accurate rovibronic line lists for the X and A states of 12C1H+ and 13C1H+ which should be applicable up to temperatures of 5000 K are presented. Available empirical potential energy curves and high-level ab initio dipole and transition dipole moment curves are used with the program LEVEL to compute rovibronic energy levels and Einstein coefficients. -doubling is incorporated into the energy levels and -coefficients involving the A state using an empirical method. For 12C1H+, line positions are improved by using both laboratory and astronomical observational spectra as input to the MARVEL procedure. The 12C1H+ line list contains 1505 states and 34 194 transitions over the frequency range of 0 – 33 010 cm-1 ( nm). Comparisons with observed astronomical and laboratory spectra give very good agreement. The PYT CH+ line lists and partition functions are available from the ExoMol database at www.exomol.com
keywords:
molecular data – opacity – planets and satellites: atmospheres – stars: atmospheres – ISM: molecules.1 Introduction
The methylidyne cation, CH+, was one of the first molecules, and the first molecular ion, to be detected in space (Dunham, 1937). CH+ has since been found to be ubiquitous in interstellar space (Godard et al., 2023) where it has been observed both in absorption and emission in various cool environments (Neufeld et al., 2021; Krelowski et al., 2020; York et al., 2013; Naylor et al., 2010; Cernicharo et al., 1997; Gredel et al., 1993; Crawford, 1989; Dunham, 1937) which include protostellar disks (Thi et al., 2011), diffuse clouds (Crane et al., 1995) and lines of sight towards star-forming regions (Falgarone et al., 2010), with even routine detection from extra-galactic sources (Falgarone et al., 2017; Muller et al., 2017; Rangwala et al., 2011; Ritchey et al., 2015). In addition, strong CH+ A – X emission spectra have been observed in the red rectangle (post–asymptotic giant branch star HD 44179), see Hobbs et al. (2004) and references therein.
Astrophysical interest in CH+ has sparked many investigations; these include using its unique properties, which allow tracing of significant energy releases and interstellar turbulence (Vidal-García et al., 2022), and its importance in astrochemistry, particularly for helping to understand diffuse interstellar clouds. CH+ is thought to be a building block for the formation of organic molecules in interstellar space, principally through its role as an intermediary in reactions producing larger hydrocarbons (Barinovs & van Hemert, 2004; Domenech et al., 2018), and molecules including C2, CN, CO and CH (Hakalla et al., 2007). Furthermore, owing to its efficient destruction mechanisms (Gredel et al., 1993) and inherently reactive nature with species prevalent in its environment (most notably H and H2), it came as a great surprise when the abundance of the molecule was observed to exceed predictions by several orders of magnitude (Dalgarno, 1976). This has stimulated significant investigation into the formation, destruction and abundance of CH+ over many years (Gredel et al., 1993; Valdivia et al., 2017; Falgarone et al., 2010; Gredel, 1997; Wesson et al., 2010; Gredel, 1997). While the primary formation mechanism and observed abundance of CH+ remain in question, some recent studies have begun to provide explanations that reduce the large discrepancy between calculation and observation (Faure et al., 2017; Godard et al., 2023).
Interest in CH+ has also motivated a number of laboratory studies. Its rovibronic spectrum (involving vibrationally and rotationally-resolved transitions between electronic states) has been widely studied (Hechtfischer et al., 2007; Hakalla et al., 2006; Dubois & Lefebvre, 2004; Hechtfischer et al., 2002; Carrington & Softley, 1986; Sarre et al., 1986; Carrington & Ramsay, 1982; Grieman et al., 1981; Helm et al., 1982; Cosby et al., 1980; Douglas & Morton, 1960; Douglas & Herzberg, 1942; Botterud et al., 1973; Mueller, 2010; Yu et al., 2018), most notably the A - X (A-X) system which covers transitions between the two lowest energy singlet states. Landmark studies include the work by Carrington & Ramsay (1982), the first high-resolution study (uncertainty cm-1) which also assigned many transitions involving low vibrational levels (), and more recently that of Hakalla et al. (2006) who comprehensively characterised low vibrational bands. The pure rotational spectrum of CH+, first detected in space through emission lines from a planetary nebula (Cernicharo et al., 1997), has received much less coverage with only a few low-energy lines being observed so far. The first laboratory detection of a pure rotational line () (Pearson & Drouin, 2006) was later proven to be inaccurate by 0.0019 cm-1 and its frequency was superseded by later studies (Domenech et al., 2018; Amano, 2010b). The rovibrational spectrum has proven more elusive still, the first and only high resolution laboratory study was made by Domenech et al. (2018), and the corresponding astronomical detection only from one source, NGC 7027 (Neufeld et al., 2021). The minor isotopologues, most notably 13CH+ and 12CD+, have also received significant spectroscopic investigation (Domenech et al., 2018; Bembenek et al., 1987; Amano, 2010b; Dubois & Lefebvre, 2004; Amano et al., 2015; Hechtfischer et al., 2007; Yu et al., 2018; Bembenek, 1997). A summary of the spectroscopic laboratory and astronomically observed literature used in this study that covers the relevant electronic states, X and A , is given in Table 1. Some papers provide spectroscopic analysis but do not present new line data (Amano, 2010a; Yu et al., 2018; Amano, 2015; Mueller, 2010; Hakalla et al., 2007).
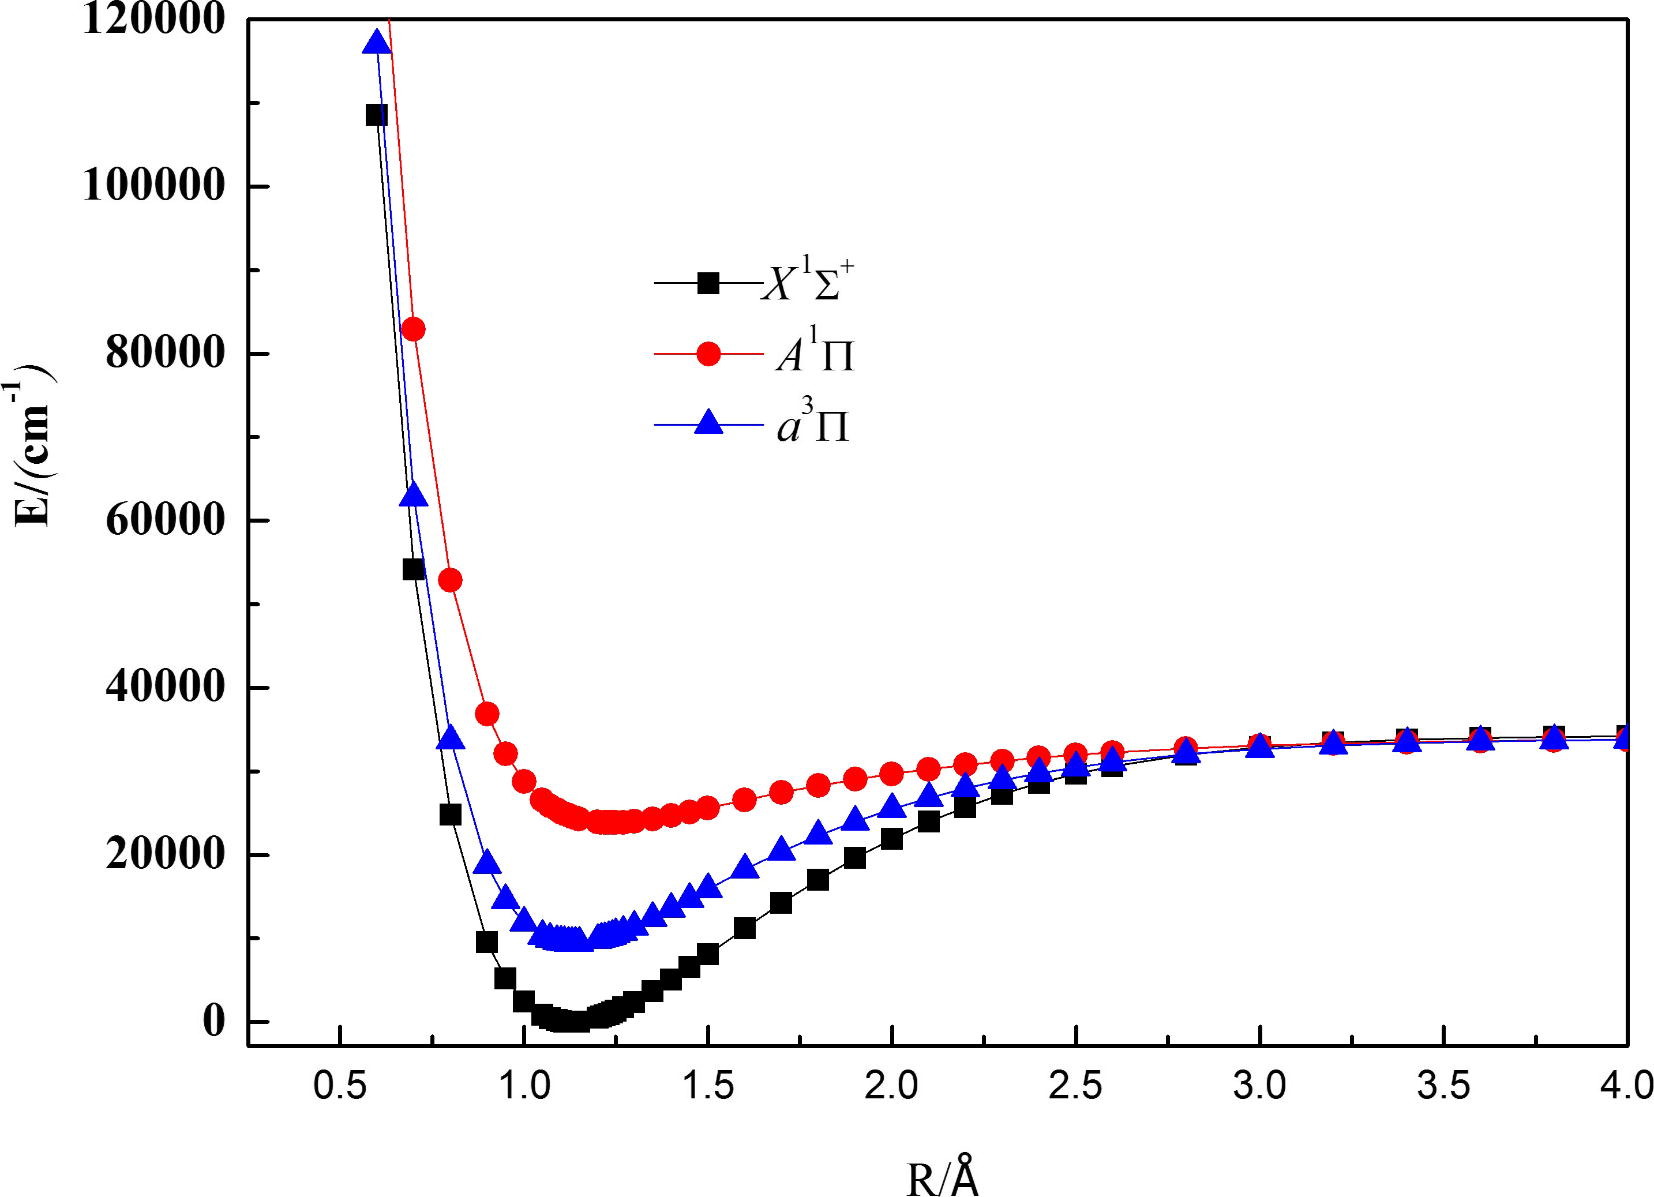
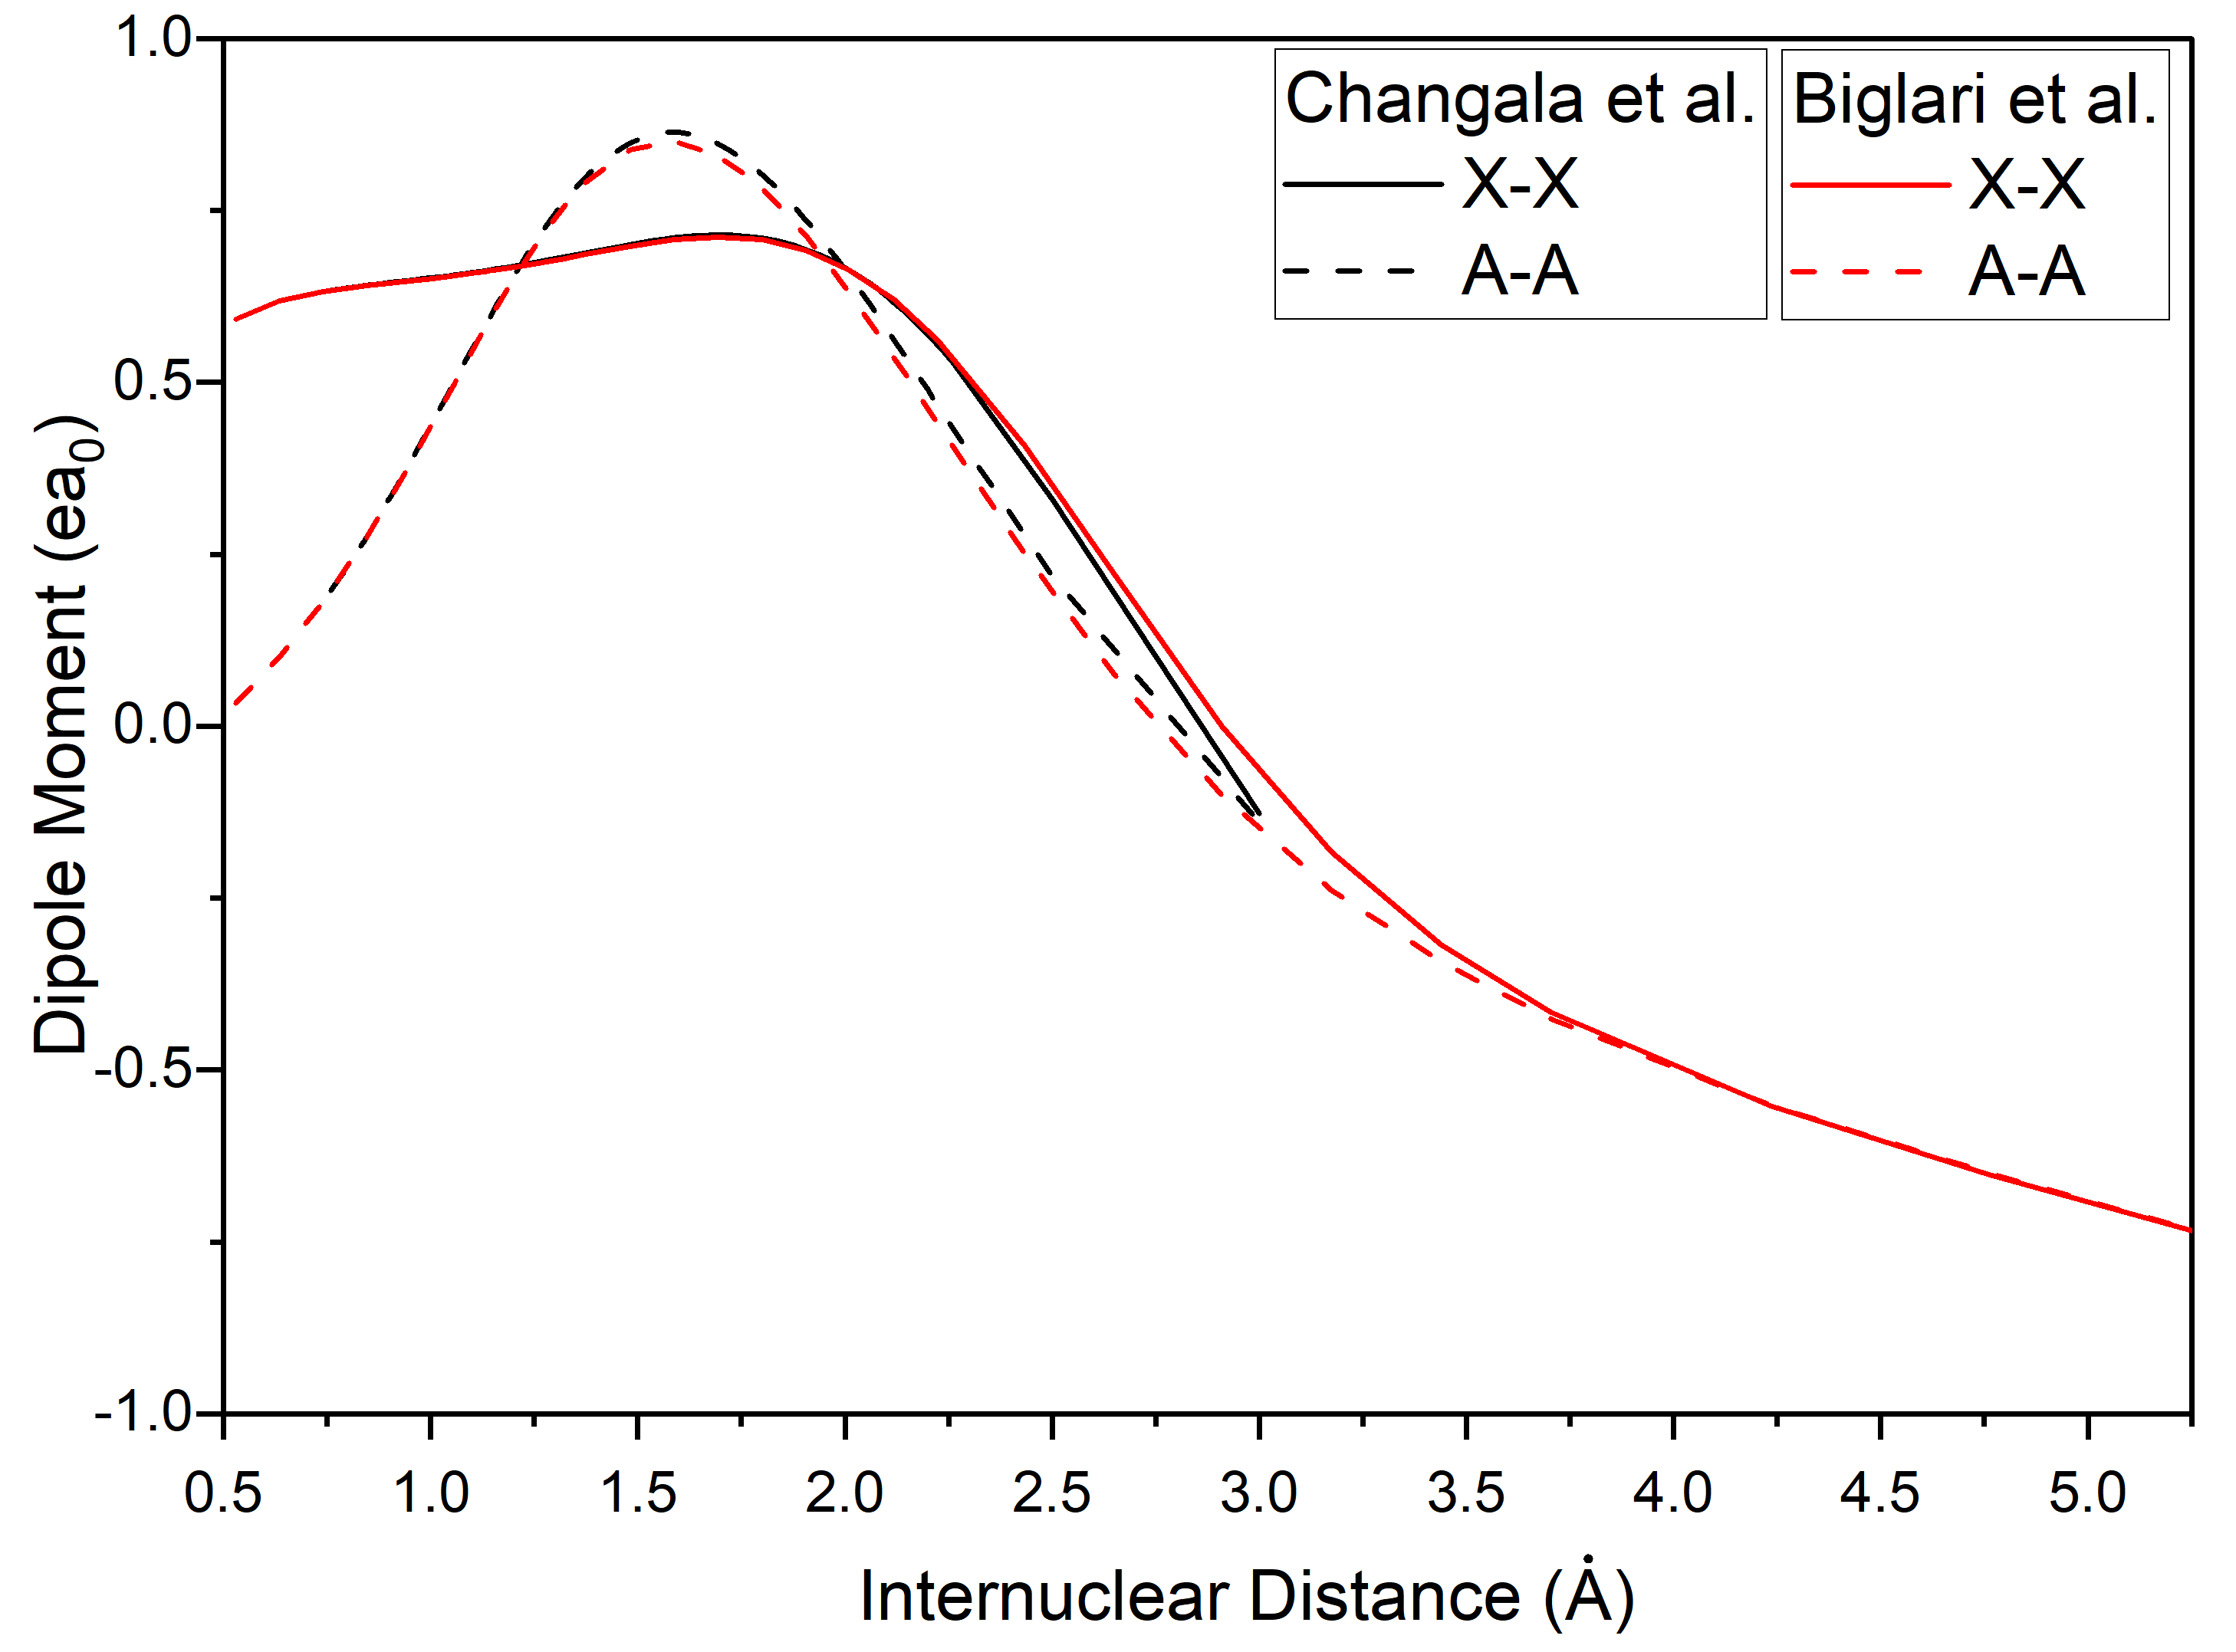
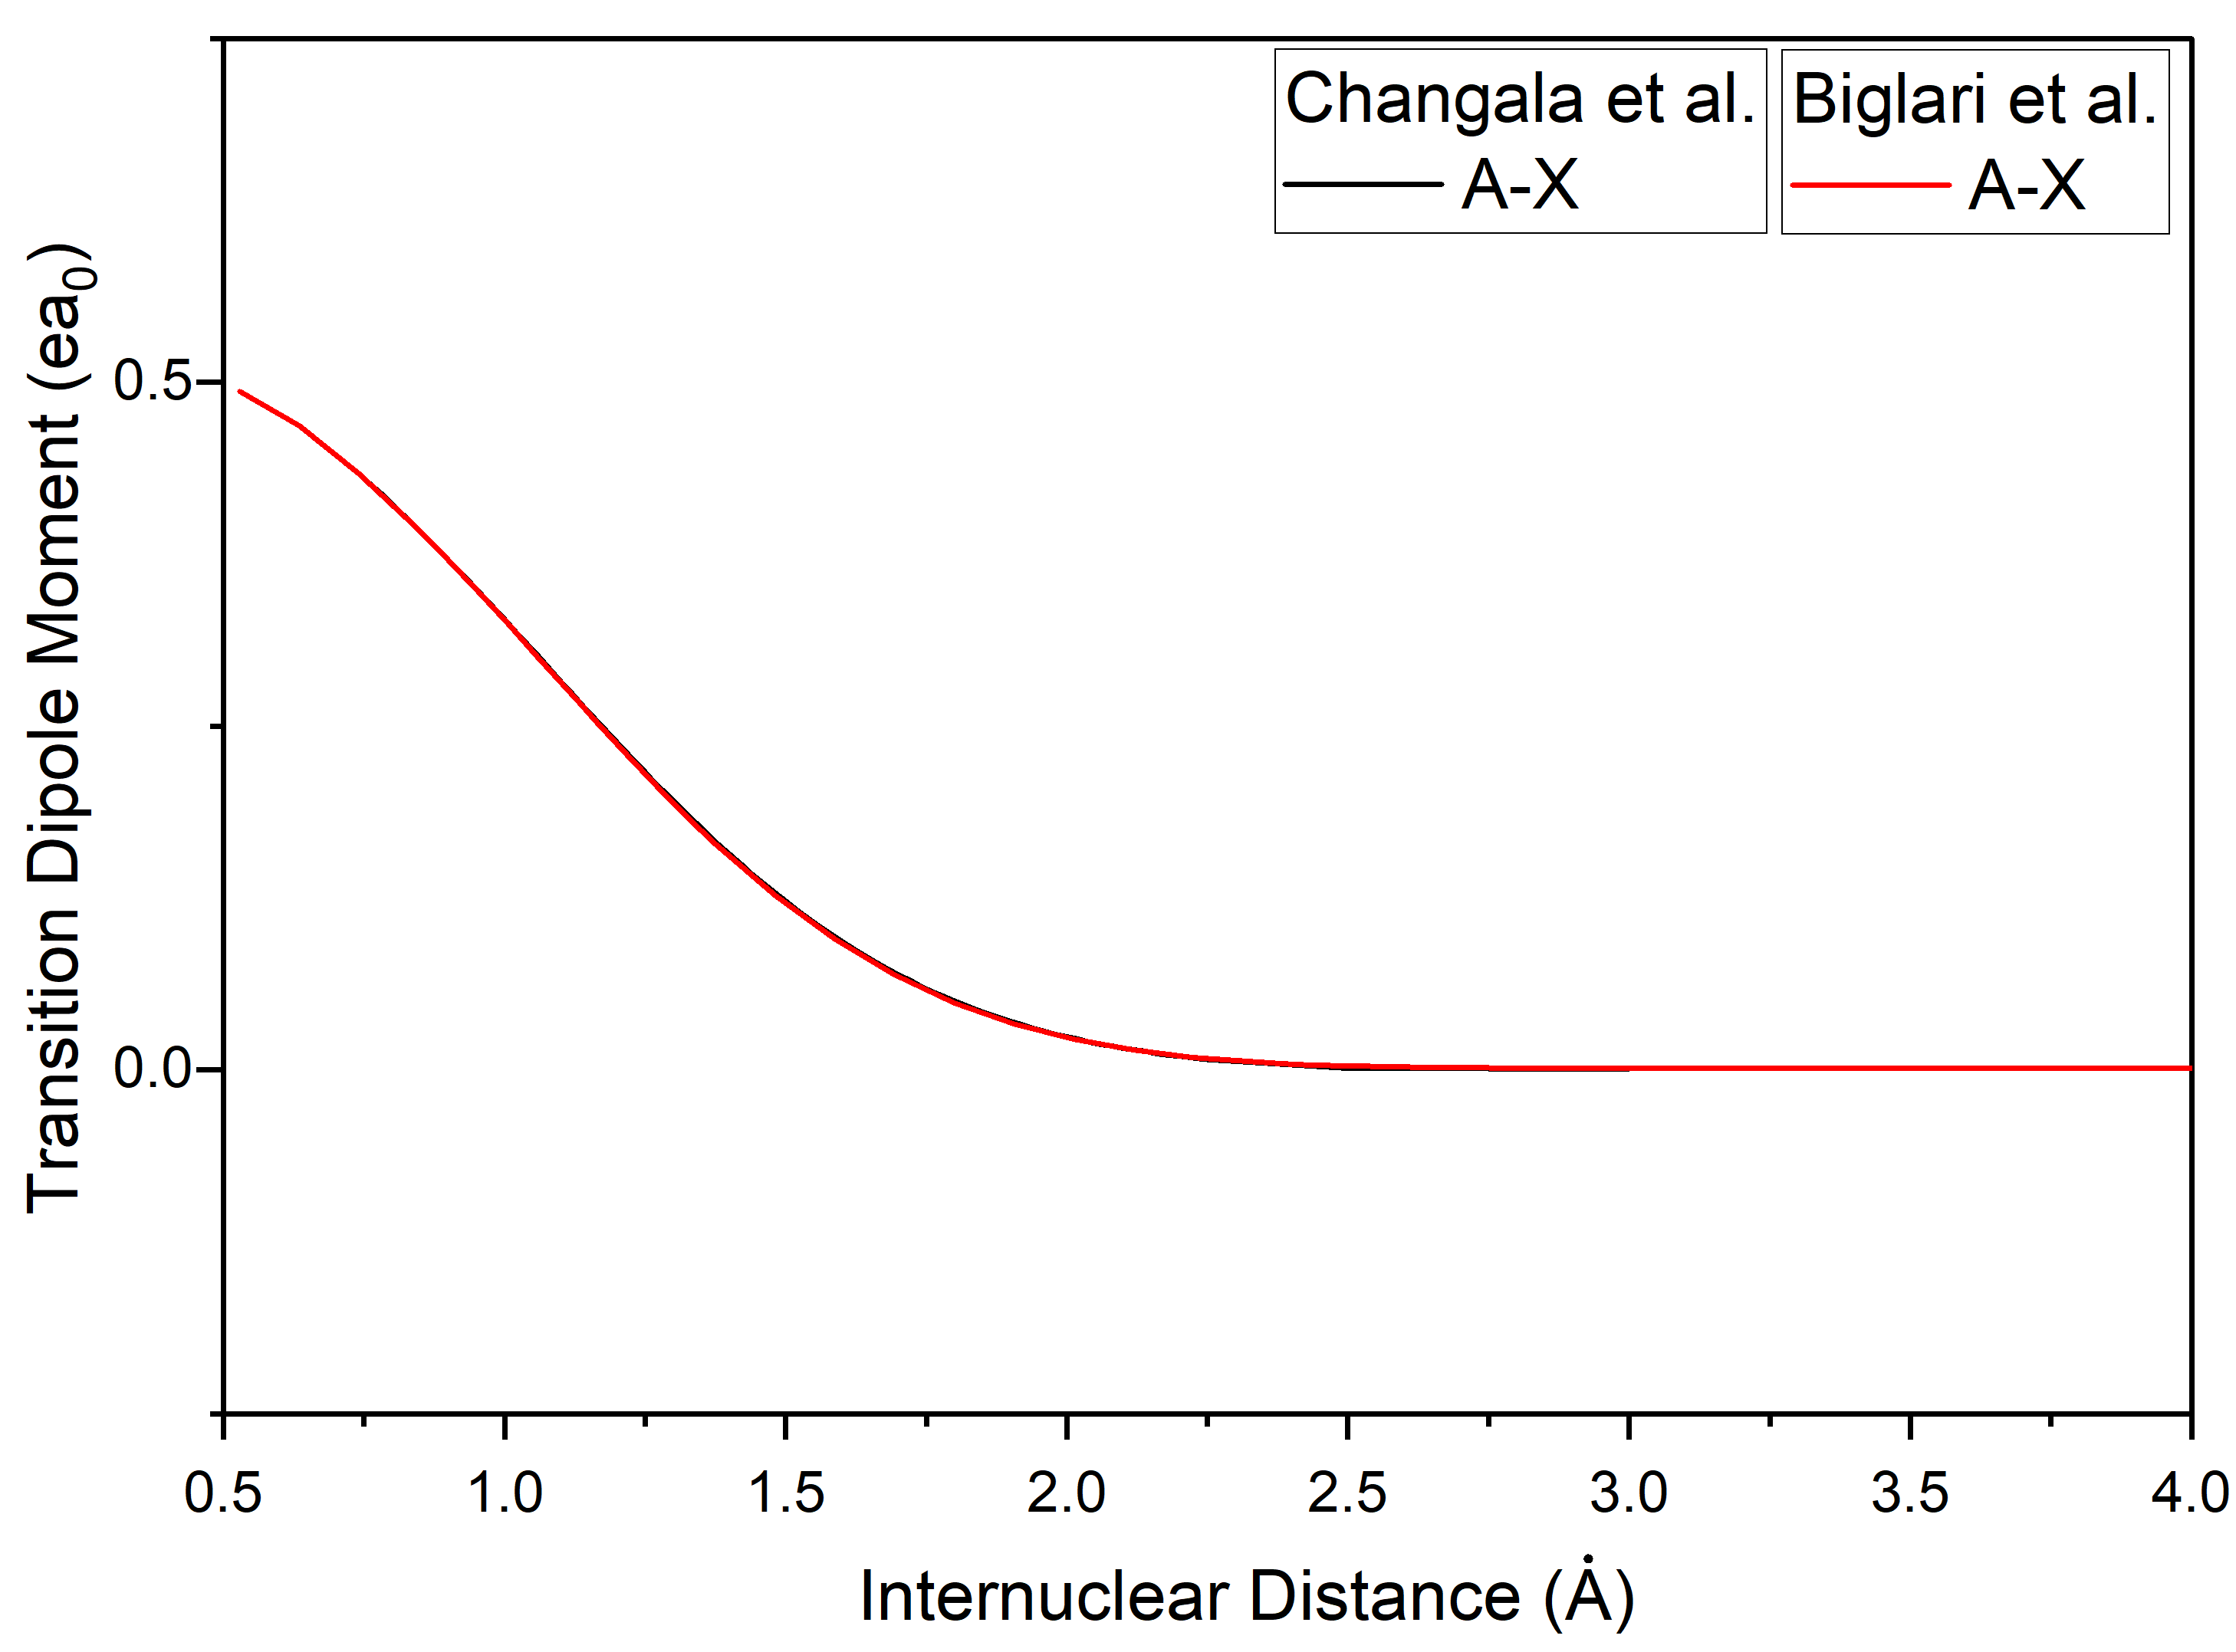
Theoretical investigations have aimed to characterise the potential energy curves (PECs) and dipole/transition dipole moments (DMs/TDMs) of CH+. PECs, unique to each electronic state, describe the potential energy of an electron as a function of nuclear distance, while DMs/TDMs describe the strength of interaction between two different states during a transition between them. Many ab initio electronic structure studies have focused on CH+ since it contains just six electrons; these provide PECs for low-lying electronic states, notably X , A and a (Changala et al., 2021; Gao et al., 2017; Sauer & Spirko, 2013), with some also characterising higher energy states (Mbiba Touedebe et al., 2023; Babb & McLaughlin, 2017; Biglari et al., 2014; Barinovs & van Hemert, 2004; Kowalski & Piecuch, 2001; Kanzler et al., 1991; Saxon et al., 1980). Here we use the PECs due to Cho & Le Roy (2016) who used a fully empirical (‘direct potential fit’) approach that utilises experimental data to fit the PECs of the X and A states which, if sufficient experimental data is available, is a more accurate method than ab initio studies. The PECs of the three lowest electronic states of CH+ can be seen in Fig. 1 (Gao et al., 2017). Several studies have characterised DMs/TDMs (Changala et al., 2021; Gao et al., 2017; Babb & McLaughlin, 2017; Sauer & Spirko, 2013; Kanzler et al., 1991; Saxon et al., 1980) with notable investigations covering a vast number of singlet, triplet and quintet states using large basis sets and extending to large internuclear separations (Mbiba Touedebe et al., 2023; Biglari et al., 2014; Chakrabarti et al., 2017). The curves were compared (where data was available) and were seen to agree well, particularly those of A-X. A comparison of the X-X and A-A DMs and A-X TDMs from Biglari et al. (2014) and Changala et al. (2021) is shown in Fig. 2.
The ExoMol project aims to provide comprehensive spectroscopic data for transitions within molecules relevant to exoplanetary atmospheres, cool stars and brown dwarfs (Tennyson & Yurchenko, 2012). Since its inception, the project has created line lists for many diatomic molecules, ions and larger polyatomic species, that comprehensively characterise the spectroscopic properties of the molecule and allows a model/profile to be built up. In this study, we calculate a comprehensive and accurate line list for the X and A states of 12C1H+ and 13C1H+ as part of the ExoMol project.
| Reference | Freq. Range (cm-1) | Detected Transitionsa | A/Vb | Uncertc (cm-1) | ||||
|---|---|---|---|---|---|---|---|---|
| 21NeGoChFa (Neufeld et al., 2021) | 2422.62 - 2942.57 | : | 16/16 | |||||
| 18DoJuScAs (Domenech et al., 2018) |
|
|
5/5 | |||||
| 15YuDrPeAm (Amano et al., 2015) | 55.68 - 83.44 | : R(1), R(2) | 2/2 | |||||
| 10Amano (Amano, 2010b) | 27.85719 | : R(0) | 1/1 | |||||
| 06PeDr (Pearson & Drouin, 2006) | 27.85523 | : R(0) | 1/0 | |||||
| 06HaKeSzZa (Hakalla et al., 2006) | 20401.56 - 23967.41 | : | 124/124 | |||||
| 02HeWiLaLi (Hechtfischer et al., 2002) | 31747.0 - 33000.0 |
|
35/35 | 1 | ||||
| 97CeLiGoCo (Cernicharo et al., 1997) | 55.68 - 165.92 | 6/6 | ||||||
| 89SaWhGr (Sarre et al., 1989) | 16750 - 18613 | 6/6 | 1 | |||||
| 86SaWaWh (Sarre et al., 1986) | 16125.31 - 18613.07 |
|
29/29 | |||||
| 82CaRa (Carrington & Ramsay, 1982) | 17111.40 - 25281.30 |
|
231/231 | |||||
| 82HeCoGrMo (Helm et al., 1982) | 15460 - 28484 |
|
51/51 | 1 | ||||
| 81GrBrOkWi (Grieman et al., 1981) | 22540.0 - 23615.1 | 36/36 | ||||||
| 80CoHeMo (Cosby et al., 1980) | 27494 - 28523 | Transitions unassigned | N/A | |||||
| 60DoMo (Douglas & Morton, 1960) | 20524.30 - 26266.21 |
|
130/129 | |||||
| 42DoHe (Douglas & Herzberg, 1942) | 20636.8 - 26704.1 | 94/94 |
a Bracketed values indicate the vibrational bands involved in transition, ().
b ‘A/V’: Number of actual lines in source/Number of lines validated by MARVEL.
c Uncert: Average uncertainty as quoted (if available), or the modified uncertainty for the MARVEL algorithm.
2 Methods
To calculate the line list of CH+, quantum mechanical nuclear-motion calculations were performed using the program LEVEL (Le Roy, 2017) which generated the desired energy levels and transition data. To verify and improve on the calculated data, existing experimental and observational spectroscopic data for CH+ were gathered for use with the program MARVEL (Measured Active Rotational-Vibrational Energy Levels) (Furtenbacher et al., 2007). The MARVEL (Furtenbacher et al., 2007) algorithm inverts transition data to give highly accurate energy levels along with determined uncertainties.
2.1 MARVEL energy levels
767 12CH+ lines were collected from existing observational studies as summarised in Table 1. While most of the sources are from high resolution laboratory studies, 97CeLiGoCo (Cernicharo et al., 1997) and 21NeGoChFa (Neufeld et al., 2021) are actually astronomical observations. Table 1 shows that there are rather few observed transitions within the X ground state of 12CH+, hence the need to include astronomically observed lines which were deemed sufficiently accurate to use and helped to expand and refine the MARVEL network. The vast majority of existing data covers the A-X band with variable accuracy, with some papers, particularly older ones, not providing uncertainties at all and, in the case of 80CoHeMo (Cosby et al., 1980), not assigning their transitions. This means that the observed frequencies cannot be added to the MARVEL network, where the nodes are characterised by the quantum numbers of the energy levels involved. There is only comprehensive MARVEL energy level data (extending up to high ) for vibrational states with for both electronic states, and some limited data for A .
MARVEL analyses uncertainty when evaluating transition data and is able to determine whether or not an uncertainty is consistent with the other data. Using this, the quoted experimental uncertainties for the older sources 42DoHe (Douglas & Herzberg, 1942), 60DoMo (Douglas & Morton, 1960) and 81GrBrOkWi (Grieman et al., 1981) were increased to allow MARVEL to become self-consistent. After this it was only necessary to exclude two lines from the network: the 06PeDr pure rotational line and the 60DoMo A-X P(8) line.
The MARVEL input transitions file and output energies file are given as supplementary data to this paper. There was insufficient spectroscopic data to perform a MARVEL study for 13CH+.
2.2 Calculations (LEVEL)
Version LEVEL-16 (Le Roy, 2017) was used to compute the line list. This solves the radial Schrödinger equation to give vibrational and rotational energy levels within a defined potential, as well as transition frequencies and Einstein coefficients for the coupling within or between potentials. LEVEL was chosen as the existing work on CH+ by Cho & Le Roy (2016) used features in this program that are not easy to reproduce with other nuclear motion programs.
The effective radial Schrödinger equation used in this study as given by Cho & Le Roy (2016) is
| (1) |
where is the reduced mass and represents the projection of electronic orbital angular momentum on the internuclear axis. is the adiabatic PEC of electronic state that can include Born-Oppenheimer breakdown (BOB) functions and describes centrifugal BOB function; see Cho & Le Roy (2016) for more detail on these BOB functions. For the () A state, Cho & Le Roy also include a -dependent term in the potential to incorporate the effects of -doubling, as follows
| (2) |
where and 0 for and levels respectively (in accordance with the form suggested later by Yu et al. (2018)), and is a -doubling radial strength function with the following form, also determined by Cho & Le Roy
| (3) |
with
| (4) |
where are expansion coefficients, Å is the equilibrium internuclear distance for the A state potential, and , all determined and given in Cho & Le Roy (2016). Solving Eq. (1) for each of the two electronic state potentials, , yields the vibrational and rotational eigenfunctions (energy levels) that form the basis of the line list.
2.2.1 Potential Energy and Dipole Moment Curves
The CH+ input file created for use in LEVEL by Cho & Le Roy (2016) was used as a basis in this study. Our investigation was limited to the ground and first excited singlet states, X and A , as investigated by Cho & Le Roy. As shown in Fig. 1 these are the only singlet states below the first dissociation limit, and any spin-forbidden transitions between these states and the low-lying triplet (a ) state are yet to be observed and likely to be extremely weak (Gao et al., 2017). Spin-orbit coupling to this state was also neglected.
The full, empirical potential energy curves calculated by Cho & Le Roy (2016) utilise previous spectroscopic data to characterise the curves more accurately than previous ab initio studies. Literature DMs (X-X and A-A) and TDMs (A-X) were compared to determined the most suitable available dipole moment curves, see Fig. 2. Since all curves agree well, we chose those of Biglari et al. (2014), due to their comprehensive characterisation of the curves up to high internuclear distance, . We note that Mbiba Touedebe et al. (2023) also recently characterised these quantities, but their work only became available after we started calculations and hence was not considered in the initial analysis.
To get correct results it transpired that the basic input file provided by Cho & Le Roy (2016) required modification. We utilised the most recent version of LEVEL (LEVEL-16) but there were significant issues with the both input file and the LEVEL code itself. Firstly, the input file gave incorrect values for several parameters which had to be investigated and corrected. For example, being set to 0 for the A and most of the parameters describing the 12CH+ X ground state were set to values that describe the 12CD+ A excited state! Even when amended, the input file still gave errors when running with LEVEL. Analysis of the Fortran source code showed that in places the code disagreed with the documentation and input file structure on the ordering of parameters that read the input potential energy function; we therefore modified the LEVEL code to resolve these errors. As Cho & Le Roy (2016) did not consider transition probabilities, we then modified the input file to read in the DM/TDM functions and to instruct LEVEL to compute Einstein A coefficients. The final version of the LEVEL input file is provided as supplementary info. The source for the modified LEVEL can be found at github.org/exomol.
2.2.2 -Doubling
LEVEL does not consider -doubling, the splitting of rotational energy levels in electronic states due to their -parity. -doubling is an important effect to consider, as without it our calculated energy levels in the A state would be degenerate which is incorrect. Yu et al. (2018) analysed -doubling in the CH+ A state where the effect arises due to the interactions of the rotational levels with / states, respectively. They found that treatment of this effect in all previous spectroscopic studies was incorrect as it was generally assumed that the -doubling energy of levels would lead to a symmetric shift in their energy terms, as the magnitude of the interaction of levels with states and levels with states was assumed to be equal. In practice, Yu et al. (2018) argued that the energy splitting is asymmetric with the levels negligibly perturbed since states will lie at much higher energy (none have so far been detected). In accordance with the findings of Yu et al. (2018), the A state energies computed by LEVEL correspond to the energy of the unperturbed -parity level. It is therefore necessary to account for the perturbed -parity levels. Cho & Le Roy (2016) model the splitting by the inclusion of an additional term in the potential energy function of their radial Schrödinger equation, as described in Eq. (2), which shows that the -parity energy level perturbation increases with , whereas the -parity levels are unperturbed. Since the version of LEVEL we used does not account for this, an empirical approach to considering the effect was taken.
The approach taken consisted of separately calculating a correction to each -parity rotational level within each vibrational level of the A state, which could be applied to give the energy of the corresponding -parity level. This involved computing the expectation value of the operator given in Eq. (2) for each vibrational level, , and evaluating the rotational -dependence to give the energy level correction. To do this, the operator was calculated for each value of internuclear distance, , in steps of 0.001 Å from to for each vibrational level, which ranged from 2100 grid points for to 90 000 for . The value of the vibrational wavefunction, provided by LEVEL upon modification of the input file, was also gathered at each value of . The expectation value, , was then calculated for each value and these were summed to give the overall expectation value for that vibrational level. This was repeated for all vibrational levels, and these values can be seen in column 2 of Table 2. Incorporating the dependence by evaluating the entirety of Eq. (2) (multiplying these corrections by )) gave the correction for each rotational level within each vibrational level. These corrections were then simply added to the -parity energy to obtain the perturbed -parity energy.
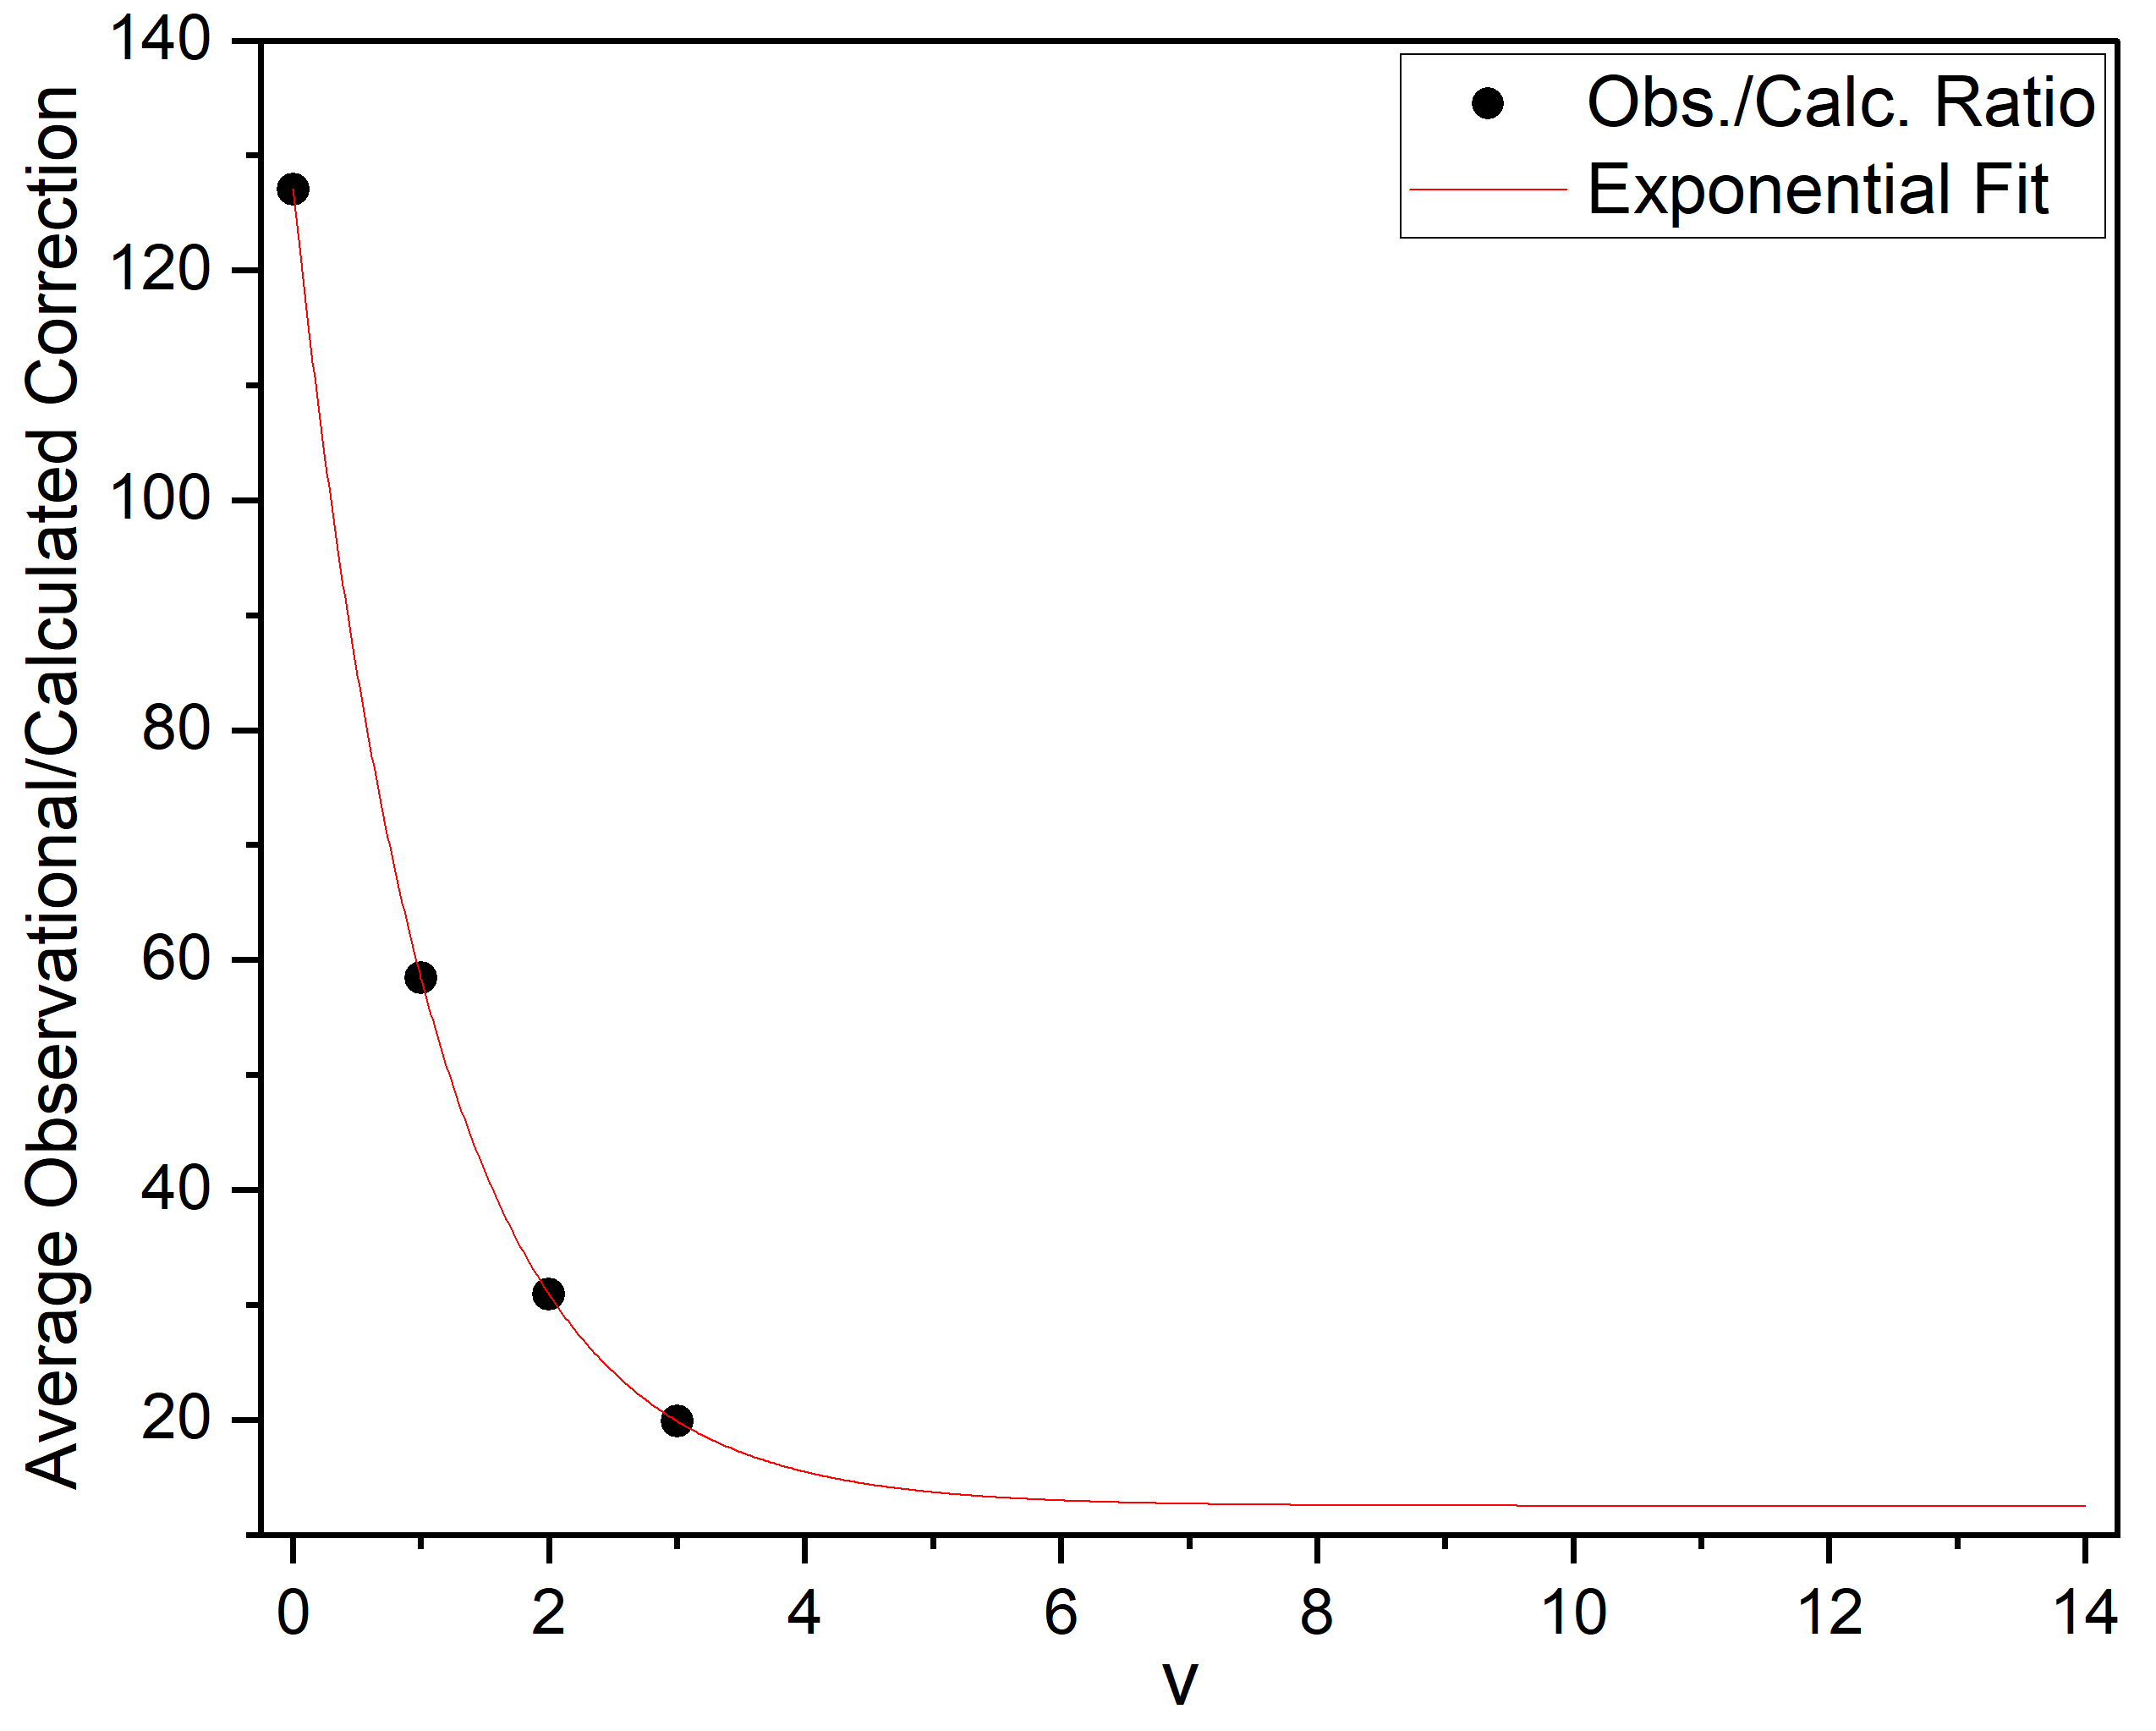
To verify these calculations, comparison was made to observed (experimental) splittings, some of which were available from MARVEL data (where both and energies for the same rotational level were known). The calculations did not initially produce results in line with observational corrections, however, further investigation revealed that the ratio between the calculated and corresponding observed correction was generally constant within each vibrational level from to , the region over which the MARVEL data was fairly comprehensive. Therefore the calculated corrections within each vibrational level could be scaled by the average ratio to provide an accurate account of -doubling in line with observation. The average ratio for each can be seen in Fig. 3, showing an apparent exponentially-decaying trend with increasing . Unfortunately, due to the limited coverage of the MARVEL data, little information about higher levels meant an extrapolation of the curve was necessary to estimate the ratio for higher levels. The extrapolation was performed using an exponential fit and is shown in Fig. 3. From this, the extrapolated ratio for levels could be estimated, as seen by the asterisked values in column 3 of Table 2. With this, the calculated corrections for each level were scaled by the corresponding ratio to give the final correction for each level, as can be seen in the final column of Table 2. After applying -dependence, the final correction values for each level was added to the corresponding (-state) energy to give that of the -state. The scaling with observational corrections means this approach should be accurate for low ’s but the extrapolated corrections are less secure and would benefit from experimental confirmation.
|
|
|
|||||||
|---|---|---|---|---|---|---|---|---|---|
| 0 | 0.000297 | 127.051 | 0.037787 | ||||||
| 1 | 0.000594 | 58.449 | 0.034727 | ||||||
| 2 | 0.001017 | 30.897 | 0.031434 | ||||||
| 3 | 0.001429 | 19.902 | 0.028440 | ||||||
| 4 | 0.001736 | 15.464* | 0.026851 | ||||||
| 5 | 0.001906 | 13.690* | 0.026096 | ||||||
| 6 | 0.001946 | 12.978* | 0.025261 | ||||||
| 7 | 0.001877 | 12.693* | 0.023827 | ||||||
| 8 | 0.001713 | 12.579* | 0.021553 | ||||||
| 9 | 0.001463 | 12.533* | 0.018334 | ||||||
| 10 | 0.001134 | 12.515* | 0.014188 | ||||||
| 11 | 0.000752 | 12.507* | 0.009402 | ||||||
| 12 | 0.000384 | 12.504* | 0.004800 | ||||||
| 13 | 0.000136 | 12.503* | 0.001704 | ||||||
| 14 | 0.000026 | 12.503* | 0.000322 |
2.2.3 Einstein Coefficients
LEVEL computes Einstein coefficients using the expression
| (5) |
where is the Einstein coefficient (s-1), is the Hönl-London rotational intensity factor (Hansson & Watson, 2005), the upper level rotational quantum number, the transition wavenumber (cm-1), and the normalised initial and final state radial wavefunctions and the expectation value of the dipole/transition dipole moment function , which we asked LEVEL to output.
LEVEL’s lack of consideration of -doubling means -parity A levels are not present and transitions involving these states were not correctly accounted for. A ()-X transitions were incorrectly assigned the wavenumber of the corresponding (forbidden by dipole selection rules) A ()-X transition which led to an incorrect calculation of the Einstein coefficient since Eq. (5) depends on the transition wavenumber. By applying the relevant correction to each transition wavenumber, the Einstein coefficient was recalculated using Eq. (5) and the outputted dipole matrix elements. For transitions within the A state this required some care due to many transitions being unaccounted for, as there exist potentially four transitions where LEVEL computes just one transition and thus one coefficient that uses (often incorrect) transition information that LEVEL provided. For example, LEVEL gives Q-branch (=0) transitions within the same vibrational level a wavenumber of 0 cm-1, but in reality these correspond to long-wavelength, allowed -doublet transitions between and states of the same rotational level. This meant calculating Eq. (5) in its entirety including determining the relevant Hönl-London factor (Hansson & Watson, 2005). Note that these methods to recalculate the Einstein coefficient assume the expectation value of the DM/TDM function in Eq. (5) remains unchanged, which is in any case a common approximation used in other treatments and is unlikely to be problematic.
2.3 Final line lists
This above calculation procedure was followed for both 12CH+ and 13CH+ and line lists were generated considering states with up to 68 and 69, respectively. For 12CH+ one further step was performed. The MARVEL energy levels with associated uncertainties were used to replace the ones computed by LEVEL.
Due to the greater accuracy of the empirical MARVEL data, calculated 12CH+ energies were replaced with the respective MARVEL values where available in the States file. These ‘MARVELised’ energy levels can be identified via the ‘Label’ column in the states file which indicates ‘Ma’ if the MARVEL energy level was used, or ‘Ca’ if there was no such available data. Note that the calculated energy prior to MARVELisation is given in the ‘Calc.’ column. The uncertainty in the States file is determined depending on the energy level used. For the MARVELised energies, the uncertainty provided by MARVEL was simply used. For the calculated energies (which includes all 13CH+ levels), an estimate for the uncertainty was made using the following expression:
| (6) |
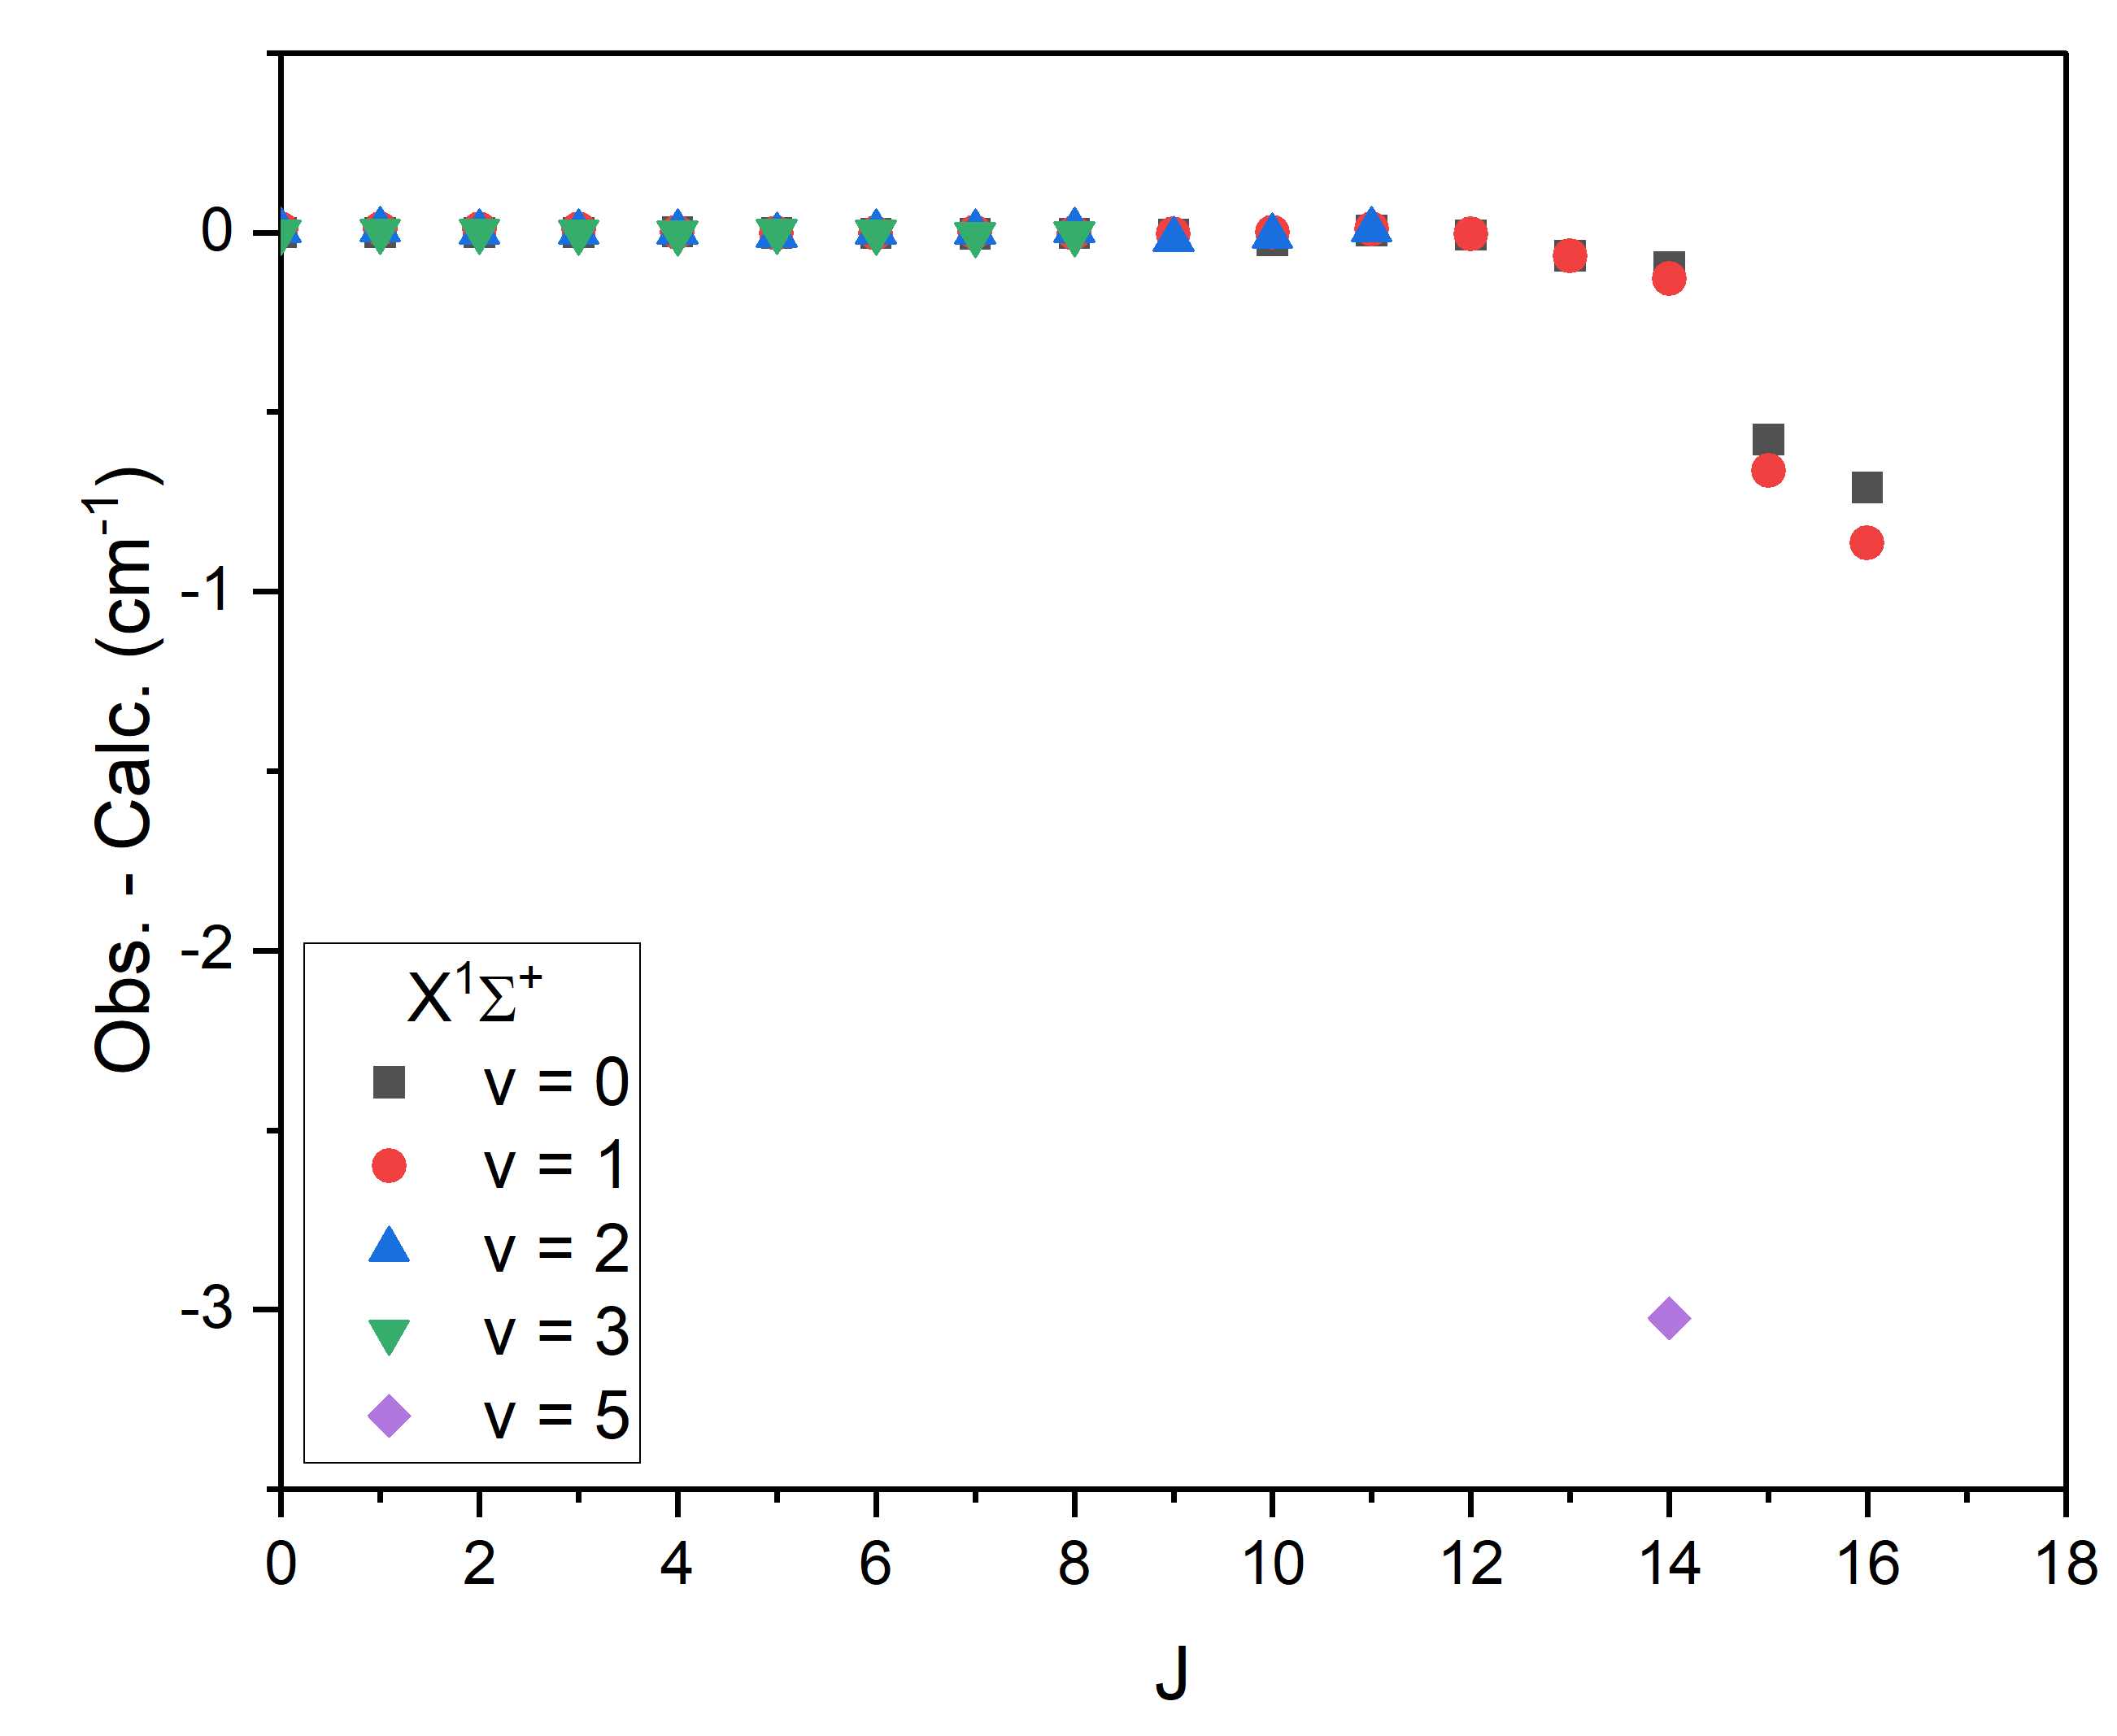
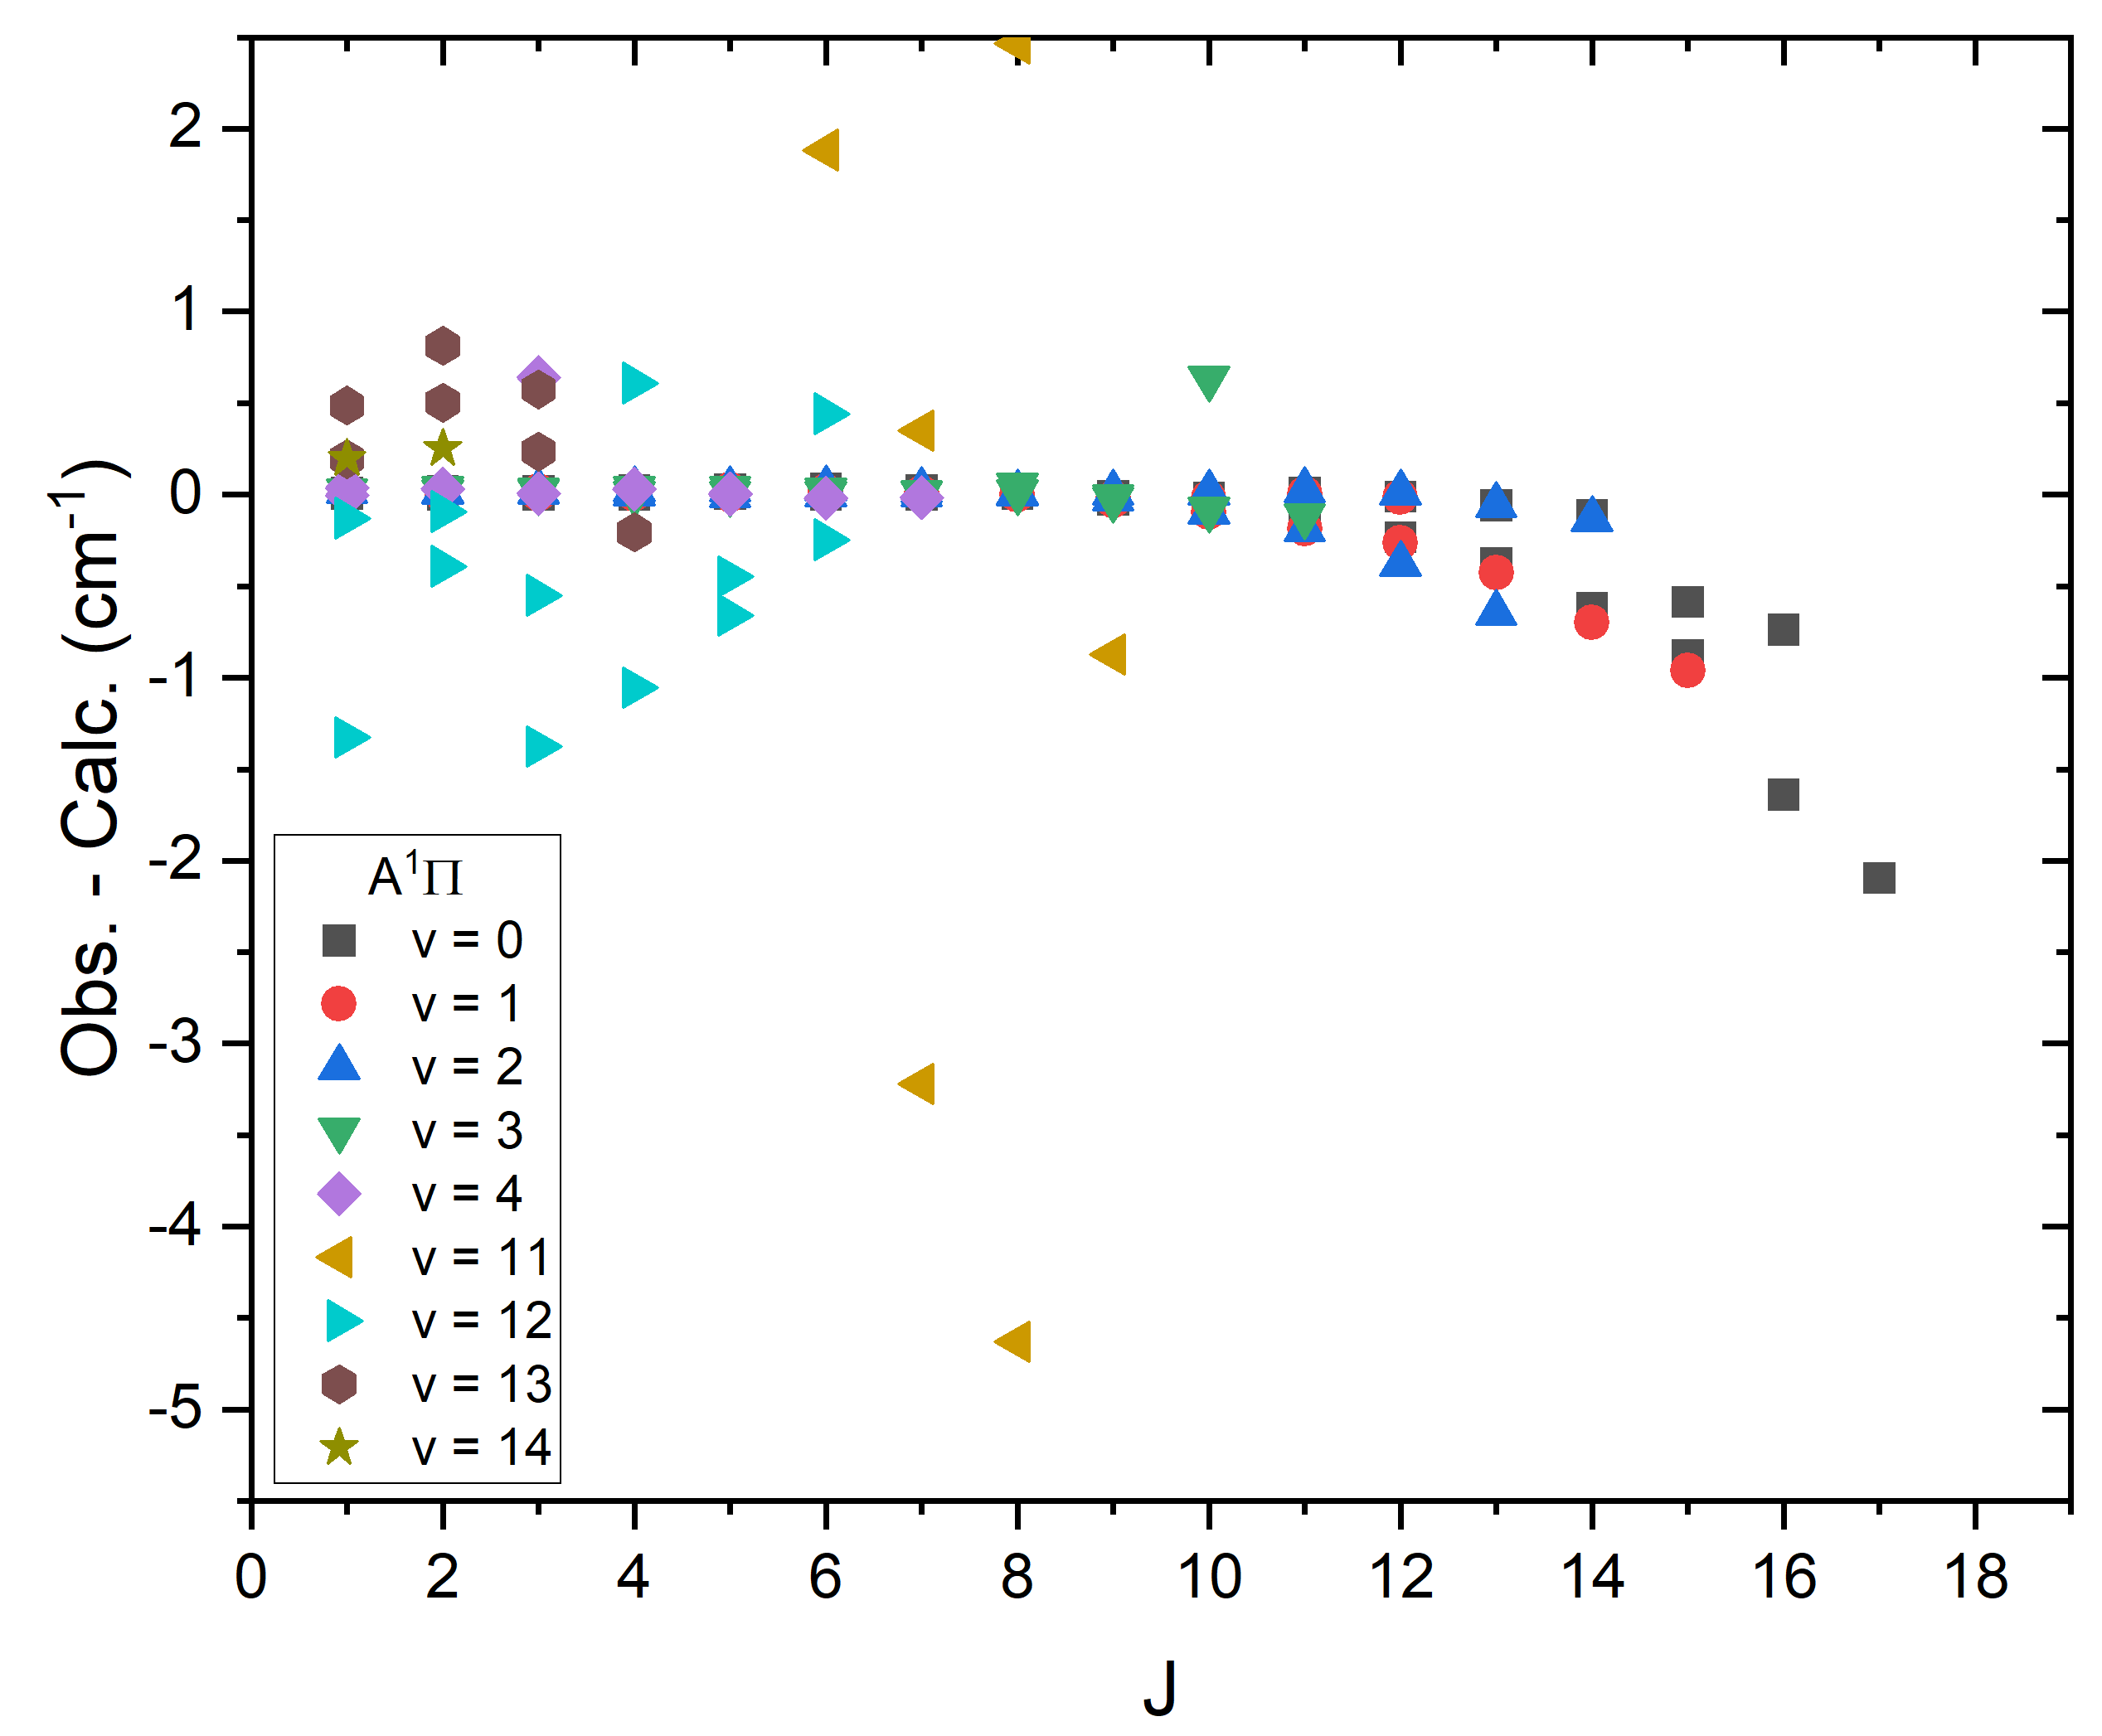
where cm-1 and cm-1 for are constant parameters for the X /A electronic states, respectively. These parameters were estimated by analysing the evolution of 12CH+ obs. calc. energy level residuals seen in Fig. 4, which plots the agreement of the MARVEL (obs.) and LEVEL (calc.) data and how this varies with and within each electronic state. Overall, the residuals were very small for low and/or levels of both the electronic states. Naturally, A has greater residuals, especially for high , since higher energies are probed and as a result of the manual treatment of -doubling, but in general both states exhibit good accuracy. An apparent quadratic dependence can be seen in the residuals in Fig. 4, motivating the form of Eq. (6).
3 Results
3.1 Line list and File Structure
With calculated energies for rotational and vibrational levels of X and A , and transition frequencies and Einstein coefficients for allowed transitions, the components of the line list of CH+ were complete. In accordance with ExoMol format, this was reformatted into a States and Transitions file (Tennyson et al., 2013), extracts from which for 12CH+ can be seen in Tables 3 and 4 respectively. The 12CH+ States file contains 1505 rovibrational energy levels covering the X and A electronic states up to a few thousand wavenumbers above the dissociation limit, additionally providing their uncertainty and associated quantum numbers defining the level. The Transitions file, characterising 34 194 transitions, contains Einstein coefficients and frequencies for each allowed transition between the energy levels of the States file. For 13CH+ there are 1519 states and 42 387 transitions. We call these line lists PYT.
| Energy (cm-1) | Unc. (cm-1) | (s) | State | label | Calc. | |||||||||
|---|---|---|---|---|---|---|---|---|---|---|---|---|---|---|
| 367 | 24005.218550 | 134 | 33 | 11.470000 | 1.1470E+01 | e | X1Sigma+ | 5 | 0 | 0 | 0 | Ca | 24005.218550 | |
| 368 | 24038.829766 | 10 | 2 | 0.610000 | 6.1000E-01 | + | e | X1Sigma+ | 11 | 0 | 0 | 0 | Ca | 24038.829766 |
| 369 | 24072.559047 | 26 | 6 | 0.334901 | 3.3490E-01 | f | A1Pi | 0 | 1 | 0 | 1 | Ma | 24072.560989 | |
| 370 | 24074.180657 | 26 | 6 | 0.217601 | 2.1760E-01 | + | e | A1Pi | 0 | 1 | 0 | 1 | Ma | 24074.148026 |
| 371 | 24091.232882 | 14 | 3 | 0.670000 | 6.7000E-01 | e | X1Sigma+ | 11 | 0 | 0 | 0 | Ca | 24091.232882 | |
| 372 | 24107.338107 | 78 | 19 | 4.250000 | 4.2500E+00 | e | X1Sigma+ | 9 | 0 | 0 | 0 | Ca | 24107.338107 | |
| 373 | 24131.807092 | 110 | 27 | 7.910000 | 7.9100E+00 | e | X1Sigma+ | 7 | 0 | 0 | 0 | Ca | 24131.807092 | |
| 374 | 24160.970652 | 18 | 4 | 0.750000 | 7.5000E-01 | + | e | X1Sigma+ | 11 | 0 | 0 | 0 | Ca | 24160.970652 |
| 375 | 24162.245191 | 146 | 36 | 13.520000 | 1.3520E+01 | + | e | X1Sigma+ | 4 | 0 | 0 | 0 | Ca | 24162.245191 |
| 376 | 24165.617170 | 166 | 41 | 17.320000 | 1.7320E+01 | e | X1Sigma+ | 2 | 0 | 0 | 0 | Ca | 24165.617170 | |
| 377 | 24229.503713 | 58 | 14 | 2.600000 | 2.6000E+00 | + | e | X1Sigma+ | 10 | 0 | 0 | 0 | Ca | 24229.503713 |
| 378 | 24229.561434 | 30 | 7 | 0.366501 | 3.6650E-01 | + | f | A1Pi | 0 | 1 | 0 | 1 | Ma | 24229.563130 |
| 379 | 24231.703209 | 30 | 7 | 0.204901 | 2.0490E-01 | e | A1Pi | 0 | 1 | 0 | 1 | Ma | 24231.679179 | |
| 380 | 24247.929131 | 22 | 5 | 0.850000 | 8.5000E-01 | e | X1Sigma+ | 11 | 0 | 0 | 0 | Ca | 24247.929131 | |
| 381 | 24351.966003 | 26 | 6 | 0.970000 | 9.7000E-01 | + | e | X1Sigma+ | 11 | 0 | 0 | 0 | Ca | 24351.966003 |
| 382 | 24408.044035 | 34 | 8 | 0.354901 | 3.5490E-01 | f | A1Pi | 0 | 1 | 0 | 1 | Ma | 24408.042265 |
: State counting number, : Total statistical weight, : Total angular momentum, Unc: uncertainty (cm-1), : lifetime (s), : Total parity, : Rotational parity, : Vibrational level quantum number, : Projection of electronic angular momentum, : Projection of electron spin, : Projection of total angular momentum (), Label: ‘Ma’ denotes MARVEL energy level, ‘Ca’ denotes LEVEL calculated energy level, Calc.: LEVEL calculated energy level value.
| (s-1) | (cm | ||||||
| 516 | 377 | 3.1861E+01 | 2754.475947 | ||||
| 1178 | 759 | 1.1669E-09 | 2755.165546 | ||||
| 92 | 58 | 1.5055E+00 | 2756.287971 | ||||
| 658 | 473 | 3.9484E+00 | 2756.308088 | ||||
| 544 | 392 | 2.8961E+01 | 2756.981308 | ||||
| 266 | 210 | 2.5046E+01 | 2757.306730 | ||||
| 1169 | 754 | 5.0213E-09 | 2757.533295 | ||||
| 1161 | 748 | 1.9419E-02 | 2757.544843 | ||||
| 991 | 674 | 2.2755E-03 | 2757.621535 | ||||
| 612 | 440 | 1.0042E+01 | 2758.338556 | ||||
| 1166 | 751 | 1.6578E-09 | 2758.406401 | ||||
| 186 | 141 | 1.7163E+01 | 2758.513693 | ||||
| 1298 | 774 | 1.1399E+01 | 2758.878845 | ||||
|
|||||||
It should be noted that, in the 12CH+ Transitions file, all A-A transitions involving vibrational levels with levels are excluded. This is due to further issues with LEVEL, which gave an error for these transitions. No A-A transitions have ever been detected and they are unlikely to be seen astronomically in the foreseeable future so this is not a significant defect.
3.2 Partition Functions
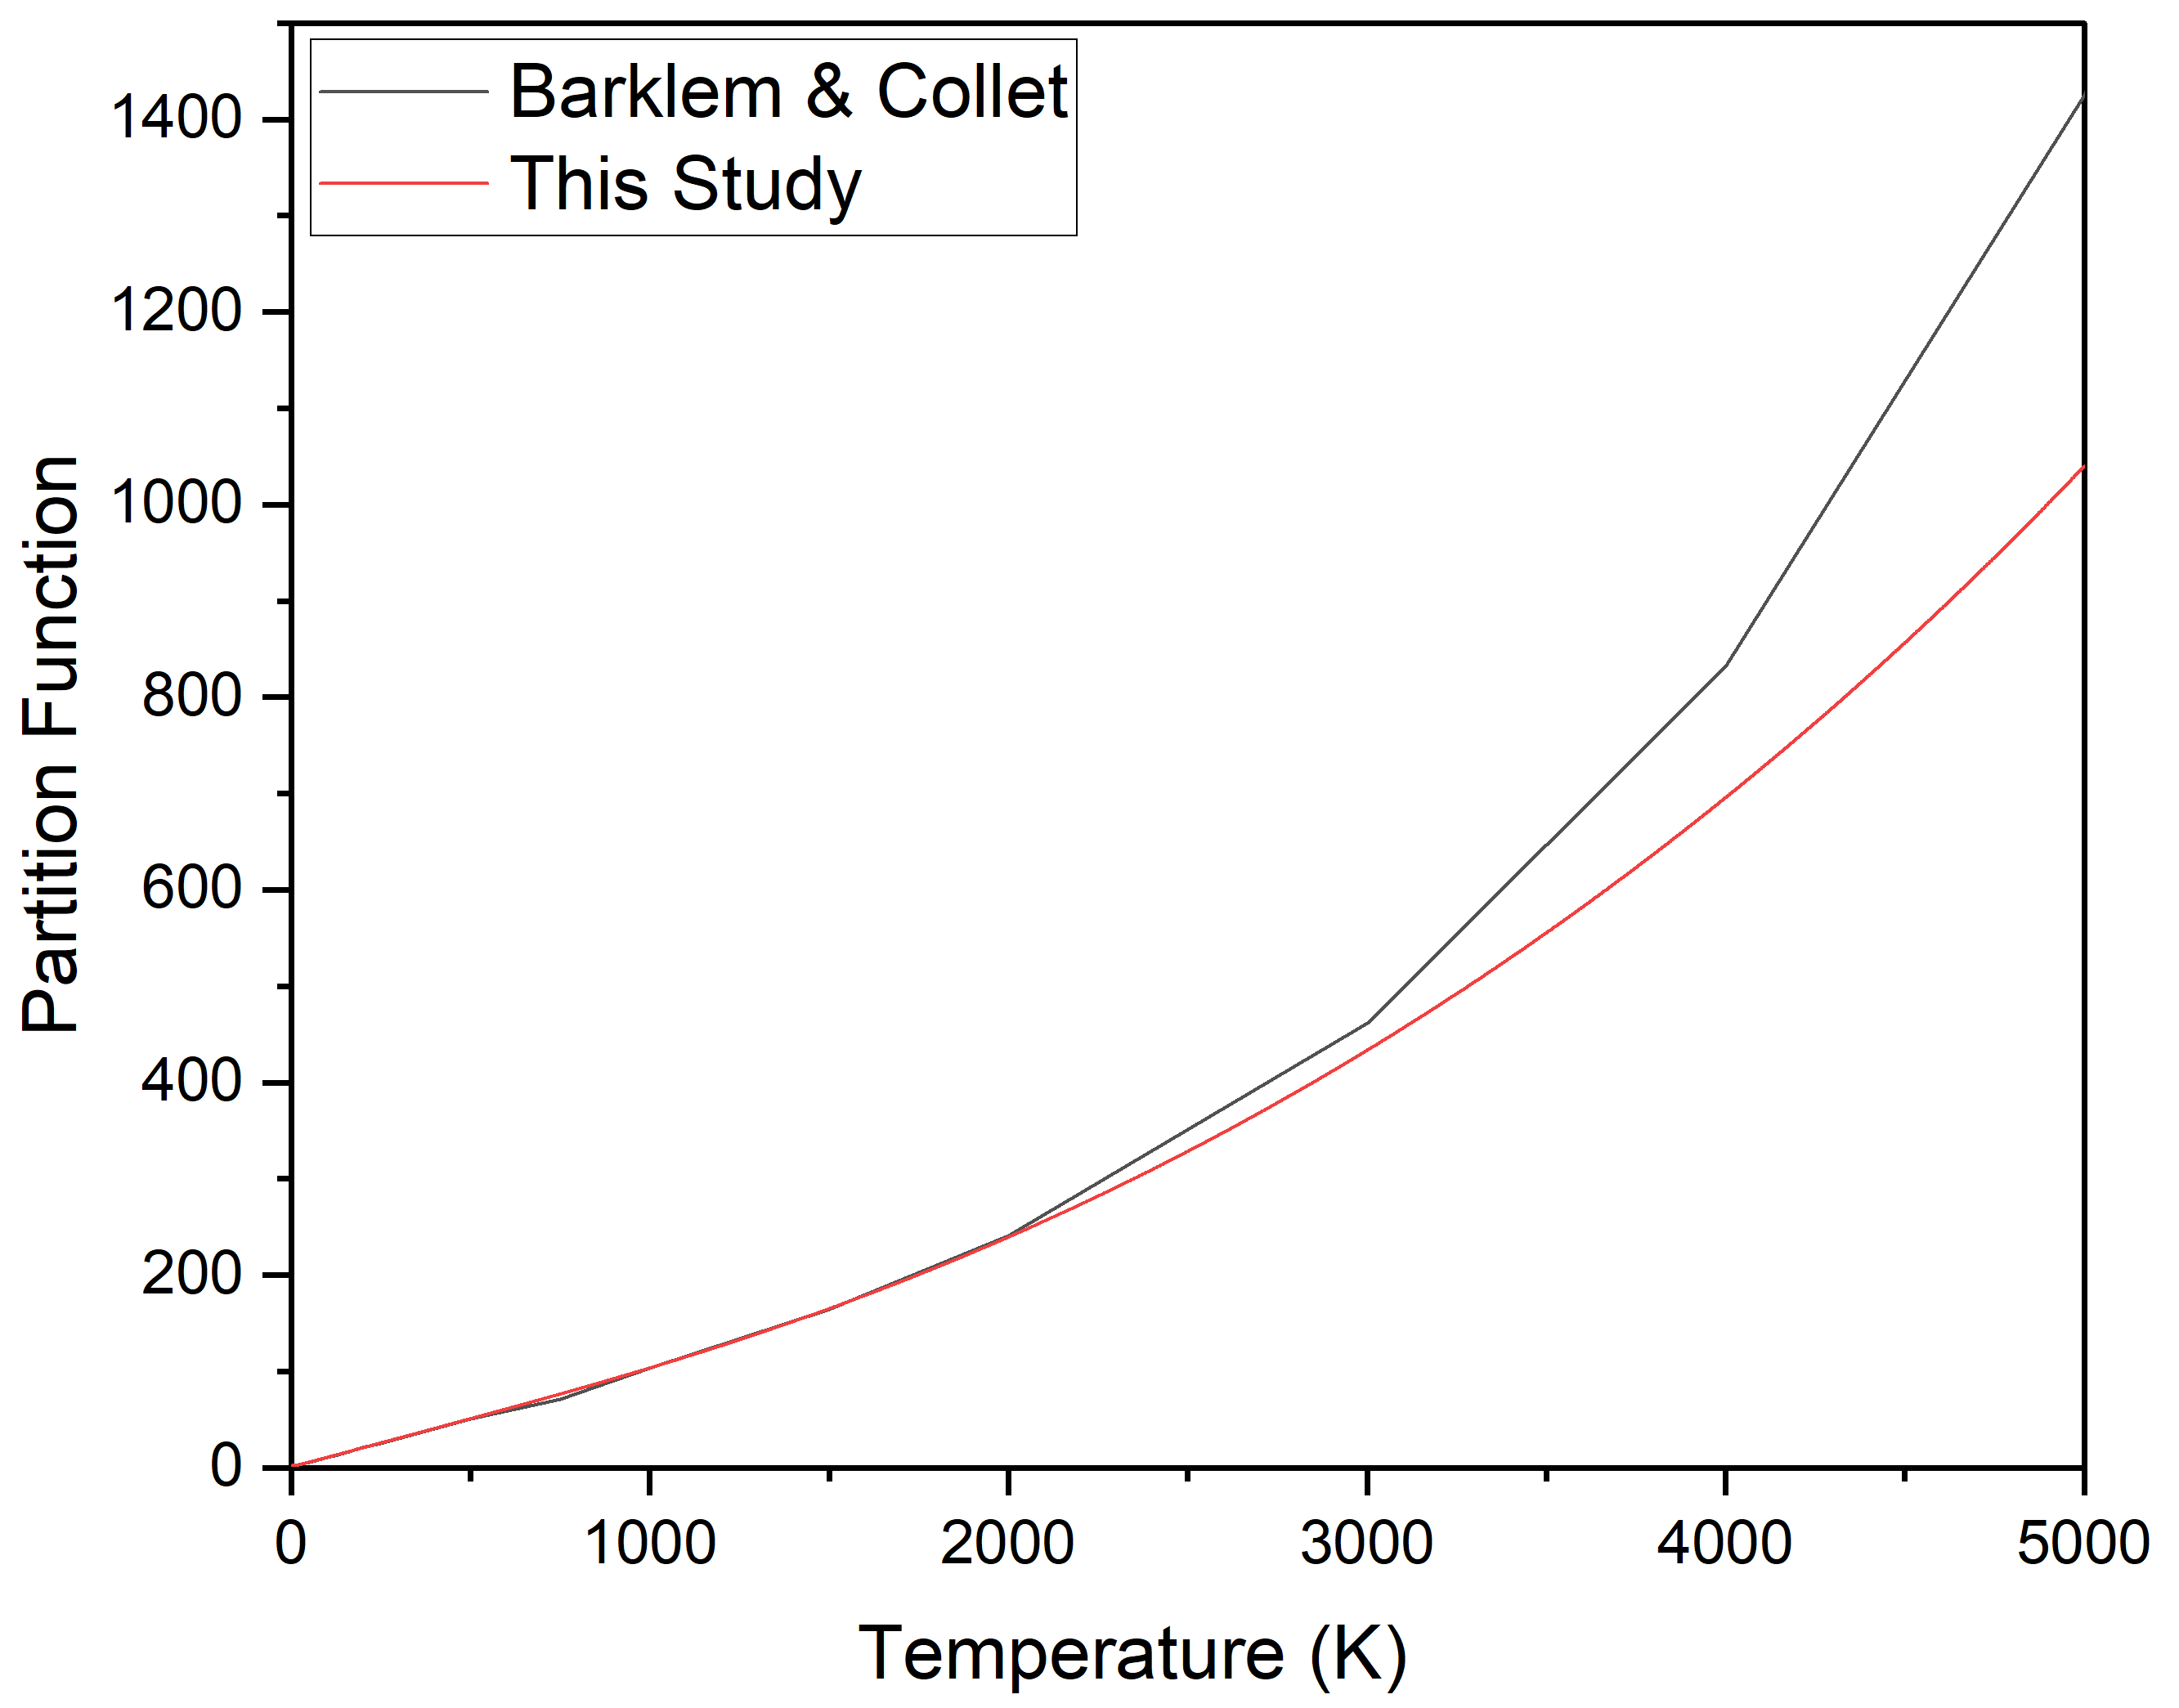
A partition function for 12CH+ was provided by Barklem & Collet (2016) for 42 temperatures up to 10 000 K. The program ExoCross (Yurchenko et al., 2018) was used to calculate the partition function for both 12CH+ and 13CH+ in steps of 1 K up to 10 000 K. The ExoMol convention, in accordance with HITRAN (Gamache et al., 2017), is to provide partition functions that include full atomic nuclear spin degeneracy, . For 12C1H+, this gives a value of 2, while for 13CH+ it gives 4. As such, the values of the 12CH+ partition function of Barklem and Collet, who do not account for this, have been multiplied by 2 for comparison, which can be seen in Fig. 5. Very good agreement can be seen below about 3000 K. At higher temperatures, agreement decreases somewhat which is likely due to the increasingly significant thermal occupation of higher energy electronic states that were not considered in this study, most notably the a state which lies between X and A As a result, a maximum temperature of 5000 K has been shown. JPL also provided a 12CH+ partition function for several low temperatures, the largest of which, at 300 K, 30.7006 (Pickett et al., 1998) (again after accounting for nuclear spin degeneracy) shows excellent agreement with the calculated value here of 30.6990.
3.3 Spectra
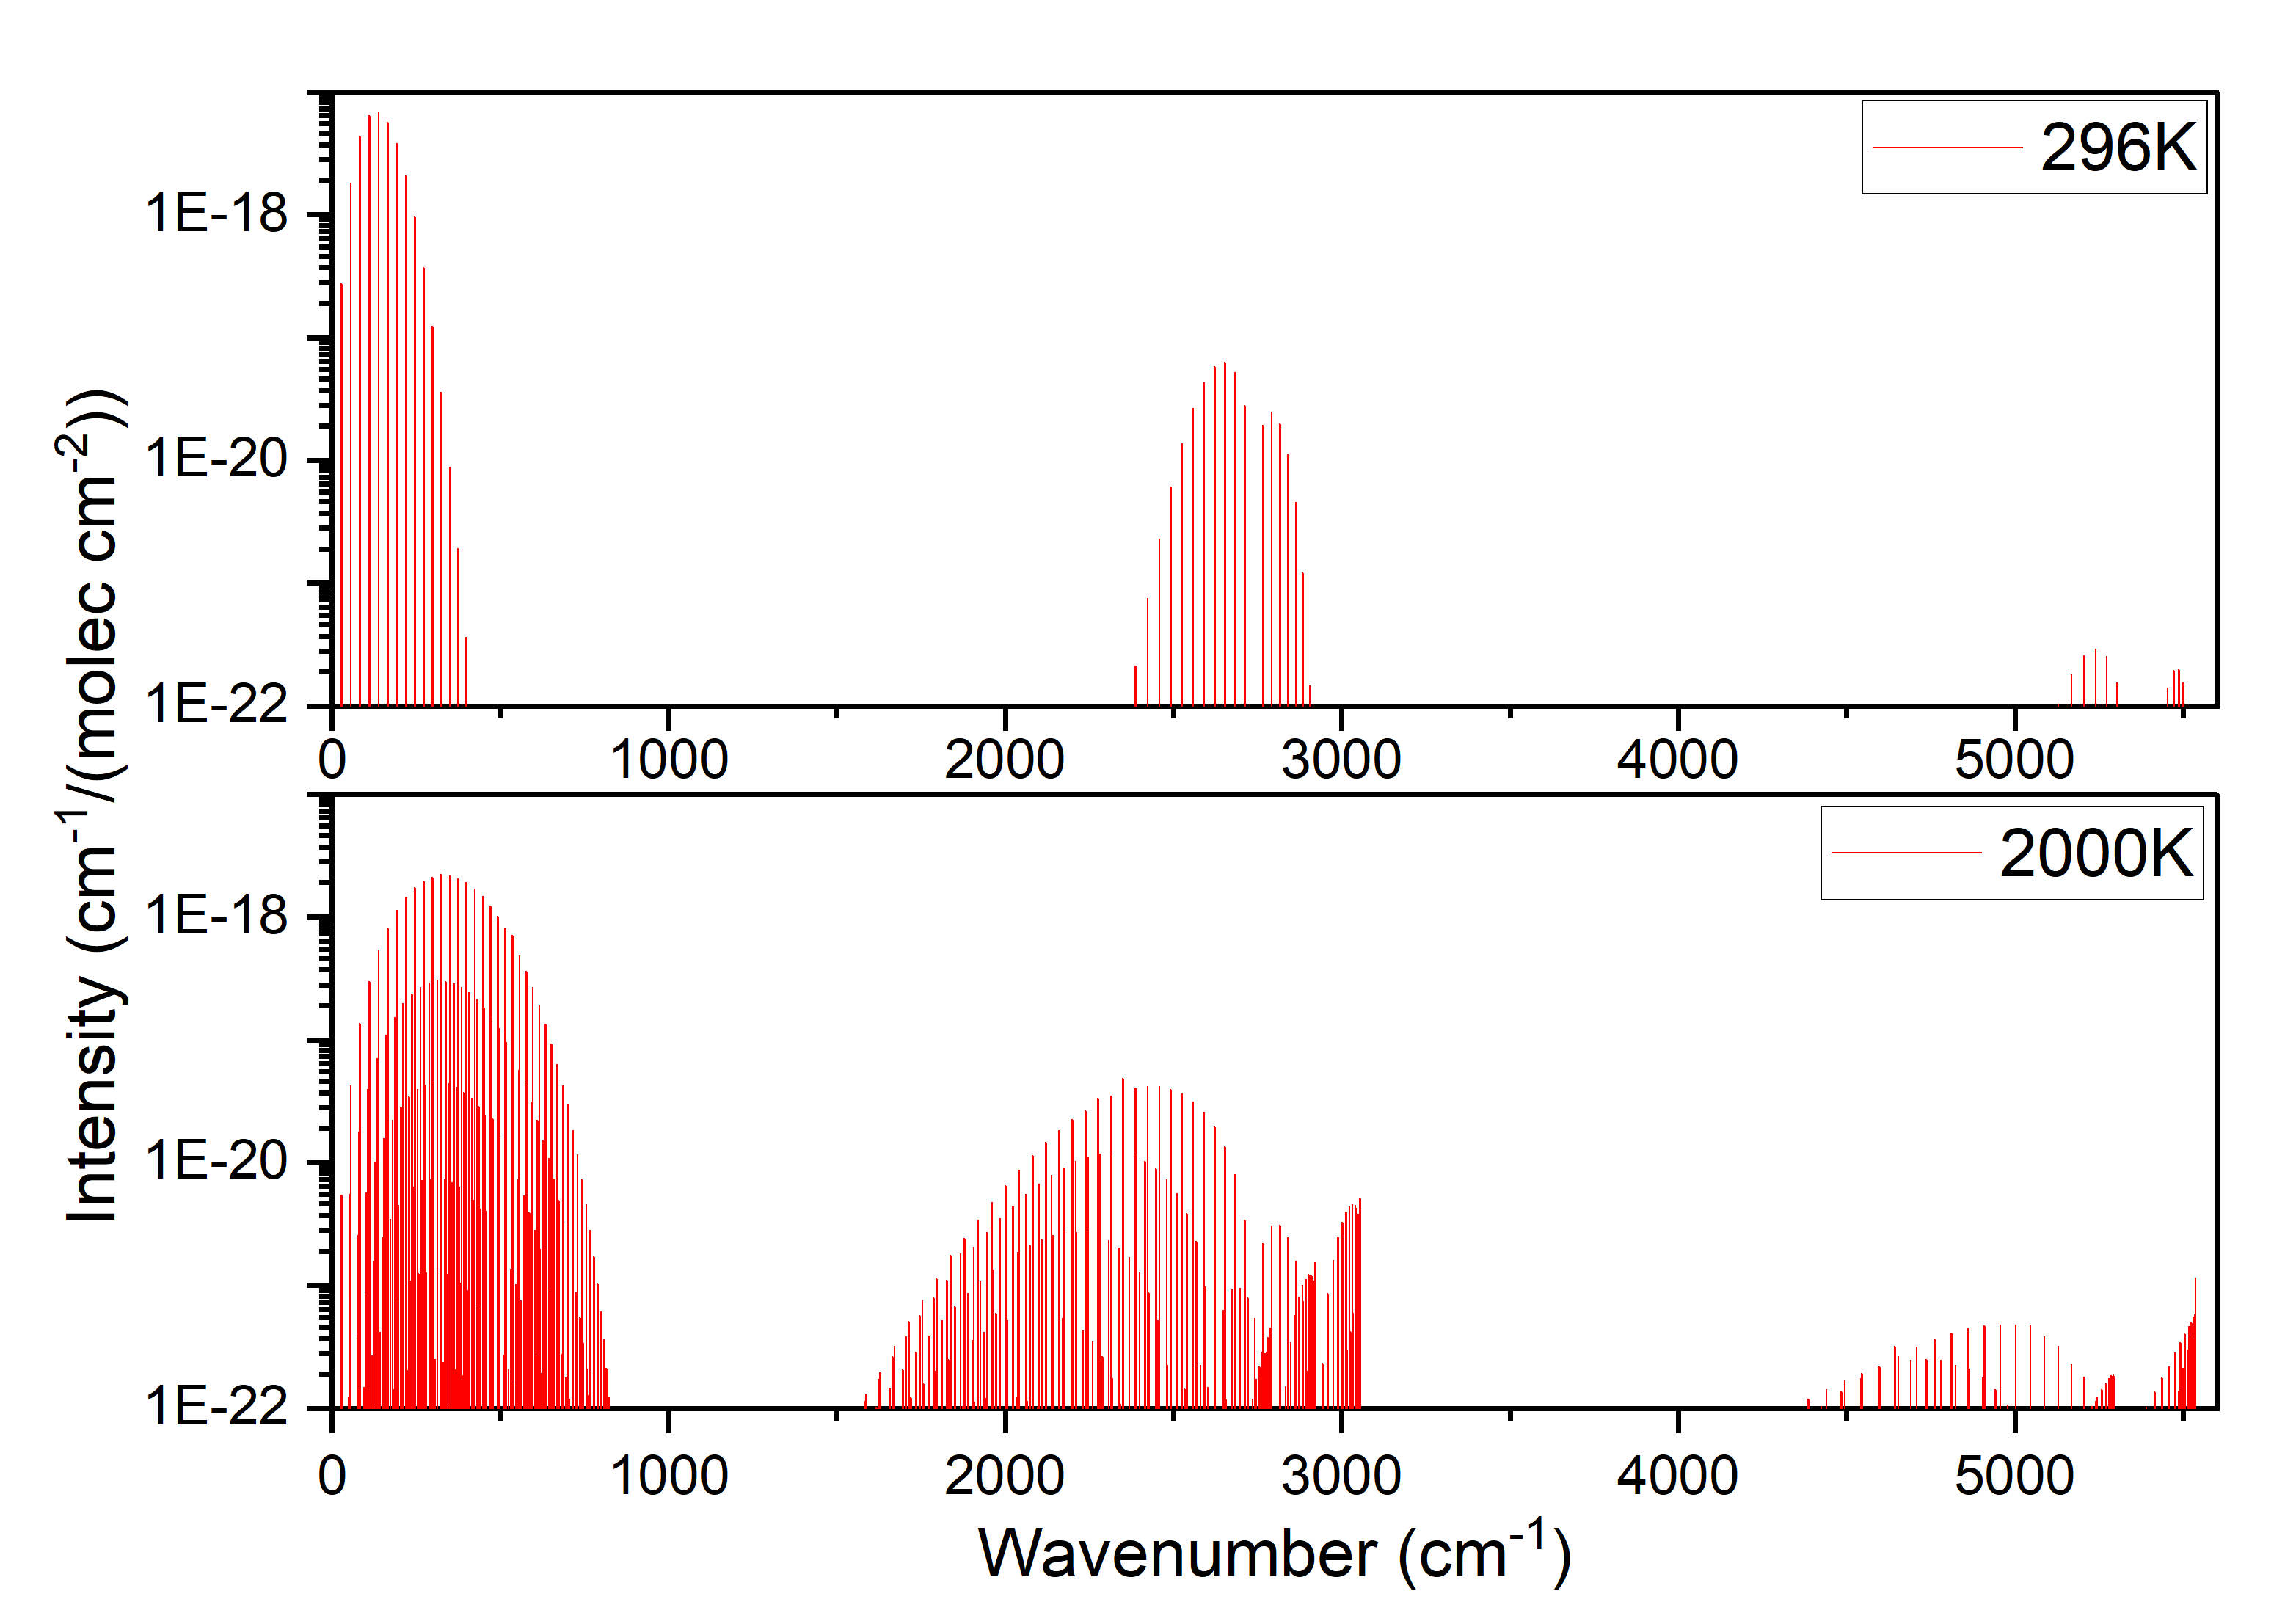
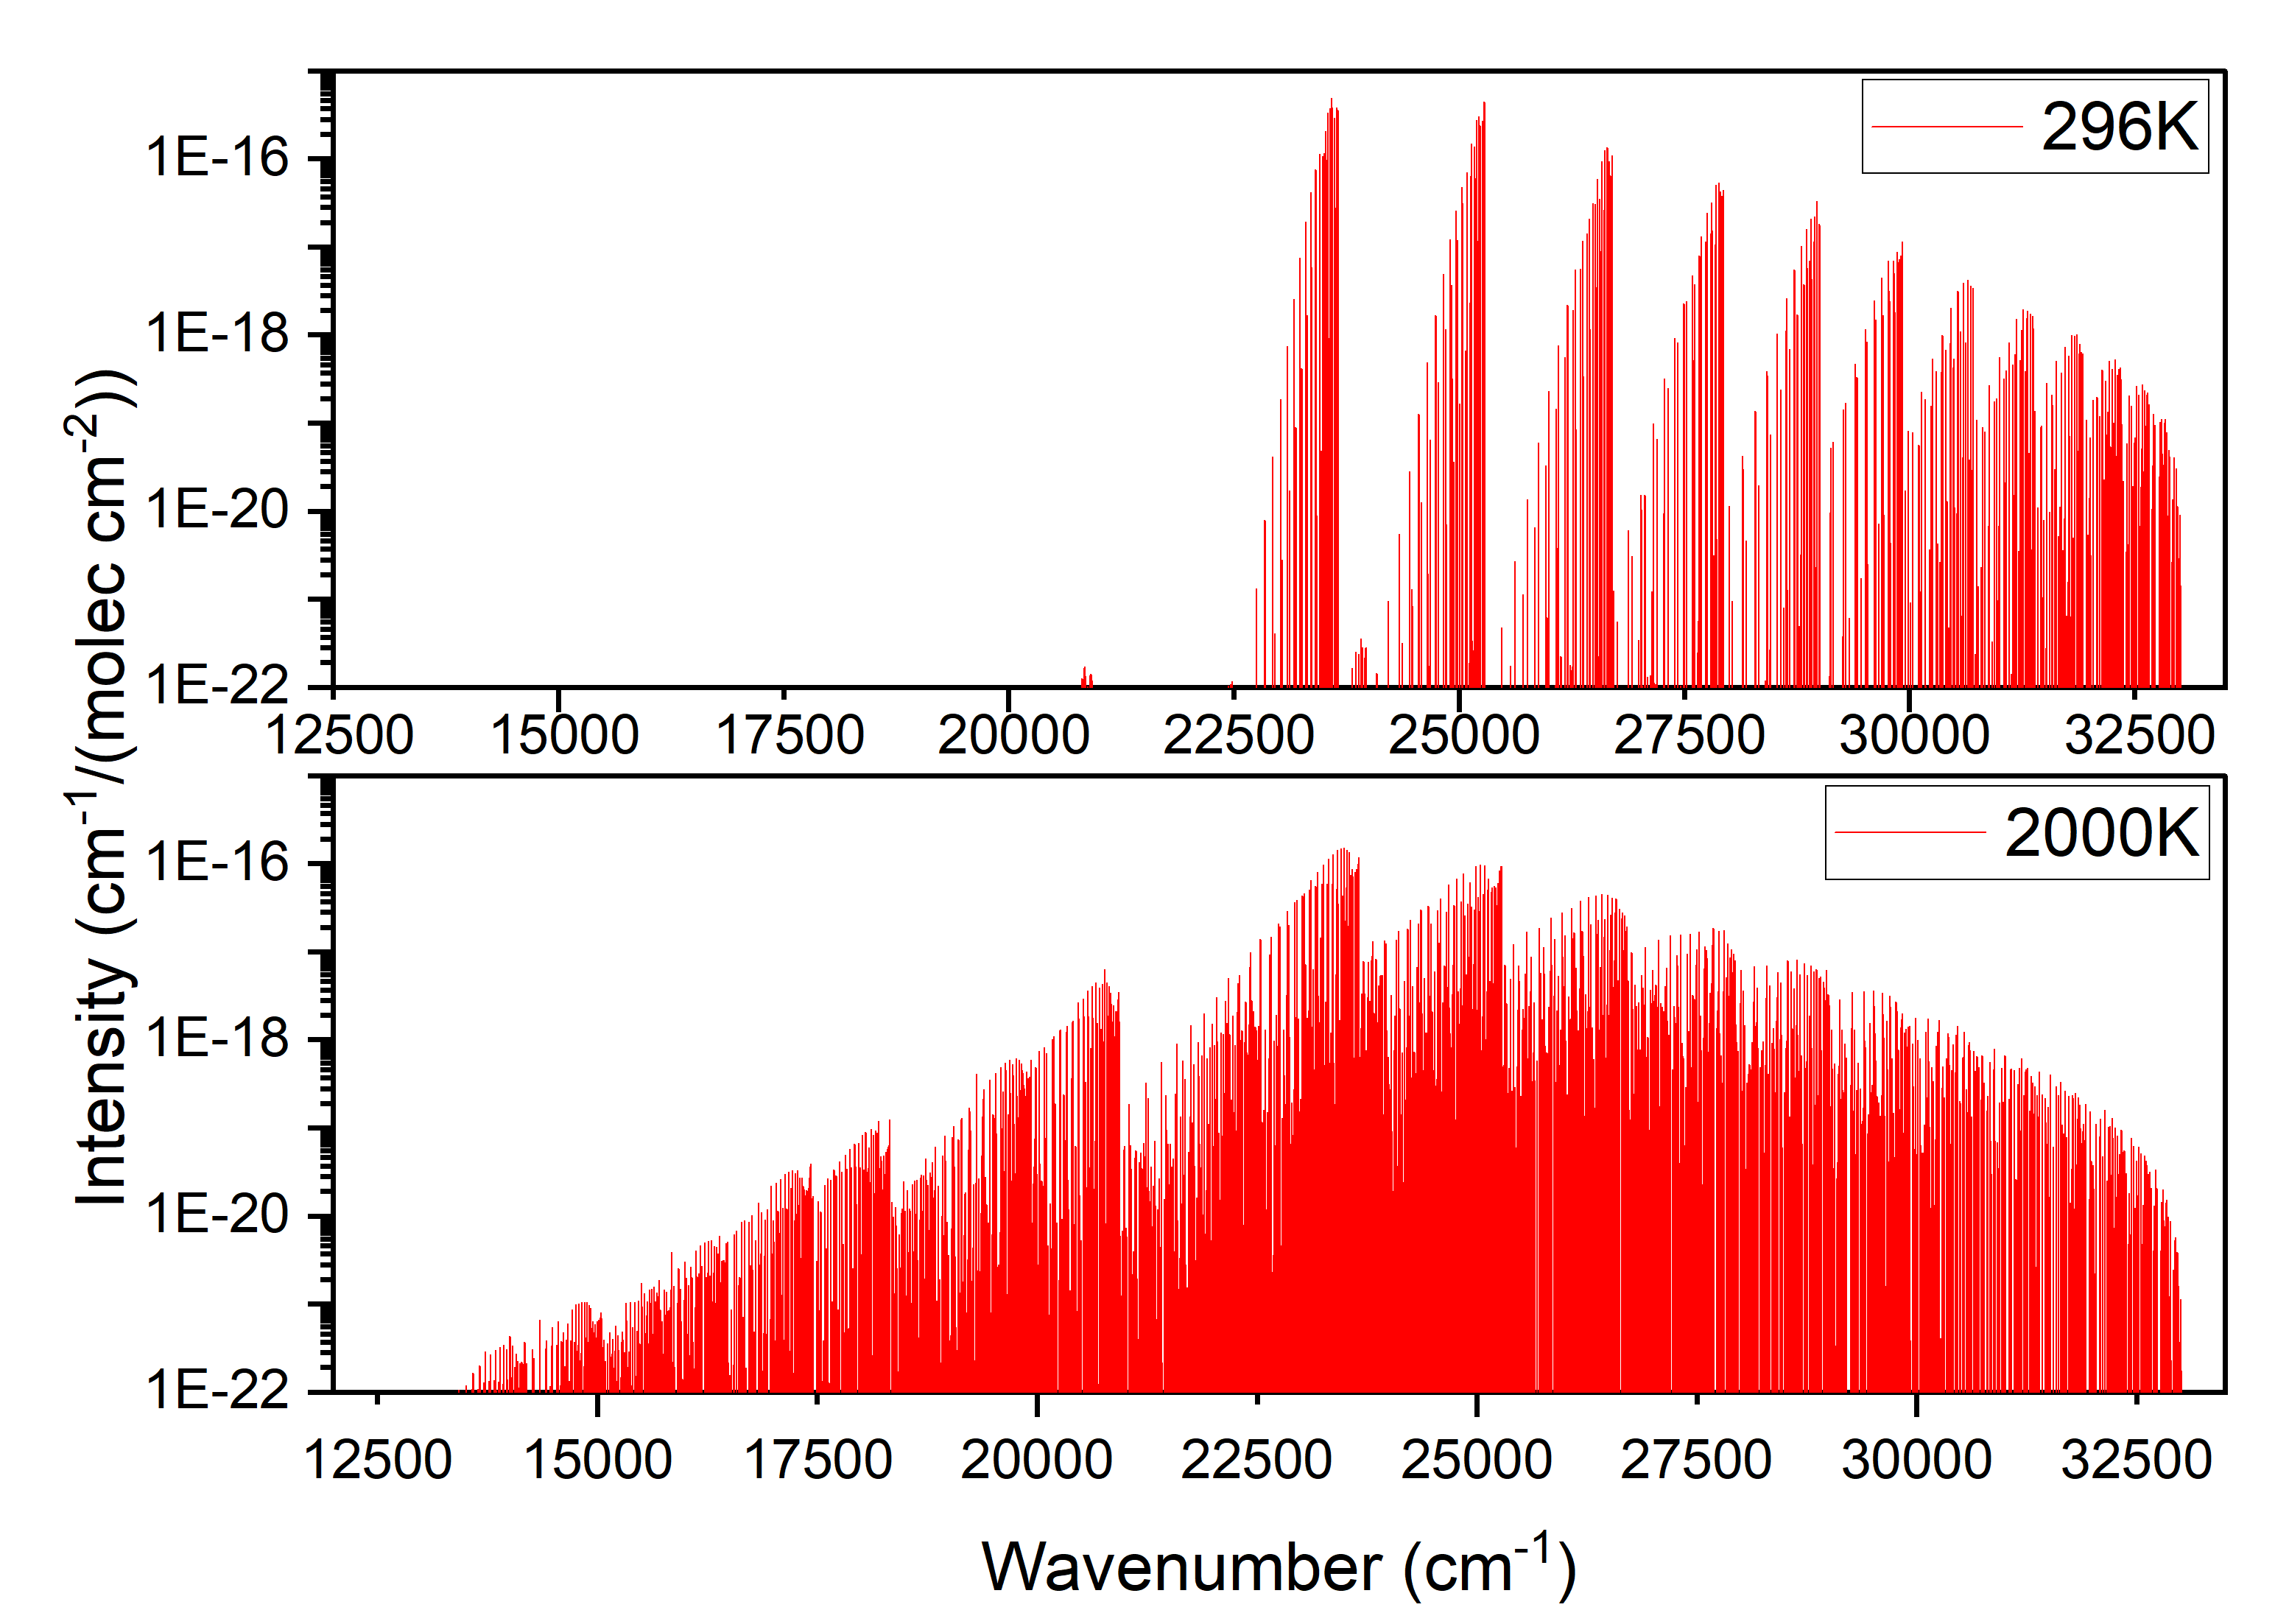
Using the PYT 12CH+ line list, ExoCross (Yurchenko et al., 2018) was used to simulate absorption/emission spectra at various temperatures. Figure 6 shows simulated absorption spectra for temperatures of 296 K and 2000 K. A Doppler broadened Gaussian profile that is dependent on temperature has been used. The spectra have been separated with rotational and vibrational spectra in the top panel and electronic in the bottom, to avoid large gaps in the plot. Note that a logarithmic intensity scale has been used to show the relatively weak vibrational (IR) spectrum (seen for the wavenumber cm-1 region of the top-panel plots) compared to the rotational and electronic spectrum. This corroborates the elusiveness of this spectrum as noted by previous studies.
To assess the quality of the calculated line list, comparison with previously recorded spectra are made. As no prior line list for CH+ exists, nor an experimental/observational spectrum covering an extensive wavelength range, comparison are made to selected portions of the full spectrum.
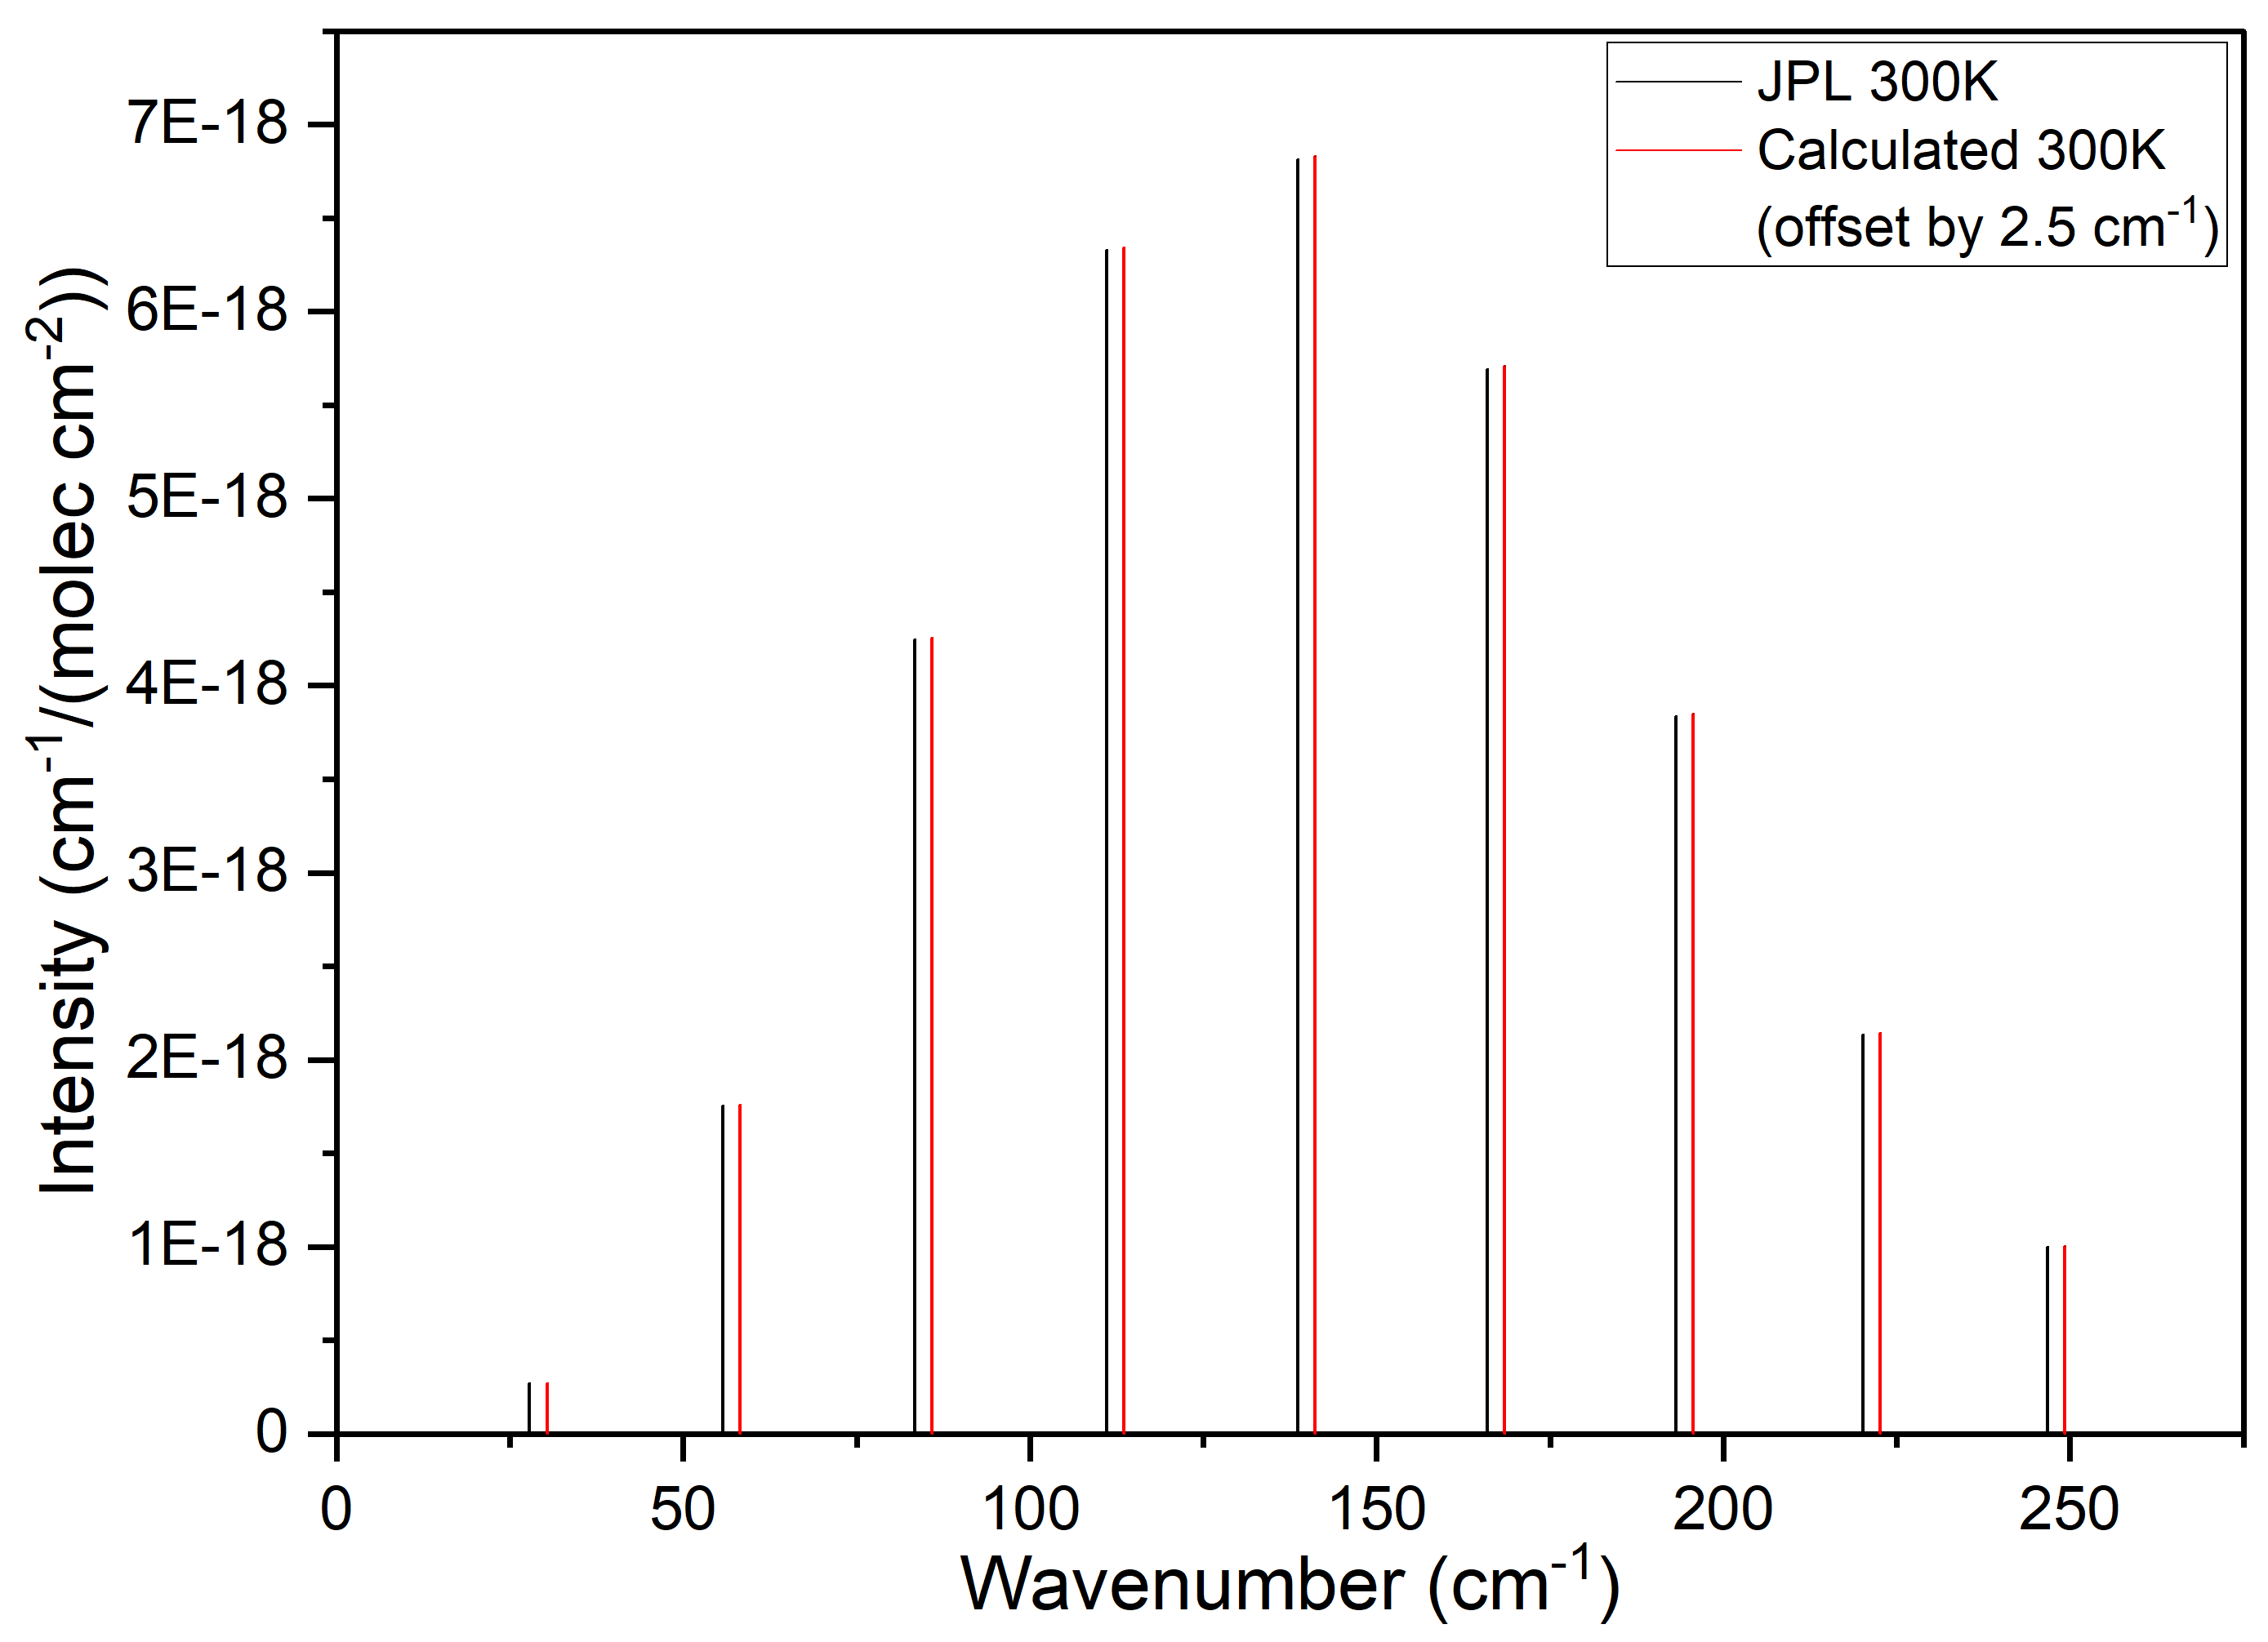
Low-lying pure rotational transitions of CH+ have been previously measured, as seen in Table 1, but no rotational spectra are presented. However, the JPL spectroscopy database (Pickett et al., 1998), who also aim to provide spectroscopic data for molecular transitions, used the first laboratory detection of the CH+ rotational line (Pearson & Drouin, 2006) along with previous electronic A-X band data to generate a predicted rotational spectrum up to . Although, as discussed previously, this laboratory detection was later found to be inaccurate by 0.0019 cm-1, and a wider range of rotational lines have since been detected both in the lab and in space, JPL has not updated their database and the inaccurate data is still presented. Nevertheless, this discrepancy would not be visible on the scale of comparing multiple lines and their intensities should still be accurate, as such the JPL rotational spectrum of CH+ has been compared with the calculations of this study in Fig. 7. The simulated stick spectrum from ExoCross was run at a temperature of 300 K to match that of JPL, and the JPL intensities were converted to standard ExoMol/HITRAN units of cm/molecule for comparison. In Fig. 7, the calculated spectrum of this study has been offset by +2.5 cm-1 to allow for visual comparison, as the wavenumbers agree to a high degree of accuracy. The intensities can also be seen to agree closely.
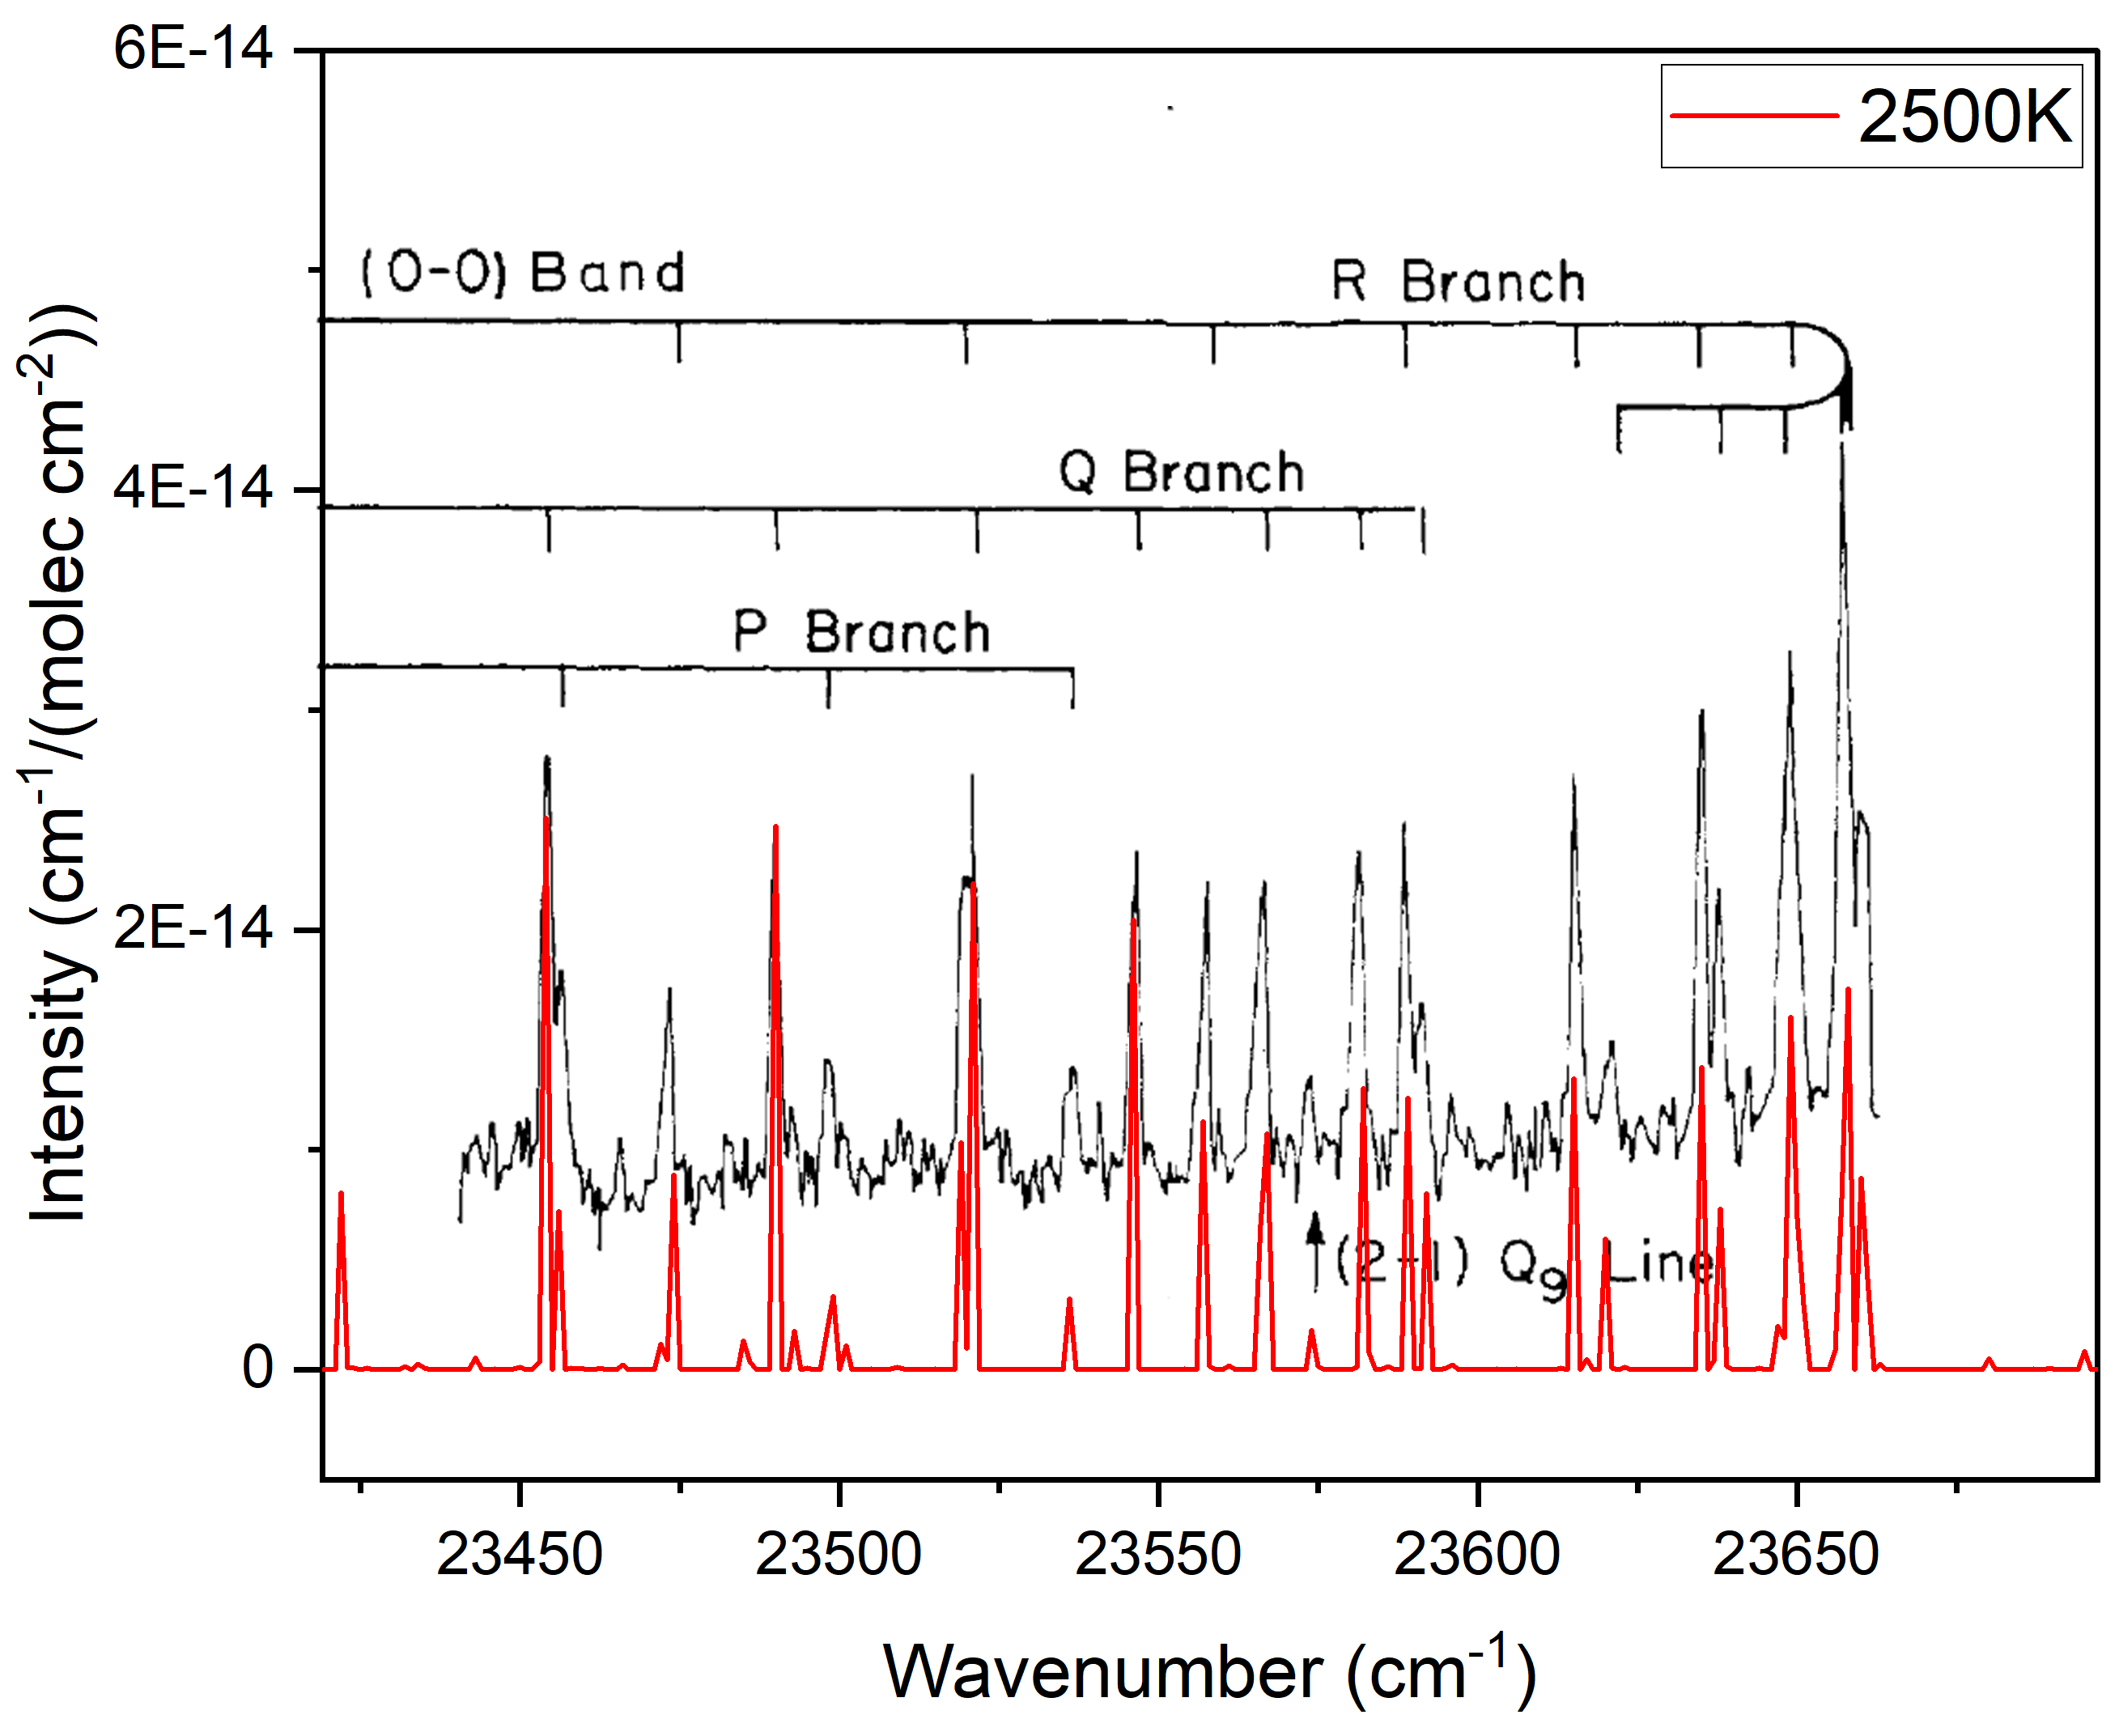
The weak nature of the vibrational (IR) spectrum of CH+ means it has only been detected in one astrophysical object (Neufeld et al., 2021) and one laboratory study (Domenech et al., 2018), of which no presented spectra exist, so visual comparison cannot be made. The A-X electronic spectrum is by far the most studied of CH+ with many experimental studies focusing on the molecule, however, presented spectra are limited. A study by Grieman et al. (1981) used laser-induced fluorescence to probe CH+ emission and presented a portion of the band of the A-X spectrum, a comparison to which, using a simulated emission spectrum, has been shown in Fig. 8. The previous study also gave arbitrary intensity units and is probably not recorded in sample in thermodynamic equilibrium, so the intensity pattern is not expected to match that of this study. As such, a temperature of 2500 K was somewhat arbitrarily chosen for our calculated spectrum based on the high temperature requirement and certain similarities in intensity pattern. On Fig. 8, the intensity units correspond only to the results of this study (red). The spectrum from the previous study had to be offset slightly to match the spectrum of this study which indicates a slight error in their axes, since the transition wavenumbers of the two studies match to a high degree of accuracy.
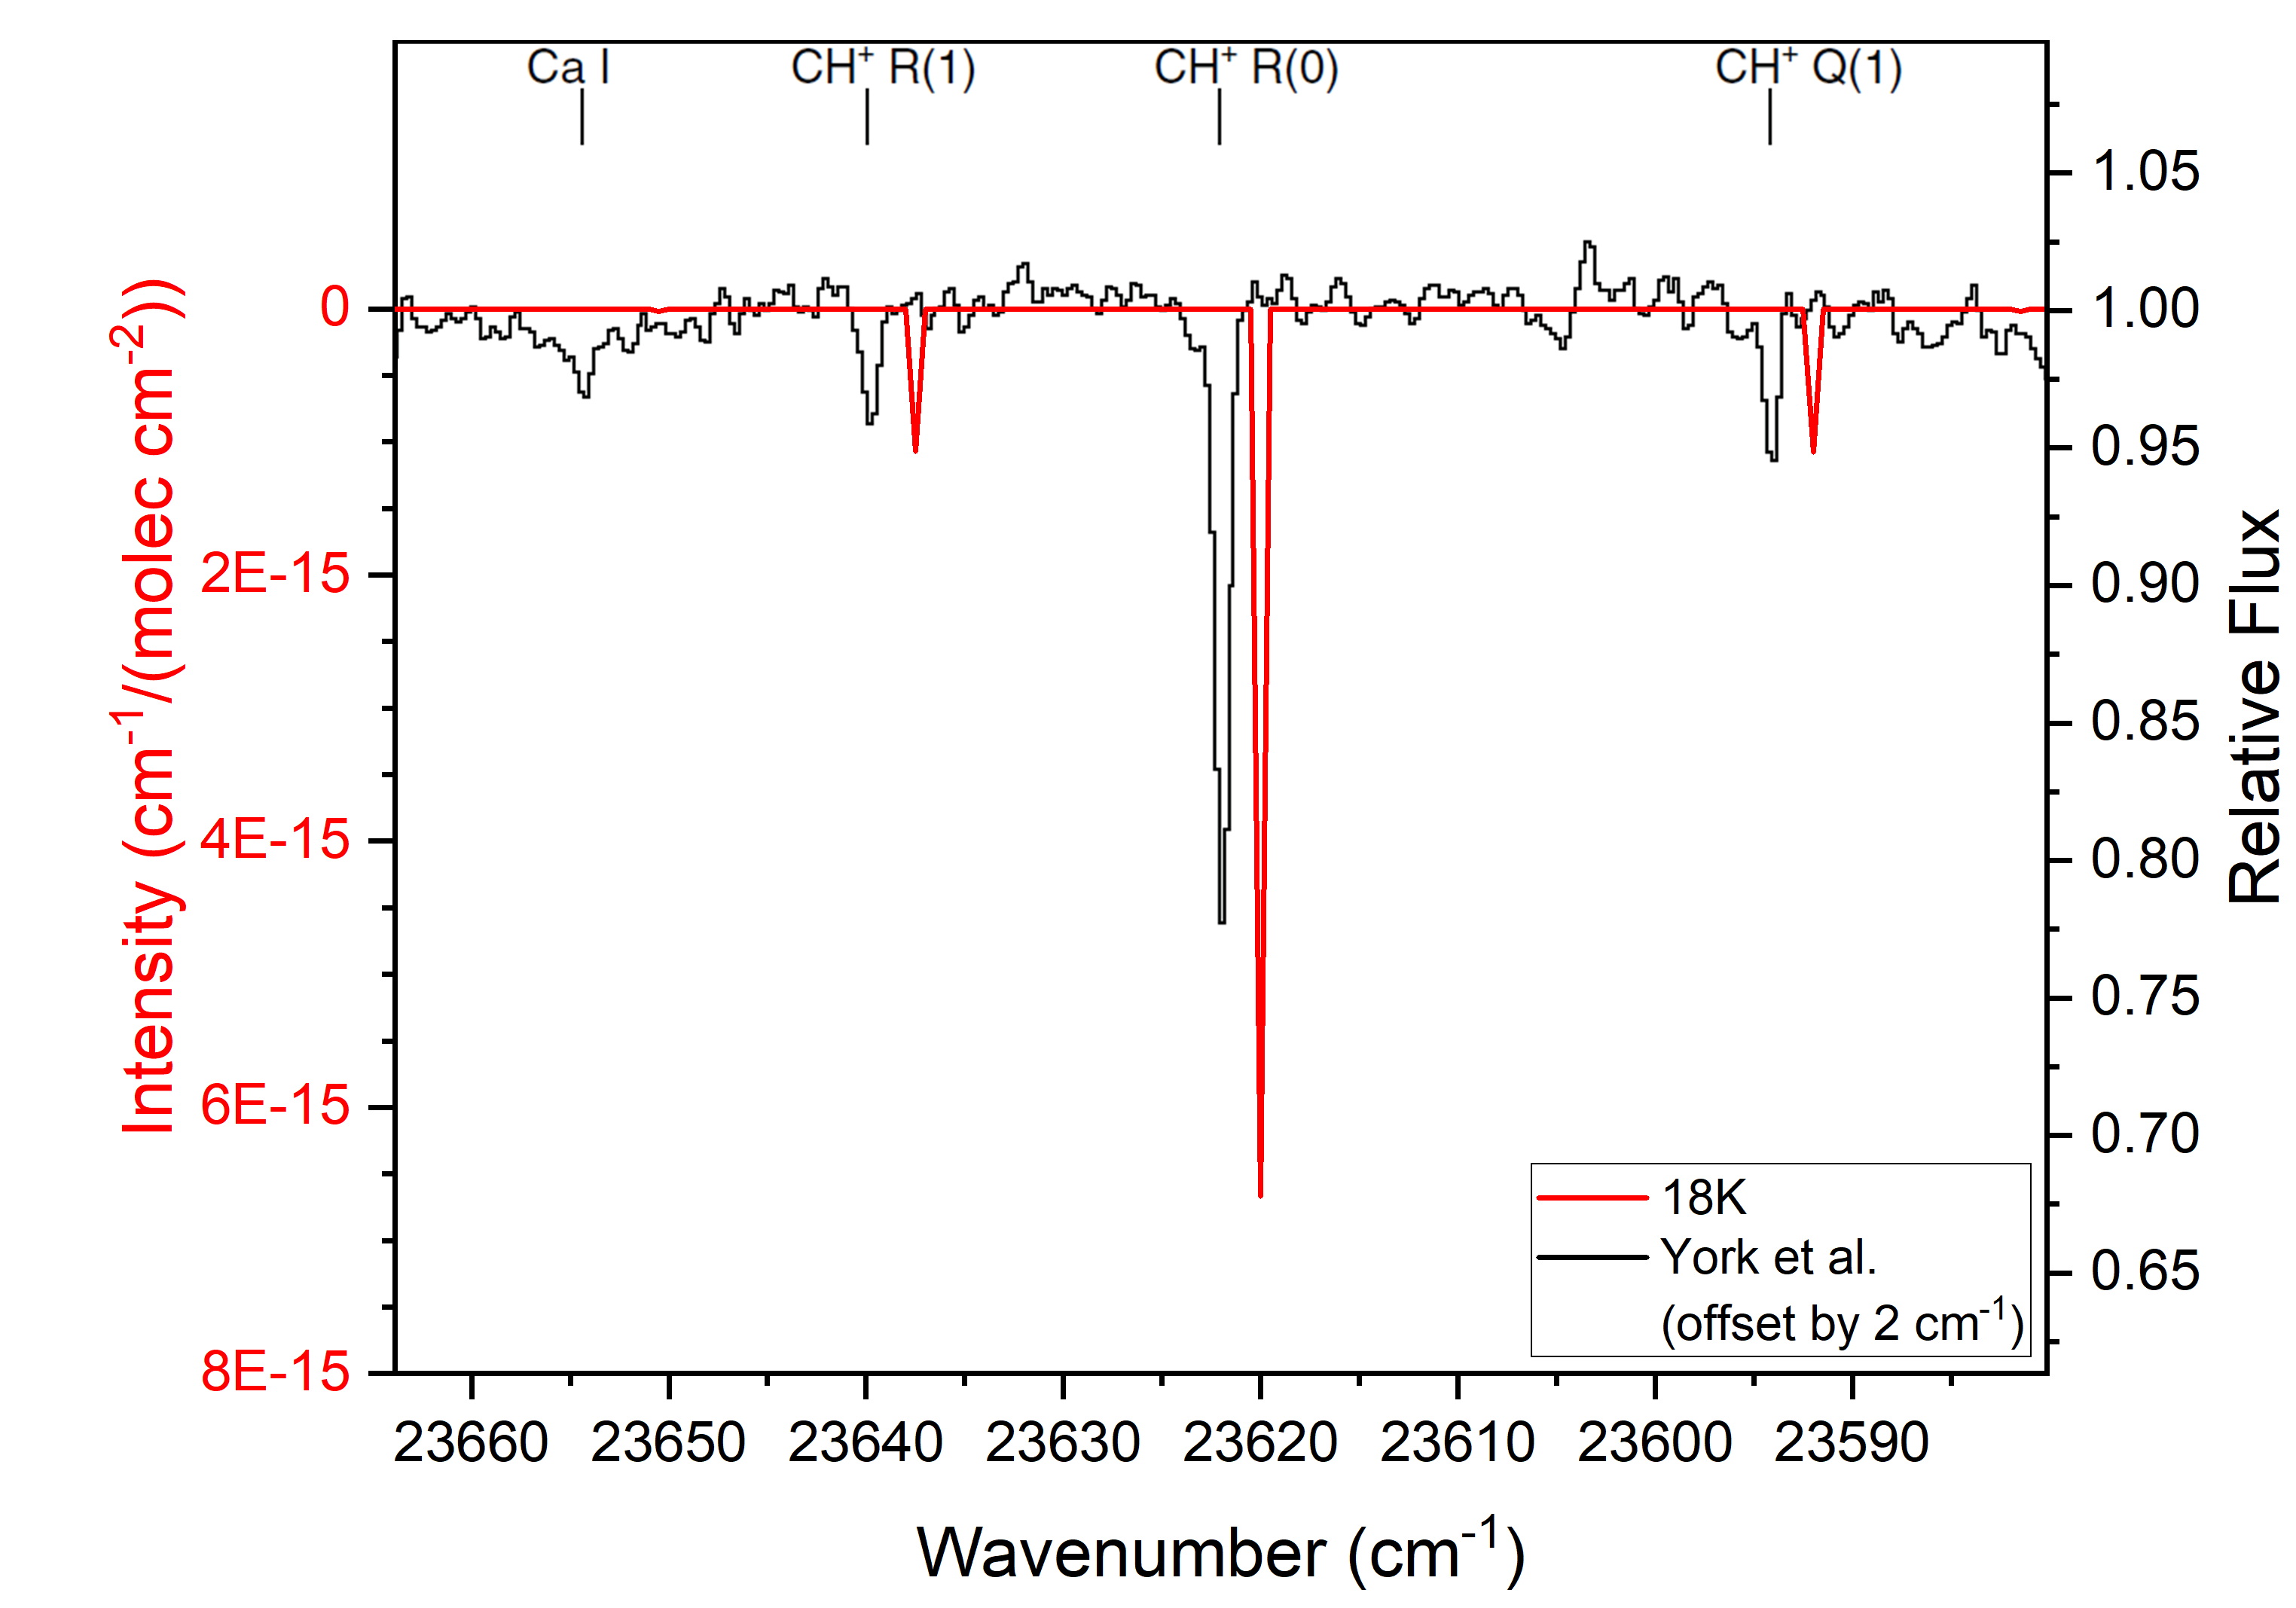
CH+ A-X absorption was seen in diffuse interstellar bands (DIBs) along the line of sight towards star system Herschel 36 and three lines were detected (York et al., 2013), R(0), R(1) and Q(1). A comparison to the spectra of these is shown in Fig. 9. Note that since the study used wavelength units for their spectrum, wavenumber increases right to left. Upon analysis, the DIBs were observed to be blueshifted relative to the calculated lines with an offset of approximately +6.75 cm-1 ( Å, indicating the absorbing object is moving at 85.7 km s-1 towards us). After matching the line positions, an offset of +2 cm-1 (to the left) was applied to the DIB data to allow for visual comparison of the intensities. The red intensity units correspond to calculated data, while the black relative flux units correspond to the DIB study. Since the temperature of the absorption region was not found in the previous study, spectra were simulated at various temperatures using ExoCross to match up the intensity pattern of the observed lines, which would be expected to agree between these two studies. It appears that a temperature of 18 K matches the lines well (by eye) while overestimating the observed line flux. A temperature higher than 18 K results in an intensity decrease from levels but an increase from levels (it is assumed that thermal population of a rotational level is proportional to the intensity of transitions from that level). Thus the intensity of the and lines on the above spectra cannot both match up. This suggests that the region is consistent with a temperature of 18 K, but that the observed line is optically thick, and thus is limited in its intensity.
3.4 Einstein Coefficients
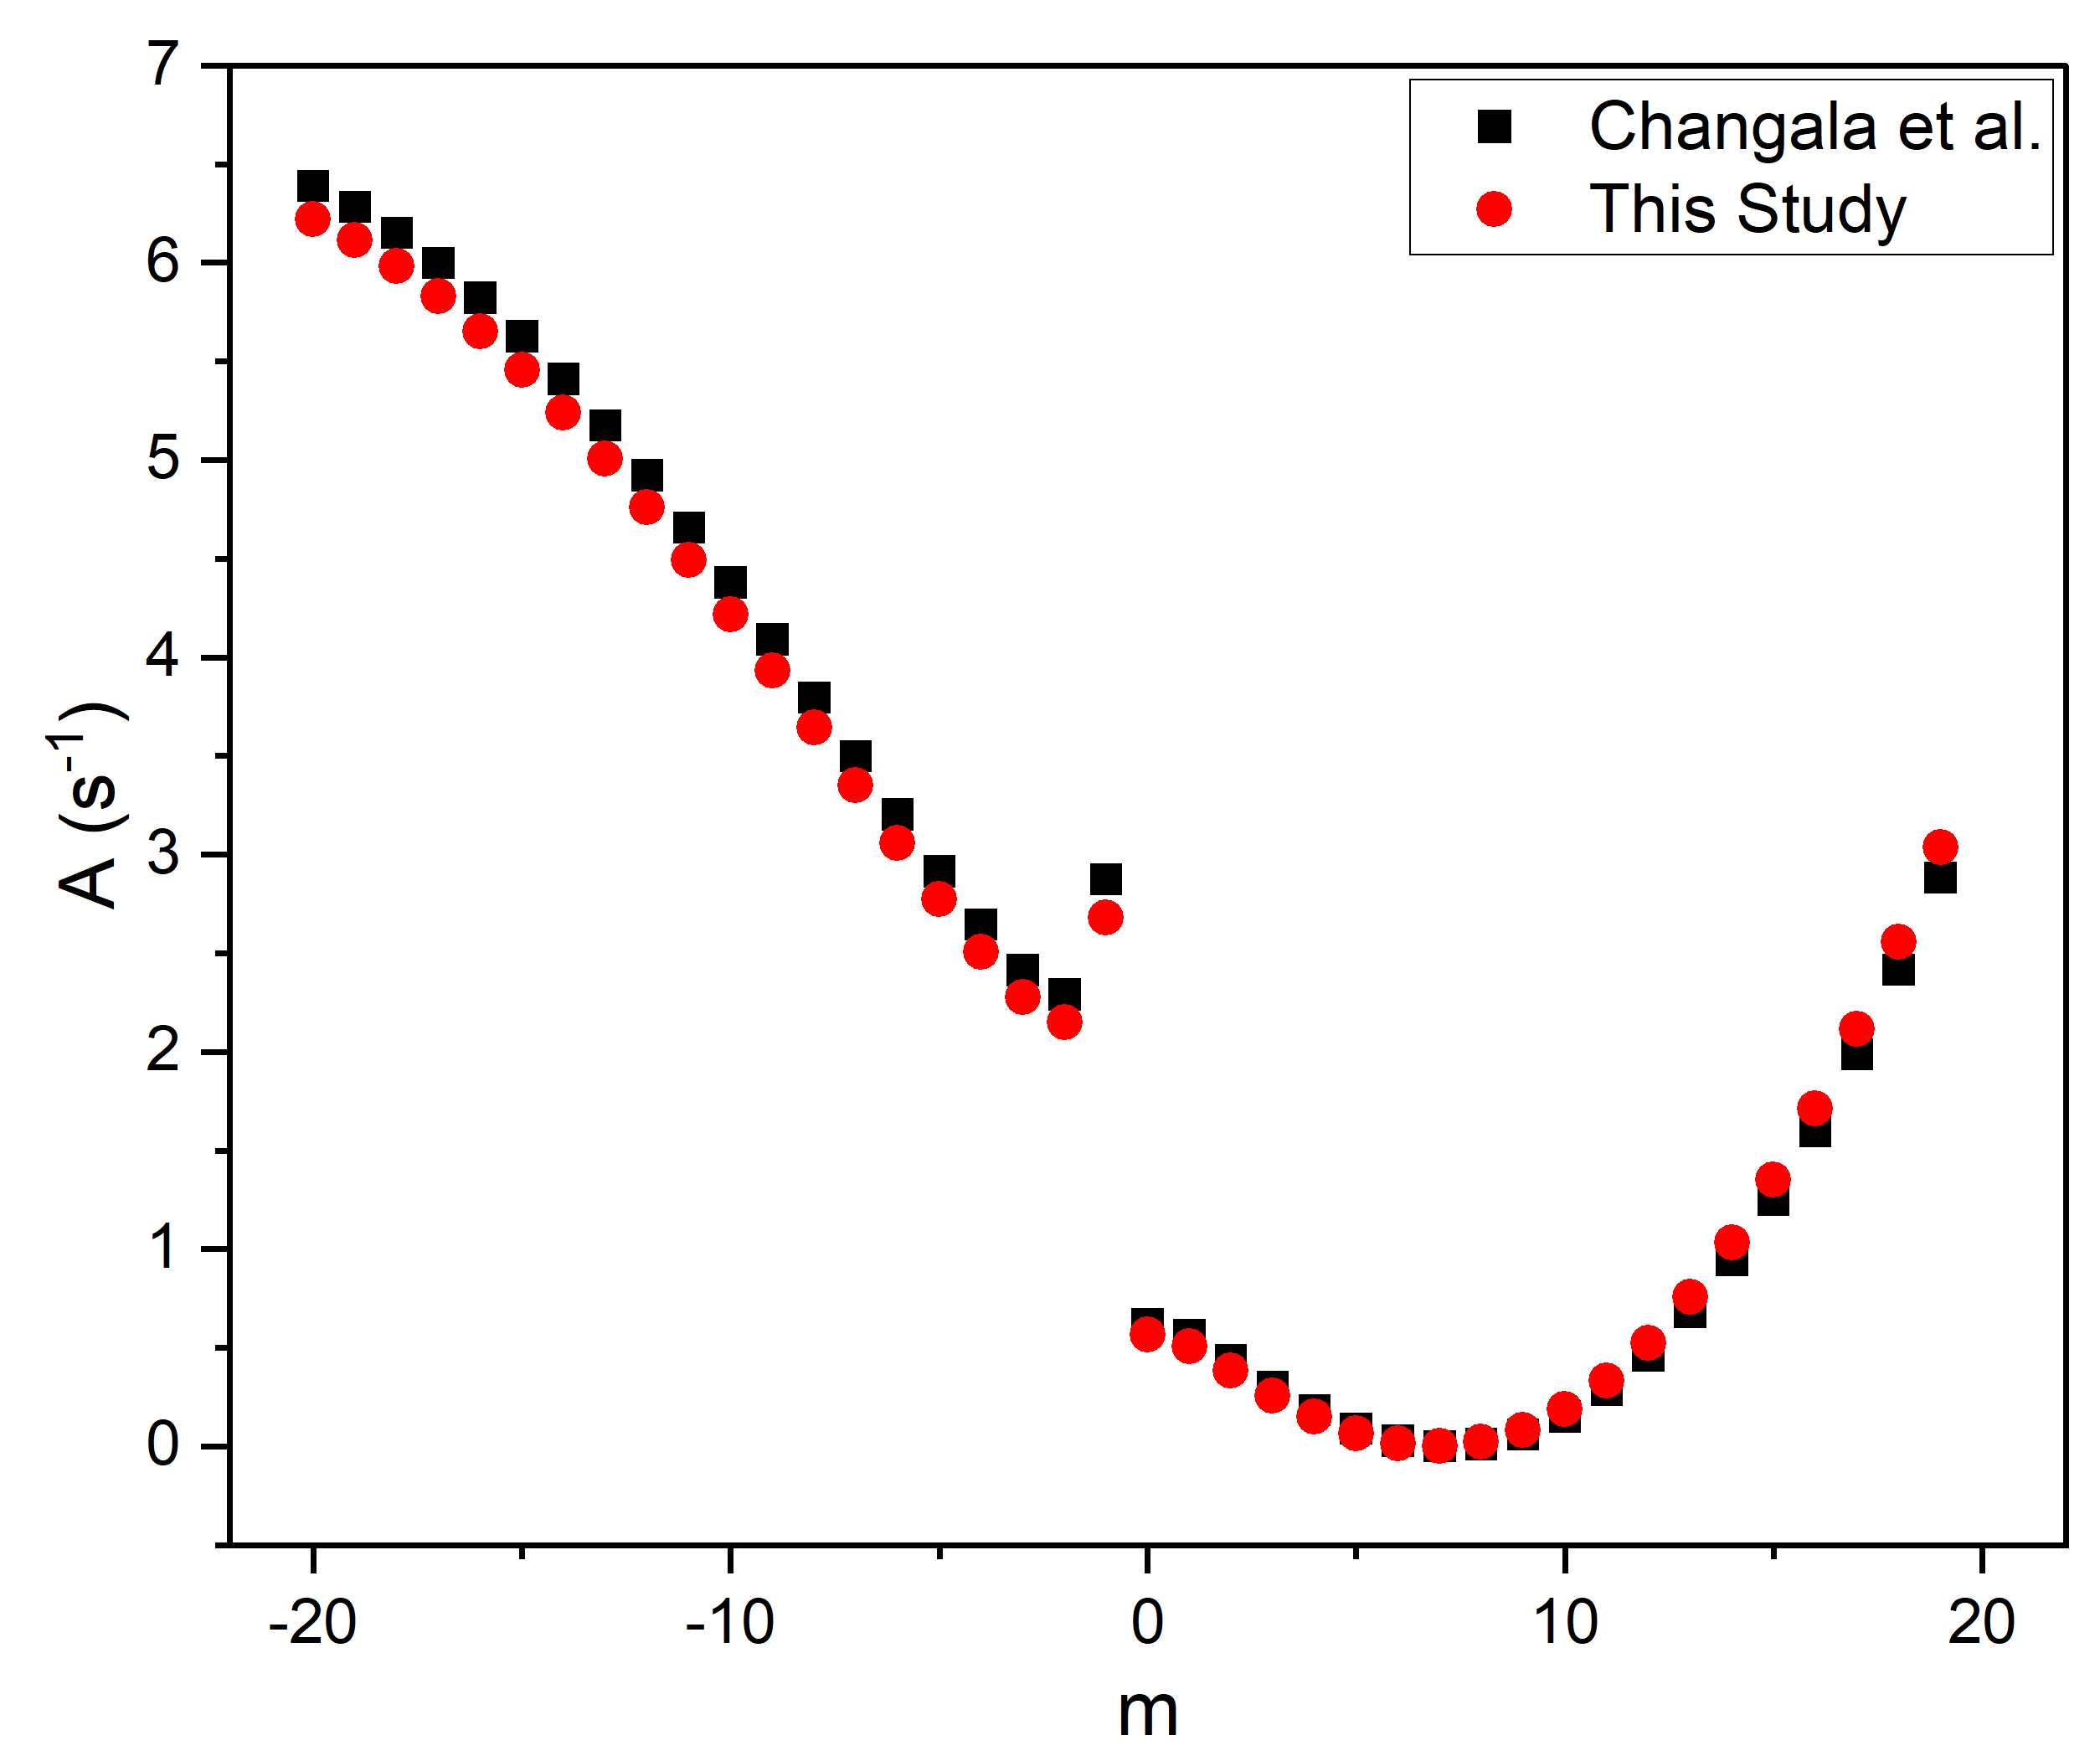
Einstein coefficients can be compared with the work of Changala et al. (2021) who analysed unusual CH+ rovibrational emission patterns in NGC 7027 and gave Einstein coefficients for R- and P- branch transitions in the X-X band in an attempt to explain unexpectedly weak R-branch transitions. The calculated coefficients of this study have been compared with these in Table 5 and Figure 10. For plotting, a parameter has been used, positive values indicate R-branch transitions, and negative ones indicate P-branch transitions, originating from the rotational state . The Einstein coefficients are seen to agree well, which supports the observation of weaker R-branch transitions. Changala et al. (2021) also used PECs from Cho & Le Roy (2016), so the differences in results likely lies with differences in fitting, or the differing dipole moments used. Despite this, since the DMs for these vibrational transitions are so small (hence the weakness of the observed transitions), the level of disagreement between results is unproblematic.
| Transition | Changala et al. | This Study | Transition | Changala et al. | This Study | Transition | Changala et al. | This Study |
|---|---|---|---|---|---|---|---|---|
| R(19) | 2.88283 | 3.03821 | R(5) | 0.09044 | 0.06712 | P(9) | 4.09076 | 3.93378 |
| R(18) | 2.41605 | 2.55795 | R(4) | 0.18326 | 0.14975 | P(10) | 4.37871 | 4.21857 |
| R(17) | 1.98722 | 2.11561 | R(3) | 0.30131 | 0.25858 | P(11) | 4.65704 | 4.49416 |
| R(16) | 1.59804 | 1.71294 | R(2) | 0.43506 | 0.38462 | P(12) | 4.9231 | 4.75791 |
| R(15) | 1.24991 | 1.35135 | R(1) | 0.56372 | 0.50836 | P(13) | 5.17457 | 5.00751 |
| R(14) | 0.94394 | 1.03198 | R(0) | 0.61818 | 0.56547 | P(14) | 5.40944 | 5.24094 |
| R(13) | 0.68091 | 0.75564 | P(1) | 2.87367 | 2.67911 | P(15) | 5.62596 | 5.45643 |
| R(12) | 0.46122 | 0.52277 | P(2) | 2.28988 | 2.14908 | P(16) | 5.82263 | 5.65251 |
| R(11) | 0.28493 | 0.33346 | P(3) | 2.41302 | 2.27697 | P(17) | 5.99824 | 5.82790 |
| R(10) | 0.15172 | 0.18743 | P(4) | 2.64446 | 2.50664 | P(18) | 6.15178 | 5.98161 |
| R(9) | 0.06085 | 0.08400 | P(5) | 2.91483 | 2.77344 | P(19) | 6.2825 | 6.11286 |
| R(8) | 0.01117 | 0.02207 | P(6) | 3.20295 | 3.05749 | P(20) | 6.38985 | 6.22109 |
| R(7) | 0.00108 | 0.00009 | P(7) | 3.49882 | 3.34926 | |||
| R(6) | 0.02845 | 0.01601 | P(8) | 3.79625 | 3.64282 |
4 Discussion & Conclusions
A rovibronic line list has been calculated for the X and A states of 12CH+ and 13CH+ for the first time; the PYT line lists provide energy levels with uncertainties, transition frequencies and Einstein coefficients. The states, transition and partition function files for the PYT line lists can be downloaded from www.exomol.com or zenodo.
The line list is used to generate absorption and emission spectra, as well as partition functions, which help to visualise the line list and provide a comparison to previous studies. The 12CH+ line list is naturally very accurate for of both states where empirical energy levels are comprehensive. The calculated levels, making up the line list outside the realm of observational data, are more uncertain but our analysis shows that the calculations reproduce experimental line frequencies well (to cm-1) up to at least for X and A states. Residuals in A states are expectedly larger than their counterparts since their energies were calculated with an approximate treatment of -doubling. These show still accuracies to at least cm-1 for ; however, the lack of observational data for means these data should be treated with more caution. In general, agreement is better in the lower energy X , as expected, and in both states residuals increase with greater and exhibit an apparent dependence at high . Such levels are high in energy (for example the lowest A level is over 23 600 cm-1 above that of X ) meaning that the discrepancy is likely due, in part, to interaction with more highly excited electronic states that has not been considered here, such as spin-orbit coupling, which becomes increasingly important at higher energies and may perturb energy levels. Note that, where residuals are relatively large, the MARVEL (obs.) data is also more uncertain, since these high-energy levels are typically determined by just one observed transition (usually multiple are available) yielding uncertainties of the order cm-1 for the few empirical levels in both X and A states.
The PYT line lists for 12C1H+ and 13C1H+ comprehensively characterises well above and beyond the domain of previous observation. Identification of future avenues of research, dependent on later observation, have also been presented. The accuracy and completeness of the line list open up its potential application to future high-resolution studies and any hot observations of CH+, as well as the investigation of a range of astronomical environments, including the complex chemistry of interstellar clouds.
Acknowledgments
This work was supported by the European Research Council (ERC) under the European Union’s Horizon 2020 research and innovation programme through Advance Grant number 883830 and the STFC Projects No. ST/M001334/1 and ST/R000476/1. We thank Nike Dattani for providing the copy of LEVEL which we adapted for this study.
Data Availability
The states, transition and partition function files for the 12CH+ and 13CH+ line lists can be downloaded from www.exomol.com and zenodo. Inputs for LEVEL, and the 12CH+ MARVEL energies and transitions files are provided as supplementary data to this article. ExoCross and our adapted version of LEVEL are available at github.org/exomol.
References
- Amano (2010a) Amano T., 2010a, J. Chem. Phys., 133, 244305
- Amano (2010b) Amano T., 2010b, ApJL, 716, L1
- Amano (2015) Amano T., 2015, in Simos T. E., Maroulis G., eds, AIP Conference Proceedings Vol. 1642, Proceedings of the International Conference of Computational Methods in Sciences and Engineering 2010 (ICCMSE-2010). pp 317–320, doi:10.1063/1.4906682
- Amano et al. (2015) Amano T., Pearson J., Drouin B., Yu S., 2015.
- Babb & McLaughlin (2017) Babb J. F., McLaughlin B. M., 2017, MNRAS, 468, 2052
- Barinovs & van Hemert (2004) Barinovs G., van Hemert M. C., 2004, Chem. Phys. Lett., 399, 406
- Barklem & Collet (2016) Barklem P. S., Collet R., 2016, A&A, 588, A96
- Bembenek (1997) Bembenek Z., 1997, J. Mol. Spectrosc., 181, 136
- Bembenek et al. (1987) Bembenek Z., Cisak H., Kepa R., 1987, J. Phys. B: At. Mol. Opt. Phys., 20, 6197
- Biglari et al. (2014) Biglari Z., Shayesteh A., Maghari A., 2014, Computational and Theoretical Chemistry, 1047, 22
- Botterud et al. (1973) Botterud I., Lofthus A., Veseth L., 1973, Physica Scripta, 8, 218
- Carrington & Ramsay (1982) Carrington A., Ramsay D. A., 1982, Physica Scripta, 25, 272
- Carrington & Softley (1986) Carrington A., Softley T. P., 1986, Chem. Phys., 106, 315
- Cernicharo et al. (1997) Cernicharo J., Liu X. W., GonzalezAlfonso E., Cox P., Barlow M. J., Lim T., Swinyard B. M., 1997, ApJ, 483, L65
- Chakrabarti et al. (2017) Chakrabarti K., Dora A., Ghosh R., Choudhury B. S., Tennyson J., 2017, J. Phys. B: At. Mol. Opt. Phys., 50, 175202
- Changala et al. (2021) Changala P. B., Neufeld D. A., Godard B., 2021, ApJ, 917, 16
- Cho & Le Roy (2016) Cho Y.-S., Le Roy R. J., 2016, J. Chem. Phys., 144, 024311
- Cosby et al. (1980) Cosby P. C., Helm H., Moseley J. T., 1980, ApJ, 235, 52
- Crane et al. (1995) Crane P., Lambert D. L., Sheffer Y., 1995, ApJS, 99, 107
- Crawford (1989) Crawford I. A., 1989, MNRAS, 241, 575
- Dalgarno (1976) Dalgarno A., 1976, in Burke P. G., Moiseiwitsch B. L., eds, , Atomic Processes and Application. Elsevier, pp 109–132, doi:10.1016/B978-0-7204-0444-9.50010-7
- Domenech et al. (2018) Domenech J. L., Jusko P., Schlemmer S., Asvany O., 2018, ApJ, 857, 61
- Douglas & Herzberg (1942) Douglas A., Herzberg G., 1942, Can. J. Phys., 20, 71
- Douglas & Morton (1960) Douglas A. E., Morton J. R., 1960, ApJ, 131, 1
- Dubois & Lefebvre (2004) Dubois I., Lefebvre P. H., 2004, Mol. Phys., 102, 23
- Dunham (1937) Dunham T., 1937, PASP, 49, 26
- Falgarone et al. (2010) Falgarone E., et al., 2010, A&A, 521, L15
- Falgarone et al. (2017) Falgarone E., et al., 2017, Nature, 548, 430
- Faure et al. (2017) Faure A., et al., 2017, MNRAS, 469, 612
- Furtenbacher et al. (2007) Furtenbacher T., Császár A. G., Tennyson J., 2007, J. Mol. Spectrosc., 245, 115
- Gamache et al. (2017) Gamache R. R., et al., 2017, J. Quant. Spectrosc. Radiat. Transf., 203, 70
- Gao et al. (2017) Gao Y., Wu T., Wan M., 2017, Computational and Theoretical Chemistry, 1117, 276
- Godard et al. (2023) Godard B., Pineau des Forêts G., Hennebelle P., Bellomi E., Valdivia V., 2023, A&A, 669, A74
- Gredel (1997) Gredel R., 1997, A&A, 320, 929
- Gredel et al. (1993) Gredel R., Van Dishoeck E. F., Black J. H., 1993, A&A, 269, 477
- Grieman et al. (1981) Grieman F. J., Mahan B. H., O’Keefe A., Winn J. S., 1981, Faraday Discussions, 71, 191
- Hakalla et al. (2006) Hakalla R., Kȩpa R., Szajna W., Zachwieja M., 2006, Eur. Phys. J. D, 38, 481
- Hakalla et al. (2007) Hakalla R., Kepa R., Szajna W., Zachwieja M., 2007, Acta Physica Polonica A, 111, 821
- Hansson & Watson (2005) Hansson A., Watson J. K. G., 2005, J. Mol. Spectrosc., 233, 169
- Hechtfischer et al. (2002) Hechtfischer U., Williams C., Lange M., Linkemann J., Schwalm D., Wester R., Wolf A., Zajfman D., 2002, J. Chem. Phys., 117, 8754
- Hechtfischer et al. (2007) Hechtfischer U., Rostas J., Lange M., Linkemann J., Schwalm D., Wester R., Wolf A., Zajfman D., 2007, J. Chem. Phys., 127, 204304
- Helm et al. (1982) Helm H., Cosby P. C., Graff M. M., Moseley J. T., 1982, Phys. Rev. A, 25, 304
- Hobbs et al. (2004) Hobbs L. M., Thorburn J. A., Oka T., Barentine J., Snow T. P., York D. G., 2004, ApJ, 615, 947
- Kanzler et al. (1991) Kanzler A. W., Sun H. S., Freed K. F., 1991, Int. J. Quantum Chem., 39, 269
- Kowalski & Piecuch (2001) Kowalski K., Piecuch P., 2001, Chem. Phys. Lett., 347, 237
- Krelowski et al. (2020) Krelowski J., Galazutdinov G. A., Bondar A., 2020, Astronomische Nachrichten, 341, 56
- Le Roy (2017) Le Roy R. J., 2017, J. Quant. Spectrosc. Radiat. Transf., 186, 167
- Mbiba Touedebe et al. (2023) Mbiba Touedebe C., Nkem C., Owono Owono L. C., 2023, Mol. Phys., 121, e2151946
- Mueller (2010) Mueller H. S. P., 2010, A&A, 514, L6
- Muller et al. (2017) Muller S., et al., 2017, A&A, 606, A109
- Naylor et al. (2010) Naylor D. A., et al., 2010, A&A, 518, L117
- Neufeld et al. (2021) Neufeld D. A., Godard B., Changala P. B., Faure A., Geballe T. R., Guesten R., Menten K. M., Wiesemeyer H., 2021, ApJ, 917, 15
- Pearson & Drouin (2006) Pearson J. C., Drouin B. J., 2006, ApJ, 647, L83
- Pickett et al. (1998) Pickett H. M., Poynter R. L., Cohen E. A., Delitsky M. L., Pearson J. C., Müller H. S. P., 1998, J. Quant. Spectrosc. Radiat. Transf., 60, 883
- Rangwala et al. (2011) Rangwala N., et al., 2011, ApJ, 743, 94
- Ritchey et al. (2015) Ritchey A. M., Welty D. E., Dahlstrom J. A., York D. G., 2015, ApJ, 799, 197
- Sarre et al. (1986) Sarre P. J., Walmsley J. M., Whitham C. J., 1986, J. Chem. Soc. Faraday Trans. II, 82, 1243
- Sarre et al. (1989) Sarre P. J., Whitham C. J., Graff M. M., 1989, J. Chem. Phys., 90, 6061
- Sauer & Spirko (2013) Sauer S. P. A., Spirko V., 2013, J. Chem. Phys., 138, 024315
- Saxon et al. (1980) Saxon R. P., Kirby K., Liu B., 1980, J. Chem. Phys., 73, 1873
- Tennyson & Yurchenko (2012) Tennyson J., Yurchenko S. N., 2012, MNRAS, 425, 21
- Tennyson et al. (2013) Tennyson J., Hill C., Yurchenko S. N., 2013, in 6th international conference on atomic and molecular data and their applications ICAMDATA-2012. AIP, New York, pp 186–195, doi:10.1063/1.4815853
- Thi et al. (2011) Thi W. F., et al., 2011, A&A, 530, L2
- Valdivia et al. (2017) Valdivia V., Godard B., Hennebelle P., Gerin M., Lesaffre P., Le Bourlot J., 2017, A&A, 600, A114
- Vidal-García et al. (2022) Vidal-García A., et al., 2022, in EPJ Web of Conferences.
- Wesson et al. (2010) Wesson R., et al., 2010, A&A, 518, L144
- York et al. (2013) York D. G., et al., 2013, Proc. International Astronomical Union, 9, 89
- Yu et al. (2018) Yu S., Drouin B. J., Pearson J. C., Amano T., 2018, J. Mol. Spectrosc., 350, 30
- Yurchenko et al. (2018) Yurchenko S. N., Al-Refaie A. F., Tennyson J., 2018, A&A, 614, A131