The Still Secret Ballot:
The Limited Privacy Cost of Transparent Election Results††thanks: For valuable comments and suggestions, we thank participants at the 2023 MPSA panel, participants at the 2023 ESRA panel on Improving Election Administration, members of the Stanford Democracy and Polarization Lab, members of the North Carolina Board of Elections, and in particular Samuel Baltz, Harvie Branscomb, Georgie Evans, Scott Jarrett, Christopher T. Kenny, John McCarthy, Yimeng Li, and Benny White.
This research was deemed not human subjects research by the IRBs at Yale University and the University of California Los Angeles.
)
Abstract
After an election, should election officials release an electronic record of each ballot? The release of such cast vote records could bolster the legitimacy of the certified result. But it may also facilitate vote revelation, where an analyst unravels the secret ballot by uniquely linking vote choices on the anonymous ballot to the voter’s name and address in the public voter file. We provide the first empirical study of the extent of vote revelation under several possible election-reporting regimes, ranging from precinct-level results to the individual ballot records known as cast vote records. Using Maricopa County, Arizona, as a case study, we find that cast vote records could reveal less than 0.2% of any voters’ choices in the 2020 general election. Perhaps counterintuitively, releasing cast vote records coded by precinct and vote method are no more revelatory than releasing aggregate vote tallies for each precinct and vote method. We conclude that cast vote records are sufficiently privacy-protecting, and suggest how the privacy violations that do remain could be reduced.
Introduction
Democracies face a difficult tradeoff balancing transparency and privacy in election reporting. After holding an election, election officials must report results at a level of granularity sufficient to bolster the legitimacy of the vote count while avoiding revealing individual vote choices. Where to strike this balance is an increasingly pressing question: A growing swath of voters do not believe their votes are counted accurately and are seeking “citizen audits” of elections [48, 46, 9].
U.S. jurisdictions vary in how they report election results. North Carolina offers an illuminating example of the transparency-privacy tradeoff. The State Board of Elections is obligated to both report granular results by precinct and vote method and protect the state constitutional right to a secret ballot (N.C. Gen. Stat. §163-132.5G). To strike a balance, the board adds or subtracts an undisclosed random number to some reported results. The board is concerned with what we term vote revelation: an analyst uniquely linking anonymous vote choices with a public record of voters’ name and addresses. However, as the board acknowledges, the random noise means that a candidate who appears to have won the most votes in the precinct-by-voting-method election breakdown may not be the one who received the most votes (the actual certified winner).111See https://perma.cc/URR8-Z5YQ, and https://s3.amazonaws.com/dl.ncsbe.gov/ENRS/layout_results_precinct_sort.txt which explains that noising may at times have the appearance “of changing the outcome of very close contests”.
The downside of adding noise to election results is that it makes the data less accurate and possibly misleading [30]. Such privacy-protecting manipulations can also impede the application of election forensics to detect genuine electoral manipulation or malfunction [[, see, e.g.,]]mebane2008election, cantu2014identifying, callen2015institutional, cottrell2018exploration. In short, granular election results are important in order for elections to be accepted as legitimate. At the same time, voter privacy also contributes to the legitimacy of the result. In fact, the secret ballot was adopted to reduce corruption and voter intimidation [35, 39].
This study presents the first empirical estimates of privacy loss under different election reporting regimes, including the public release of anonymous ballots. We use the complete set of individual-level ballot records in Maricopa County, Arizona, as the primary case study. The dataset allows us to compute the extent of potential privacy violations under various reporting regimes, holding the voting behavior constant. Ultimately, we estimate that the public release of so-called cast vote records could reveal about 0.0003% of votes for President in the November 2020 election, among the over 2 million voters we consider. Roughly 0.17% of the same 2 million voters could have their vote revealed in at least one of the roughly 60 contests they voted on the same ballot.
We conclude that the ballot can still be considered secret even if cast vote records are subsequently made public, for two reasons we discuss in detail. First, the fraction of potential votes revealed is small enough that privacy concerns can be addressed through reforms more modest than withholding all cast vote records. Second, the release of cast vote records coded by precinct and vote method is no more revelatory than the current practice of releasing granular aggregate election results. Our argument thus differs from the privacy-centric view put forth in academia and the courts. For example, [2] argued against releasing images of each ballot cast because of possible risks to the secret ballot. Further, the top state court in New York ruled that anonymous individual ballot records were not public record in part because they might reveal vote choices, while the Governor of Arizona recently vetoed a bipartisan bill to release cast vote records for a similar reason. But neither [2] nor the New York court nor the governor of Arizona estimated the extent of vote revelation.
Our study offers three contributions. First, we propose a way for election administration to incorporate concepts from the burgeoning field of privacy. In the last two decades, a movement largely led by computer scientists has shown how ostensibly private datasets can have their privacy undone by data triangulation [1, 49, 21, 55]. But importing the dominant approach in data privacy to the electoral context is not straightforward. Election data has several distinct features compared to the commercial or medical datasets commonly used in these other studies: ballots themselves do not contain personally identifying information, the certified result must provide finality, and anonymity should extend to both election officials as well as the public.
Second, using our theoretical framework, we provide the first empirical assessment of the privacy costs of transparent election results. Although a limited set of academic studies and assessments by expert commissions has already pointed to the potential for vote revelation from releasing cast vote records, those studies do not go on to measure the extent of the problem in an actual election [2, 42, 7], or, if they do, only measure a special case of vote revelation [13]. Our study clarifies that the reporting of election results should only lead to what we term vote revelation when there is a unanimous result in a reporting unit (for example, in a precinct of 10 voters, all 10 of them vote for the Republican candidate). Further, it shows how the release of cast vote records is no more revelatory than the release of election results aggregated by the partially identifying information (what we call quasi-identifiers) available in cast vote records.
Third, and finally, the extent of revelation is directly relevant to recent and pending litigation about whether cast vote records should be public record for transparency or kept confidential because of privacy. The extent of revelation is also relevant to policy decisions about how to best strike the difficult balance between transparency and privacy in election reporting. Our estimate that less than 3,500 out of over 2 million Maricopa County voters could have any of their votes revealed helps inform whether a particular response— ranging from not releasing any ballots to aggregating, suppressing, or adding random noise to results—is proportionate to the potential privacy loss.
Vote Revelation
The idea of a secret ballot might appear straightforward at first: Each voter marks a ballot in private, and no one can link the voter’s name to their ballot choice. However, there are a few possible scenarios in which the secrecy of a ballot can be undone. In this section, we sketch out our concept of vote revelation and relate it to the privacy literature, survey the inconsistent responses to requests for cast vote records, and distinguish vote revelation, which we see as the proper definition for secret ballot violations, from other privacy-related concerns.
A Definition of Private Election Results
The secret ballot can be thought of as a data privacy problem, where the information collected in the course of administering an election is a database. The building blocks of an election database include sensitive attributes and nonsensitive attributes. Sensitive attributes include which candidate a voter chose, while nonsensitive attributes include voters’ names, addresses, and turnout record. We treat name, address, and turnout as nonsensitive even though they are personally identifying attributes because who registers and who votes in the United States is generally a matter of public record.
At what level of detail should election officials report election results? Certainly, election officials must announce which candidate won the most votes. Reporting the total votes cast for each candidate constituency-wide is both a universal practice and a requirement in many jurisdictions to determine whether automatic recounts are required. Further, officials typically are mandated to produce aggregate vote tallies for each contest at smaller levels of geography, such as precincts. All of these reporting regimes fall on a spectrum ranging from least granular to most granular. At one extreme, an election official could stop at reporting total vote counts (e.g., Joe Biden won Arizona with 1,672,143 votes, while Donald Trump obtained 1,661,686 votes). At the other extreme, officials could release records of how each individual ballot was marked or even facsimiles of the ballots themselves. Tabulators already produce an electronic file recording the vote choice of individual ballots known as a cast vote record [52, 36, 37], and an image of each ballot referred to as a ballot image. See Appendix Figure A1 for an actual example.
Some election officials have expressed concern that the release of cast vote records could undermine voters’ right to a secret ballot [22]. But they have not defined what exactly ballot secrecy demands and what it would mean to violate it. We define violations of the secret ballot as vote revelations. A vote revelation occurs when a vote choice recorded in a table of election results is linked to an individual record in a table of voters. Our definition of vote revelation derives from the field of privacy studies [[]217]wood2018differential. However, we use the term revelation instead of the term re-identification used in privacy studies because of the unique election context where vote choices are generally anonymous to start.
Our definition of vote revelation captures the core of what the secret ballot sought to protect. Before the introduction of the Australian ballot to the U.S. in the early 20th century, party bosses could monitor vote choices, corrupting the core function of democracies [35]. A strength of our definition is that while it is based on theoretical privacy literature, it is specific enough to serve as a standard for election administration. Our definition excludes other privacy concerns, which we consider at the end of this section.
The Venn diagram in Figure 1A shows the relationship between the sensitive attribute (vote choice) that the secret ballot is supposed to protect, and the nonsensitive attributes that are available in a typical voter file database. Voter files or poll books list each voter’s name and address and, typically, the manner in which they voted (for example, in-person, absentee, or early). In the privacy literature, attempts to reveal the sensitive attribute are called attacks. In the elections context, neither outside actors nor those administering an election should be able to learn an individual’s vote choice. We refer to both outside actors and election administrators as “analysts.”
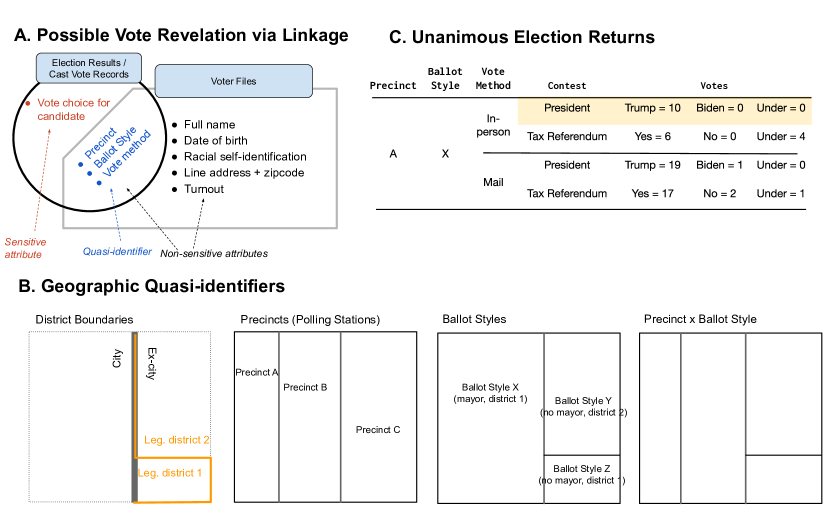
Following the terminology in [38], we also refer to the shared variables in both the vote choice and voter registration datasets as quasi-identifiers. In our context, quasi-identifiers include the voter’s precinct, ballot style, and vote method. Figure 1B illustrates the difference between these three terms in election administration. Precincts (also known as polling stations) are geographic units, and define where voters go to vote in-person. Ballot styles are the unique combinations of contests that a voter is eligible for, and define how each voter’s ballot is printed. The figure depicts an example where a legislative district line veers away from a city boundary, creating three distinct ballot styles. The example illustrates the complicated geography of election administration in the U.S.: sometimes two ballot styles exist in a single precinct (ballot styles Y and Z in precinct C), and sometimes two precincts can share a single ballot style (precincts A and B sharing ballot style X). Together, a voter’s precinct, ballot style, and vote method help identify a voter’s ballot; they are quasi-identifiers because, in general, they do not uniquely identify a voter. Knowing that an anonymous ballot comes from a particular precinct narrows down whose ballot it is, but, it does not necessarily identify it.
This setup mirrors common studies in the privacy literature, where scholars have shown how an analyst might triangulate multiple data sets with overlapping information to gain information that was not intended to be shared. For example, a typical privacy attack might integrate the description of demographic characteristics of an anonymous medical patient with a database of names and demographics to reveal the name of that patient [[, see, e.g.,]]ohm2009broken,sweeney2017re, yoo2018risks. In the election context, the anonymous dataset is either aggregated election results or anonymous ballots.
Figure 1C demonstrates that vote revelations can occur in rare circumstances. Specifically, they occur if all of the voters in a single reporting unit cast votes for the same candidate, and do not undervote or overvote. In this example, an election official reports election results from precinct A in ballot style X. Voters in this small geography voted by one of two methods, in-person and by mail. Voters in the first row who vote in-person would have their votes for President revealed because all voters in the reporting unit voted for the same candidate. We learn the sensitive attribute of each of these ten voters, namely that each of them voted for Donald Trump.
Note that if at least one voter abstains from voting for any candidate in a given contest (“undervotes”), then there cannot be vote revelation, because it would not be possible to identify which voter in the reporting unit had undervoted.222Of course, if all voters undervote, then that would reveal their undervote. That is why the in-person voters in Figure 1C could have their vote for president revealed but cannot have their referendum vote revealed.
This example makes two points clear. First, aggregation in election reporting affects vote revelation: the same vote choice that is revealed through highly granular reporting may not be revealed with coarser reporting. Second, the extent of revelation depends on individual voting behavior. This point is most similar to what is known as -diversity in the privacy literature [38]. In short, a dataset is -diverse if there are at least distinct “well-represented” values of a sensitive value in a block of data with a specific non-sensitive variable such as precinct or ballot style.333This contrasts with the older notion of -anonymity [49], which holds that a dataset is -anonymous if there are at least individuals with the same non-sensitive variable. Even if a dataset is -anonymous, if all voters in a single geography vote unanimously (in other words, with only one value), their sensitive attribute is revealed. See our discussion on probabilistic voting for further discussion of the definition of “well-represented.” [38] calls this a homogeneity attack because it relies on the homogeneity of a sensitive attribute (here, vote choice) within a set individuals who share the same quasi-identifier values.
Datasets that are -diverse are not necessarily immune from vote revelation [[, for an extensive analysis, see]]cohen2022attacks. An additional privacy vulnerability is what scholars call a background attack. Consider the third row in Figure 1C. A total of 19 voters vote for Trump, while 1 votes for Biden. Although an analyst cannot link the Biden vote to a particular voter, the single Biden voter can link each Trump vote to the other voters. In a sense, there are three datasets instead of the two depicted in the figure: the election results, the voter file, and the voter’s knowledge of their own vote. We call this instance-augmented linkage to highlight that this revelation relies on knowing an instance of the sensitive attribute (the identity of the single Biden voter), again drawing from [38].
Finally, the diagram highlights another point about the nature of cast vote records that is important to the reporting decision: in any scenario, cast vote records reveal no more than the most granular level of aggregate reporting for each quasi-identifier.444Our claim is specific to our definition of vote revelation. Our definition of vote revelation does not include so-called negative revelation: the ruling out of choices that a voter may have made. Negative revelation is often found in granular election results where it is not uncommon to find zero votes cast for particular minor-party candidates in a reporting unit ruling out the possibility that anyone known to have voted in that reporting unit support that candidate. To be clear, cast vote records do facilitate more negative revelation than aggregate election results. Consider the same two contests as Figure 1C, the President and a yes/no referendum. Suppose a vote buyer asks one voter to vote [Trump; Yes] and another to vote [Biden; No]. However, if the first voter voted [Trump; No], and the second voted [Biden; Yes], the cast vote records would reveal that both voters had reneged, while aggregate results would not. We thank Samuel Baltz for providing this example. For example, cast vote records that indicate the precinct in which each vote was cast and the method by which each vote was cast reveal no more votes than election results aggregated at the precinct and vote method level. Returning to the example of the ten voters in the first row of Figure 1C, it is possible to identify that a particular individual of the ten voted for Trump. However, even if we had (anonymous) individual ballots of these ten voters, we could not identify whether a particular individual also voted yes on the referendum, because four Trump voters undervoted on the referendum. The main point is that the ballot records would reveal the same information that a tabulation of precinct, ballot style, and vote method would reveal in this example.
Varying Responses to Requests for Cast Vote Records
The recent rise of election skepticism has triggered a barrage of public records requests for cast vote records [37]. These efforts have put individual election officials in a difficult position of deciding whether to release records that may jeopardize the secret ballot. The lack of existing empirical evidence has left administrators and courts with little upon which to base their assessments of the risks that the release of cast vote records pose to the secret ballot. Perhaps for this reason, they have reached varied and contradictory conclusions about whether to release cast vote records.
Some election officials publicly release cast vote records or ballot images. Examples of such jurisdictions include San Francisco County, CA, Pueblo County, CO, Dane County, WI, and Leon County, FL [4]. But many other election officials have denied requests for them. A review of recent news reports reveals that election officials in Indiana, Missouri, and South Carolina have denied requests for cast vote records because of concerns about potential vote revelation [47, 57, 31]. Similarly, the governor of Arizona recently vetoed legislation to disclose cast vote records because disclosure “threatens anonymity” [29]. Indiana has gone further suggesting that the release of cast vote records “would identify each voter and his or her ballot selections.”
State courts have also reached conflicting conclusions about whether the release of cast vote records leads to vote revelation. For example, a Pennsylvania court recently held that the release of a cast vote record “does not violate the guarantee of secrecy in voting” (Honey v. Lycoming County, No. 22-cv-115 (Pa. Commw. Ct. Dec. 15, 2022)). However, the New York Court of Appeals, the highest court in the state, denied the release of similar ballot images, in part because of concerns about vote revelation. The court suggested that “certain political parties (particularly minor parties) have so few members in less populated districts that electronic ballot copies from primary elections may enable [the public] to ascertain the substance of individual voters’ cast votes.” (Kosmider v. Whitney, 132 N.E.3d 592 (N.Y. 2019)). There is also pending litigation in other states. For example, a Missouri county clerk has filed a suit to seek clarification whether cast vote records are public record (Petition for Declaratory Judgement, Schoeller v. Huddleston, No. 2231-CC00975 (Greene County, Mo. Cir. Ct. 2022)).
Decisions to shield election records from public records requests are being made without much evidence on how withholding could enhance privacy. There is no peer-reviewed research on the extent of vote revelation from cast vote records specifically or granular election results more generally. A panel of election administration and cryptography experts assessed the potential for vote revelation in Colorado’s cast vote records [42], but did not estimate the extent of the issue. Further, [13] showed that the release of cast vote records from New York City’s June 2021 primary revealed the votes of several hundred voters. But [13] only considered single-voter precincts, a special case of what we study. Election results can lead to vote revelation in any size reporting unit if the result is unanimous.
In the next section, we introduce data to present the first empirical estimates of vote revelation at various reporting levels, from the precinct level to the individual (anonymous) ballot level.
Not Vote Revelation
Before proceeding, we clarify what is and is not vote revelation. We set aside three related privacy concerns: about probabilistic updates of vote choices; additional quasi-identifiers on ballots such as timestamps; and what we term vote authentication.
Probabilistic Posterior Updates
First, we do not consider a highly predictive estimate of a voter’s choice to be a vote revelation. Suppose for example that in a unit of 100 voters, the election reported 99 votes for the Republican candidate and 1 for the Democratic candidate. Further, suppose that 99 of the 100 people were registered Republican voters and only 1 was a registered Democrat. It is reasonable to predict that the one Democratic vote belongs to the Democratic registrant, thereby appearing to reveal all 100 votes. But, it is not vote revelation by our definition because it remains possible that the one Democratic registrant voted for the Republican and that it was one of the Republican registrants who voted for the Democrat (although it can be an easy case of instance-augmented linkage, as defined above). The sharp distinction is consistent with a view among computer scientists that distinguishes what can be inferred statistically about the members of a class of individuals and what can be known about any one member of the class [55].
Drawing such a stark distinction is not uncontroversial. Some definitions of statistical privacy cast the leakage of private information in Bayesian statistical learning terms, such that a leak that changes the analyst’s posterior belief about an attribute’s value is treated as a successful privacy attack [30, 17, 33]. However, these definitions depend in nuanced ways on the prior information available, which is beyond the scope of our empirical research design.555In these cases it is typical to suppose that the attacker already holds accurate prior knowledge of the joint distribution of the sensitive items (votes) and the quasi-identifiers where the joint distribution is defined over a hyper-population of possible databases. If the information presented in the database does not substantially update the attacker’s beliefs about the values of the sensitive items (vote choices) of any given voter from their prior belief (based on the individual’s quasi-identifier attributes), then it does not leak privacy. For example, a voter’s precinct informs what we can infer about their political preferences. Nearly all election officials already release precinct-level election results because probabilistic posterior updates of vote choice based on learning a voter’s precinct are not understood to violate the secret ballot.
Other Quasi-identifiers
Second, we do not consider the possibility of vote revelation resulting from cast vote records including quasi-identifiers other than precinct, ballot style, and vote method. For example, election officials have voiced concern that including time-stamps on ballot images or cast voter records indicating exactly when each ballot was cast (or in what order the ballots were cast) could be used to reveal votes (See, e.g., Honey v. Lycoming County).666Election officials have also voiced concern about ballots in different languages. However, we are not presently aware of ballot language being recorded in a voter file. In fact, at least one voting system is known to have had such a design flaw which might have permitted vote revelation because it inadvertently disclosed the order in which in-person ballots were cast.777Assuming the order in which individuals voted is observable (or even recorded in a poll book) the ability to sort the ballots in the order in which they were cast is fully revealing of which voters cast which ballot. Similarly, there are also concerns that ballot images might include stray marks or write-in candidate choices that could link a voter with a ballot with certainty (although state election laws often prohibit them from doing so). Although voters are often prohibited from adding identifying marks to their ballot, we find it reasonable that election officials redact those marks that could easily reveal the voter [[]also see Figure A1 for a redacted mark]Colorado2018.
We set aside these additional concerns because the solution to any of them is about election administration, not the reporting of election results. Election officials need not provide a time-stamp of a voter’s interaction with a ballot—it serves no election administration purpose and only serves to endanger the secret ballot. Election officials could thus redact any time-stamp information from cast vote records (or simply not time stamp the records) to prevent vote revelation. In fact, that’s exactly what Maricopa County has done. Further, cast vote records, unlike ballot images, do not include any stray marks. In contrast, if election officials are required to report precinct-level results, they must associate the voter’s precinct with each ballot in order to administer the election. Similarly, information about the ballot style is inherent to each ballot and cannot be redacted.888 The cast vote records produced by some voting systems do not connect vote choices made by voters across a multiple-page ballot. In this case, ballot style may not be entirely revealed by the cast vote records and, thus, ballot style information is not inherent to cast vote records in those cases. In the limit, a cast vote record could report vote choices by contest and not link voter choices across any pair of contests for any voter. Of course, such a cast vote records database would be informationally equivalent to a database that contained only candidate vote totals.
Authentication
An important motivation for the secret ballot is to extinguish the market for votes. A key mechanism to extinguish vote-buying is to make it difficult, if not impossible, for any voter to prove (authenticate) how they voted [7]. In general, a voter simply announcing how they voted does not prove it was so.
Prior work warned that releasing digital images of a ballot could allow voters to authenticate their votes by adding identifiable stray marks [2]. That concern is also reflected in laws such as Minnesota’s requirement that a ballot not be intentionally marked with “distinguishing characteristics” that render it identifiable (Minn. Stat. §204C.22(13) (2022)). It has been historically known that simply making the voting process does not necessarily extinguish voter intimidation either [39]. More recent work focuses on how releasing cast vote records in ranked-choice elections could similarly allow each voter to use their complete ranking ordering of the candidates as a verifiable public signal that would nearly always be unique to them [54].
We see vote revelation as a more pressing concern than vote authentication in protecting ballot secrecy. For one, vote-buying and vote-selling already violates federal law [26]. Further, vote authentication is often permissible as protected First Amendment speech, at least in some jurisdictions (See, e.g., Rideout v. Gardner, 838 F.3d 65 (1st Cir. 2016)). Many states permit voters to share a picture of their marked ballot, known as a “ballot-selfie” [[]but see N.C. Gen. Stat. §163-166.3 that bans any photograph with a voted ballot in North Carolina]ncslselfies. Similarly, there is little way to prevent a voter from filling out an absentee ballot in the presence of an observer.
Data and Case Selection
We use Maricopa County, Arizona, as a case study to quantify the extent of vote revelation in the reporting of election results.
Case Selection
Following the 2020 presidential election, Maricopa County became the most prominent site in the battle over public access to ballots, and perhaps over the legitimacy of U.S. elections. The county is a useful case study for several reasons beyond its prominence: it is closely divided by partisanship, features a range of geographies from urban, suburban, and rural, and has a particularly long ballot. The county is also large: it has more voters than 26 states.
Crucially, Maricopa County’s cast vote records include the quasi-identifiers and vote choice information to allow us to reconstruct election results at any common level of aggregation. For each contest on each ballot, Maricopa County’s cast vote records provide vote choice, including undervotes or overvotes, vote method (in-person, early, provisional), precinct, and ballot style. These are the set of quasi-identifiers we consider in this study.999Since 2021, Maricopa has redacted the date stamp fields from their cast vote record.
Data Processing
| Quantiles and mean of voters in unit | ||||||
| Reporting Unit | Unique unit | 1% | 5% | 10% | 50% | Mean |
| Precinct | 743 | 33 | 602 | 1,090 | 2,600 | |
Ballot Style & 381 1 7 41 1,897 5,484.4 Precinct Ballot Style 1,741 1 3 5 221 1,200.2 Precinct Vote Method 2,195 1 3 5 208 952.0 Ballot Style Vote Method 4,397 1 1 1 11 475.2 … only mail method 1,742 1 2 4 257 1,099.6 … only in-person method 1,389 1 1 1 87 120.9 … only provisional method 1,320 1 1 1 3 4.7 Cast vote record 2,089,563
Table 3.2 summarizes our collection of cast vote records for the November 2020 general election. The bottom row of Table 3.2 shows that we can reconstruct all 2,089,563 valid ballots tabulated in the November 2020 election from the cast vote records. The remaining rows detail how cast vote records can be used to reconstruct election results at various reporting levels. For example, the top row shows that Maricopa County used 743 unique precincts for the election. The median precinct included 2,600 voters, while the precinct at the 1st percentile of the distribution contains only 33 voters. The second row shows that there were 381 unique ballot styles (as defined above), with a median size of 1,897 and at least 1 out of 100 out of the ballot styles containing only 1 voter.101010A large contributor to ballot styles with extremely small populations in Arizona is the provision of a federal-only ballot, in which voters without sufficient state IDs are only eligible for the federal offices on the general election. These are treated as a separate ballot style in each precinct. The most granular combination of reporting units is precinct ballot style vote method. With three types of voting methods recorded in the cast vote record data, there are 4,397 such combinations of style-method with at least one vote. The three rows with “…” further subset style-method reporting units by each of the three vote methods. Provisional votes have by far the smallest number of voters in them.
Voter File Data
The possibility of vote revelation hinges on the completeness of the voter file, i.e. the contents obtained from the voter registration database. In general, a voter file stores both personally identifying information (e.g, voters’ names and addresses) and quasi-identifiers (e.g., precinct and vote method). If a voter file is updated after an election to include new voters who previously voted in a different precinct, there cannot be a unique linkage of unanimous election results to voters in the voter file. It is well known in the election administration community that public voter files suffer from such churn, making it difficult for analysts to actually obtain a complete list of voters who participated in a particular election. Nonetheless, we assume that such a complete dataset is available, for two reasons.
First, Maricopa County election officials retain a list that they refer to as the “voted file” that is not affected by voter churn. The voted file only contains all voters that participated in a specific election, as well as the same personal information contained in the voter file. Using the voted file, we can identify a voter’s precinct and ballot style. The voted file includes the same information on the public registration file, including name, line address, precinct, and (coarsened) vote method. This voted file can be requested by anyone in the public through an open records request. Appendix A.2 provides more detail on our comparison between this voted file and a commercial voter file.
Second, even if such a voted file is unavailable to the public, the state has access to the voted file. To be truly secret, the ballot must be protected from revelation by both the state and the public. Some specific subtleties of the Maricopa County voted file highlight our point well. Maricopa’s Address Confidentiality program removes the records of about 4,000 voters from their public voted file. These voters are typically victims of domestic abuse and stalking who are allowed to shield their addresses from public records [[]also see https://perma.cc/AG7S-ABRH]maricopa2022. Further, Maricopa’s public voted file lumps together in-person votes and provisional votes under the same vote method. However, even though these modifications may limit the extent to which any member of the public could reveal a vote, they do not limit Maricopa County from revealing a voter’s vote because Maricopa County retains a voter’s confidential address and full vote method. Moreover, public poll observers might be able to compile their own database of which voters cast provisional ballots to augment the voted file. As a result, in what follows, we measure the amount of potential revelation that would be possible with a complete list of voters and their quasi-identifiers.
Results
We first calculate potential vote revelation in the November 2020 general election for Maricopa County, consider how potential revelation would differ by contest, and explore whose vote could be revealed. Based on the results in Maricopa, we then offer a simple model that explains the key risks for vote revelation. We next compare revelation in Maricopa County to revelation in large counties in other states and nationwide. Finally, we extend our analysis by considering what we term instance-augmented linkage, in which individuals augment the publicly available list of voters with private information about how they voted themselves.
Magnitude of Potential Revelation
Table 2 presents our main finding, calculating potential vote revelation in the November 2020 general election for seven illustrative offices with the same or similar constituencies. We restrict our analysis to contested contests because there is no concern about voter intimidation or vote buying when there is no choice between candidates or referendum choices.
![[Uncaptioned image]](/html/2308.04100/assets/tables/tbl_revealed_unanimous.png)
For each illustrative contest, we count how many voters could have their vote choice revealed in four types of reporting regimes, from precinct to style-method. The first cell in Table 2 shows that 7 voters could have their vote for President revealed if votes were reported at the precinct level. This is 0.0003% of the 2 million voters who participated in Maricopa County’s election, or less than one-one hundredth of one-tenth of one percent. If the same data were reported at the precinct-method level, as in Maricopa County’s official Canvass, 424 voters (0.02%) could have their vote choice revealed. In the most granular reporting unit we consider, style-method, 2,453 votes, or 0.12% of Maricopa voters, could have their vote choice for President revealed.
The last row of Table 2 considers how many voters could have at least one of their votes revealed out of all the single-winner, contested contests they voted in.111111To formalize our quantities of interest, let be a binary variable for whether an individual voter ’s vote choice is revealed in contest . We initially reported contest-specific revelations, Now, we instead compute , i.e., everyone except voters for whom none of their contests are revealed. These any-revelation results range from 0.009% if reporting at the precinct level (19 voters), and 0.17% if reporting at the most granular style-method level. In other words, at the most granular reporting regime, less than 2 out of every 1,000 Maricopa voters could have their vote choice revealed in at least one of roughly 60 contests they voted on.
The extent of vote revelation is much smaller compared to revelation rates found in other domains. One reason why the revelation rate is small here is because there is limited linkable information in election results compared to the nominally private data in other domains. For example, [3] find that a person’s address, date of birth, gender, and name uniquely identify 98 percent of adults in the Texas voter file. [25] estimates that date of birth, gender, and zipcode can uniquely identify 61 percent of the total US population. However, cast vote records do not have date of birth, gender, or name, and only have aggregate geography rather than precise address. While cast vote records can reveal the sequence of votes rather than the tallies for each contest, this does not contribute to any additional revelation.
Some may object that the difference between large and small degrees of revelation is a distinction without a difference. In this view, if cast vote records could reveal at least one voter’s vote, election officials should withhold all cast vote records. But transparency in election results is also an important value.
Indeed, the North Carolina State Board of Election will not release any cast vote records because of their interpretation of a state law which makes it it a misdemeanor for anyone “who has access to an official voted ballot or record and knowingly discloses … how an individual has voted that ballot.” (N.C. Gen. Stat. §163-165.1(e)). But that argument seems to prove too much: precinct-level election returns may also reveal a non-zero amount of voters’ vote choices, yet North Carolina reports precinct-level results, as does almost every other U.S. jurisdiction.121212The distinction between vote choice revelation and voter revelation is also important. We read this statute as prohibiting the revelation of an entire ballot, whereas the revelations we document in this study is only for a particular contest. We have shown that revealing an entire ballot is much more improbable especially when the ballot has multiple contests, as in Maricopa. Jurisdictions that follow a strict rule to prevent any vote revelation must then also withhold (or, as North Carolina does, noise) their aggregate election results as well. More generally, we consider the extent of vote revelation here small relative to the number of ballots cast. In this sense, North Carolina’s policy response strikes us as disproportionate, choosing one extreme on the scale trading off transparency and privacy.
Revelation by Contest and Geography
The rest of Table 2 compares revelation across offices. Comparing across offices within column, there are fewer potential revealed votes in state, local, and referendum contests than in the national partisan contests for U.S. President and U.S. Senate. For example, if election results were reported at the precinct level, there would be 0 votes revealed in the contest for the mayor of Phoenix, a judicial retention election, and a local funding referendum.
Figure 2 takes the percentage of potential votes revealed at the precinct-method level from Table 2 and groups the offices by national, state, local, and referendum. The figure also includes the same statistics for the 2022 primary election results, which had less than half the turnout as the 2020 general election. We drop 6 contests from the figure because they are contests with a small number of eligible voters to begin with, making the fractions across contests less comparable.131313 For the general election, these contests are for the Gila Bend school district (613 voters, 4 potentially revealed votes), the Palo Verde education district (1145 voters, 12 potentially revealed votes), the Wilson education district (553 voters, 1 potentially revealed vote). For the primary election, these are State Senate district 16 (132 voters, 11 potentially revealed), State House district 10 (158 voters, 2 potentially revealed), and US House district 2 (20 voters, 1 potentially revealed).
Figure 2 shows the the general pattern is that the top of the ticket partisan offices have higher prevalence of potential vote revelation than down ballot offices. The thick bars in the histogram indicate the median of each group. The median judicial retention has a potential revelation rate of 0.000012%, which is three orders of magnitude smaller than the comparable rate for President. As we explain below, the low rates of revelation in judicial elections result from high rates of abstention in those elections.
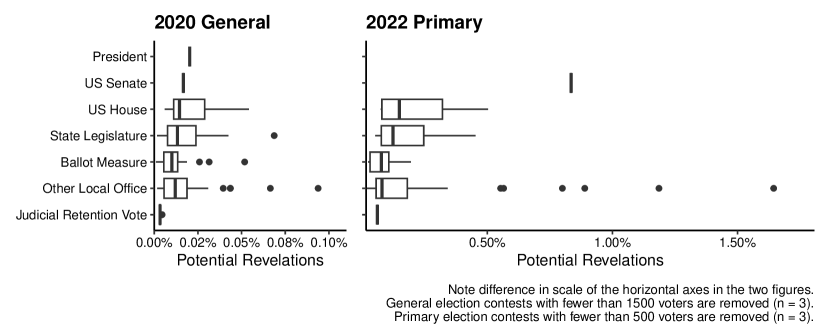
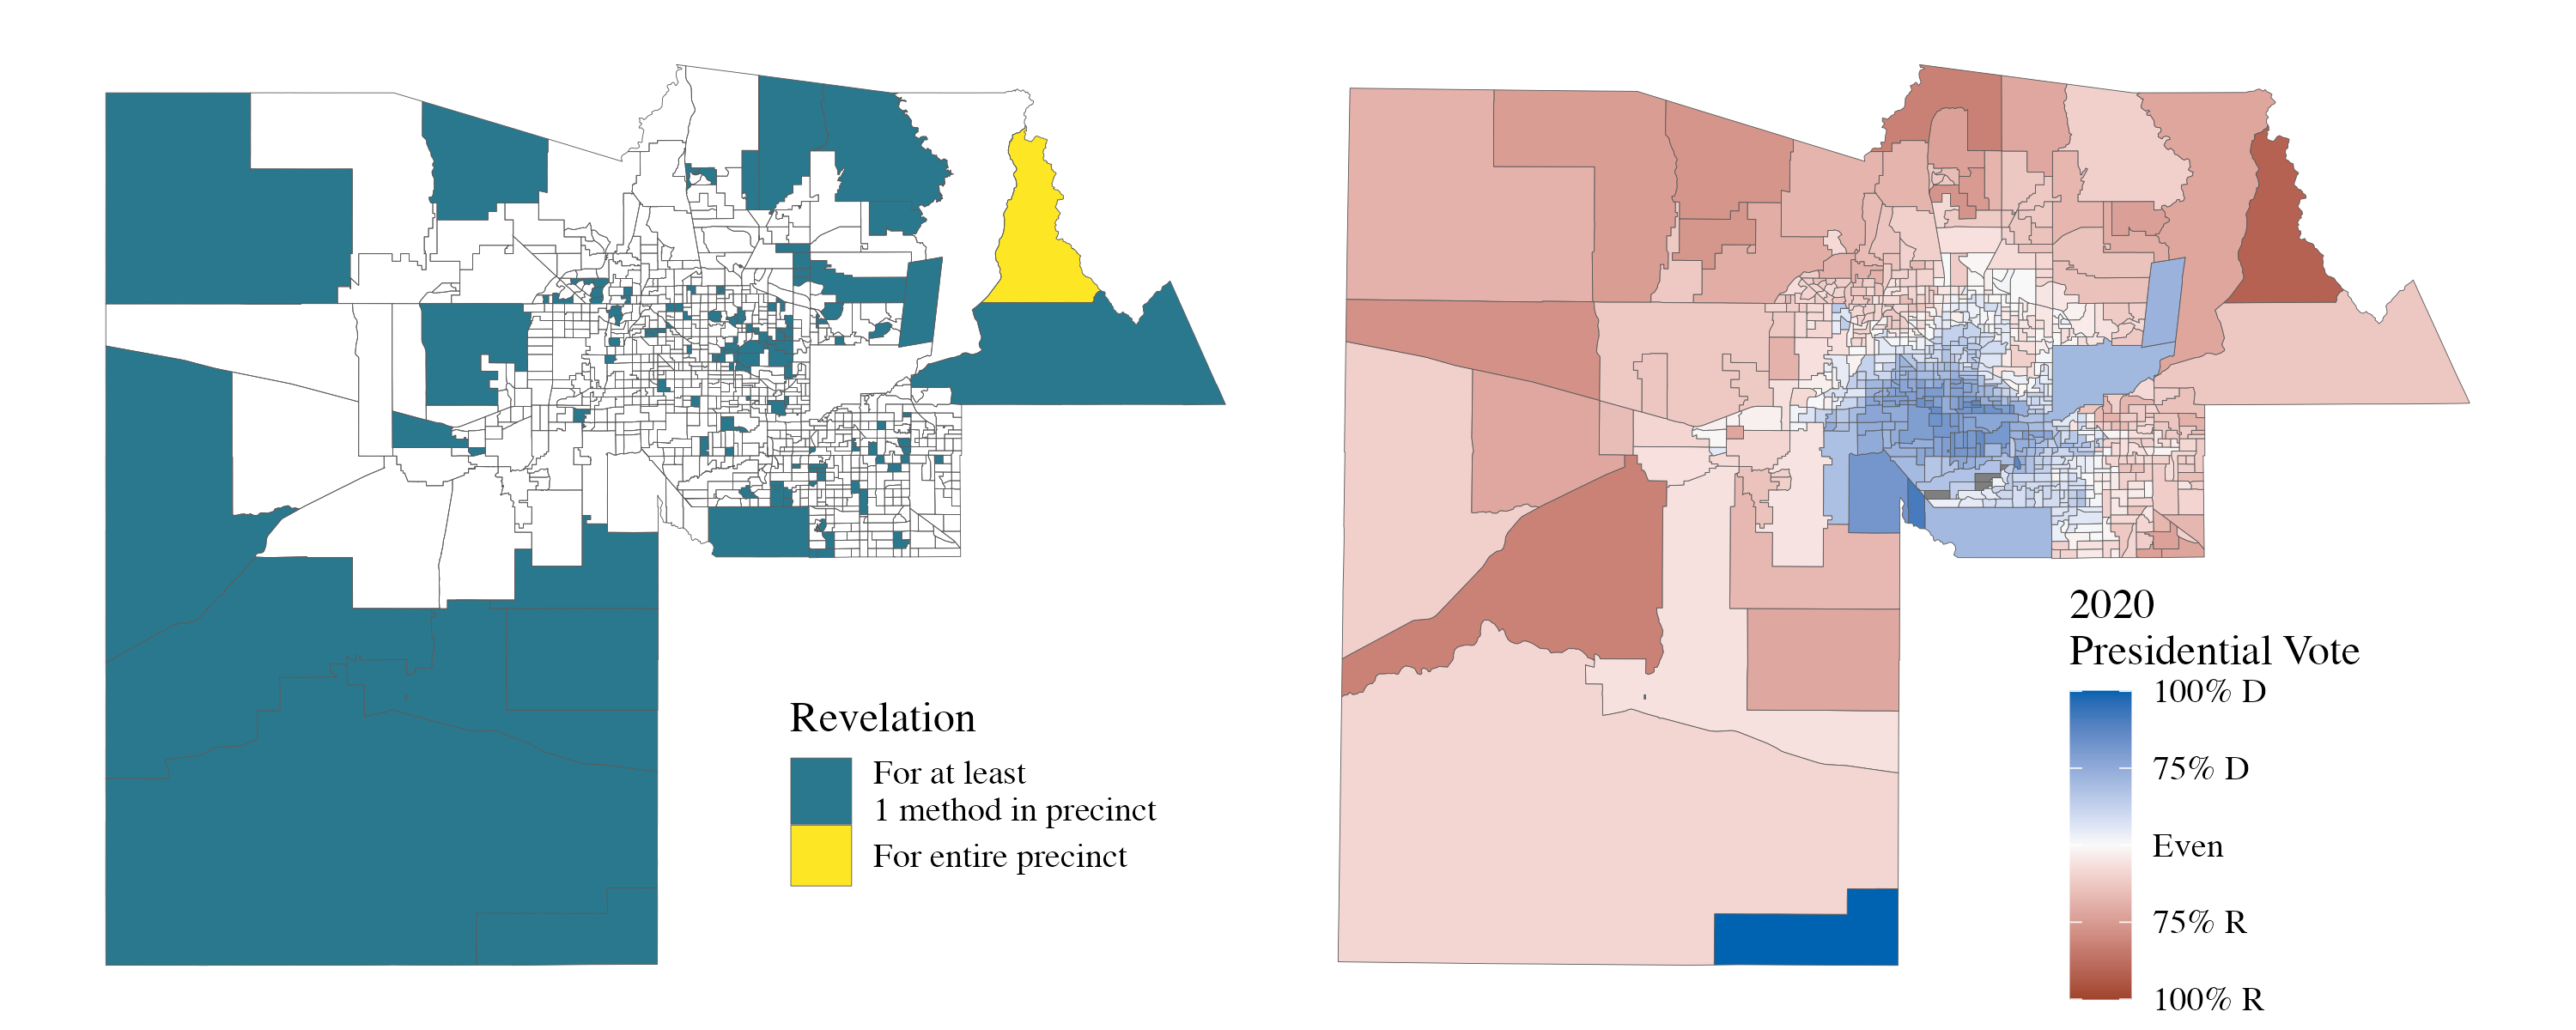
Figure 3 then maps the precincts where vote revelations could occur to convey the types of voters who could be harmed. The left panel colors precincts where revelation could occur for President at the precinct-level (yellow) or the precinct-method level (teal). The right panel colors the entire precinct by the Presidential voteshare in the same election to convey the partisanship of the voters in these precincts. The one precinct where voters could be revealed at the precinct-level is a rural precinct that voted entirely for the Republican candidate. Many of the other precincts where revelation could occur at the precinct-method level are rural precincts in the periphery of the large county. The center of Phoenix, which is largely Democratic in the south and has more partisan balance in the north, features less revelation.
Revelation beyond Maricopa
We next expand our analysis beyond Maricopa County. We compare vote revelation in Maricopa County to vote revelation in all other states at the precinct-level, the most common reporting unit. We then compare vote revelation in Maricopa County to vote revelation in three other large counties that report results more granular than the precinct-level.
Nationwide Revelation
Computing vote revelation requires knowing the number of residual votes (i.e., undervotes or overvotes) in each reporting unit. Unfortunately, election reporting varies state by state. [6] extensively standardized and validated precinct-level data from all states, and find that while all states but Indiana reported 2020 Presidential election results at the precinct level. In our analysis of their data, only 488 out of 2961 counties and parishes have election results that report residual votes by contest by precinct. Results without residual votes are problematic for our purposes because it makes it unclear whether a precinct that appears unanimous with actual votes is actually unanimous once residual votes are accounted for.
To account for the missing data problem, Figure 4 reports the percentage of precincts that appear unanimous based on the vote for the three presidential candidates (Biden, Trump, and Jorgensen). We call these three-party unanimous precincts. These are upper-bounds for the extent of potential vote revelation, because they ignore potential residual votes. Any residual vote in a precinct would result in non-unanimity and thus prevent vote revelation. To extrapolate from states where residual votes are reported to those where they are not, we estimate a regression model predicting whether a three-party unanimous precinct is actually unanimous (i.e., has zero residual votes).
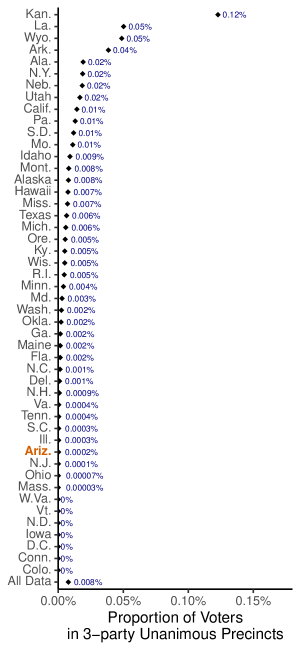
To extrapolate nationwide, we leverage the fact that some counties in the data collected by [6] do report residual votes by precinct. Among the three-party unanimous precincts in that subset, 96 percent of are actually unanimous. We fit a regression model from this subset predicting actual unanimity, and estimate that nationwide precinct-level results could reveal 11,937 votes, or 0.0076% of the total number of votes reported in data collected by [6], if election officials reported residual votes. Appendix Section C further explains the methodology. The nationwide result is about 20 times larger than the potential vote revelation in Maricopa County (7 out of 2 million votes; or 0.0003%). However, total revelation is still modest, at less than one-hundredth of one percent.
Precinct-method revelation in three additional counties
We also consider vote revelation in three counties — Los Angeles, CA; San Mateo, CA (Redwood City); and Cook County, IL (excluding the City of Chicago) — where, like Maricopa County, votes are reported at the precinct-method level and include undervotes and overvotes. The fraction of votes revealed in these counties is similar in magnitude to Maricopa. The fraction of total votes revealed for the 2020 Presidential race is 0.009% out of 4.3 million in Los Angeles, 0.007% out of 0.76 million in San Mateo, and only 1 voter out of 1.2 million (or 0.00008%) in suburban Cook county, compared to 0.02% in Maricopa County.
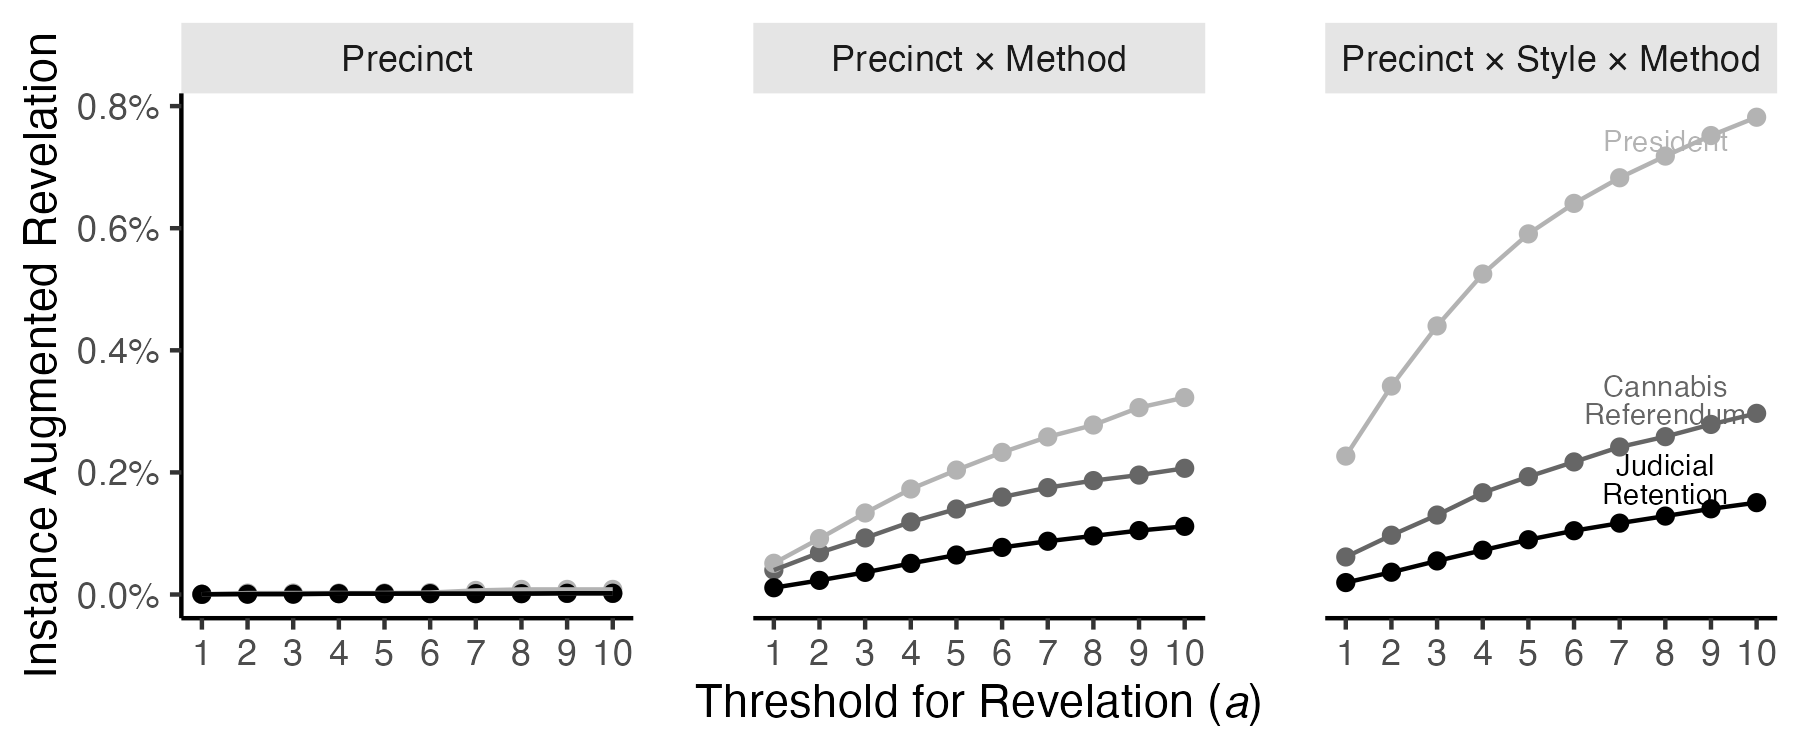
Instance-Augmented Linkage
We finally consider whether vote choices that would not be vulnerable to vote revelation might instead be vulnerable to what we termed instance-augmented linkage. To recap, vote revelation requires uniquely linking a record in anonymous election data with a record in personally-identifiable turnout data. Vote revelation is only possible where an election official reports that all voters in a single reporting unit have voted for the same candidate. In contrast, augmented linkage is possible when a reporting unit is less than unanimous. In that case, individuals may augment the reported election results with knowledge of their own vote choice such that the remaining vote is unanimous.
Figure 5 measures the prevalence of instance-augmented linkage, which occurs when all but or fewer voters in the unit have the same vote choice. By construction, there are more votes vulnerable to instance-augmented linkage than vote revelation. Assuming that every person knows how they voted but does not share how they voted with anyone else, then . In that case, there is little difference between vote revelation and instance-augmented linkage at the precinct-level. However, there is approximately twice as much instance-augmented linkage as vote revelation at the style-method level. The case of might be a household within a precinct, where the household members often support the same candidates and can trust the reported vote choice within their household. Instance-augmented linkages for President rise close to 1 percent of total votes in the most granular reporting method when we consider the case of up to 10 individuals who share their votes.
Mechanical Predictors of Vote Revelations
To take stock of these patterns, we consider a simple model of a single reporting unit in which vote choices are made independently across voters. Based on the model, the key risks for vote revelation are the population of the reporting unit, the geographic clustering of choices for the contest, and the prevalence of undervotes.
Consider a reporting unit with voters for a contest with candidates, indexed by . The expected number of revealed votes in a unit () can be expressed as: E[R] = n(s^n + (1-s)^n∑_h=1^H w_h^n ), where we let be the a priori probability that a randomly selected voter in the reporting unit “abstains” (undervotes or overvotes), and let be the a priori probability that a randomly selected voter in the reporting unit will support candidate conditional on not abstaining. The expected number of revealed vote choices is equal to the number of votes included in the reporting unit’s tally times the probability that every voter in the reporting unit makes the same choice.
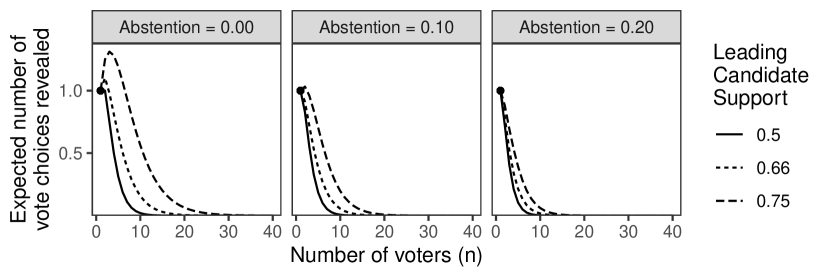
Figure 6 plots the expected number of revealed votes in a two-candidate contest in a given reporting unit as a function of the population size , the a priori probability of support for the leading candidate (), as well as the probability of abstentions ().141414Holding fixed the support for the leading candidate, it is easily shown that the expected number of revelations is weakly decreasing in the number of candidates. Thus, Figure 6 shows the maximum number of expected revelations for contested contests with any number of candidates given the expected level of support for the leading candidate and the number of voters in the reporting unit. When there is a single voter in a reporting unit, that voter’s vote choice is revealed, so the expected number of revealed votes is one in all cases. The expected number of revealed votes eventually falls away to 0 as the unit’s population, , grows. The expected degree of revelation is lowest when the abstention rate is highest and candidate support is evenly split between the candidates. In this situation, the number of expected vote revelations approaches zero when as few as 10 votes are tallied in the reporting unit. On the other hand, with no abstentions and 90 percent of voters expected to support one of the two candidates a priori, the number of votes included in the reporting unit needed to ensure that the expected number of revealed votes approaches zero is much larger, around 75 (not shown).
In other words, the model explains the data generation mechanism that leads to our empirical findings. Revelations are large in contests with small amounts of undervoting, contests where candidate preferences within a reporting unit are close to homogeneous (), and reporting units with a small number of votes. Indeed, the contests where we find low levels of vote revelations are judicial retention elections where the undervoting rate is close to 40 percent countywide (Figure B2). In contrast, the undervoting rate for the President is only 0.4 percent, explaining why the revelation rate is high compared to other offices in Table 2. To make the model more predictive, future extensions could model the geographic sorting of candidate support with an intraclass correlation coefficient so that some contests have more concentrations of candidate support in a geography while others have more randomly distributed levels of support.
The Future of Election Reporting
With both our empirical results and theoretical model in hand, we return to the policy tradeoff that election officials face in election reporting. On the one hand, granular election results have benefits for the legitimacy of the election. On the other, granular election results can lead to some number of vote revelations. The privacy literature offers a well-known menu of policies that could reduce or eliminate vote revelations. However, these policies come with the cost of reducing the transparency of elections. In this section, we address these benefits and costs in turn. We argue that the costs from many of the privacy-protecting manipulations appear disproportionate to the extent of vote revelation we find.
Benefits of Transparency
On one hand of the transparency-privacy tradeoff is the claim that transparent elections are critical for democratic elections. Detailed election results are reported exactly because the electoral process should and must be accountable in order for the results of elections to be legitimate.
Empirically, a robust literature in political science finds that transparent elections have a positive effect on actual fraud prevention and public legitimacy. For one, granular election results have fueled a wave of election forensics work to detect—or rule out—anomalous outcomes. In a classic study, [53] used multiple sources of granular election results, including cast vote records, to argue that the effect of poor ballot design was large enough to swing the winner of the 2000 Presidential election [[, see also]]morseworking. More recent studies similarly rely on results reported by vote method and precinct to dispel claims of election fraud [24, 20, 5] or detect actual election fraud [27]. Further, precinct-level results have become central to voting rights enforcement. Expert witnesses in voter rights litigation rely on precinct-level voting data to estimate the degree of racial polarization in elections.
There is also growing empirical evidence that more transparent election results reduce the incidence of fraud and increase public trust in elections. For example, a field experiment in the 2010 Afghanistan parliamentary elections found that notifying polling station managers that their initial vote tallies will be photographed and made public substantially reduced the manipulation of vote counts [10]. In the contemporary U.S., a recent survey shows that publishing post-election audits increases confidence in both the accuracy and result of the election [32]. [32] find that whether or not the audit results were released to the public increases the confidence in the audit about as much whether the declared winner in the audit is a co-partisan.
Current Approaches to Reducing Revelation
Broadly, there are three types of privacy policies currently used by election officials to reduce or eliminate vote revelation: some jurisdictions suppress certain election results that might be vulnerable to revelation, others aggregate small reporting units into larger reporting units, and one adds random noise to election results based on ideas related to differential privacy.
Suppression
A few states use suppression to address privacy risks in election reporting. For example, Nevada does not report election results for precincts with less than 10 people, while New Mexico does not report election results for third party candidates who win only a handful of votes.
By definition, suppression reduces transparency. The main downside to suppression is that it harms the integrity of counts. Further, at least some suppression policies are not actually guaranteed to solve the problem it is designed for. Suppression and aggregation can guarantee -anonymity, but there are now well-known vulnerabilities to that privacy criterion [38]. To use the example in Nevada, a precinct with 11 voters would still be included in the reported election results, even though it could lead to vote revelation if its result was unanimous.
Aggregation
Other jurisdictions have taken a range of approaches to aggregating rather than suppressing results. The vast majority of large, democratic countries report aggregate election results for each precinct [12]. A few exceptions are the UK, which reports election results only at the constituency level. Japanese municipalities always combine ballots from multiple precincts because of concerns that reporting results by precinct would violate the secrecy of ballot.151515We thank Amy Catalinac for identifying this example. https://www.city.atsugi.kanagawa.jp/soshiki/senkyokanriiinkai/2/2021.html Other jurisdictions introduce a threshold for aggregation. For example, in Germany, any precinct with less than 50 votes must send their votes, sealed and unfolded, to another precinct where they will be mixed, counted, and reported as one.161616In the most recent election, less than 1 percent of polling stations were affected by this policy. We thank Qixuan Yang for identifying this example. §68 ¶2, Bundeswahlordnung (Federal Election Regulation), Feb. 13th, 2020 Version. https://www.buzer.de/gesetz/2263/al85770-0.htm. In New Mexico, election officials aggregate mail and in-person votes within the same precinct when there are five votes or less. In contrast, Nevada takes a more tailored approach: election results from mail-in votes are aggregated with in-person votes if “reporting the returns separately would violate the secrecy of a voter’s ballot.” (Nev. Rev. Stat. §293.269935) But Nevada does not specify what would “violate the secrecy of a voter’s ballot.”
Aggregating small reporting units is not as simple as it may sound and should be designed with care. Asking election officials to edit election reporting piecemeal can easily generate the sort of distrust that granular election results are partly meant to combat in the first place. Moreover, as with suppression, at least some aggregation policies are not guaranteed to eliminate the privacy vulnerabilities it tries to solve. Differential privacy mechanisms, in contrast, have stronger guarantees.
Random Noise (Differential Privacy)
North Carolina’s approach to add noise to precinct-method vote totals is unique among state election boards (both to our knowledge and North Carolina’s). However, the policy draws on the same logic motivating the modern paradigm for statistical privacy, called differential privacy. That logic entails adding random noise to the results of database queries (e.g., how many votes did Joe Biden receive) in order to keep sensitive information (e.g., who did a particular voter vote for) private. Data users essentially are told the underlying variance of the random number generator but only observe one draw of it, so the sensitive attribute is kept private.
Adding random noise is a powerful privacy protection mechanism for sharing sensitive data because it is more resistant to background knowledge attacks, while preserving some ability of the social scientists to draw correct inferences about the structure of the underlying data [19, 21, 1]. For example, by releasing the noised data of true, sensitive information, the decennial Census allowed outside researchers to report the bias and variance of their privacy-protection mechanism [34]. However, a user’s ability to reliably recover this summary statistic requires transparency about the method of adding random noise. Unfortunately, the North Carolina Board of Elections has yet to publicly document its random noise algorithm. As a result, while its process may well provide increased privacy protection, it does so at the cost of making it impossible to know if reliable answers to many questions can be drawn from the electoral data that it publishes.
Despite the advantages of differential privacy over suppression, this paradigm faces important conceptual challenges when it comes to election reporting. A core challenge is that certain queries of an election database (such as which candidate received the most votes) must be reported with perfect fidelity. Classic differential privacy from [18] requires that the reported result of every query to a confidential database be effectively equally likely regardless of whether any individual is removed from the database. The most important query for election results is simple: which candidate won the most votes? Differential privacy, though, requires that the answer to this query not substantially depend on any one vote, or, put another way, that we pick election winners in a way that no single vote could ever matter. That is why only stochastic manipulations, i.e., those that add some sort of random noise, can be differentially private with a finite private budget.171717 To formalize, consider the statistic (e.g. the winner of the election) produced from a private dataset of voters . The (usually random noise-inducing) processing is denoted and a value of the statistic is . The privacy literature considers to be differentially private if the ratio of to is below a user-specified constant , where is a dataset that differs from by the inclusion of one additional row. Now consider an election is decided by one vote, is the data set that includes every voter and is the data where one voter is excluded. Then if has no noise, will report the same winner as with probability 0. Therefore, the ratio of to will be infinity, and no value of would satisfy the DP criterion. For to approach 0, the result of the election would have to be noised enough that the outcomes of the closest elections would be determined by lot and the presence or absence of any one ballot could never matter.
Another conceptual challenge is that classic differential privacy is defined on multiple hypothetical versions of the same dataset, comparing whether one person is in the dataset or not. This idea may work for a survey sample, where there may be multiple samples from the same population, or for a policy of continuously releasing statistics from a changing population [55]. However, an election only happens once. In fact, elections are defined by their finality. We argue it is therefore difficult to rely on a notion of multiple versions of the same election.
Many of these challenges might be solved by advances in differentially private algorithms. Some recent variants of differential privacy do incorporate these constraints into the algorithm as starting constraints so that, in our case, the certified election totals at the constituency level would not be altered [23, 16]. But these methods are complex, require expertise and documentation, and are yet to be implemented in election administration.
Preventive Approaches
The methods to eliminate vote revelation after an election, surveyed above, all have their shortcomings. Some may not provide protection from sophisticated privacy attacks [14]. Most demand the time and resources of election officials, when both are scarce. Most fundamentally, though, none of these approaches protect the secrecy of ballot in terms of vote revelation from the election officials themselves. This is another difference of election data from other common applications of privacy: the secret ballot has historically afforded privacy from the state as well as other members of the public. Researchers who use Census data with sensitive attributes must go through a process through what is called Special Sworn Status, to adhere to strict confidentiality guidelines. The handling of ballot data is much more heterogeneous. At least in this respect, then, the currently available procedures cannot eliminate vote revelation.
In contrast, what we call preventive approaches would modify the way district boundaries are drawn or elections are run to obviate the need for post-hoc approaches. These approaches take more time to implement, but may be more feasible than some of the more sophisticated post-hoc privacy approaches.
First, future redistricting can reduce the number of small reporting units. Drawing district lines for multiple offices to avoid rare ballot styles would reduce revelations in both cast vote records specifically and election returns generally. Figure 6 makes clear that reporting units that contain about 50 voters would drastically reduce the number of potential revelations. Yet a considerable amount of reporting units — at least one in ten ballot style method combinations in Maricopa — are currently cast by 5 or voters or fewer (Table 3.2).
Of course, some ballot styles and precincts may be small for valid reasons, such as making polling stations available in low-density areas, and drawing districts to be as close to equal population as possible. However, some motivations that lead to rare ballot styles, such as gerrymandering for incumbent protection, may not be worth the costs to privacy. Our examination of alternatives shows that the policies to fix privacy vulnerabilities after district lines have been set is substantially more difficult than fixing them proactively.
Another preventive approach is to modify the nonsensitive attributes reported in the voter file, instead of modifying the election results themselves. As the Venn diagram in Figure 1 shows, names and addresses are easily linked to unanimous election results because names and addresses are publicly available in the U.S. along with information on whether registrants turned out to vote. Limiting such information on the voter file would make vote revelation much more difficult. A similar but less drastic approach would limit the snapshots of the voter file made available, in effect using the churn of the electorate for privacy protection. That said, the repercussions of limiting voter file information is beyond the scope of the current study.
Conclusion
Election data plays a unique legitimating role in electoral democracy. However, while transparent election results help ensure free and fair elections, election officials face a tradeoff when transparent election results can jeopardize the secret ballot. Indeed, the uniqueness of election data relative to other contexts is twofold: its legitimizing role and its high standards for protecting the privacy of vote choices from other voters, party leaders, and the election officials themselves. Our study is the first to empirically assess the extent of potential vote revelation under alternative reporting regimes.
We ultimately find that cast vote records could reveal the vote choices of about two-tenths of one-one hundredth of voters in a large, diverse county. We interpret such revelation as small enough such that shielding all cast vote records from the public to protect privacy is disproportionate. At the same time, our findings do highlight areas of concern. The risk of revelation is not randomly distributed across the entire electorate, but is more likely for voters in small or split precincts, using rare vote methods (Figures 3, 6). To be clear, our argument is not that these revelations should be ignored, but that they should be understood as one part of a difficult transparency-privacy tradeoff.
Our findings cannot provide an absolute, quantitative threshold for what is a large amount revelation sufficient to justify removing all ballots from the public record. There is currently little to no empirical evidence on the degree of privacy costs from election reporting. Our analysis focuses on measuring these costs, rather than quantifying the benefits of transparency. That said, the accumulation of empirical evidence will inform this difficult tradeoff. For example, in the domain of the Census, a group of economists and statisticians have started to characterize the privacy gains and accuracy costs in privacy protection measures [30].
Ultimately, the importance of transparency in elections should serve as a serious counterweight against suppressing, coarsening, or adding random noise to reported election results. The importance of transparency to democratic legitimacy also means that the release of transparent election results should be robust to bad faith actors. We close with the case of North Carolina’s board of elections that we started with. As in Maricopa County, North Carolina election officials have been the target of a coordinated campaign by election denialists to request cast vote records and detailed election data [8]. While some records requests are made in good faith, the new barrage of records requests have hindered the work of local election officials, who are often already at capacity. Taking transparency seriously requires supporting the current state and local election administration system’s capacity to maintain and release election results.
References
- [1] John M. Abowd and Michael B. Hawes “Confidentiality protection in the 2020 US Census of population and housing” In Annual Review of Statistics and Its Application 10 Annual Reviews, 2023, pp. 119–144
- [2] E. Scott Adler and Thad E. Hall “Ballots, Transparency, and Democracy” In Election Law Journal 12.2, 2013, pp. 146–161
- [3] Stephen Ansolabehere and Eitan D Hersh “ADGN: An algorithm for record linkage using address, date of birth, gender, and name” In Statistics and Public Policy 4.1, 2017, pp. 1–10
- [4] Lonna Atkeson et al. “100% Independent Retabulation Election Audit, Leon County, Florida” In Technical Report, 2023
- [5] Joseph Bafumi, Michael C. Herron, Seth J. Hill and Jeffrey B. Lewis “Alvin Greene? Who? How Did He Win the United States Senate Nomination in South Carolina?” In Election Law Journal 11.4, 2012, pp. 358–379 DOI: 10.1089/elj.2011.0137
- [6] Samuel Baltz et al. “American election results at the precinct level” In Nature Scientific Data 9.1, 2022, pp. 651
- [7] Matthew Bernhard et al. “Public evidence from secret ballots” In Electronic Voting: Second International Joint Conference, E-Vote-ID 2017, Bregenz, Austria, October 24-27, 2017, Proceedings 2, 2017, pp. 84–109 Springer
- [8] Doug Bock Clark “A County Elections Director Stood Up to Locals Who Believe the Voting System Is Rigged. They Pushed Back Harder.” In ProPublica, October 31, 2022, 2022 URL: https://perma.cc/7Q2W-2S8X
- [9] Brennan Center “Voting Laws Roundup: February 2022”, 2022 URL: https://perma.cc/4PW2-XFLX
- [10] Michael Callen and James D. Long “Institutional corruption and election fraud: Evidence from a field experiment in Afghanistan” In American Economic Review 105.1, 2015, pp. 354–381
- [11] Francisco Cantú “Identifying irregularities in Mexican local elections” In American Journal of Political Science 58.4 Wiley Online Library, 2014, pp. 936–951
- [12] Amy Catalinac “Dominance Through Division: Group-Based Clientelism in Japan” Unpublished Manuscript, 2023
- [13] Jesse T. Clark, Lindsey Cormark and Sam Wang “Privacy Concerns in New York City Elections”, 2021
- [14] Aloni Cohen “Attacks on Deidentification’s Defenses” In 31st USENIX Security Symposium (USENIX Security 22), 2022, pp. 1469–1486
- [15] David Cottrell, Michael C. Herron and Sean J. Westwood “An exploration of Donald Trump’s allegations of massive voter fraud in the 2016 General Election” In Electoral Studies 51 Elsevier, 2018, pp. 123–142
- [16] Prathamesh Dharangutte, Jie Gao, Ruobin Gong and Fang-Yi Yu “Integer Subspace Differential Privacy” In Proceedings of the AAAI Conference on Artificial Intelligence 37.6, 2023, pp. 7349–7357 DOI: 10.1609/aaai.v37i6.25895
- [17] George Duncan and Diane Lambert “The risk of disclosure for microdata” In Journal of Business & Economic Statistics 7.2 Taylor & Francis, 1989, pp. 207–217 DOI: 10.2307/1391438
- [18] Cynthia Dwork “Differential privacy” In International colloquium on automata, languages, and programming, 2006, pp. 1–12 Springer
- [19] Cynthia Dwork, Ruth Greenwood and Gary King “Letter to US Census Bureau:" Request for release of “noisy measurements file” by September 30 along with redistricting data products"”, 2021
- [20] Andrew C. Eggers, Haritz Garro and Justin Grimmer “No evidence for systematic voter fraud: A guide to statistical claims about the 2020 election” In Proceedings of the National Academy of Sciences 118.45 National Acad Sciences, 2021, pp. e2103619118
- [21] Georgina Evans, Gary King, Margaret Schwenzfeier and Abhradeep Thakurta “Statistically valid inferences from privacy protected data” In American Political Science Review, 2023
- [22] Jen Fifield “A bill to enable do-it-yourself election audits sparks rare bipartisan interest in Arizona” In Votebeat, March 14, 2023, 2023 URL: https://arizona.votebeat.org/2023/3/14/23638888/ken-bennett-diy-election-audit-bill-public-ballot-images
- [23] Jie Gao, Ruobin Gong and Fang-Yi Yu “Subspace differential privacy” In Proceedings of the AAAI Conference on Artificial Intelligence 36.4, 2022, pp. 3986–3995
- [24] Sharad Goel et al. “One person, one vote: Estimating the prevalence of double voting in US presidential elections” In American Political Science Review 114.2 Cambridge University Press, 2020, pp. 456–469
- [25] Philippe Golle “Revisiting the uniqueness of simple demographics in the US population” In Proceedings of the 5th ACM Workshop on Privacy in Electronic Society, 2006, pp. 77–80
- [26] Richard L Hasen “Vote buying” In Calif. L. Rev. 88 HeinOnline, 2000, pp. 1323
- [27] Michael C. Herron “Mail-in Absentee Ballot Anomalies in North Carolina’s 9th Congressional District” In Election Law Journal 18.3, 2019, pp. 191–213
- [28] Michael C. Herron et al. “Bad Ballot Design and Electoral Legitimacy”, N.D.
- [29] Katie Hobbs “Re: HB2560, May 19, 2023”, 2023 URL: https://azgovernor.gov/sites/default/files/veto_letter_hb2560_0.pdf
- [30] V Joseph Hotz et al. “Balancing data privacy and usability in the federal statistical system” In Proceedings of the National Academy of Sciences 119.31 National Acad Sciences, 2022, pp. e2104906119
- [31] Matthew Houck “Letter to South Carolina Election Commission, Office of the Attorney General, State of South Carolina” 2020 WL 5985610, 2020
- [32] Jacob Jaffe et al. “What Effect do Audits Have on Voter Confidence?” In Working Paper, 2023
- [33] Christopher T. Kenny et al. “Comment: The Essential Role of Policy Evaluation for the 2020 Census Disclosure Avoidance System” In Harvard Data Science Review Special Issue 2, 2023, pp. 1–16
- [34] Christopher T. Kenny et al. “Evaluating Bias and Noise Induced by the US Census Bureau’s Privacy Protection Methods” In arXiv preprint, 2023 URL: https://arxiv.org/2306.07521
- [35] Alexander Keyssar “The Right to Vote: The Contested History of Democracy in the United States” Basic Books, 2009
- [36] Shiro Kuriwaki “The Administration of Cast Vote Records in US States” OSF Preprints, 2020 URL: https://osf.io/epwqx
- [37] Rachel Leingang “Election activists are seeking the “cast vote record” from 2020. Here’s what it is and why they want it.” In Votebeat, September 7, 2022, 2022 URL: https://arizona.votebeat.org/2022/9/7/23341640/cast-vote-record-data-ballot-tabulator-images
- [38] Ashwin Machanavajjhala, Daniel Kifer, Johannes Gehrke and Muthuramakrishnan Venkitasubramaniam “-diversity: Privacy beyond -anonymity” In ACM Transactions on Knowledge Discovery from Data (TKDD) 1.1, 2007 URL: http://doi.acm.org/10.1145/1217299.1217302
- [39] Isabela Mares “From Open Secrets to Secret Voting: Democratic Electoral Reforms and Voter Autonomy” Cambridge University Press, 2015
- [40] Maricopa County Elections Department “Correcting the Record: Maricopa County’s In-depth Analysis of the Senate Inquiry” In Technical Report, 2022 URL: https://elections.maricopa.gov/voting/just-the-facts.html
- [41] Cory McCartan et al. “ALARM Project: 50-State Redistricting Simulations”, 2022 URL: https://doi.org/10.7910/DVN/SLCD3E
- [42] John McCarthy et al. “Preserving Anonymity of Cast Vote Record”, 2018, pp. 1–11 URL: http://bit.ly/2LcuCOQ
- [43] Walter R. Mebane “Election forensics: The second-digit Benford’s law test and recent American presidential elections” In Election fraud: Detecting and deterring electoral manipulation Brooking Press Washington, DC, 2008, pp. 162–181
- [44] National Conference of State Legislatures “Secrecy of the Ballot and Ballot Selfies”, 2022 URL: https://www.ncsl.org/elections-and-campaigns/secrecy-of-the-ballot-and-ballot-selfies
- [45] Paul Ohm “Broken promises of privacy: Responding to the surprising failure of anonymization” In UCLA Law Rev. 57 HeinOnline, 2009, pp. 1701
- [46] Richard H Pildes “Election Law in an Age of Distrust” In Stan. L. Rev. Online 74 HeinOnline, 2021, pp. 100
- [47] Rebecca Rivas “Election deniers ramp up public records requests in Missouri, across the country” In Missouri Independent, 2022 URL: https://missouriindependent.com/2022/10/24/election-deniers-ramp-up-public-records-requests-in-missouri-across-the-country/
- [48] Charles III Stewart “Trust in Elections” In Daedalus 151.4, 2022, pp. 234–253
- [49] Latanya Sweeney “k-anonymity: A model for protecting privacy” In International Journal of Uncertainty, Fuzziness and Knowledge-based Systems 10.05 World Scientific, 2002, pp. 557–570
- [50] Latanya Sweeney et al. “Re-identification Risks in HIPAA Safe Harbor Data: A study of data from one environmental health study” In Technology science 2017 NIH Public Access, 2017
- [51] VEST “Voting and Election Science Team, 2020 Precinct-Level Election Results” In Harvard Dataverse, 2020 DOI: 10.7910/DVN/K7760H
- [52] John P Wack “Cast Vote Records Common Data Format Specification Version 1.0” In National Institute of Standards and Technology John P. Wack, 2019 DOI: 10.6028/NIST.SP.1500-103
- [53] Jonathan N. Wand et al. “The butterfly did it: The aberrant vote for Buchanan in Palm Beach County, Florida” In American Political Science Review 95.4 Cambridge University Press, 2001, pp. 793–810
- [54] Jack Williams, Samuel Baltz and Charles Stewart III “Votes Can Be Confidently Bought in Instant Runoff Elections, and What to Do About It” In Working Paper, 2023 URL: https://dx.doi.org/10.2139/ssrn.4387782
- [55] Alexandra Wood et al. “Differential Privacy: A Primer for a Non-Technical Audience” In Vanderbilt Journal of Entertainment & Technology Law 21.1, 2018, pp. 209
- [56] Ji Su Yoo, Alexandra Thaler, Latanya Sweeney and Jinyan Zang “Risks to patient privacy: a re-identification of patients in Maine and Vermont statewide hospital data” In Journal of Technology Science 2018, 2018, pp. 2018100901
- [57] York County “Ballots, Ballot Images and CVRs are not subject to FOIA – FOIA07062022.01”, 2022 URL: https://www.yorkcountygov.com/1013/FOIA---Freedom-of-Information-Act-Respon
Appendix
Appendix A Data Specifics
Cast Vote Records
Figure A1 shows an example of an actual ballot image and its cast vote record representation.
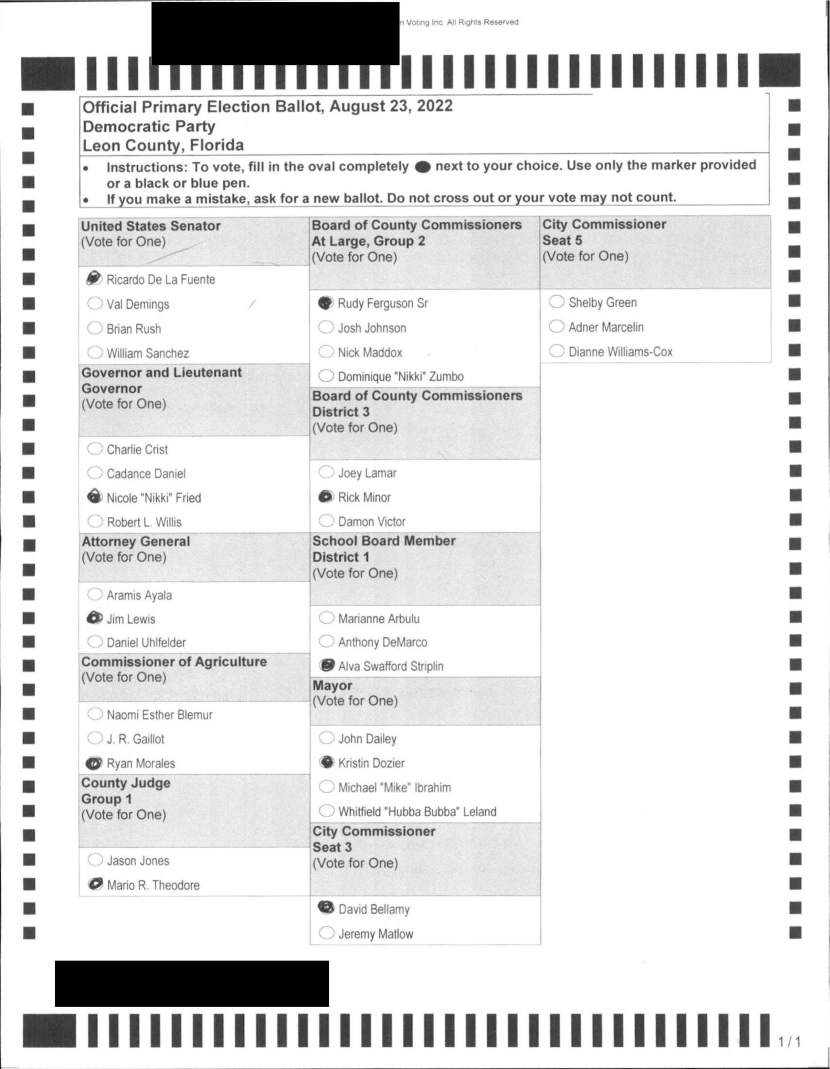
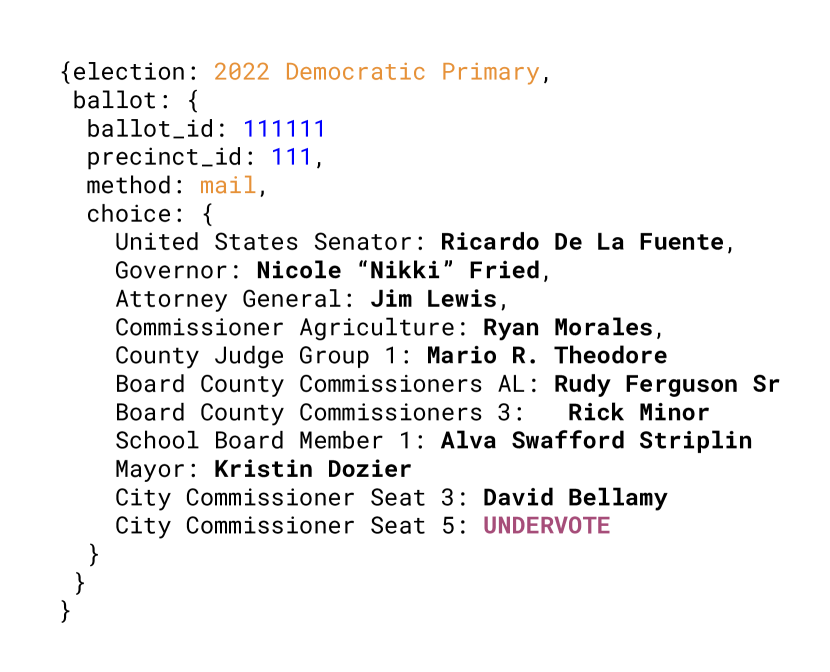
Voter File and Voted File Data
Revealing votes requires not only information about the ballots cast, but also about the individuals who cast those ballots. Thus, in addition to studying what would revealed if cast vote records or granular election returns are combined with a complete and accurate enumeration of the voters casting ballots in the election, we also investigate the availability of such an enumeration. As depicted in Figure 1A, vote revelation requires an accurate turnout record for every voter in a unanimous reporting unit.
We collect two types of individual-level turnout records, both based on administrative data on voter registration and participation: a commercial voter file produced by L2, a private data vendor, and an administrative file called the “voted file” produced by Maricopa County.
The L2 voter file identifies a voter’s name, birthdate, and address, as well as whether or not each voter turned out in a specific election and by what voting method. However, consistent with the churn in the electorate, the January 2021 L2 voter file contains 26,819 fewer voters than the votes cast in the November 2020 elections (about 1.3% of the total votes actually cast).
The voted file, technically called the VM55 in Maricopa, is a complete record of the voters in each election. It includes precinct and a coarse meausre of vote method. Although a voter’s ballot style is not included in the voted file, it is possible to map each voter’s known registration address to a ballot style with publicly available precinct maps. The only exception to this is if the ballot style in question is a federal-only ballot. Using the 2020 VM55, we verified that the voted file from Maricopa county matches the number of ballots obtained in the cast vote records, with one exception of the protected voter registration discussed above.
As discussed in the main text, we put aside the limitations of the voter file data and focus on potential vote revelation, i.e., assuming that the actor section to reveal votes has access to an accurate enumeration of voters that indicates the ballot style, precinct, and method of voting for each voter. Accounting for inaccuracies in the enumeration of voters participating in the elections would reduce the amount of vote revelation. However, it is possible that someone seeking to reveal votes could produce a more accurate enumeration of the voters than we have access to, so we take the conservative approach of reporting the degree of revelation that would be possible if the best possible enumeration of voters was available.
Appendix B Additional Figures and Tables
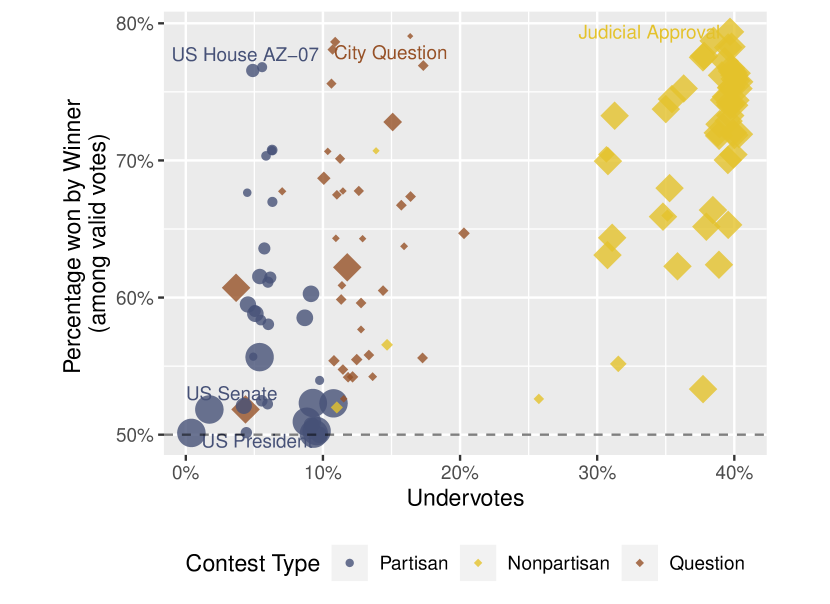
Appendix C National Election Data
We used the following procedure to estimate the total number of voters across the whole country whose Presidential vote would be revealed if results were reported at the precinct level. The main idea of our modeing is as follows. We focus on precincts that appear unanimous in jurisdictions that do report residual votes and consider if they are actually unanimous when accounting for residual votes. We fit a logistic regression where the outcome is 1 if the apparently unanimous precinct also had 0 write-in and residual votes (i.e., in fact unanimous), and 0 otherwise (i.e.,some voter also voted write-in, undervoted, or both). Using the regression, we then generate predicted probabilities that each apparently unanimous precinct in the nationwide data is actually unanimous.
-
(a)
Starting from the MIT Election and Data Science Lab tabulation of cleaned precinct results \parencites[][,“MEDSL Data”]baltz2022precinct, we first consider states that report a “total votes cast” by precinct but not residual votes in the Presidential contest, and back out the number of residual votes in a precinct by subtracting the reported votes from the total cast votes.
-
(b)
Subset the data to jurisdictions that report residual votes (including those imputed above) and write-in votes. This limits the data to precincts in 487 counties.
-
(c)
Subset the data further to precincts in these jurisdictions that are 3-party unanimous: precincts in which only one of the three 2020 Presidential candidates – Biden, Trump, and Jorgensen – have earned votes. This limits the data to 173 precincts in 46 counties (in the following states: AL, FL, IL, NY, OR, TX, WY ). 50 percent of these precincts are Trump precincts in which Trump won positive votes and Biden won none. Figure 4 shows the voters in such 3-party unanimous precincts as a fraction of the total votes in the entire state.
-
(d)
Fit a logistic regression in this data, where the outcome is 1 if the precinct also had 0 write-in and residual votes (i.e., in fact unanimous), and 0 otherwise (i.e., some voter also voted write-in, undervoted, or both). The predictors in the regression are the log of the total votes for the three candidates, and whether the precinct is a Trump district. About 96 percent of the precincts in the data have an outcome of 1. The logit coefficients are presented in Table C1.
-
(e)
We then return to the national data from (a), and subset it to 3-party unanimous precincts. We therefore take data regardless of whether it reports residual votes by precinct. This results in 1740 precincts. We then generate predicted probabilities from (d) for each precinct, generating the probability that precinct is actually revealed.
We take the weighted sum of each precinct’s vote count in (e), weighted by the predicted probabilities. This sum generates 11,139 . This amounts to 0.0071 % of the total number of votes reported in the 50-state MEDSL Data.
| Outcome: Actual Unanimity | |
| Intercept | 3.62 |
| (0.69) | |
| log(Total votes for Biden/Trump/Jorgensen) | -0.41 |
| (0.25) | |
| Support for Trump | 0.27 |
| (0.79) | |
| Mean of Outcome | 0.96 |
| Num.Obs. | 173 |
| AIC | 62.0 |