PAHs and the 2175 Extinction Bump
Polycyclic Aromatic Hydrocarbon Molecules and the 2175 Interstellar Extinction Bump
Abstract
The exact nature of the 2175 extinction bump, the strongest spectroscopic absorption feature superimposed on the interstellar extinction curve, remains unknown ever since its discovery in 1965. Popular candidate carriers for the extinction bump include nano-sized graphitic grains and polycyclic aromatic hydrocarbon (PAH) molecules. To quantitatively evaluate PAHs as a possible carrier, we perform quantum chemical computations for the electronic transitions of 30 compact, pericondensed PAH molecules and their cations as well as anions with a wide range of sizes from 16 to 96 C atoms and a mean size of 43 C atoms. It is found that a mixture of such PAHs, which individually exhibit sharp absorption features, show a smooth and broad absorption band that resembles the 2175 interstellar extinction bump. Arising from transitions, the width and intensity of the absorption bump for otherwise randomly-selected and uniformly-weighted PAH mixtures, do not vary much with PAH sizes and charge states, whereas the position shifts to longer wavelengths as PAH size increases. While the computed bump position, with the computational uncertainty taken into account, appears to agree with that of the interstellar extinction bump, the computed width is considerably broader than the interstellar bump if the molecules are uniformly weighted. It appears that, to account for the observed bump width, one has to resort to PAH species of specific sizes and structures.
keywords:
ISM: dust, extinction — ISM: lines and bands — ISM: molecules1 Introduction
The 2175 extinction bump, the most prominent spectral feature superimposed on the interstellar extinction curve spanning roughly the wavelength range between 1700 and 2700, has puzzled astronomers for nearly six decades ever since its first detection (Stecher 1965). It is widely seen in the Milky Way (e.g., see Fitzpatrick & Massa 1986, 2007; Valencic et al. 2004; but also see Clayton et al. 2000) and nearby galaxies, including the Large Magellanic Cloud (e.g., see Fitzpatrick 1986, Misselt et al. 1999, Gordon et al. 2003), several regions in the Small Magellanic Cloud (Gordon & Clayton 1998, Maíz-Apellániz & Rubio 2012, Gordon et al. 2003) and M31 (Bianchi et al. 1996, Dong et al. 2014, Clayton et al. 2015, Wang et al. 2022). It has also been seen in more distant galaxies. Motta et al. (2002) reported the detection of the 2175 extinction bump in the lens galaxy of the gravitational lens system SBS 0909+532 at . York et al. (2006) detected the 2175 bump in a damped Ly absorber (DLA) at toward AO 0235+164, a quasar at . This extinction bump has also been seen in over a dozen of dusty intervening MgII systems at 1–2 toward quasars in the Sloan Digital Sky Survey (SDSS) data base (see Wang et al. 2004, Srianand et al. 2008, Zhou et al. 2010, Jiang et al. 2011, Ma et al. 2015, 2017). Elíasdóttir et al. (2009) found the 2175 bump in the optical afterglow spectrum of GRB 070802, a gamma-ray burst (GRB) at a redshift of . Several other GRBs also show evidence for the presence of this bump (see Liang & Li 2009, 2010; Prochaska et al. 2009; Zafar et al. 2011, 2012). The attenuation of starlight by interstellar dust in star-forming galaxies at has also indicated the possible presence of the 2175 bump (e.g., see Noll et al. 2007, 2009; Conroy et al. 2010; Kriek et al. 2013; Battisti et al. 2020; Shivaei et al. 2022). Very recently, the 2175 extinction bump was detected by the James Webb Space Telescope (JWST) in a distant galaxy at redshift (Witstok et al. 2023).
Despite nearly 60 years’ extensive observational, theoretical and experimental studies, the exact carrier of the 2175 extinction bump remains unidentified. Stecher & Donn (1965) first proposed small graphite grains as a carrier of the extinction bump, but decades of observations led to discrediting this hypothesis since it cannot account for an important observational constraint, i.e., the central wavelength of the bump is virtually invariant across a large number of sightlines while its width can vary significantly (Fitzpatrick & Massa 1986; Mathis 1994). When increasing the size of graphite grains, the width does grow larger, but at the expense of the peak shifting to longer wavelengths (e.g., see Draine & Malhotra 1993).
A popular hypothesis attributes the 2175 bump to polycyclic aromatic hydrocarbon (PAH) molecules (Joblin et al. 1992; Li & Draine 2001; Malloci et al. 2004, 2008; Cecchi-Pestellini et al. 2008; Steglich et al. 2010, 2012) which reveal their presence in the interstellar medium (ISM) through a distinct series of emission bands in the mid infrared (IR) at 3.3, 6.2, 7.7, 8.6 and 11.3. Massa et al. (2022) recently analyzed the low-resolution 5–14 spectra of the diffuse PAH emission obtained by the Infrared Spectrograph (IRS) on board the Spitzer Space Telescope toward a carefully selected sample of 16 stars. The sightlines toward these stars have well-determined ultraviolet (UV) extinction curves. They found a strong correlation between the strength of the 2175 bump and the PAH emission bands, supporting PAHs as a possible carrier of the bump.
To quantitatively evaluate PAHs as a possible carrier of the 2175 extinction bump, we perform quantum chemical computations for the electronic transitions of 30 compact, pericondensed PAH molecules and their cations as well as anions. These molecules span a wide range of sizes from 16 to 96 carbon (C) atoms and have a mean size of 43 C atoms. We analyze the mean spectra of these molecules and compare them with the interstellar 2175 bump. This paper is organized as follows. In §2 we briefly describe the computational methods and target molecules. The computed spectra are presented and discussed in §3. Our major conclusion is summarized in §4.
2 Computational Methods and Target Molecules
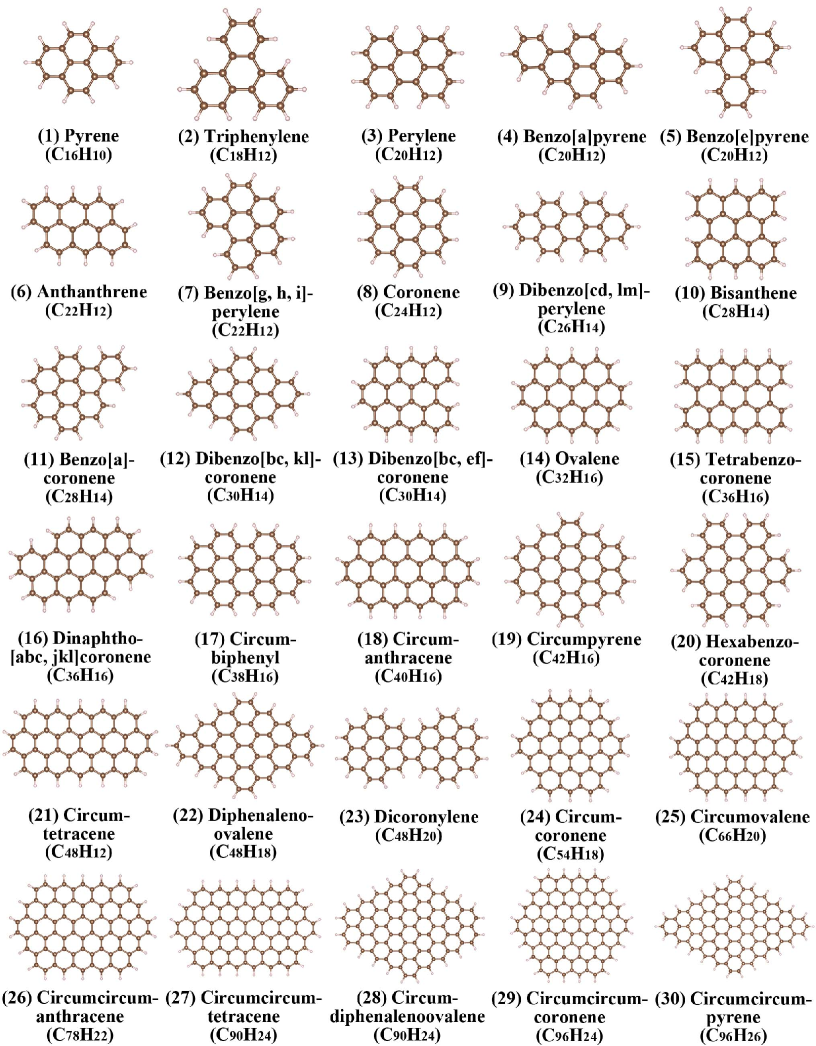
We use the Time-Dependent Density Functional Theory (TD-DFT) as implemented in the software Octopus to calculate the UV/visible electronic spectra of a series of PAHs in anion, neutral, and cationic charging states (Marques et al. 2003). We employ the hybrid functional B3LYP in combination with the following crucial parameters: (1) the size of numerical box (each atom coated by a sphere of radius 3 for neutrals and cations, 5 for anions), (2) the grid spacing of 0.3, (3) the time integration length of 20 , and (4) the time step of 0.002 . Before computing the electronic spectra, we perform structure optimization with the software Gaussian09 by using the B3LYP functional in conjunction with the 6-31+G(d) basis set (Becke 1993; Frish et al. 1984). As catacondensed PAHs with open structures are less stable in the ISM, we select 30 compact, pericondensed PAHs (see Figure 1). These molecules span a wide range of sizes from pyrene with 16 C atoms (i.e., ) to circumcircumcoronene and circumcircumpyrene with . Starting from pyrene (C16H10), perylene (C20H12), anthracene (C22H12), coronene (C24H12), and ovalene (C32H16) as seed molecules, we investigate the effects of size and charging on the electronic absorption spectra of large, compact PAHs up to circumcircumcoronene and circumcircumpyrene. In the ISM, typical PAHs have (see Li & Draine 2001). However, it is computationally not feasible for TD-DFT to consider PAHs much larger than circumcircumcoronene or circumcircumpyrene.
It is interesting to note that apart from being stable, these PAH molecules are anticipated to serve as the primary predecessors for the formation of soot in hydrocarbon flames (Frenklach & Feigelson 1989; Cherchneff & Barker 1992). We also remark that these molecules have been adopted by Croiset et al. (2016) to map the sizes of PAHs in NGC 7023, a reflection nebula, using data from the Stratospheric Observatory for Infrared Astronomy (SOFIA).
3 Results and Discussion
Let , , and be the absorption cross sections per C atom of the -th PAH cation, anion and neutral species at wavelength . Let be the number of C atoms of the -th PAH species. The mean absorption cross sections (per C atom) for the 30 PAH cations, anions and neutrals considered in this work are respectively
| (1) |
| (2) |
| (3) |
The overall mean absorption cross sections (per C atom) are obtained from averaging over that of all three charge states (and assuming equal weights for cations, anions and neutrals):
| (4) |
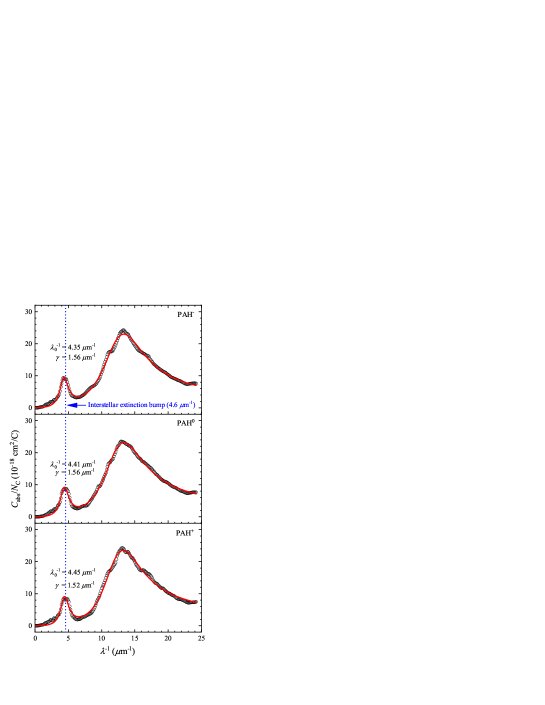
Figure 2 shows , and , the mean absorption spectra for the target molecules in different charge states, weighted on a per C atom basis. It is apparent that, although a single PAH species exhibits sharp, individual absorption features, the mean spectrum of a mixture of many individual molecules, with many overlapping absorption features, effectively smooth out these sharp features and produce two prominent broad absorption bands in the UV, respectively arising from transitions involving and electrons (see Li & Draine 2001). This has already been demonstrated by previous experimental (Joblin et al. 1992; Steglich et al. 2010, 2012) and quantum computational studies (Malloci et al. 2004, 2008; Cecchi-Pestellini et al. 2008). Figure 2 confirms these earlier studies that, indeed, the sharp absorption peaks of individual species are smoothed out in PAH mixtures, and a concentration of strong absorption features in the 2000–2400Å wavelength region blend together to produce a pronounced band resembling the 2175 extinction bump. In addition, an even more prominent absorption band is seen around 12.
As illustrated in Figure 2, the low-lying band at 4.4 is dominated by strong transitions, while the broader band at 12 is caused by the sum of , , , Rydberg transitions and possible plasmon effects. Its low-energy tail may contribute to the far-UV extinction rise at in the interstellar extinction curve, particularly the so-called “nonlinear” far-UV rise (see eq. 1 of Fitzpatrick & Massa 1988, eqs. 4a,b of Cardelli et al. 1989).
To quantitatively evaluate PAHs as a possible carrier of the 2175 extinction bump, we construct a phenomenological model to characterize the mean absorption spectra of PAH cations, anions and neutrals in terms of a Drude profile of width and peak position of for the transitions, and an asymmetrical Fano profile of width and peak position of for the collective electronic transitions arising from , , , and Rydberg transitions as well as possible plasmon effects:
| (5) |
where is the inverse wavelength, is the Drude function, and are respectively its peak and width:
| (6) |
and the Fano function is
| (7) |
where is a dimensionless, phenomenological parameter for depicting the line shape asymmetry (see Fano 1961).
As shown in Figure 2, the mean absorption spectra of PAH cations, anions and neutrals arising from transitions are closely fitted by the combination of a Drude profile and a Fano profile. The parameters are tabulated in Table 1. The absorption spectra of PAHs of all three charge states all peak around 4.4, differing only by 1%. The widths of the absorption spectra of all three charge states are all around 1.56, differing only by 2%. The intensities of transitions are also very similar for all the charge states, differing only by 5%. This contradicts the experimental findings that, upon ionization, the absorption bump due to transitions substantially weakens (see Lee & Wdowiak 1993, Robinson et al. 1997).
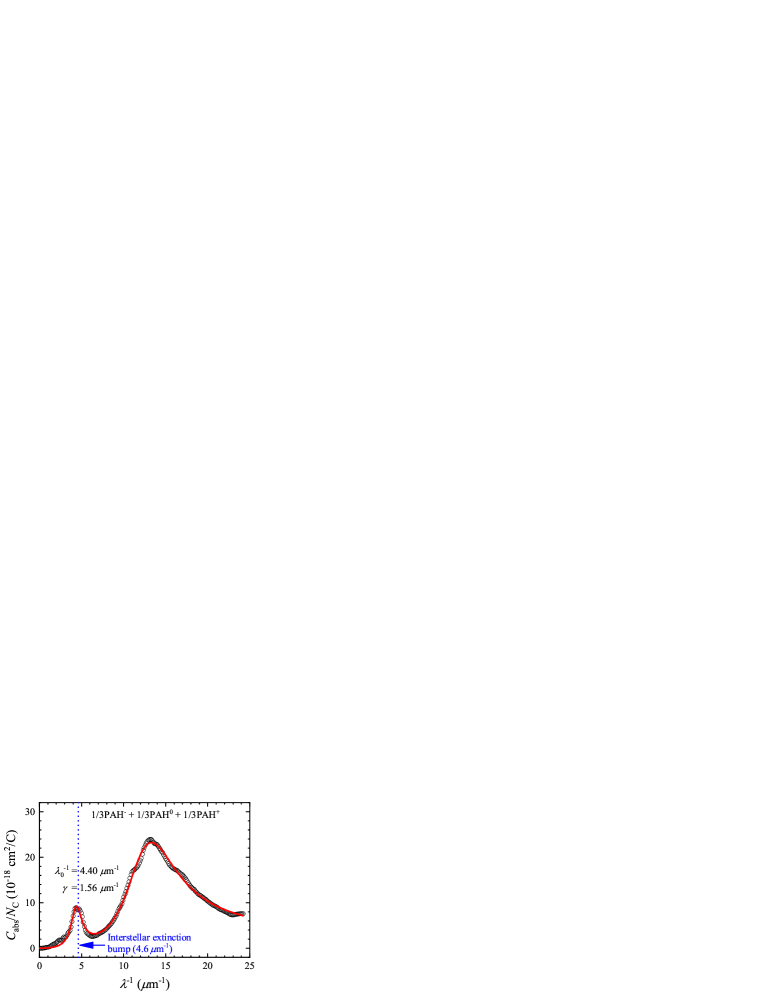
Figure 3 shows , the overall mean absorption spectrum of PAHs, obtained by averaging over , and , the mean absorption spectra for PAH cations, anions and neutrals (on a per C atom basis). We assign equal weights to all charge states. We also fit with a Drude profile and a Fano profile. The band strength of the transitions for the mixture of those 30 compact PAHs shown in Figure 1 is
| (8) |
where is the excess mean absorption cross section of PAHs at the transitions. Observationally, in the diffuse ISM the optical depth of the 2175 extinction bump per hydrogen column integrated over the bump in inverse wavelength is
| (9) |
where is the excess optical depth at 2175, and is the hydrogen column density (see Table 1 of Draine 1994). To account for the observed 2175 extinction bump in the diffuse ISM, the amount of C (relative to H) required to be tied up in PAHs is
| (10) |
where ppm is parts per million.
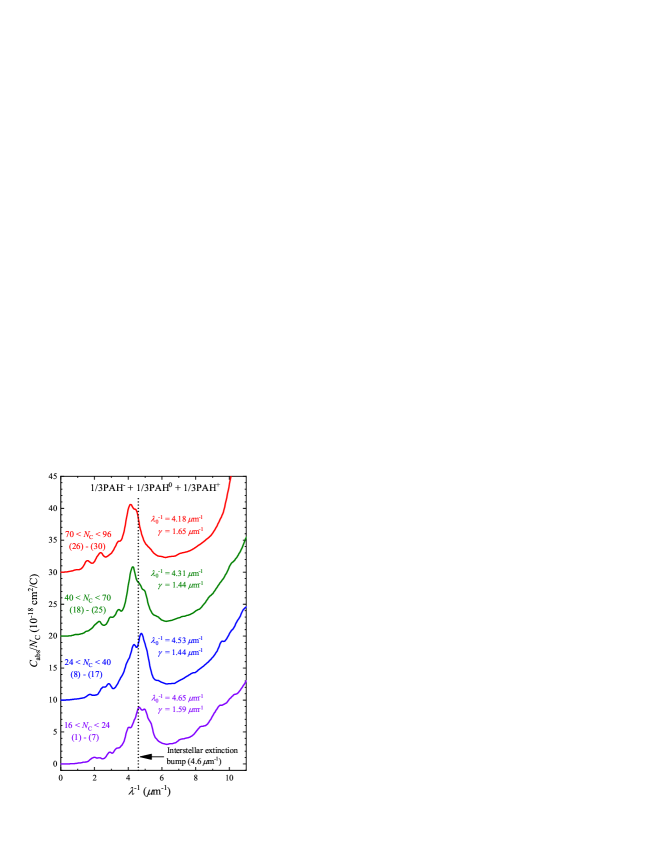
As shown in Figure 3, the absorption bump peaks at 4.4 and has a width of . While it resembles the interstellar extinction bump at 2175 or 4.6, it peaks at a somewhat longer wavelength. Apparently, this is not an charge effect since, as shown in Figure 2, the peak wavelengths are very similar for PAH cations, anions and neutrals. To explore if this is a PAH size effect, we divide our sample of 30 molecules into four size groups: , , , and . For each size group, we obtain the mean absorption spectrum derived by averaging over all sizes and charge states and show in Figure 4. Clearly, as PAH sizes increase, the absorption bump shifts to longer wavelengths. Except for the smallest size group, all peak at wavelengths somewhat longer than the extinction bump. The group exhibits a bump with a wavelength somewhat shortward of the interstellar extinction bump. However, these molecules are in the smallest end in the PAH size distribution and are not expected to dominate the contribution to the extinction bump. Therefore, the mismatch in the bump peak position is not a PAH size effect.
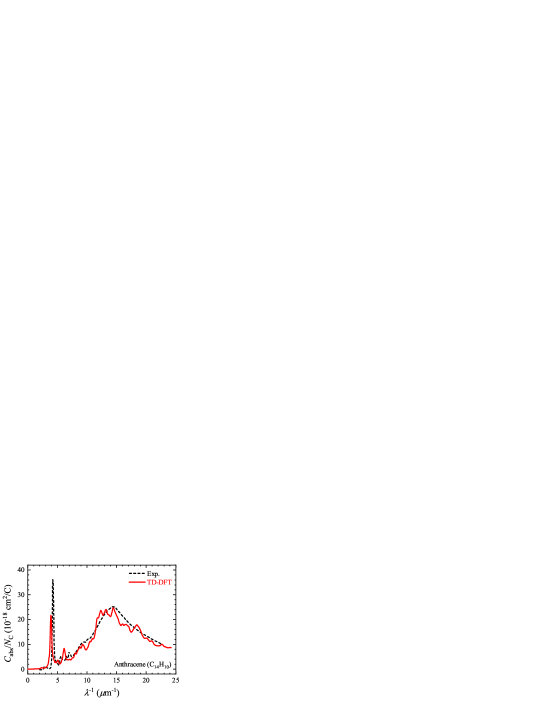
It is likely that the mismatch in position between the computed absorption bump and the interstellar extinction bump is due to computational uncertainty. Indeed, as illustrated in Figure 5, the DFT-computed absorption spectrum of anthracene deviates from the experimental spectrum of gas-phase anthracene measured by Joblin (1992) by 0.4: while the bump in the gas-phase experimental spectrum peaks at 4.24, the DFT spectrum peaks at a longer wavelength of 3.91. As a matter of fact, the uncertainty for the band positions at the B3LYP/6-31+G(d) level of TD-DFT is 0.3 (e.g., see Hirata et al. 1999). With this uncertainty taken into account, the bump for the mean absorption spectrum of all species and all charge states would shift from 4.40 to 4.64, concurring with the interstellar extinction bump.
Unlike the central wavelength of the extinction bump which is remarkably stable and independent with environment, the width shows considerable variation and environmental dependence. Fitzpatrick & Massa (1986) found a wide range of widths () for a sample of 45 stars, with an average width of . Valencic et al. (2004) found a wider range of widths () for a sample of 417 stars, with an average width of . Even in the sample of Valencic et al. (2004), very broad bumps are rare, as only 21 out of 417 sight lines had . However, the widths of the DFT-computed absorption spectra of PAH mixtures are all larger than 1.4 (see Figures 2–4). Apparently, the width is not an effect of PAH charge states since, as shown in Figure 2, the widths are rather similar for different charge states. On the other hand, the width is not an effect of PAH size either since, as shown in Figure 4, the widths of PAHs of different sizes do not show any systematic variations.
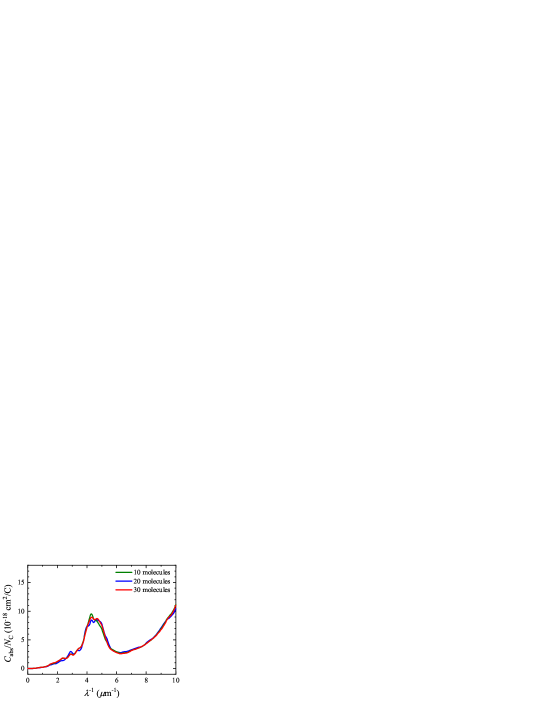
It is speculated that the more molecules are considered, the broader the bump would be. To examine this, we obtain the mean absorption spectra of 10 and 20 molecules, randomly selected among our sample of 30 molecules. As shown in Figure 6, the widths of the absorption bump for a mixture of 10 and 20 molecules are essentially the same as that for a mixture of 30 molecules. This indicates that the bump width is not sensitive to the exact number of molecules.
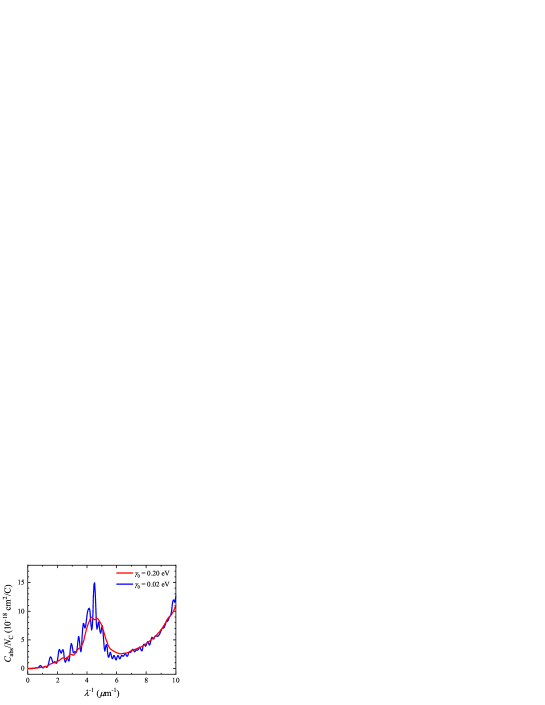
It is also speculated that the bump width may vary with the width assigned to each electronic transition. In computing the absorption spectra of PAHs, we assume a width of for each electronic transition. To explore the effects of the assumed width of each electronic transition (), we consider and compare in Figure 7 the mean absorption spectra of PAHs obtained with with that obtained with . It is apparent that the bump width is not appreciably affected by , the width assigned to each electronic transition, except that the spectrum with exhibits many fine structures. Therefore, we admit that the interstellar extinction bump width remains unaccounted for by the PAH mixtures considered here, if they are uniformly weighted.
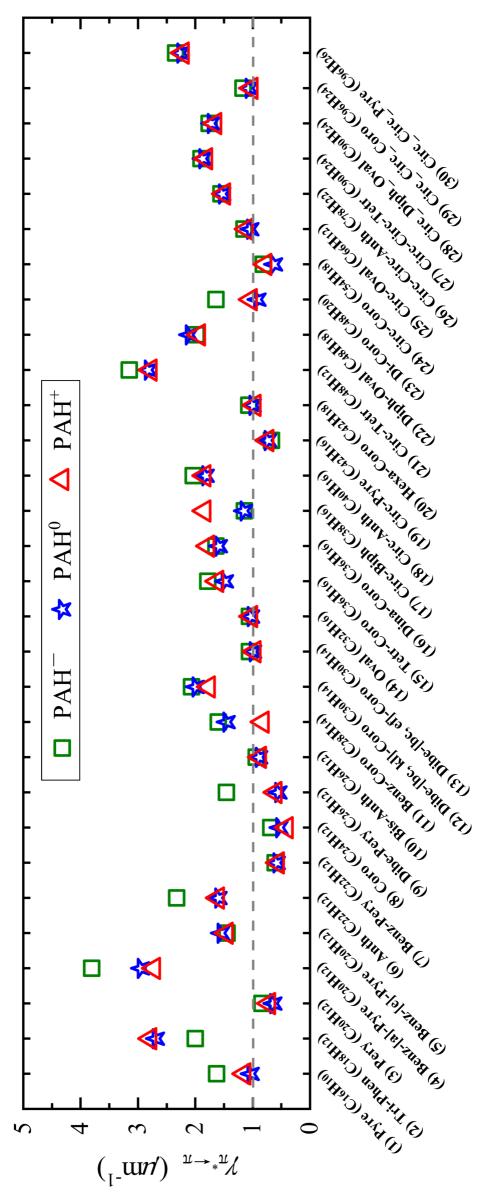
However, we should also note that this work is limited to 30 idealized PAH species, most of which are highly symmetric and undefective. While our results suggest that when uniformly weighted, such ideal PAHs are ruled out as being responsible alone for the interstellar extinction bump, it is difficult to disentangle accurate effects for specific PAHs. Therefore, we examine in Figure 8 the width of the transition of each PAH species, each in three charge states, with a width of assumed for each electronic transition. Figure 8 demonstrates that the bump widths are essentially the same for all PAH neutrals and cations except circumbiphenyl (C38H16; in Figure 1). In contrast, the bump widths of five (of 30) PAH anions are appreciably broader than that of neutrals and cations, and one PAH anion (triphenylene, C18H12; in Figure 1) shows a narrower bump than its neutral and cationic counterparts.
Figure 8 also clearly shows that the bump width varies considerably from one species to another, with 11 (of 30) species having a narrow width of . More specifically, small- and medium-sized, highly symmetric species exhibit a narrow bump (e.g., for coronene C24H12, for circumpyrene C42H16, and for circumcoronene C54H18). In addition, several small PAHs with a less compact structure also show narrow bumps (e.g., for perylene C20H12, for dibenzo[cd, lm]perylene C26H14, and for benzo[g, h, i]perylene C22H12). However, benzo[a]pyrene (C20H12; in Figure 1), a molecule also with a less compact structure, shows the broadest bump () in our sample. Triphenylene (C18H12; in Figure 1), another molecule with a less compact structure, also shows a broad bump (). Figure 8 also shows that “elongated” compact PAHs like circumtetracene (C48H12, in Figure 1; ), diphenalenoovalene (C48H18, in Figure 1; ), and circumcircumpyrene (C96H26, in Figure 1; ) exhibit broad bumps. Therefore, it is clear that a catacondensed or pericondensed structure alone does not determine the bump width.
Apparently, if we carefully select those molecules characterized by a bump width of (see Figure 8), a close fit to the mean observed bump width of would be achievable. However, the rationale for such a selection needs to be justified. As mentioned earlier, the molecules considered here are idealized. In the ISM, PAHs may include ring defects (e.g., see Yu & Nyman 2012), aliphatic components (e.g., see Yang & Li 2023a), oxygen or nitrogen substituents (Bauschlicher 1998, Hudgins et al. 2005, Mattioda et al. 2008), partial dehydrogenation (Malloci et al. 2018) and sometimes superhydrogenation (see Bernstein et al. 1996, Yang et al. 2020) or deuteration (see Hudgins et al. 2004, Yang & Li 2023b). To pin down which exact sets of PAH molecules are responsible for the observed interstellar extinction bump, we need to enlarge the sample by including these non-idealized PAH species. Nevertheless, it is promising that, as illustrated in Figure 8, a mixture of PAH species of certain sizes and structures apparently are capable of accounting for the observed bump width, if we assign appropriate weights to these molecules. In a subsequent paper, we will model the 2175 extinction bump observed for a number of representative interstellar sight lines in terms of PAH mixtures by, for each sight line, finding the appropriate weights for these molecules.
Finally, we note that, in addition to graphite and PAHs, carbon buckyonions composed of spherical concentric fullerene shells (Chhowalla et al. 2003, Iglesias-Groth et al. 2003, Ruiz et al. 2005, Li et al. 2008), and T-carbon (Ma et al. 2020), a carbon allotrope formed by substituting each atom in diamond with a carbon tetrahedron (Sheng et al. 2011), have also been suggested as a carrier of the interstellar extinction bump. It would be interesting to see if these candidate materials are capable of accommodating the observed characteristics of a stable peak wavelength at 2175 and a variable width around in the range of (Valencic et al. 2004).
4 Summary
We have examined PAHs as a possible carrier of the mysterious 2175 extinction bump by performing quantum chemical computations of the absorption spectra of a mixture of 30 compact PAH cations, anions and neutrals due to electronic transitions. Our principal results are as follows:
-
1.
While the absorption spectra of single PAH molecules exhibit sharp, individual features, for a mixture of many PAH species, the individual features of single species coalesce to form two broad, prominent absorption bands at 4.4 and 12, with the former arising from electronic transitions and the latter arising from transitions involving electrons.
-
2.
The absorption bump resulting from transitions peaks around 4.4, irrespective of PAH charge states. The bump position is at a somewhat longer wavelength than the 2175 (4.6) interstellar extinction bump. This is probably because TD-DFT computations tend to redshift the absorption bump compared to experimental, gas-phase spectra. On the other hand, the absorption bump tends to shift to longer wavelengths as the PAH size increases.
-
3.
The intensities of the absorption bump do not vary much among PAH cations, anions and neutrals. This differs from earlier experimental findings that, upon ionization, the absorption bump substantially weakens. Averaging over all three charge states, the intensity (or band strength) is . To account for the observed 2175 extinction bump in the diffuse ISM, one requires an abundance of to be in PAHs.
-
4.
The widths of the absorption bump of PAH mixtures are considerably broader than the interstellar extinction bump for otherwise randomly-selected and uniformly-weighted PAH mixtures, irrespective of the number, sizes, charge states of individual molecules and the width assigned to each individual electronic transition. To account for the observed bump width, it appears that a mixture of PAH species of specifically-selected sizes and structures (i.e., different weights for different molecules) are required.
Acknowledgements
We thank B.T. Draine and the anonymous referee for valuable suggestions. QL and XJY are supported in part by NSFC 12122302 and 11873041. AL is supported in part by NASA grants 80NSSC19K0572 and 80NSSC19K0701.
Data Availability
The data underlying this article will be shared on reasonable request to the corresponding authors.
References
- [] Allamandola, L.J., Tielens, A.G.G.M., & Barker, J.R. 1985, ApJ, 290, L25
- [] Battisti, A. J., Cunha, E. da ., Shivaei, I., et al. 2020, ApJ, 888, 108
- [] Bauschlicher, C. 1998, Chem. Phys., 233, 29
- [] Bernstein, M.P., Sandford, S.A., & Allamandola, L.J. 1996, ApJ, 472, L127
- [] Becke, A. D. 1993, J. Chem. Phys., 98, 1372
- [] Bianchi, L., Clayton, G. C., Bohlin, R. C., et al. 1996, ApJ, 471, 203
- [] Cardelli, J. A., Clayton, G. C., & Mathis, J. S. 1989, ApJ, 345, 245
- [] Cecchi-Pestellini, C., Malloci, G., Mulas, G., Joblin, C., & Williams, D. A. 2008, A&A, 486, L25
- [] Cherchneff, I., Barker, J. R., & Tielens, A. G. G. M. 1992, ApJ, 401, 269
- [] Chhowalla, M., Wang, H., Sano, N., Teo, K. B., Lee, S. B., & Amaratunga, G. A. 2003, Phys. Rev. Lett., 90, 155504
- [] Clayton, G. C., Gordon, K. D., & Wolff, M. J. 2000, ApJS, 129, 147
- [] Clayton, G. C., Gordon, K. D., Salama, F., et al. 2003, ApJ, 592, 947
- [] Clayton, G. C., Gordon, K. D., Bianchi, L. C., et al. 2015, ApJ, 815, 14
- [] Conroy, C., Schiminovich, D., & Blanton, M. R. 2010, ApJ, 718, 184
- [] Croiset, B. A., Candian, A., Berné, O., et al. 2016, A&A, 590, A26
- [] Dong, H., Li, Z., Wang, Q. D., et al. 2014, ApJ, 785, 136
- [] Draine, B.T. 1993, in ASP Conf. Ser. 58, The First Symposium on the Infrared Cirrus and Diffuse Interstellar Clouds, ed. R. Cutri & W. Latter (San Francisco: ASP), 227
- [] Draine, B.T. & Malhotra, S. 1993, ApJ, 414, 632
- [] Elíasdóttir, Á., Fynbo, J. P. U., Hjorth, J., et al. 2009, ApJ, 697, 1725
- [] Fano, U. 1961, Physical Review, 124, 1866
- [] Fitzpatrick, E. L., & Massa, D. 1986, ApJ, 307, 286
- [] Fitzpatrick, E. L., & Massa, D. 1988, ApJ, 328, 734
- [] Fitzpatrick, E. L., & Massa, D. 2007, ApJ, 663, 320
- [] Frenklach, M. & Feigelson, E. D. 1989, ApJ, 341, 372
- [] Frisch, M. J., Pople, J. A., & Binkley, J. S. 1984, J. Chem. Phy., 80, 3265
- [] Gordon, K. D. & Clayton, G. C. 1998, ApJ, 500, 816
- [] Gordon, K. D., Clayton, G. C., Misselt, K. A., Landolt, A.U., & Wolff, M.J. 2003, ApJ, 594, 279
- [] Gordon, K. D., Clayton, G. C., Decleir, M., et al. 2023, ApJ, 950, 86
- [] Hirata, S., Lee, T. J., & Head-Gordon, M. 1999, J. Chem. Phys., 111, 8904
- [1] Hudgins, D. M., Bauschlicher, C. W., Jr., & Sandford, S. A. 2004, ApJ, 614, 770
- [] IHudgins, D.M., Bauschlicher, C W.J., & Allamandola, L.J. 2005, ApJ, 632, 316
- [] Iglesias-Groth, S., Ruiz, A., Bretón, J., & Gomez Llorente, J. M. 2003, J. Chem. Phys., 118, 7103
- [] Kriek, M. & Conroy, C. 2013, ApJ, 775, L16
- [] Jiang, P., Ge, J., Zhou, H., Wang, J., & Wang, T. 2011, ApJ, 732, 110
- [] Joblin, C. 1992, PhD Thesis, Université Paris 7
- [] Joblin, C., Léger, A., & Martin, P. 1992, ApJ, 393, L79
- [] Lawton, B., Churchill, C. W., York, B. A., Ellison, S. L., Snow, T. P., Johnson, R. A., Ryan, S. G., & Benn, C. R. 2008, AJ, 136, 994
- [] Lee, W. & Wdowiak, T. J. 1993, ApJ, 410, L127
- [] Léger, A., & Puget, J. 1984, A&A, 137, L5
- [] Li, A., & Draine, B. T. 2001, ApJ, 554, 778
- [] Li, A., Chen, J.H., Li, M.P., Shi, Q.J., & Wang, Y.J. 2008, MNRAS, 390, L39
- [] Liang, S. L., & Li, A. 2009, ApJ, 690, 56
- [] Liang, S. L., & Li, A. 2010, ApJ, 710, 648
- [] Ma, J., Caucal, P., Noterdaeme, P., et al. 2015, MNRAS, 454, 1751
- [] Ma, J., Ge, J., Zhao, Y., et al. 2017, MNRAS, 472, 2196
- [] Ma, X.Y., Zhu, Y.Y., Yan, Q.B., You, J.Y., & Su, G. 2020, MNRAS, 497, 2190
- [] Maíz Apellániz, J. & Rubio, M. 2012, A&A, 541, A54
- [] Malloci, G., Mulas, G., & Joblin, C. 2004, A&A, 426, 105
- [] Malloci, G., Mulas, G., Cecchi-Pestellini, C., & Joblin, C. 2008, A&A, 489, 1183
- [] Marques, M. A. L., Castro, A., Bertsch, G. F., et al. 2003, Computer Physics Communications, 151, 60
- [] Massa, D., Gordon, K. D., & Fitzpatrick, E. L. 2022, ApJ, 925, 19
- [] Mathis, J.S. 1994, ApJ, 422, 176
- [] Mattioda, A.L., Rutter, L., Parkhill, J., et al. 2008, ApJ, 680, 1243
- [] Misselt, K. A., Clayton, G. C., & Gordon, K. D. 1999, ApJ, 515, 128
- [] Motta, V., Mediavilla, E., Muñoz, J. A., et al. 2002, ApJ, 574, 719
- [] Noll, S., Pierini, D., Pannella, M., & Savaglio, S. 2007, A&A, 472, 455
- [] Noll, S., Pierini, D., Cimatti, A., et al. 2009, A&A, 499, 69
- [] Prochaska, J. X., Sheffer, Y., Perley, D. A., et al. 2009, ApJL, 691, L27
- [] Robinson, M. S., Beegle, L. W., & Wdowiak, T. J. 1997, ApJ, 474, 474
- [] Ruiz, A., Bretón, J., & Gomez Llorente, J. M. 2005, Phys. Rev. Lett., 94, 105501
- [] Sheng X.L., Yan Q.B., Ye F., Zheng Q.R., & Su G. 2011, Phys. Rev. Lett., 106, 155703
- [] Shivaei, I., Boogaard, L., Díaz-Santos, T., et al. 2022, MNRAS, 514, 1886
- [] Srianand, R., Gupta, N., Petitjean, P., Noterdaeme, P., & Saikia, D. J. 2008, MNRAS, 391, L69
- [] Stecher, T. P. 1965, ApJ, 142, 1683
- [] Stecher, T. P. & Donn, B. 1965, ApJ, 142, 1681
- [] Steglich, M., Jäger, C., Rouillé, G., Huisken, F., Mutschke, H., & Henning, T. 2010, ApJ, 712, L16
- [] Steglich, M., Carpentier, Y., Jäger, C., et al. 2012, A&A, 540, A110
- [] Valencic, L. A., Clayton, G. C., & Gordon, K. D. 2004, ApJ, 616, 912
- [] Wang, J., Hall, P. B., Ge, J., Li, A., & Schneider, D. P. 2004, ApJ, 609, 589
- [] Wang, Y., Gao, J., & Ren, Y. 2022, ApJS, 259, 12
- [] Witstok, J., Shivaei, I., Smit, R., et al. 2023, Nature, in press (arxiv:2302.05468)
- [] Yang, X. J., & Li, A. 2023a, ApJS, in press
- [] Yang, X. J., & Li, A. 2023b, ApJS, in press
- [] Yang, X. J., Li, A., & Glaser, R. 2020, ApJS, 247, 1
- [] York, B. A., Ellison, S. L., Lawton, B., Churchill, C. W., Snow, T. P., Johnson, R. A., & Ryan, S. G. 2006, ApJ, 647, L29
- [] Yu, H.G., & Nyman, J. 2012, ApJ, 751, 3
- [] Zafar, T., Watson, D., Fynbo, J. P. U., et al. 2011, A&A, 532, A143
- [] Zafar, T., Watson, D., Elíasdóttir, Á., et al. 2012, ApJ, 753, 82
- [] Zhou, H., Ge, J., Lu, H., Wang, T., Yuan, W., Jiang, P., & Shan, H. 2010, ApJ, 708, 742
| Species | ||||||||
|---|---|---|---|---|---|---|---|---|
| () | () | () | () | () | () | |||
| 20.15 2.12 | 4.45 0.03 | 1.52 0.09 | 2.16 0.11 | 12.13 0.05 | 7.00 0.10 | 3.13 0.09 | ||
| 21.25 1.93 | 4.35 0.03 | 1.56 0.08 | 1.67 0.08 | 12.27 0.05 | 7.65 0.09 | 3.57 0.10 | ||
| 21.11 1.59 | 4.41 0.02 | 1.56 0.07 | 1.88 0.07 | 12.26 0.04 | 7.39 0.07 | 3.35 0.07 | ||
| Average | 21.20 1.72 | 4.40 0.02 | 1.56 0.07 | 1.90 0.08 | 12.22 0.05 | 7.34 0.08 | 3.34 0.08 |