TBD Journal \DOIDOI HERE \accessAdvance Access Publication Date: Day Month Year \appnotesPaper
Hamed et al.
[]Corresponding author. email-id.com
0Year 0Year 0Year
Challenging the Machinery of Generative AI with Fact-Checking: Ontology-Driven Biological Graphs for Verifying Human Disease-Gene Links
Abstract
Background: Since the launch of various generative AI tools, scientists have been striving to evaluate their capabilities and contents, in the hope of establishing trust in their generative abilities. Regulations and guidelines are emerging to verify generated contents and identify novel uses. Objective: we aspire to demonstrate how ChatGPT claims are checked computationally using the rigor of network models. We aim to achieve fact-checking of the knowledge embedded in biological graphs that were contrived from ChatGPT contents at the aggregate level. Methods: We adopted a biological networks approach that enables the systematic interrogation of ChatGPT’s linked entities. We designed an ontology-driven fact-checking algorithm that compares biological graphs constructed from approximately 200,000 PubMed abstracts with counterparts constructed from a dataset generated using the ChatGPT-3.5 Turbo model. Results: in 10-samples of 250 randomly selected records a ChatGPT dataset of 1000 “simulated” articles , the fact-checking link accuracy ranged from 70% to 86%. The computational process was followed by a manual process using IntAct Interaction database and the Gene regulatory network database (GRNdb) to confirm the validity of the links identified computationally. We also found that the proximity of the edges of ChatGPT graphs were significantly shorter (90 – 153) while literature distances were (236 – 765). This pattern held true in all 10-samples. Conclusion: This study demonstrated high accuracy of aggregate disease-gene links relationships found in ChatGPT-generated texts. The strikingly consistent pattern offers an illuminate new biological pathways that may open the door for new research opportunities.
keywords:
ChatGPT, fact-checking, generative AI, biological graphs, biological ontology, network medicine1 Introduction
1.1 Significance
The rise of new generative AI technologies holds both potential and concerns. Particularly, the emergence of ChatGPT chatgpt , caused the scientists to raise various concerns related to the capabilities and the inauthentic contents of such tools. Van Dis et al. identified five key priorities aimed at educating the general public about the potential of ChatGPT and formulating an effective response to this transformative AI tool. Among the 5 guidelines, fact-checking and human verification of ChatGPT contents was highlighted van2023chatgpt . Being inspired by such guidelines, here we present our work on computational fact-checking of biological networks, which we constructed from ChatGPT-generated content. The utilization of biological ontology (Disease Ontology, Gene Ontology, Gene Ontology Annotations), give credibility to the biological terms that make up the nodes of the graphs. Using biological entities from ontology to extract and construct biological graphs from the biomedical literature offers a trustworthy notion of ground truth. Using network models and algorithms offer the rigor needed to perform fact-checking on the aggregate level. This study assumes a closed-world assumption, which sets the fact-checking scope within the knowledge embedded in the literature dataset, by not beyond.
1.2 Literature Review of Fact-Checking using Knowledge Graphs and Ontologies
Knowledge graphs have been instrumental in advancing fact-checking methodologies, enabling structured and nuanced analyses of claims and assertions. Tchechmedjiev et al. introduced ClaimsKG, a comprehensive knowledge graph that houses fact-checked claims, allowing informed queries on truth values and related aspects tchechmedjiev2019claimskg . Vedula and Parthasarathy’s work stood out by introducing FACE-KEG, a knowledge graph tailored to expound whether a statement is true or false, addressing the transparency gap in fact-checking vedula2021face . Lin et al. made strides with ontology-based subgraph patterns, constructing graph fact-checking rules that integrate intricate patterns, capturing both topological and ontological constraints lin2018discovering ; lin2018fact ; lin2019discovering . Notably, Ciampaglia et al. laid a foundation for fact-checking by leveraging knowledge graphs to scrutinize claims, drawing from reliable sources like Wikipedia ciampaglia2015computational .
Wang et al. harnessed entity category information, using prototype-based learning to enhance verification accuracy and reasoning capabilities in KG-based fact-checking, marking a significant advancement in this domain Wang2020 . Khandelwal et al.’s approach encompassed structured and unstructured data from Knowledge Graphs to address the challenge of evaluating facts amidst growing data and misinformation Khandelwal2020 . Orthlieb et al.’s attention-based Path Ranking model exhibited promise in automating fact-checking through Knowledge Graphs, emphasizing interpretability and competitive results Orthlieb2021 . Another notable contribution came from Shi, who introduced ProjE, a neural network model that improved the completion of knowledge graphs and the accuracy of fact-checking Shi2017 .
Recent advancements further underpin the significance of knowledge graphs in fact-checking. The approach of Wang et al. leveraged category hierarchy and attribute relationships, showcasing the potential of knowledge structure in fact verification Wang2022 . Amidst the COVID-19 outbreak, Mengoni’s extended Knowledge Graph enabled enhanced claim validation through leveraging existing fact-checking reports Mengoni2022 . Kim introduced weighted logical rules mining and evidential path identification in knowledge graphs, enhancing computational fact-checking Kim2020 ; Kim2021 . Zhu et al. designed a knowledge-enhanced fact-checking system, tapping into both unstructured document knowledge bases and structured graphs to robustly identify misinformation Zhu2021 .
Approaches incorporating knowledge graphs have emerged as vital pillars in computational fact-checking. Lin et al.’s diverse methods, encompassing ontological knowledge graphs and utilizing discriminant subgraph structures, offered comprehensive solutions Lin2017 ; Lin2018 ; Lin2019 . Shahi’s contribution was particularly timely, introducing FakeKG, a Knowledge Graph-Based approach aimed at countering misinformation during crises and elections Shahi2023 . Qudus et al.’s hybrid fact-checking approach, encompassing multiple categories, demonstrated superior performance in ensemble learning Qudus2022 . Meanwhile, Shiralkar et al.’s network-flow-based knowledge graph method addressed the challenge posed by the abundance of online information Shiralkar2017 .
Liu et al.’s KompaRe introduced a system for comparative reasoning across knowledge graphs, broadening reasoning capabilities beyond conventional methods Liu2021 . Luo et al.’s work emphasized the significance of fact-checking in detecting fake news, highlighting methodologies like Knowledge Linker, PredPath, and Knowledge Stream Luo2021 . Shi’s approach to fact-checking in knowledge graphs, treated as a link-prediction problem, exhibited promising outcomes Shi2016 . These contributions collectively illustrate the dynamic landscape of knowledge graph-based fact-checking and its evolving potential to enhance information accuracy and credibility.
2 Methods
In this section, we present a comprehensive methodology for constructing a reliable knowledge framework to assess the quality of content generated using ChatGPT. Our approach is centered around the utilization of biological graphs as rigorous models that offer quantitative analysis objective outcomes. Graphs as a tool as also being investigated for the advancement of Large Language Models (LLMs) pan2023unifying and ChatGPT technologies yang2023chatgpt .
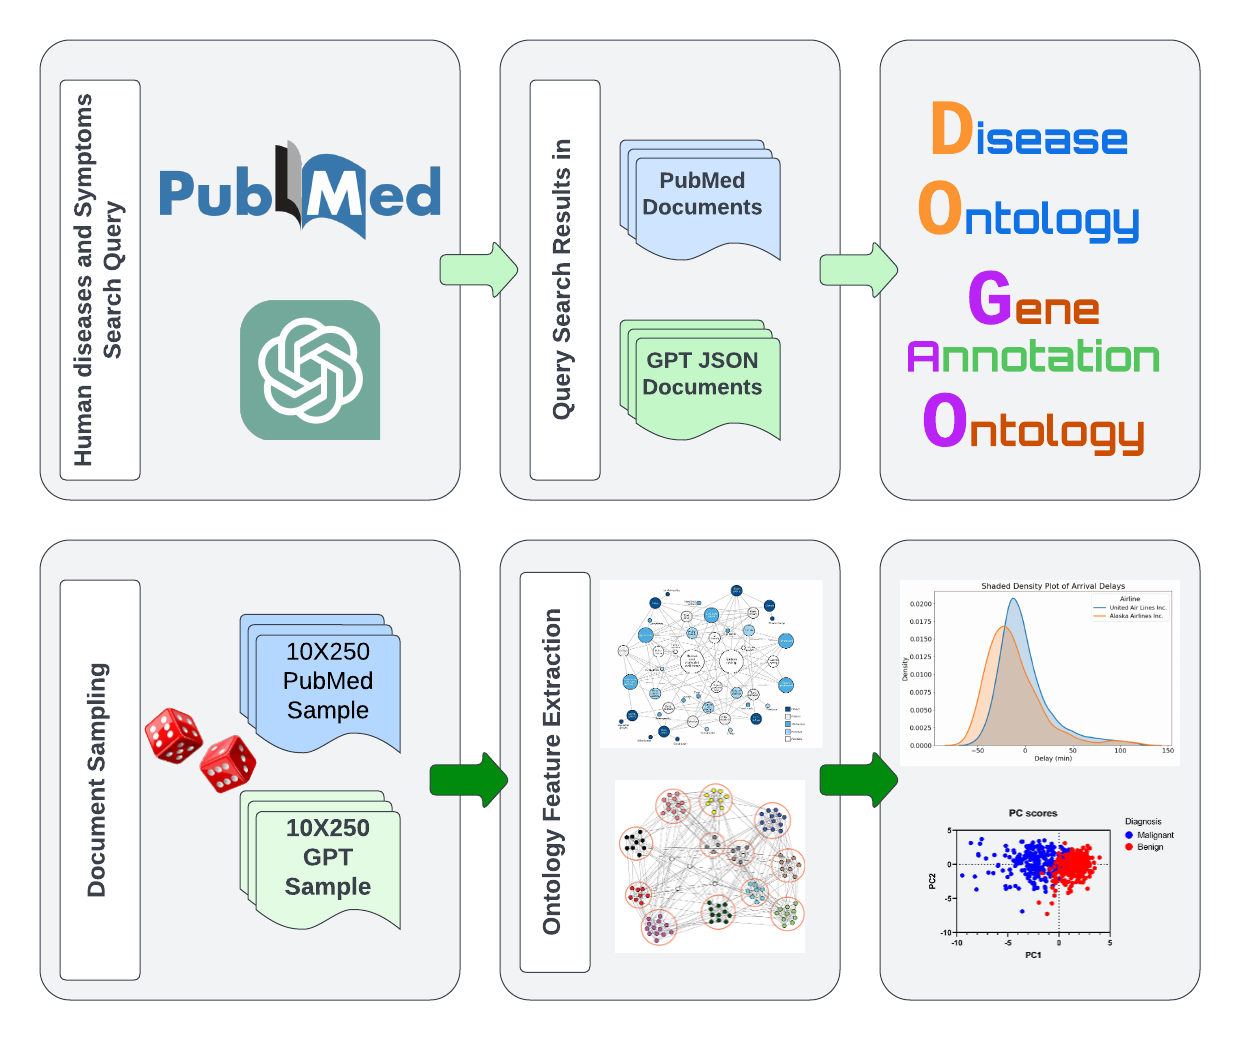
The proposed approach integrates five key aspects which as a whole contribute to verification of the authenticity and accuracy of AI-generated biomedical text: (1) ChatGPT prompt-engineering and simulated-articles generation, (2) Partial-Match Ontology Term Chunking to increase the recall of terms matching, (3) ontology feature extraction, where we use the partial terms as means of features to be identified in the PubMed and ChatGPT text, (4) proximity-based biological graphs construction for capturing the strongest links among the biological terms, (5) biological graph topological analysis, by analyzing the structural properties of each type and comparing them accordingly, (6) algorithmic fact-checking to assert the facts. Figure 1 shows a graphical abstract of our approach in the various steps.
2.1 Prompt-Engineering ChatGPT for Simulated-Articles Generation
Using the ChatGPT APIs, we engineered a prompt that has two roles: (1) the system role: which to command the ChatGPT engine to generate biomedical abstracts, (2) a user role which explicitly command ChatGPT of the task ahead using the following Algorithm with a 1, repeat as necessary until you produce the dataset of the size desired.
2.2 Feature Extraction and Biological Graph Construction
Ontology terms are inherently detailed and lengthy. In biomedical literature, these long names are frequently abbreviated for convenience. For instance, the term “female breast cancer” is often referred to as “breast cancer” in text. This observation led us to divide the ontology terms into bigrams and search for each partial term match in both literature sources (such as PubMed records) and those generated by ChatGPT. This approach resulted in bigram chunks derived from the original ontology terms. Importantly, we maintained a connection between these bigrams and their corresponding original term IDs in the ontology, while also tracking their positions. Ontology terms are inherently detailed and lengthy. In medical literature, these long names are frequently shortened for convenience. For instance, the term “female breast cancer” is often referred to as “breast cancer” in text. This observation led us to divide the ontology terms into bigrams and search for each partial term match in both literature sources (such as PubMed records) and those generated by ChatGPT. This approach resulted in bigram chunks derived from the original ontology terms. Importantly, we maintained a connection between these bigrams and their corresponding original term IDs in the ontology, while also tracking their positions. Constructing the knowledge graphs required the following steps: (1) feature extraction using the diseases and gene ontology and (2) establishing the links among the terms extracted. Algorithm 2 outlines the first step, and Algorithm 3 outlines the second step.
Algorithm 2 performs Ontology Feature Extraction from text. It takes a collection of abstracts and an ontology containing terms as input. For each record, it identifies matches of ontology terms (and related bigrams) within the text. The algorithm iterates through each record and, for each term in the ontology, checks if the term appears in the record. If the term consists of a single word, the algorithm records the position of the match, the term itself, and other relevant information. For terms with more than one word, the algorithm generates bigrams (pairs of adjacent words) and checks for their presence in the record. If found, it records the position, term, bigram, and additional information. The algorithm returns a set of matches for each record, indicating where ontology terms and bigrams were found within the text.
Algorithm 3 outlines the process of constructing a Disease-Gene Knowledge Graph. This algorithm takes as input a collection of text records and builds a knowledge graph that captures relationships between diseases and genes. It iterates through each record, creating nodes to represent both the source document, metadata, and the ontology features (diseases or genes) mentioned in the each record. For each feature, the algorithm constructs and updates properties, and then establishes links to the corresponding document node. It calculates proximity distances and identifies minimal distances between related features, contributing to the creation of edges in the knowledge graph. The output of the algorithm is the Disease-Genes Knowledge Graph, a structured representation that provides insights into the connections between diseases and genes. This graph serves as a platform for network analysis, aiding in understanding the factual disease-Genes relationships, and assessing the generation of new insights created by ChatGPT.
As for the graph construction, the algorithms distinguished two different types of links: (a) one that is established from the co-occurrences of the terms in the same record and, therefore, directly connects each document ID — PubMedID and GPTID — with a directed arc to a disease or a term bigram found, and (b) the links between the disease and genes, which we establish based on the minimum proximity correia2016monitoring ; simas2015distance among the terms of the entire dataset. This method does not establish links between terms of the same type (i.e., diseases that co-occur in the same document). The proximity distance between words and within a window of length is denoted as . In this context, and represent words of interest, and represents the minimum window length between words.
2.3 Chat Fact-Checking Algorithm
The objective of this work is to investigate the authenticity of contents gathered from ChatGPT and other generative AI models, and to test whether such contents may bridge the disease–Genes gap in our understanding. In this regard, we propose an algorithmic approach that captures how much true knowledge is stated in our ground truth knowledge graphs and also identifies what may be considered noise or novelties. The idea is that the outcomes reported by the execution of this algorithm provide fact-checking statistics that enable us to thoroughly assess the credibility of contents produced by ChatGPT (and potentially any other analogous AI models).
Here, we introduce a brute-force algorithm designed to systematically compute the number of edges in a ChatGPT-generated graph that coincides with the corresponding graph derived from PubMed records. While being in the search space, the algorithm also tracks the link to discern each type and evaluate the balance in the facts founds. The algorithm executes by processing each ChatGPT graph from the 10 constructed, one graph at a time. It extracts all links before it also process one link at a time, and check it against the ground truth graph constructed from PubMed. Algorithm 4 outlines the precise procedure for fact-checking the 10-sample ChatGPT graphs. The algorithm is designed to execute 5 computational phases: (1) initialization: signaled by the Require keyword, (1) matching edges: (Lines 1 2), (2) Fact-checking: (Lines 3 7), (3) identification of link types: (Lines 4), (4) calculation and reporting: this is the final phase the algorithm calculates the number of facts found and their types (Lines 8 19)
3 Results
3.1 Construction of Biological Graphs
We constructed two different undirected but weighted graphs of disease and genes nodes. The first type one was constructed publication-driven from the mentions of disease and genes occurring in a dataset of biomedical abstracts extracted from PubMed Central PMC . A disease and a gene are connected if they occur in the same abstract. Then the link is weighted with the distance among the terms. Both gene and diseases names are ontology terms from the Human Disease Ontology (DOID) Hofer2017 ; Sow2019 , and the Gene Ontology and Annotation (GOA) Huntley2015 ; Blake2013 ; Camon2003 ; Barrell2009 . The type of network is constructed from a ChatGPT dataset where the nodes are also disease and genes. Here, also a disease and a gene are connected when they co-occur in the same ChatGPT document. Similarly, the edge is also encoded with the distance among the disease-gene terms. Given the authenticity and legitimacy of of the scientific publications, we treated the first type of network as the ground-truth benchmark to evaluate the other ChatGPT-driven types. From the the publication-driven dataset the graph produced (9997 # of nodes: and 121589 # of edges:). As for the ChatGPT-driven dataset, we sampled 10 samples where each sample was comprised of 250 records produced for network topology investigations and fact-checking.
3.2 Topological Comparison of Biological Graphs
Here we introduced various network-based metrics that compare the GPT graphs with PubMed Graphs where were constructed from random sample of the two independent datasets (PubMed Central Abstract and ChatGPT simulated abstracts). Table 1 encapsulates the essential metrics pertaining to each type of the knowledge graphs (i.e., PubMed and ChatGPT counterparts). Each consecutive rows embodies a distinct scenario for a given metric, while the columns reference the dataset selected randomly by a given seed. The ”No. of Nodes” 2-row denotes the count of all nodes, which symbolize diseases, genes. The “No. of Edges” 2-row unit quantifies the interconnections between nodes, reflecting relationships (e.g., disease - gene) or interactions (protein - protein). The “N/E Ratio” 2-row unit computes the balance between nodes and edges, potentially demonstrating the network complexity of each graph. The “No. of Diseases” 2-row enumerates disease-related nodes, while “No. of Genes” 2-row unit does the same for genes. The “No. of Disease-Gene Links” 2-row unit indicates associations between diseases and genes. “No. of Disease-Disease Links” underscores connections between different diseases. Lastly, “Number of Gene-Gene Links” 2-row unit unveils interactions among gene nodes. Collectively, this table provides an intricate glimpse into the network’s composition, connectivity, and relationships within the biological and medical framework, fostering a deeper understanding of its underlying dynamics of each type.
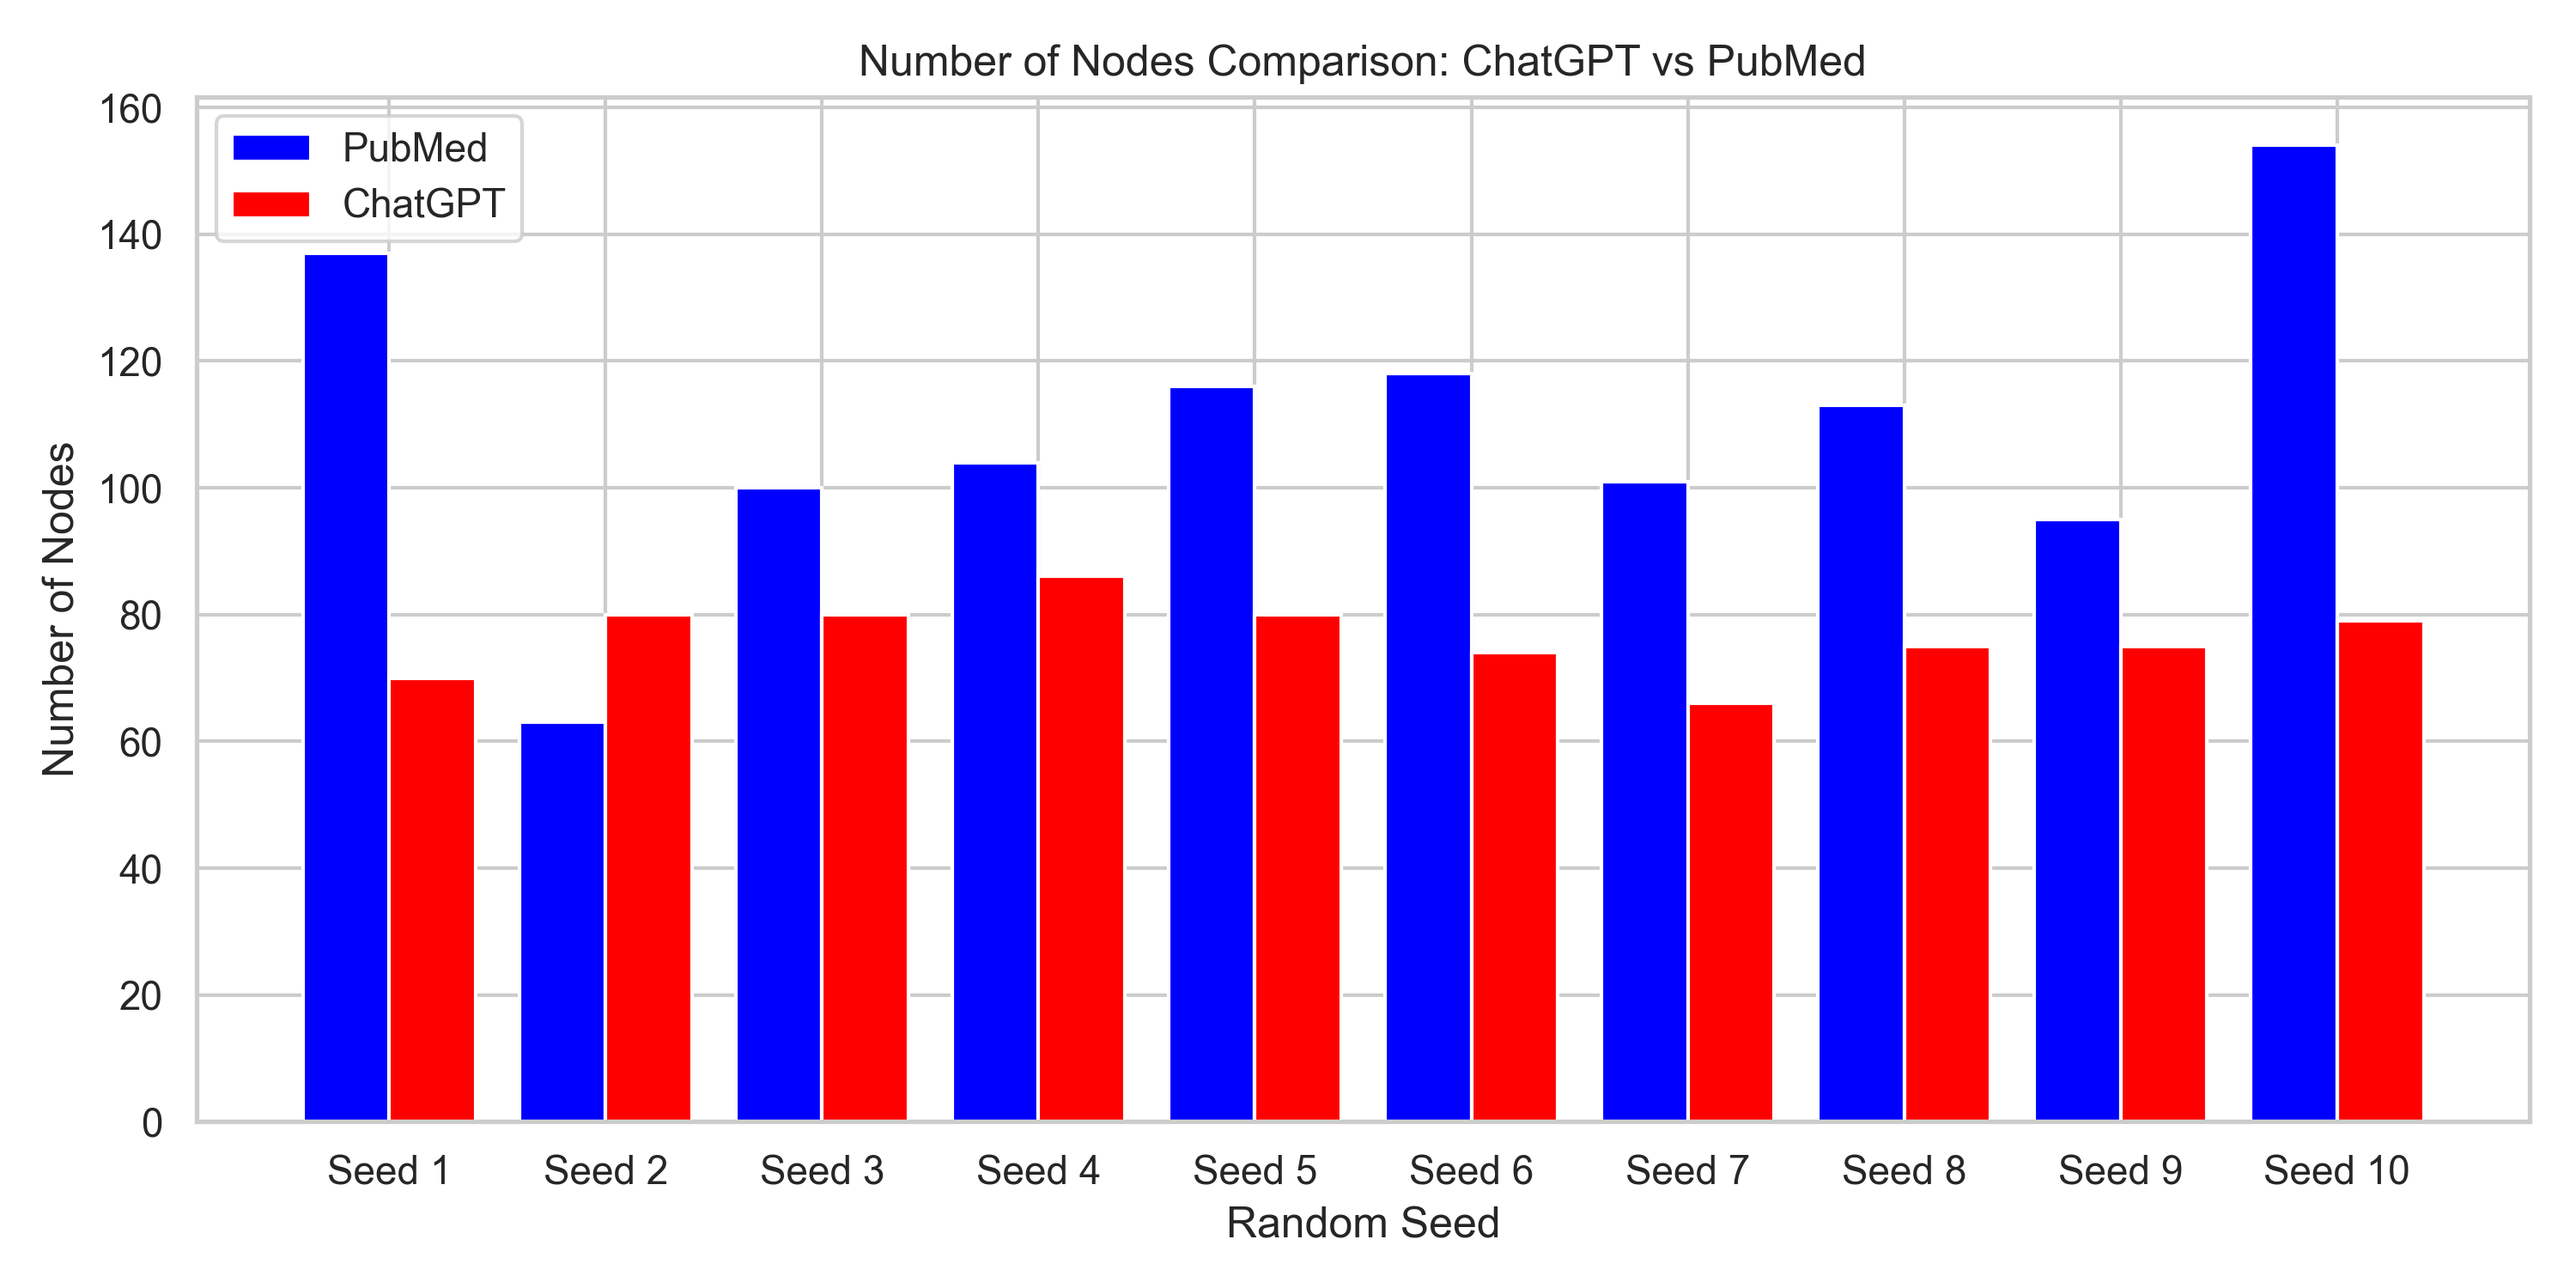
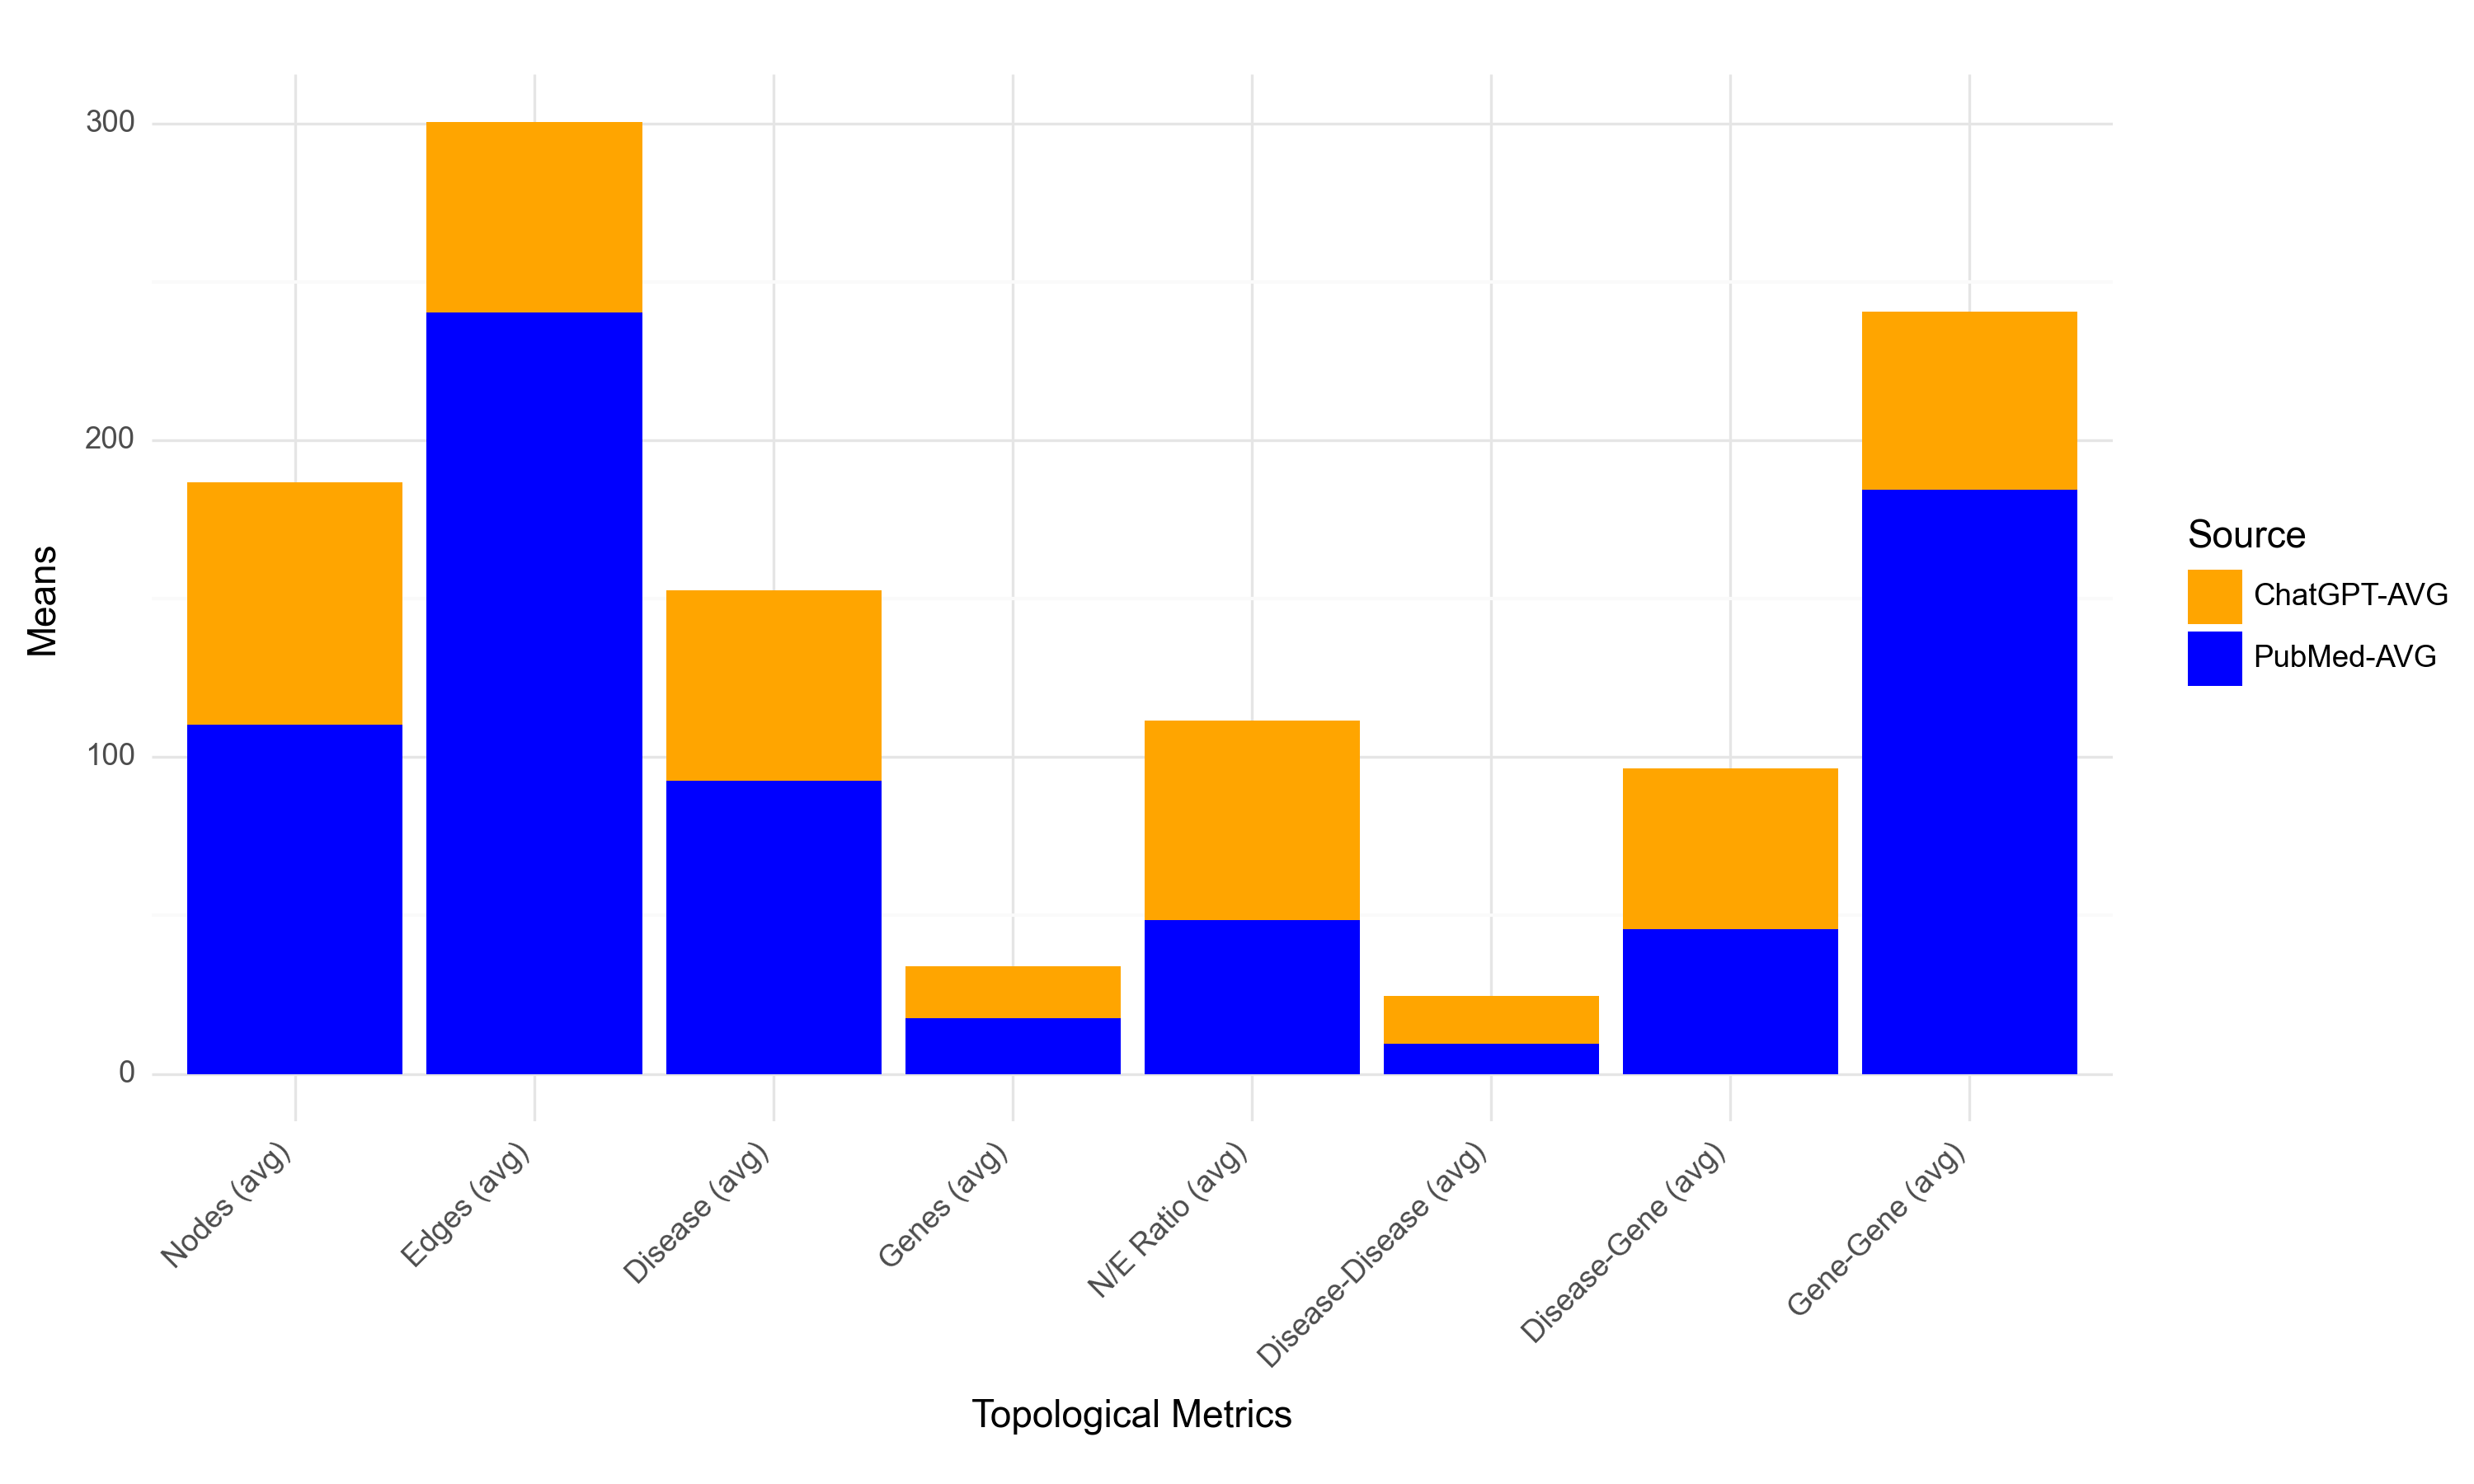
Table 2 presents a comprehensive comparison of various metrics between the ChatGPT and PubMed biological graphs . These metrics shed light on the mean differences in node and edge, as well as the ratios of nodes to edges. Notably, the node mean in the ChatGPT graphs is 76.50, while the PubMed graphs exhibit a higher count of 110.10 nodes. Similarly, the ChatGPT graphs contain a mean value of 16.40 gene nodes and 60.10 disease nodes, compared to the PubMed graphs’ 17.50 gene nodes and 92.60 disease nodes.
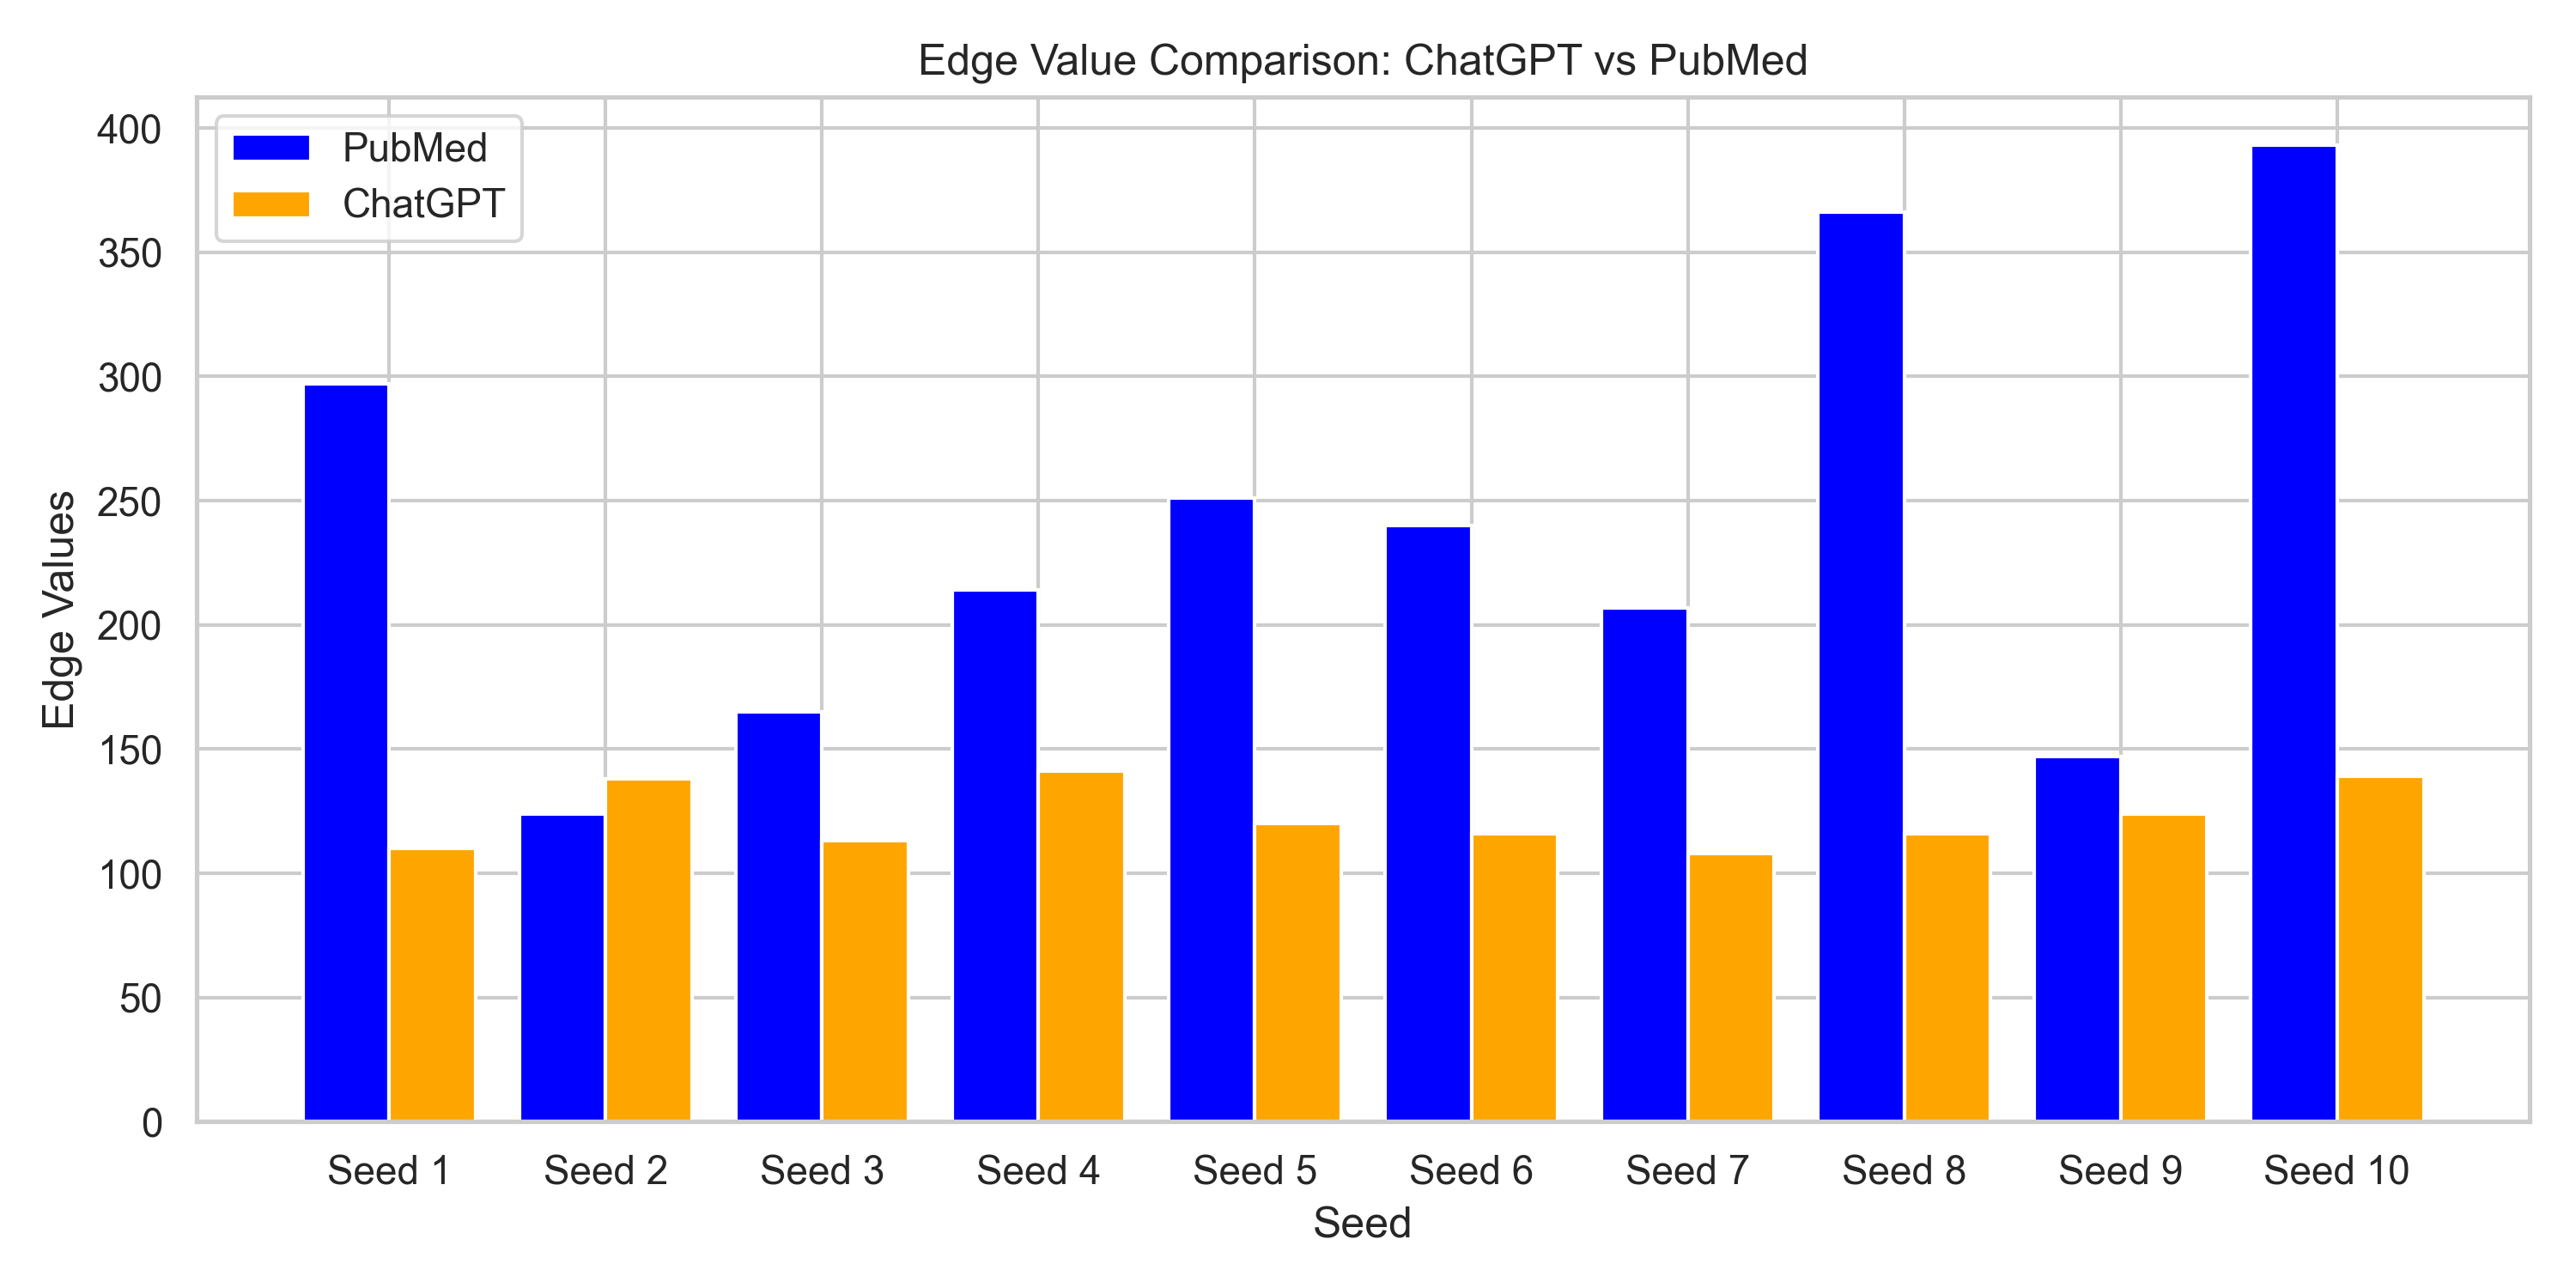
When studying the means of the various edge and their types, the ChatGPT graphs have a value of 60.10 for edges, whereas the PubMed graphs show a significantly higher mean value of 240.40 for their edges. Moreover, the mean value of the gene-gene links in the ChatGPT graphs recorded 56.30, contrasting with the PubMed graphs’ mean value of 184.30 for the same type of links. A distinctive aspect is the presence of disease-disease and disease-gene links, where the ChatGPT graphs surpass the PubMed graphs in both disease-disease links mean value (15.10 versus 9.60) and disease-gene links (50.60 versus 45.70) mean values, respectively.
These observations are captured in Figure 3 suggest that PubMed graphs are more comprehensive and informative than ChatGPT graphs. They also suggest that ChatGPT graphs may be better at capturing relationships between biological entities, while PubMed graphs may be better at capturing individual biological entities.
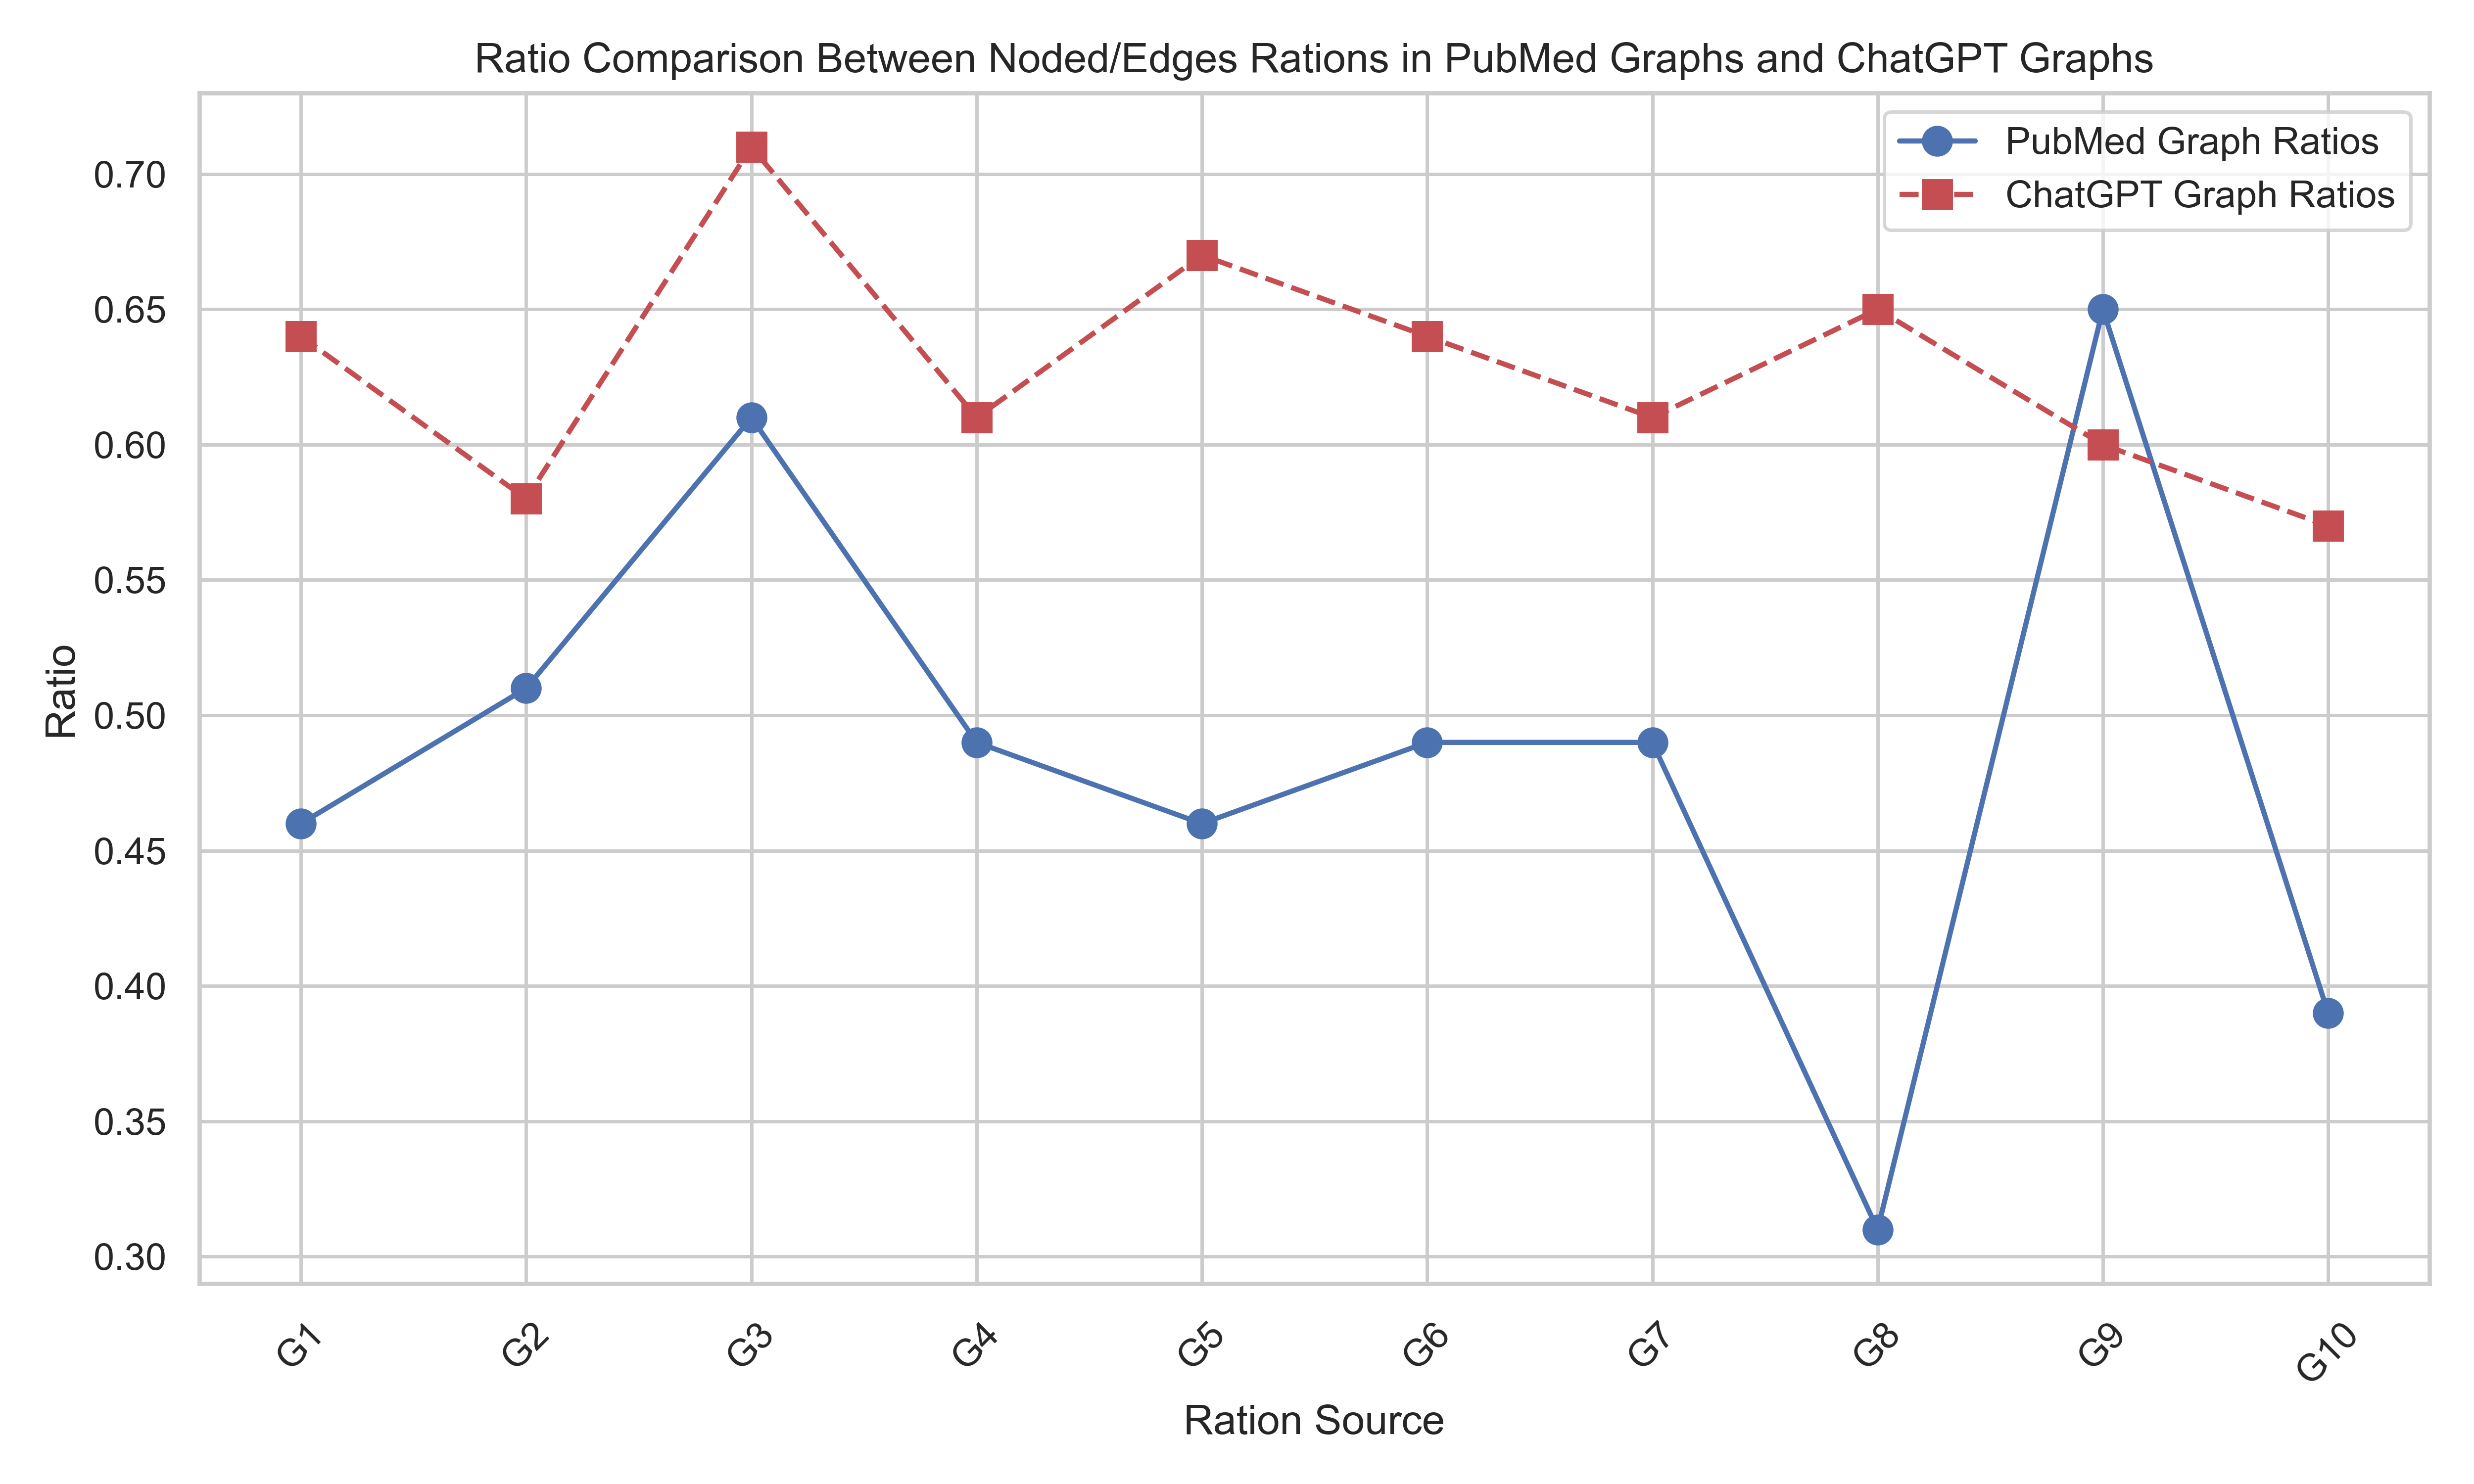
Another expected observation is that the ratio of nodes to edges of ChatGPT were much higher that PubMed counterparts, in 9 out of 10 graphs. While the ratio PubMed ranged from (0.32 – 0.65), the ratios of ChatGPT ranged (0.60 – 0.71). This is an indications of how PubMed generated graphs are highly connected, and much more complex than ChatGPT graphs. The ninth graph, however, has shown a higher complexity and interconnectedness that surpassed the PubMed counter part and present an anomalous behavior that warrants further investigation. Figure 6 confirm the patterns and the anomaly of the 10 graphs.
3.3 Proximity Analysis
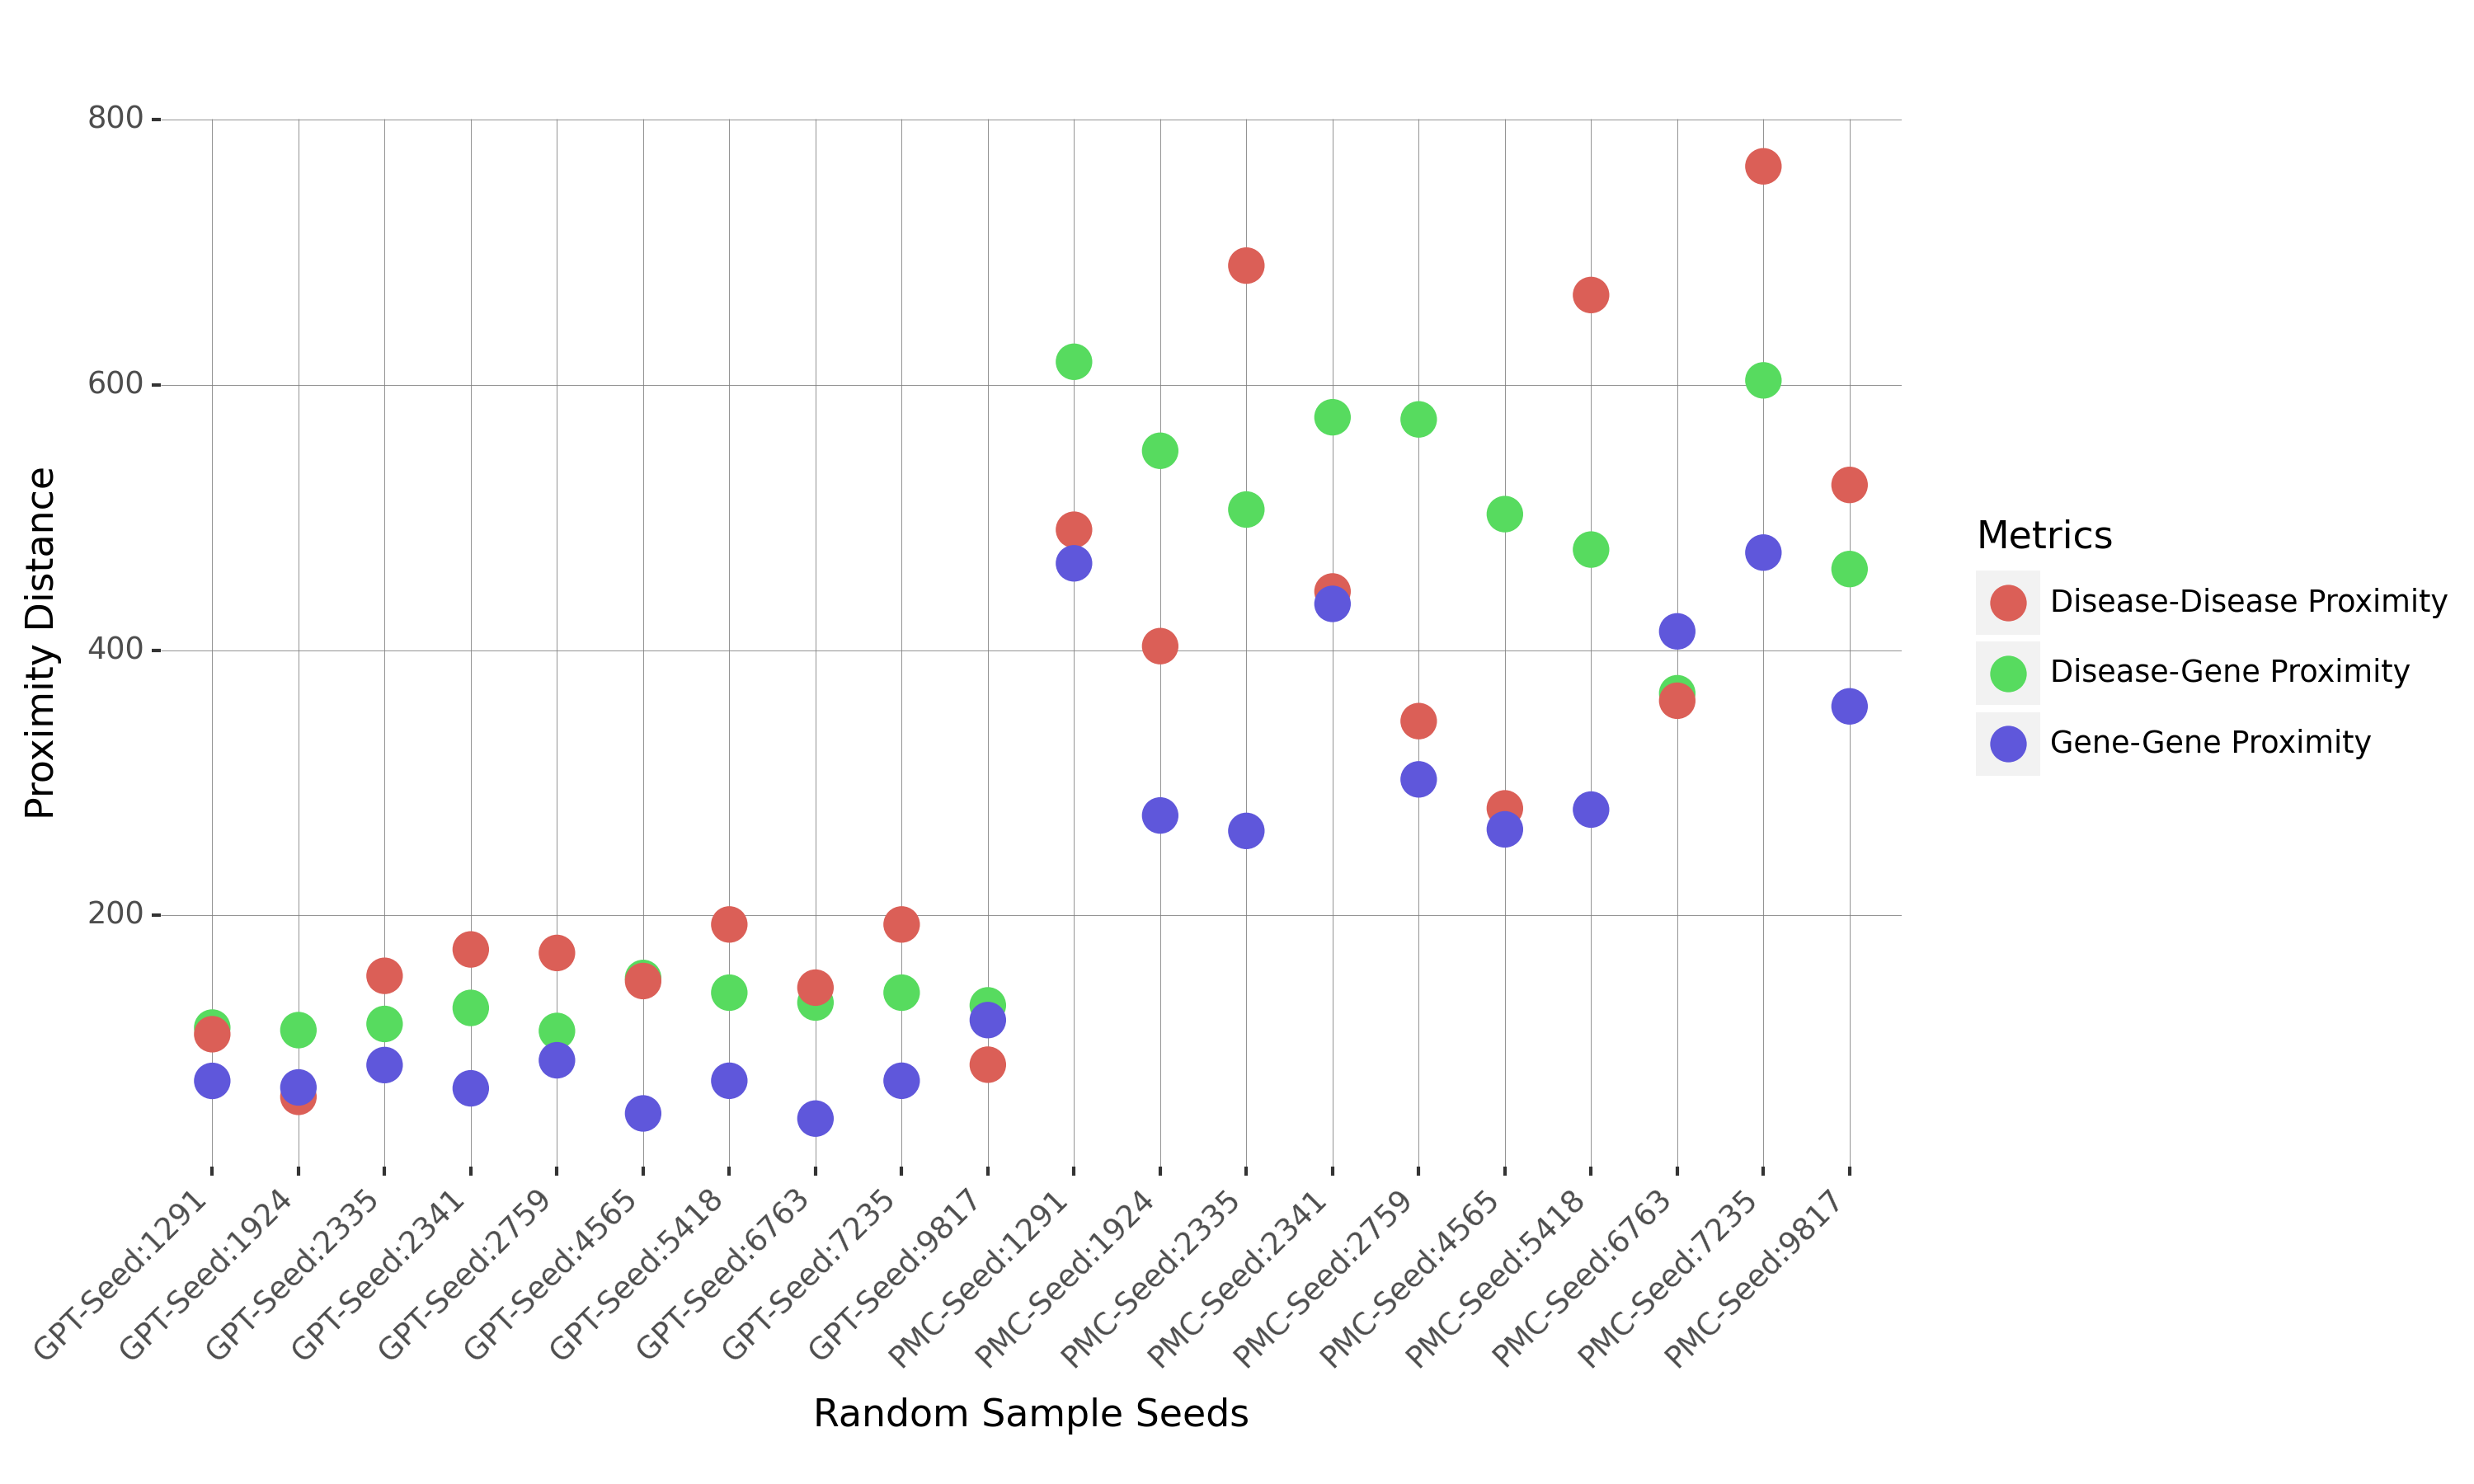
Upon careful examination of the proximity values in Table 3, a clear and consistent pattern emerges: GPT consistently generates significantly smaller values compared to PMC. This trend holds true for all proximity metrics: (Disease-Gene), (Disease-Disease), and (Gene-Gene). This remarkable consistency underscores GPT’s tendency to yield lower proximity values among biological terms than PubMed, portraying distinct proximity trends between the two sets of sources.
Analyzing the proximity values for both PubMed and GPT sources, it becomes evident that GPT consistently yields smaller proximity values across all three metrics: (Disease-Gene), (Disease-Disease), and (Gene-Gene). To quantify this observation, we computed the range (max-min) for each proximity metric. For the proximity of Disease-Gene, PubMed exhibits a range of [617.54, 236.76], while GPT’s range is much narrower at [112.66, 152.64]. Similarly, for Disease-Disease, PubMed’s range spans [280.00, 765.00], whereas GPT’s range is [62.95, 193.00]. Lastly, in the case of Gene-Gene, PubMed’s range reaches [263.59, 465.47], while GPT’s range is comparatively higher at [46.54, 90.54]. These ranges further underscore the consistent trend of GPT consistently producing notably smaller proximity values compared to PubMed across all the three proximity metrics, showcasing a distinct and significant disparity in proximity trends. Figure 4 confirms the trend of lower proximity mean values for all the 10 ChatGPT when compared to PubMed. The lower-left corner shows how the GPT proximity values clustered in a much smaller range than those of PubMed. Table 4 summarizes these findings.
3.4 Closed-World Assumption of Fact-Checking
As mention above, the scope of this work falls into the fact-checking of knowledge (node and edges) on the aggregate level. This means that the fact-checking algorithms are searching for any pair of nodes in a ChatGPT graph and reporting whether there is matching nodes and edges in the ground truth literature graph. This also means that the algorithms does not search for the semantic relationships among the entities. For each of the 10 graphs constructed from the ChatGPT dataset, we have checked its components (nodes and edges) against the biological graph generated from the biomedical literature.
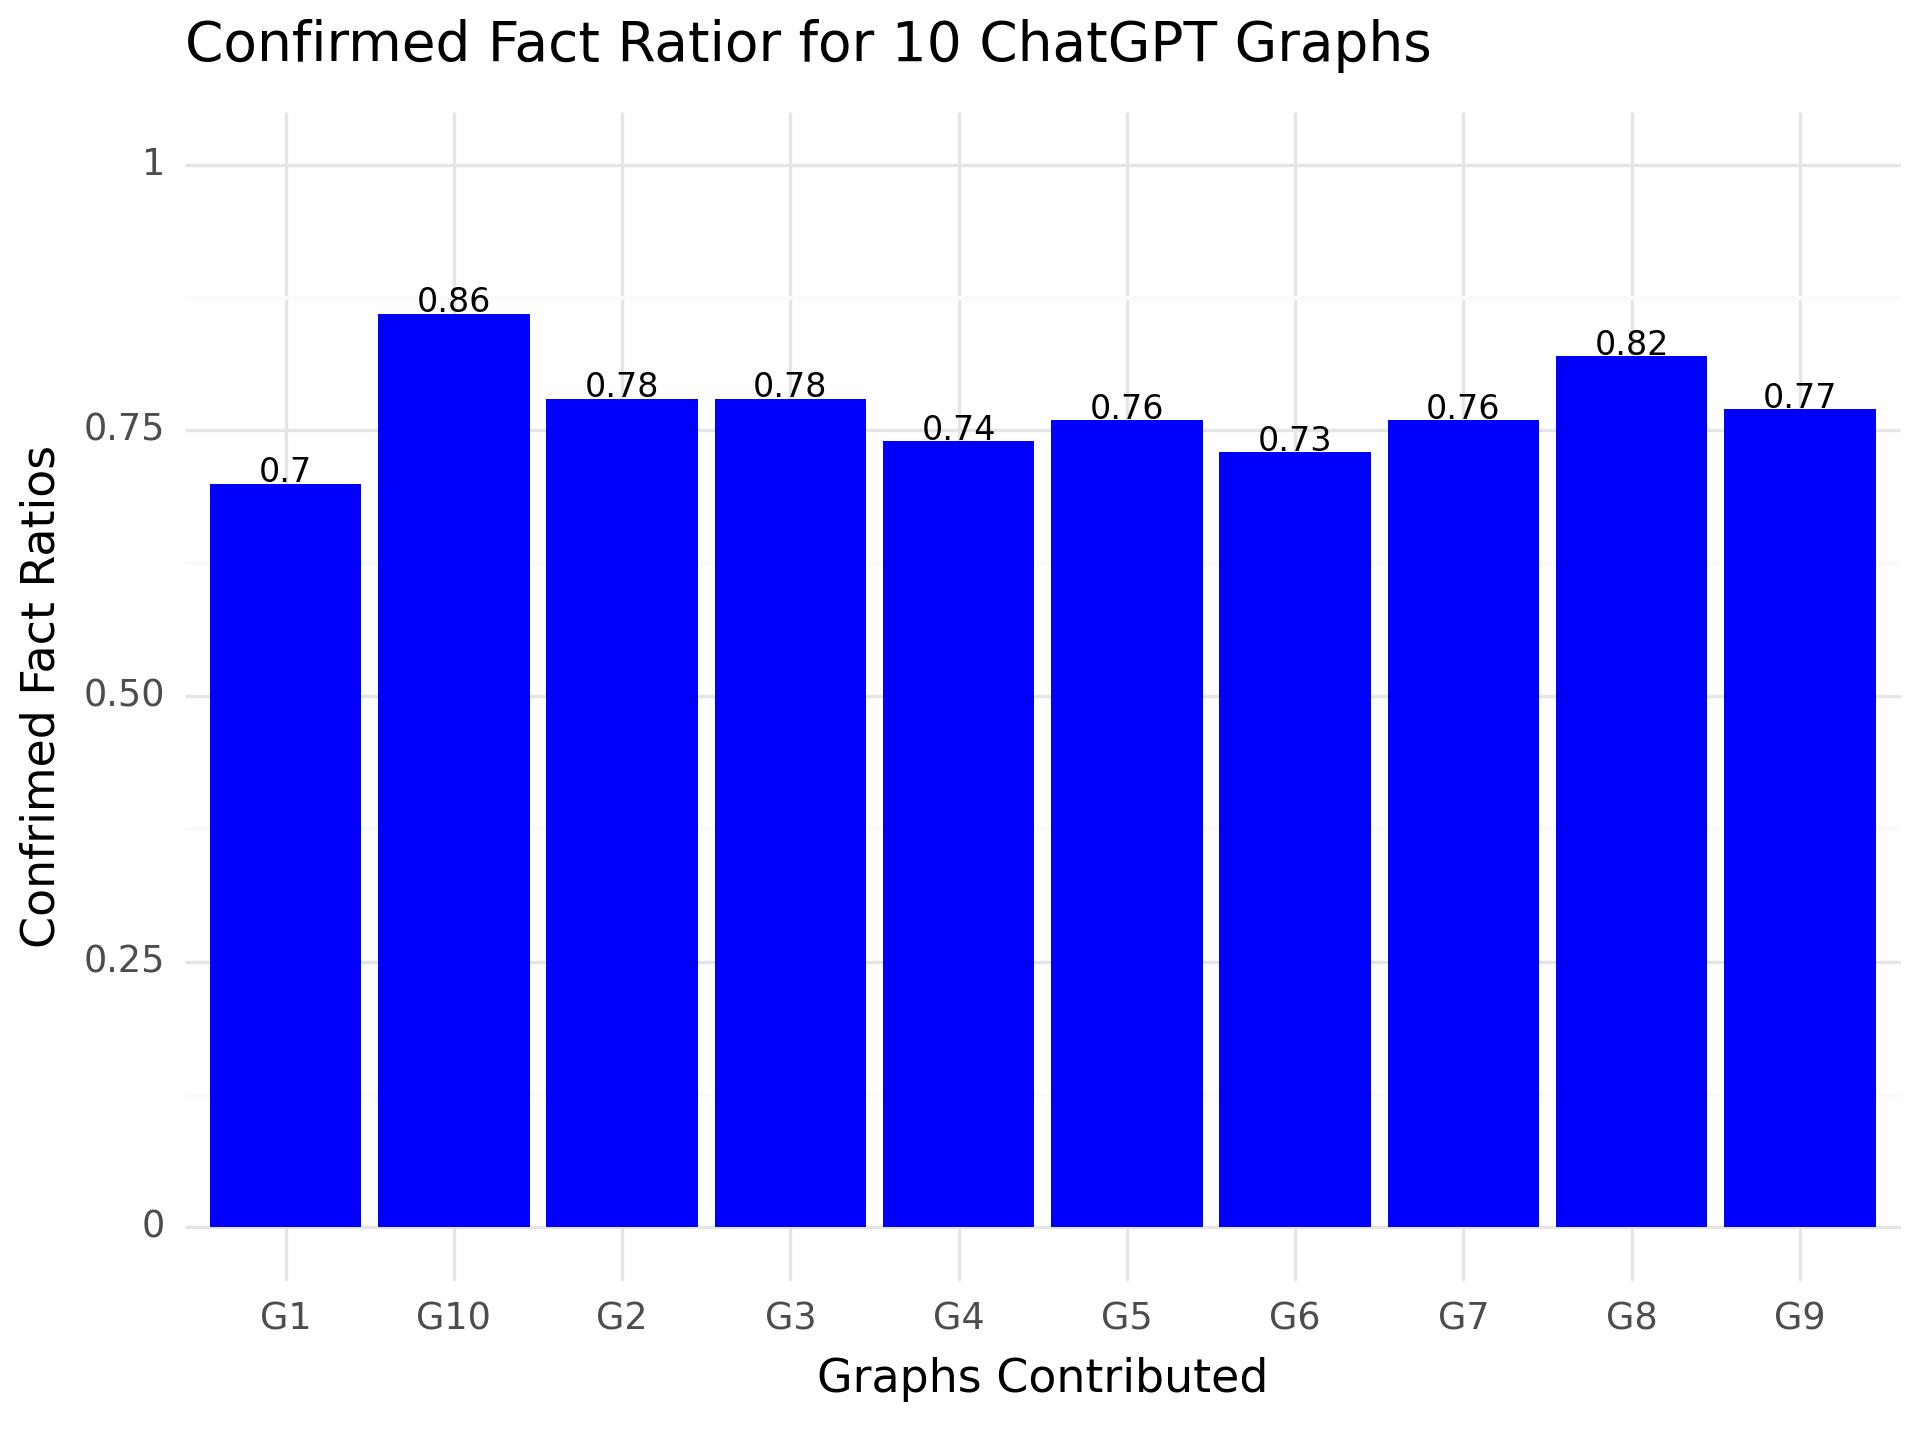
For each of the 10-sample graphs constructed from the ChatGPT dataset, we compared them with the ground truth biological graph constructed from literature for disease-gene, disease-disease, and gene-gene edges. The analysis showed that all 10 graphs produced total number of edges that ranged from (108 – 139). The total number of confirmed disease-gene links ranged from (38 – 53), the number of confirmed gene-gene links (23 – 47), and the number of (6 – 19). The total number of links confirmed as facts ranged from (70% and 85%). Considering the closed-world assumption and the verification of facts happening within the scope of the ground truth alone, and not beyond, the overlapping ratio is considerably high. Table 6 in 10 presents an accounts of such findings and Figure 5 displays the ratio of confirmed facts for each of the 10 ChatGPT graphs.
4 Discussion
The discussion of our study results revolves around several key observations and findings that shed light on the comparison and potential utility of the constructed knowledge graphs. Our approach involved the comparison of two distinct types of graphs, both constructed from randomly selected datasets. This sampling strategy ensured an unbiased and fair basis for comparison between the two sources.
In terms of topological analysis, it was our expectation to observe a less number of nodes and edges exhibited in ChatGPT. It was also our expectations to observe that the network generated from PubMed to be rich and complex, which was demonstrated by lower ratios of nodes to edges. However, we also observed an anomalous behavior among the 10 graph. Particularly, G9 has surpassed its PubMed counterpart in the ratio of number of nodes to edges. Such an observation indicate complexity of certain ChatGPT graphs which warrant further pursuing.
One of the main pursuits of this work was to perform an unbiased fact-checking and verification of a truth graph constructed constructed using ontologies for their credible terminology, and biomedical literature of publications that are funded by the National Institute of Health to ensure high quality and credibility of work. We ensure that the fact-checking process is bounded by a closed-world assumption to make our work possible. The outcome of the process yielded promising results: the precision of link overlaps ranged from [70% to 86%] which is significantly high given the close-world assumption. This finding indeed gives a certain measure of confidence to cautiously consider investigating data generated by ChatGPT using careful prompt-engineering.
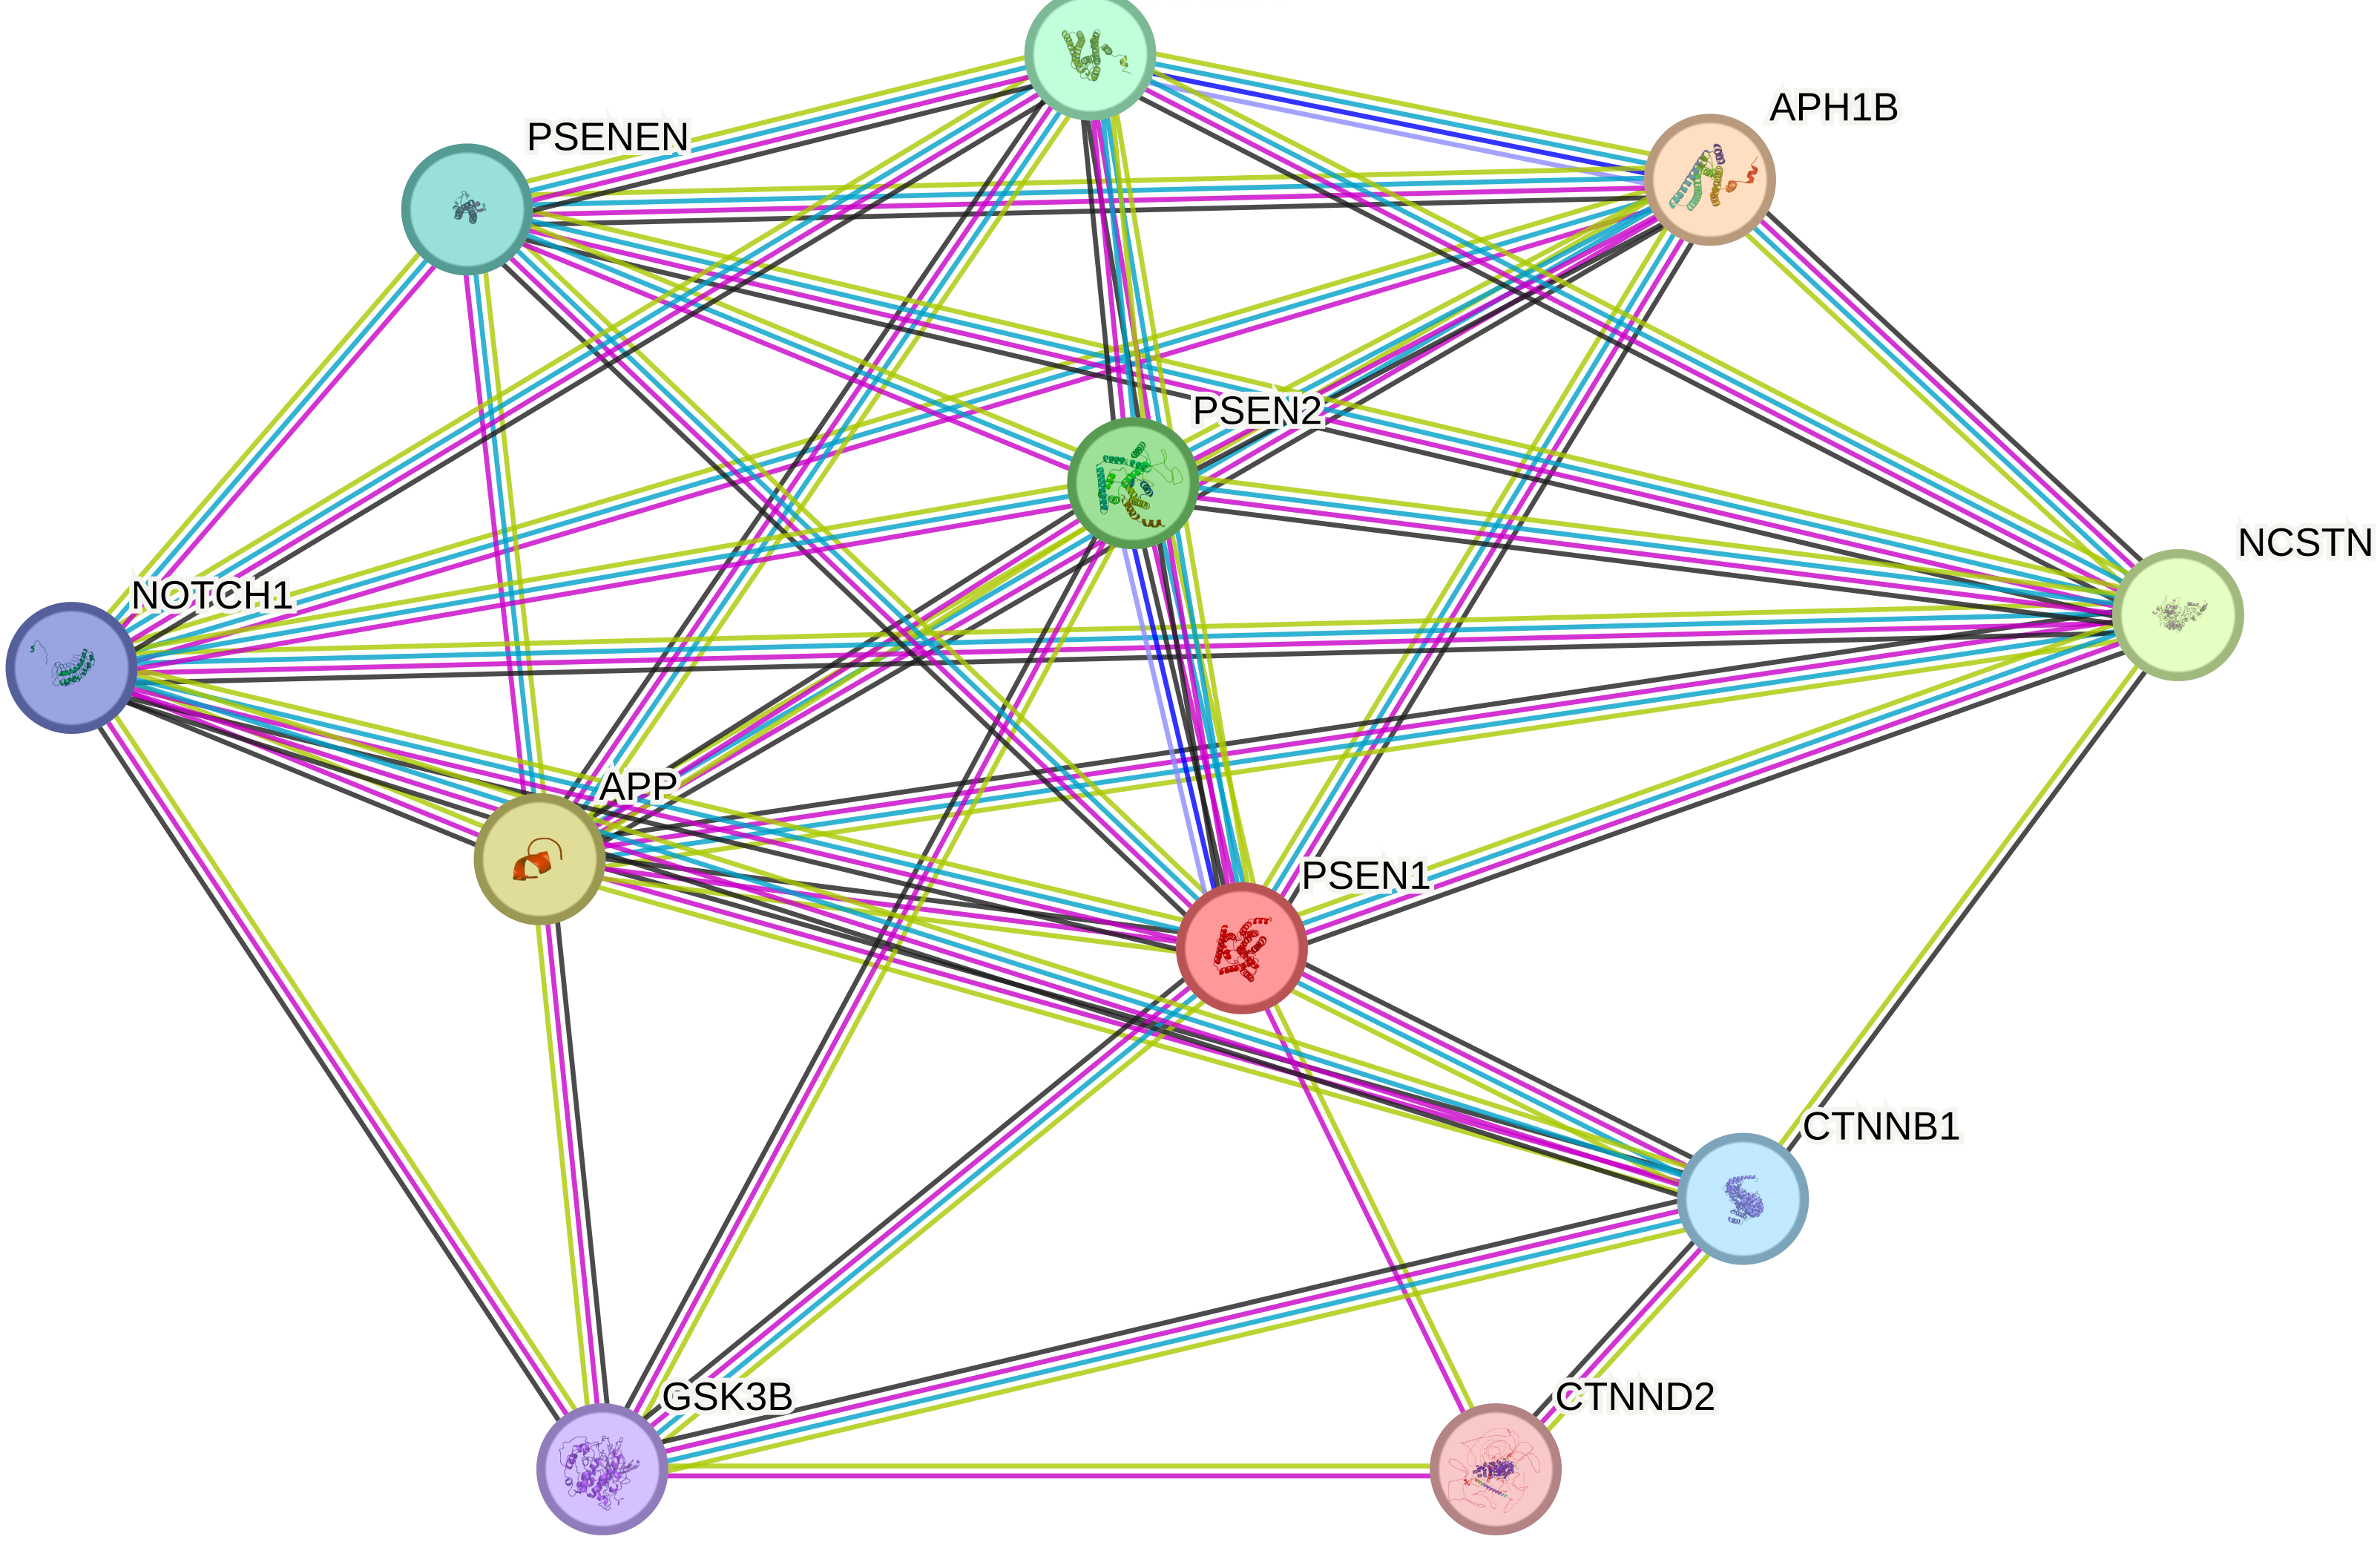
Though, the computational fact-checking is a core part of this work, we have taken the extra and have manually verified the gene-gene relationships identified in G1, which has the lowest fact-checking rate. We have indeed verified that all the links existed in ChatGPT are valid links. Some of the relationships turned out to be an interaction (e.g., SOD1, TARDBP) while others were mutations (e.g., PSEN1, PSEN2). The manual fact-checking was performed against widely acceptable databases: (1) The IntAct—open source resource for molecular interaction data kerrien2007intact , (2) The Gene Regulatory Network Database (GRNdb) fang2021grndb ; li2021single ; szklarczyk2021string . Figure 7 is a small clustor of genes that captures the connections between PSEN1 and PSEN2 genes among many others. Table 5 in the supplementary material 10 captures the outcome of this manual process.
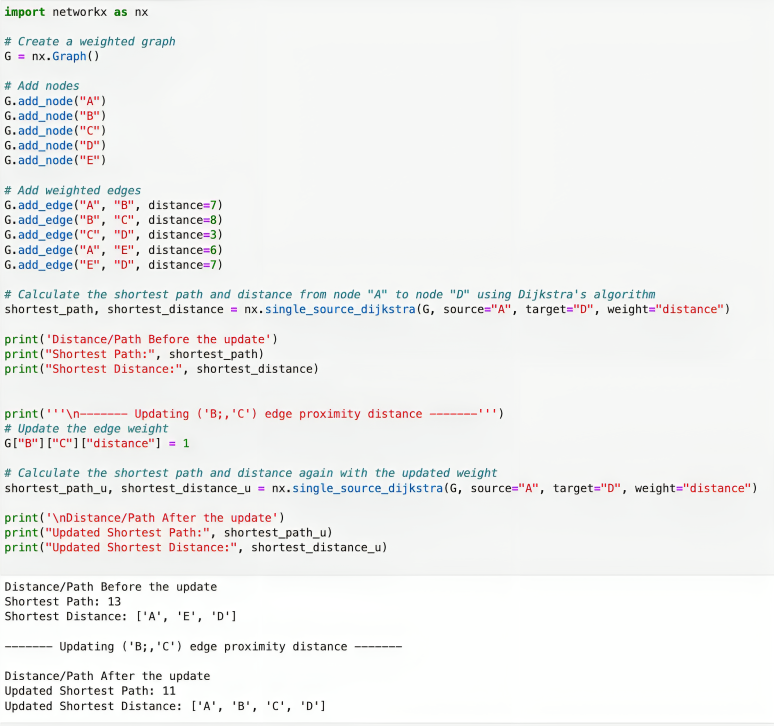
The evidence of much shorter proximity distance can a significant impact of the biological pathways on the PubMed ground truth graph if taken into consideration. When computing the shortest distance of any two nodes with the current proximity distances encoding the edges of the ground truth, using a shortest-distance algorithm (e.g., Dijkstra’s Algorithm) johnson1973note ; barbehenn1998note ; dijkstra2022note ; pavlopoulos2011using , the discovered paths will be of given characteristics. However, updating the distances of the PubMed ground truth graph, using the proximity distances of the overlapping edges with ChatCPT, and recomputes the shortest distance again for the ground truth, some new pathway are bound to emerge. The new proximity distances will illuminate these new pathway alternatives and will offer new interesting pathways which are bound to explain new connecting that wouldn’t be possible from literature alone without the proximity insights made possible by ChatGPT. It is important that this idea does not alter the topology of the ground truth’s topology. The nodes and edges remain intact. The proximity is a parameter that is subject to new evidence, which we have updated using evidence when a new PubMed article presented a shorter distance between two entities. To demonstrate this phenomena, we describe the following scenario which is also show in Figure 8: Graph G contains 5 nodes and 5 weighted edges. There is two paths for A to reach D: via (A, E, D) and via (A, B, C, D). The initial configuration of the graph mandates that A reaches D via E by computing Dijkstra’s shortest path. However, we change the distance between B and C from 8 to 1, then a shortest path emerges (A, B, C, D) which will force the exploring of the relationship between (A and B), (B and C), and (C and d). ChatGPT offers a powerful mechanism that perturbate the biological graphs are buried in the literature and offers a fresh perspective on how to further investigate what we already know. We also present the python code and output for further demonstration in Figure 9 in 10. ChatGPT can indeed provide a feedback mechanism that offer new ways to investigate ground truth which offers a potential contribution in the biomedical space.
Conclusion and Future Direction
In this groundbreaking study, we present an innovative approach to construct ontology-based biological graphs sourced from reputable databases, notably the biomedical literature databases like PubMed Central. The credibility of such authoritative publications grants us the ability to establish a solid foundation of knowledge, effectively distinguishing verified facts from unverified facts.
In the era of AI where powerful tools like ChatGPT and Bard are prevalent, it becomes essential to ensure the reliability of their content. Our research, though still a work-in-progress, showcases the potential of employing biological graphs to uncover real facts, and examine them in new interesting ways.
As we continue to refine our work, the next steps involve further investigation of the proximity distance among biomedical terms and test if they hold in other domain and research areas. The study of disease-gene can be further instantiated in precise complex disease such as Alzheimer’s and comorbidities where little is known. Such investigations may necessitate the introduction of new ontologies (e.g., Gene ontology, Drug, Chemical Entity, and drug target ontologies) among many others. In turn, this opens the door to prompt-engineer ChatGPT to answer specific questions regarding the repurposability of a drug. Another interesting direction is to entirely retrain the engines of ChatGPT using the confirmed-true knowledge and use its massive reasoning capabilities to answers questions about certain biological pathways to investigate a certain biological targets, or a disease that maybe caused by a certain clusters of genes.
5 Tables
| Source | Metric | G1 | G2 | G3 | G4 | G5 | G6 | G7 | G8 | G9 | G10 |
|---|---|---|---|---|---|---|---|---|---|---|---|
| GPT | No of Nodes | 70 | 80 | 80 | 86 | 80 | 74 | 66 | 75 | 75 | 79 |
| PubMed | 137 | 63 | 100 | 104 | 116 | 118 | 101 | 113 | 95 | 154 | |
| GPT | No. of Edges | 110 | 138 | 113 | 141 | 120 | 116 | 108 | 116 | 124 | 139 |
| PubMed | 297 | 124 | 165 | 214 | 251 | 240 | 207 | 366 | 147 | 393 | |
| GPT | N/E Ratio | 0.64 | 0.58 | 0.71 | 0.61 | 0.67 | 0.64 | 0.61 | 0.65 | 0.60 | 0.57 |
| PubMed | 0.46 | 0.51 | 0.61 | 0.49 | 0.46 | 0.49 | 0.49 | 0.31 | 0.65 | 0.39 | |
| GPT | No. of Diseases | 54 | 64 | 65 | 67 | 60 | 57 | 54 | 60 | 59 | 61 |
| PubMed | 117 | 54 | 87 | 88 | 97 | 101 | 79 | 97 | 75 | 131 | |
| GPT | No. of Genes | 16 | 16 | 15 | 19 | 20 | 17 | 12 | 15 | 16 | 18 |
| PubMed | 20 | 9 | 13 | 16 | 19 | 17 | 22 | 16 | 20 | 23 | |
| GPT | Gene-Gene Link No. | 46 | 67 | 59 | 64 | 51 | 48 | 54 | 56 | 56 | 62 |
| PubMed | 229 | 86 | 120 | 151 | 196 | 192 | 148 | 311 | 94 | 316 | |
| GPT | Disease-Gene Link No. | 54 | 50 | 45 | 58 | 50 | 47 | 47 | 48 | 49 | 58 |
| PubMed | 57 | 34 | 40 | 55 | 45 | 36 | 44 | 43 | 42 | 61 | |
| GPT | Disease-Disease Link No. | 10 | 19 | 9 | 19 | 19 | 20 | 6 | 11 | 19 | 19 |
| PubMed | 11 | 4 | 5 | 5 | 10 | 10 | 14 | 10 | 11 | 16 |
| Source | ChatGPT | PubMed |
|---|---|---|
| Metric | ||
| Nodes | 76.50 | 110.10 |
| Gene Nodes | 16.40 | 17.50 |
| Disease Nodes | 60.10 | 92.60 |
| Edge | 60.10 | 240.40 |
| Gene-Gene Links | 56.30 | 184.30 |
| Disease-Gene Links | 50.60 | 45.70 |
| Disease-Disease Links | 15.10 | 9.60 |
| N/E Ratio | 0.63 | 0.49 |
| Source | Sample | Disease-Gene | Disease-Disease | Gene-Gene |
|---|---|---|---|---|
| PubMed | G1 | 617.54 | 490.82 | 465.47 |
| ChatGPT | 115.20 | 110.20 | 74.98 | |
| PubMed | G2 | 367.45 | 361.80 | 414.13 |
| ChatGPT | 134.09 | 145.33 | 46.54 | |
| PubMed | G3 | 550.40 | 403.00 | 275.23 |
| ChatGPT | 113.28 | 62.95 | 70.05 | |
| PubMed | G4 | 475.86 | 667.91 | 279.68 |
| ChatGPT | 141.54 | 193.00 | 75.09 | |
| PubMed | G5 | 461.16 | 524.63 | 357.55 |
| ChatGPT | 131.97 | 87.21 | 120.85 | |
| PubMed | G6 | 575.68 | 444.25 | 434.88 |
| ChatGPT | 130.04 | 174.16 | 69.37 | |
| PubMed | G7 | 502.60 | 280.60 | 264.74 |
| ChatGPT | 152.64 | 150.32 | 50.43 | |
| PubMed | G8 | 506.06 | 690.10 | 263.59 |
| ChatGPT | 117.94 | 154.25 | 86.92 | |
| PubMed | G9 | 574.07 | 346.43 | 302.47 |
| ChatGPT | 112.66 | 171.50 | 90.54 | |
| PubMed | G10 | 603.51 | 765.00 | 473.59 |
| ChatGPT | 141.54 | 193.00 | 75.09 |
| Summary | (Disease-Gene) | (Disease-Disease) | (Gene-Gene) |
|---|---|---|---|
| Ranges | |||
| PubMed Proximity | [617.54, 236.76] | [280.00, 765.00] | [263.59, 465.47] |
| ChatGPT Proximity | [112.66, 152.64] | [62.95, 193.00] | [46.54, 90.54] |
|
Genes |
References |
Description |
|---|---|---|
| APOE, PSEN1 | [”PMID: 26619808”] | APOE*E2 allele delays age of onset in PSEN1 E280A (interaction) |
| APOE, PSEN2 | [”PMID: 28350801”] | APP, PSEN1, and PSEN2 mutations in early-onset Alzheimer disease |
| APOE, APP | [”PMID: 28731260”] | Interaction |
| APOE, TREM2 | [”PMID: 28930663”] | TREM2-APOE Pathway |
| APOE, PCSK9 | [”PMID: 29727700”] | PCSK9: A potential regulator of apoE/apoER2 against inflammation … |
| BRCA1, BRCA2 | [”PMID: 15546503”] | Role of BRCA1 and BRCA2 as regulators of DNA repair, transcription … |
| PSEN1, PSEN2 | [”PMID: 28350801”] | APP, PSEN1, and PSEN2 mutations in early-onset Alzheimer disease … |
| SOD1, TARDBP | [”PMID: 34404558”] | Interaction – Mutation analysis of SOD1, C9orf72, TARDBP and FUS genes … |
| SOD1, C9orf72 | [”PMID: 34404558”] | Interaction – Mutation analysis of SOD1, C9orf72, TARDBP and FUS genes … |
| TARDBP, C9orf72 | [”PMID: 34404558”] | Interaction – Mutation analysis of SOD1, C9orf72, TARDBP and FUS genes … |
| SOD1, C9orf72 | [”PMID: 34404558”] | Interaction – Mutation analysis of SOD1, C9orf72, TARDBP and FUS genes … |
| TARDBP, C9orf72 | [”PMID: 34404558”] | Interaction – Mutation analysis of SOD1, C9orf72, TARDBP and FUS genes … |
| SNCA, LRRK2 | [”PMID: 27486710”] | Genetics of Parkinson’s disease: a review of SNCA and LRRK2 |
| CHD8, SHANK3, NLGN3 | [”PMID: 31758607”] | Dysfunction of the corticostriatal pathway in autism spectrum disorders |
| IL23R, NOD2, ATG16L1 | [”PMID: 22346247”] | Role of ATG16L, NOD2 and IL23R in Crohn’s disease pathogenesis |
| COMT, DRD4, SLC6A3 | [”PMID: 19482231”] | Influence of SLC6A3 and COMT Variation on Neural Activation During Response Inhibition |
| IL2RA, HLA-DRB1 | [”PMID: 33178861”] | Association of HLA-DRA and IL2RA Polymorphisms with the Severity and Relapses Rate … |
| IL33, IL13 | [”PMID: 34789557”] | IL-13 Controls IL-33 Activity through Modulation of ST2 |
| HJV, HFE, TFR2 | [”PMID: 22728873”] | The hemochromatosis proteins HFE, TfR2, and HJV form a membrane-associated protein … |
6 Figures
7 Competing interests
No competing interest is declared.
8 Author contributions statement
Must include all authors, identified by initials, for example: AAH conceived the idea, AAH conducted the experiment(s), AAH, BSL, AC, and MMM analyzed the results. AAH-BSL devised the pathway exploration graph model, AAH wrote the manuscript. AAH, BSL, AC, and MMM edited and reviewed the manuscript.
9 Acknowledgments
This publication is supported by the European Union’s Horizon 2020 research and innovation programme under grant agreement Sano No. 857533 and carried out within the International Research Agendas programme of the Foundation for Polish Science, co-financed by the European Union under the European Regional Development Fund. The authors of this work would like to Dr. Marian Bubak for inspiring this research. We also would like to thank both Adiran Onicas, Jakub Klimczak, and Jakub Jonczyk for their valuable discussions.
References
- [1] Pubmed central (pmc). Accessed: September 2nd, 2023.
- [2] Gene ontology annotations and resources. Nucleic Acids Research, 41, 2013.
- [3] Michael Barbehenn. A note on the complexity of dijkstra’s algorithm for graphs with weighted vertices. IEEE transactions on computers, 47(2):263, 1998.
- [4] Daniel Barrell, Emily Dimmer, Rachael P. Huntley, David Binns, Claire O’Donovan, and Rolf Apweiler. The goa database in 2009 - an integrated gene ontology annotation resource. Nucleic Acids Research, 37, 2009.
- [5] Evelyn Camon, Michele Magrane, Daniel Barrell, David Binns, Wolfgang Fleischmann, Paul Kersey, Nicola Mulder, Tom Oinn, John Maslen, Anthony Cox, and Rolf Apweiler. The gene ontology annotation (goa) project: Implementation of go in swiss-prot, trembl, and interpro, 2003.
- [6] Giovanni Luca Ciampaglia, Prashant Shiralkar, Luis M Rocha, Johan Bollen, Filippo Menczer, and Alessandro Flammini. Computational fact checking from knowledge networks. PloS one, 10(6):e0128193, 2015.
- [7] Rion Brattig Correia, Lang Li, and Luis M Rocha. Monitoring potential drug interactions and reactions via network analysis of instagram user timelines. In Biocomputing 2016: Proceedings of the Pacific Symposium, pages 492–503. World Scientific, 2016.
- [8] Edsger W Dijkstra. A note on two problems in connexion with graphs. In Edsger Wybe Dijkstra: His Life, Work, and Legacy, pages 287–290. 2022.
- [9] Li Fang, Yinxin Li, Lei Ma, Qian Xu, Fei Tan, and Gang Chen. Grndb: decoding the gene regulatory networks in diverse human and mouse conditions. Nucleic Acids Res, 49(D1):D97–D103, 2021.
- [10] Philipp Hofer, Sabrina Neururer, and Georg Goebel. Semi-automated annotation of biobank data using standard medical terminologies in a graph database. volume 228, 2017.
- [11] Rachael P. Huntley, Tony Sawford, Prudence Mutowo-Meullenet, Aleksandra Shypitsyna, Carlos Bonilla, Maria J. Martin, and Claire O’Donovan. The goa database: Gene ontology annotation updates for 2015. Nucleic Acids Research, 43, 2015.
- [12] Donald B Johnson. A note on dijkstra’s shortest path algorithm. Journal of the ACM (JACM), 20(3):385–388, 1973.
- [13] Samuel Kerrien, Yasmin Alam-Faruque, Bruno Aranda, Iain Bancarz, Alan Bridge, Cathy Derow, Emily Dimmer, Marc Feuermann, Anja Friedrichsen, Rachael Huntley, et al. Intact—open source resource for molecular interaction data. Nucleic acids research, 35(suppl_1):D561–D565, 2007.
- [14] Saransh Khandelwal and Dhananjay Kumar. Computational fact validation from knowledge graph using structured and unstructured information. In Proceedings of the 7th ACM IKDD CoDS and 25th COMAD, pages 204–208, 2020.
- [15] Ji-Seong Kim and Key-Sun Choi. Fact checking in knowledge graphs by logical consistency. Semantic Web Journal, swj2721, 2021.
- [16] Jiseong Kim and Key Sun Choi. Unsupervised fact checking by counter-weighted positive and negative evidential paths in a knowledge graph. In Proceedings of the 28th international conference on computational linguistics, 2020.
- [17] Yunjin Li, Jiwei Chen, Qiyue Xu, Zebei Han, Fei Tan, Tieliu Shi, and Geng Chen. Single-cell transcriptomic analysis reveals dynamic alternative splicing and gene regulatory networks among pancreatic islets. Science China Life Sciences, 64:174–176, 2021.
- [18] Panpan Lin, Quan Song, and Yanhong Wu. Fact checking in knowledge graphs with ontological subgraph patterns. Data Science and Engineering, 3:341–358, 2018.
- [19] Peng Lin, Qi Song, Jialiang Shen, and Yinghui Wu. Discovering graph patterns for fact checking in knowledge graphs. In International Conference on Database Systems for Advanced Applications, pages 783–801. Springer, 2018.
- [20] Peng Lin, Qi Song, Jialiang Shen, and Yinghui Wu. Discovering graph patterns for fact checking in knowledge graphs. In International Conference on Database Systems for Advanced Applications, pages 783–801. Springer, 2018.
- [21] Peng Lin, Qi Song, Yinghui Wu, and Jiaxing Pi. Discovering patterns for fact checking in knowledge graphs. Journal of Data and Information Quality (JDIQ), 11(3):1–27, 2019.
- [22] Peng Lin, Qi Song, Yinghui Wu, and Jiaxing Pi. Discovering patterns for fact checking in knowledge graphs. Journal of Data and Information Quality, 11, 2019.
- [23] Peng Lin, Yinghui Wu, Hanchao Ma, and Jialiang Shen. Automatic {Fact} {Checking} for {Knowledge} {Graphs}: {An} {Experimental} {Study}. Proceedings of the VLDB Endowment, 11, 2017.
- [24] Lihui Liu, Boxin Du, Yi Ren Fung, Heng Ji, Jiejun Xu, and Hanghang Tong. Kompare: A knowledge graph comparative reasoning system. In Proceedings of the 27th ACM SIGKDD Conference on Knowledge Discovery & Data Mining, 2021.
- [25] Weichen Luo and Cheng Long. Fact checking on knowledge graphs. In Data Science for Fake News: Surveys and Perspectives, pages 149–168. Springer International Publishing, Cham, 2021.
- [26] Paolo Mengoni and Jinyu Yang. Empowering covid-19 fact-checking with extended knowledge graphs. In International Conference on Computational Science and Its Applications, pages 138–150. Springer, 2022.
- [27] OpenAI. ChatGPT: Conversational ai assistant. OpenAI Platform, 2023. Accessed: August 14, 2023.
- [28] Téo Orthlieb, Hamdi Ben Abdessalem, and Claude Frasson. Checking method for fake news to avoid the twitter effect. In Intelligent Tutoring Systems: 17th International Conference, ITS 2021, Virtual Event, June 7–11, 2021, Proceedings 17, pages 68–72. Springer, 2021.
- [29] Shirui Pan, Linhao Luo, Yufei Wang, Chen Chen, Jiapu Wang, and Xindong Wu. Unifying large language models and knowledge graphs: A roadmap, 2023.
- [30] Georgios A Pavlopoulos, Maria Secrier, Charalampos N Moschopoulos, Theodoros G Soldatos, Sophia Kossida, Jan Aerts, Reinhard Schneider, and Pantelis G Bagos. Using graph theory to analyze biological networks. BioData mining, 4:1–27, 2011.
- [31] Umair Qudus, Michael Röder, Muhammad Saleem, and Axel Cyrille Ngonga Ngomo. Hybridfc: A hybrid fact-checking approach for knowledge graphs. In International Semantic Web Conference, volume 13489 LNCS, 2022.
- [32] Gautam Kishore Shahi. Fakekg: A knowledge graph of fake claims for improving automated fact-checking (student abstract). Proceedings of the AAAI Conference on Artificial Intelligence, 37, 2023.
- [33] Baoxu Shi and Tim Weninger. Discriminative predicate path mining for fact checking in knowledge graphs. Knowledge-Based Systems, 104, 2016.
- [34] Baoxu Shi and Tim Weninger. Proje: Embedding projection for knowledge graph completion. In Proceedings of the AAAI Conference on Artificial Intelligence, AAAI’17, page 1236–1242. AAAI Press, 2017.
- [35] Prashant Shiralkar, Alessandro Flammini, Filippo Menczer, and Giovanni Luca Ciampaglia. Finding streams in knowledge graphs to support fact checking. In 2017 IEEE International Conference on Data Mining (ICDM), volume 2017-November, 2017.
- [36] Tiago Simas and Luis M Rocha. Distance closures on complex networks. Network Science, 3(2):227–268, 2015.
- [37] Adama Sow, Abdoulaye Guissé, and Oumar Niang. Enrichment of medical ontologies from textual clinical reports: Towards improving linking human diseases and signs. volume 296, 2019.
- [38] Damian Szklarczyk, Annika L Gable, Katerina C Nastou, David Lyon, Rebecca Kirsch, Sampo Pyysalo, Nadezhda T Doncheva, Marc Legeay, Tao Fang, Peer Bork, et al. The string database in 2021: customizable protein–protein networks, and functional characterization of user-uploaded gene/measurement sets. Nucleic acids research, 49(D1):D605–D612, 2021.
- [39] Andon Tchechmedjiev, Pavlos Fafalios, Katarina Boland, Malo Gasquet, Matthäus Zloch, Benjamin Zapilko, Stefan Dietze, and Konstantin Todorov. Claimskg: A knowledge graph of fact-checked claims. In The Semantic Web – ISWC 2019, volume 11779, 2019.
- [40] Eva AM Van Dis, Johan Bollen, Willem Zuidema, Robert van Rooij, and Claudi L Bockting. Chatgpt: five priorities for research. Nature, 614(7947):224–226, 2023.
- [41] Nikhita Vedula and Srinivasan Parthasarathy. Face-keg: Fact checking explained using knowledge graphs. In Proceedings of the 14th ACM International Conference on Web Search and Data Mining, pages 526–534, 2021.
- [42] Shuai Wang, Wenji Mao, Penghui Wei, and Daniel D. Zeng. Knowledge structure driven prototype learning and verification for fact checking. Knowledge-Based Systems, 238, 2022.
- [43] Shuai Wang, Lei Wang, and Wenji Mao. A kg-based enhancement framework for fact checking using category information. In 2020 IEEE International Conference on Intelligence and Security Informatics (ISI), pages 1–6. IEEE, 2020.
- [44] Linyao Yang, Hongyang Chen, Zhao Li, Xiao Ding, and Xindong Wu. Chatgpt is not enough: Enhancing large language models with knowledge graphs for fact-aware language modeling, 2023.
- [45] Biru Zhu, Xingyao Zhang, Ming Gu, and Yangdong Deng. Knowledge enhanced fact checking and verification. IEEE/ACM Transactions on Audio Speech and Language Processing, 29, 2021.
10 Supplementary Material
| Metric | G1 | G2 | G3 | G4 | G5 | G6 | G7 | G8 | G9 | G10 |
| Total Edges | 110 | 138 | 113 | 141 | 120 | 116 | 108 | 116 | 124 | 139 |
| Gene-Gene Links | 23 | 47 | 42 | 40 | 31 | 30 | 38 | 43 | 38 | 47 |
| Disease-Gene Links | 44 | 41 | 37 | 46 | 42 | 36 | 38 | 41 | 38 | 53 |
| Disease-Disease Links | 10 | 19 | 9 | 18 | 18 | 19 | 6 | 11 | 19 | 19 |
| Fact Ration | 0.70 | 0.78 | 0.78 | 0.74 | 0.76 | 0.73 | 0.76 | 0.82 | 0.77 | 0.86 |