Full Spectroscopic Model and Trihybrid Experimental-Perturbative-Variational Line List for ZrO
Abstract
Zirconium monoxide (ZrO) absorption lines define rare S-type stars and are currently being sought on exoplanets. Successful detection is dependent on an accurate and comprehensive line list, with existing data not ideal for many applications. Specifically, the Plez et al. line list is near-complete but has insufficient accuracy for high-resolution cross-correlation, while the Sorensen & Bernath data has high accuracy but only considers a small number of spectral bands. This article presents a novel spectroscopic model, variational line list and trihybrid line list for the main 90Zr16O isotopologue, as well as isotopologue-extrapolated hybrid line lists for the 91Zr16O, 92Zr16O, 93Zr16O, 94Zr16O and 96Zr16O isotopologues. These were constructed using Duo based on icMRCI-SD/CASSCF ab initio electronic data calculated using Molpro, experimental energies obtained from a previous MARVEL data compilation and perturbative energies from Sorensen & Bernath. The new 90Zr16O ExoMol-style trihybrid line list, ZorrO, comprises 227,118 energies (13,075 experimental) and 47,662,773 transitions up to 30,000 cm-1 (333 nm) between ten low-lying electronic states (X , a , A , b , B , C , d , e , f and F ). The inclusion of experimental energy levels in ZorrO means ZrO will be much easier to detect using high-resolution ground-based telescopes in the 12,500 – 17,500 cm-1 (571 – 800 nm) spectral region. The inclusion of variational energy levels means that the ZorrO line list has very high completeness and can accurately model molecular absorption cross-sections even at high temperatures. The ZorrO data will hopefully facilitate the first detection of ZrO in the atmosphere of a hot Jupiter exoplanet, or alternatively more conclusively exclude its presence.
keywords:
molecular data, opacity, astrochemistry, astronomical data bases: miscellaneous, stars: chemically peculiar, planets and satellites: atmospheres1 Introduction
Zirconium monoxide (ZrO) is a second-row transition metal diatomic molecule of astronomical significance. Notably, the strong absorption lines of ZrO are the characteristic spectral signature of rare S-type stars (Keenan, 1954), which replace the prominent titanium monoxide (TiO) absorption lines of common M-types stars. It is known that S-type stars have an atmospheric carbon-to-oxygen ratio near unity and exhibit slow neutron-capture processes (s-processes) that lead to an overabundance of zirconium (Piccirillo, 1980; Van Eck et al., 2017). ZrO is also faintly detectable in SC-type stars (Keenan & Boeshaar, 1980), M-type stars (Bobrovnikoff, 1934) and sunspots (Richardson, 1931). There has been some search for ZrO in the atmospheres of hot Jupiter exoplanets without success (Tabernero et al., 2021; Borsa et al., 2021). All current ZrO detections have been made using mid-resolution techniques from either space-based or ground-based telescopes. The former space-based telescopes are particularly useful for the detection of fainter objects, such as hot Jupiter exoplanets, and are promising in the new era of the James Webb Space Telescope (JWST). Despite this, high-resolution cross-correlation (HRCC) techniques using ground-based telescopes have become a critical technique over the last decade to detect new molecules in exoplanetary atmospheres (Brogi & Line, 2018; Birkby, 2018), where the Very Large Telescope (VLT) is often employed in combination with ultra-high precision spectrographs such as the most recent Echelle SPectrograph for Rocky Exoplanets and Stable Spectroscopic Observations (ESPRESSO) instrument. Cross-correlation is an effective method of signal filtration that facilitates the unambiguous astronomical detection of a molecule. This relies on high-resolution ground-based measurements that are compared to high-resolution model templates simulated from atomic and molecular line lists of sub cm-1 accuracy. High-resolution cross-correlation spectroscopy has been used to successfully identify many diatomic molecules, such as CO (Brogi & Line, 2018), OH (Landman et al., 2021) and arguably TiO (Nugroho et al., 2017), in exoplanetary atmospheres. In order to achieve the required accuracy for such detections, it has been shown that experimentally-derived energies must be explicitly incorporated into a line list (McKemmish et al., 2019; Syme & McKemmish, 2021). This is especially true for complex transition metal diatomic systems such as ZrO (Tennyson et al., 2016).
The current inability to detect ZrO in an exoplanetary atmospheres using high-resolution cross-correlation is not unexpected given the current state of line list data availability for ZrO. Specifically, for ZrO, the most complete line list available is from Plez (Plez et al., 2003; Van Eck et al., 2017), but this does not contain experimentally-derived energy levels and thus will not have the sub-cm-1 accuracy in the strong lines needed for this technique. The more accurate MoLLIST line list (Bernath, 2020; Sorensen & Bernath, 2021) only considers the B – X rovibronic and X rovibrational transitions. This data thus misses many strong transitions, significantly increasing the required signal-to-noise for a molecular detection and greatly restricting the spectral range that can be used.
To enable effective use by astronomers with all modern techniques, a line list with both high accuracy for all strong lines positions and high completeness across temperature and spectral ranges is required. For ZrO, this is achieved using the approach outlined by Syme & McKemmish (2021) for the cyano radical (CN). Specifically, high accuracy is obtained with the high-resolution experimental MARVEL energies from McKemmish et al. (2018) complemented by a small number of interpolated perturbative (effective Hamiltonian) energies from Sorensen & Bernath (2021). High completeness can be created from a new spectroscopic model (fitted to experimental data) constructed herein that yields a variational line list. Finally, the experimental, perturbative and variational energies are combined to generate a novel trihybrid line list for 90Zr16O, named ZorrO. Various isotopologue energies are predicted from this main line list using standard techniques, where 90Zr, 91Zr, 92Zr, 93Zr, 94Zr and 96Zr have an isotopic abundance of 51.5, 11.2, 17.1, 0.0, 17.4 and 2.8%, respectively (Nomura et al., 1983).
This article is structured as follows; an overview of the literature experimental, perturbative and ab initio spectroscopic data are presented in Section 2. The ab initio data calculated by Tabet et al. (2019) are also adapted. In Section 3, the spectroscopic model for the main 90Zr16O isotopologue is constructed. In Section 4, variational line lists are generated for the 90Zr16O, 91Zr16O, 92Zr16O, 93Zr16O, 94Zr16O and 96Zr16O isotopologues, as well as trihybrid and isotopologue-extrapolated hybrid line lists. In Section 5, various partition functions, lifetimes and cross sections of ZrO are analysed.
2 90Zr16O Spectroscopic Data
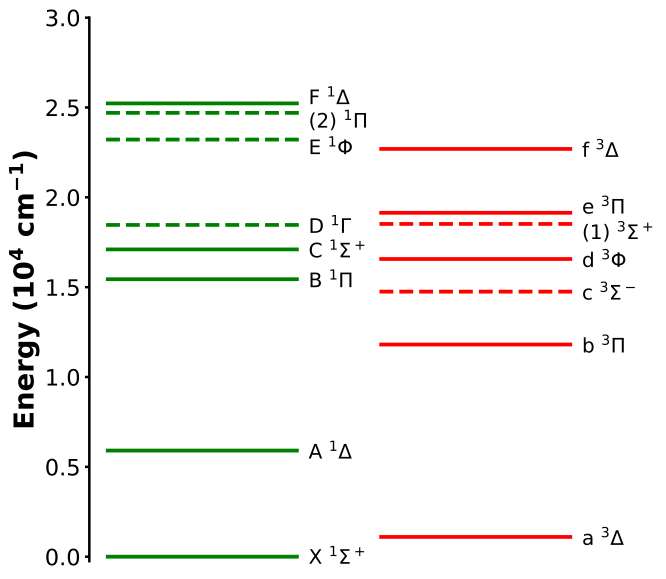
The rovibronic spectroscopy of ZrO is characterised by many low-lying electronic states as shown in Figure 1. This leads to a complex band structure with intense transitions arising from the singlet and triplet manifolds. From the Boltzmann distribution, the X and a electronic states have significant population such that the B – X , (f – a ), (e – a ), (d – a ) transitions dominate.
2.1 Experimental Data
In the literature, the main 90Zr16O isotopologue has been investigated through many experimental spectroscopic studies. This was recently reviewed and collated in McKemmish et al. (2018), which obtained assigned rovibronic transitions from twelve publications derived from both laboratory measurements and astronomical spectra. Using the MARVEL (Furtenbacher et al., 2007) algorithm, the 22,549 rovibronic transitions validated were inverted to give a set of empirical energies for rovibronic states belonging to the X , A , B , C , F , a , b , d , e and f electronic states. These energies form one self-consistent spectroscopic network containing 8,088 rovibronic states. Apart from unresolved -doubling in several electronic states, all fine structure is characterised in accordance with Hund’s coupling case (a).
2.2 Perturbative Line Lists
Beyond the experimental data collated by McKemmish et al. (2018), there exists only perturbative line lists for ZrO in the literature. The perturbative (or traditional) methodology relies on an effective Hamiltonian, where experimental data are fit to polynomial expressions through the optimisation of spectroscopic parameters for each electronic state. This approach allows for the prediction of unobserved transitions with ab initio dipole moment curves. This provides a natural extension to experimental data, where the associated line lists interpolate experimental energies to high accuracy. Due to corrections obtained through perturbation theory, however, perturbative line lists typically extrapolate poorly, especially to higher vibrational levels. For this reason, they are often incomplete as they are limited by experimental data.
The most accurate ZrO perturbative spectroscopic line list in the literature was generated by Sorensen & Bernath (2021) for the B – X rovibronic and X rovibrational transitions. This perturbative analysis relied on a high temperature laboratory emission spectrum in combination with the ab initio B – X off-diagonal dipole moment curve calculated by Langhoff & Bauschlicher (1990). For reasonable completeness, however, astronomers are currently limited to the perturbative line list constructed by Plez (Plez et al., 2003; Van Eck et al., 2017). This is the most comprehensive line list with transition intensities currently available for ZrO (superseded by this work), which was constructed in accordance with the TiO line list methodology of Plez (1998) using spectroscopic parameters from a range of sources. In particular, the Plez line list includes the B – X , C – X , B – A , E – A , b – a , (d – a ), (e – a ) and (f – a ) rovibronic transitions for the 90Zr16O, 91Zr16O, 92Zr16O, 93Zr16O, 94Zr16O and 96Zr16O isotopologues.
There is no variational line list currently available for ZrO that has been constructed through numerical solution of the nuclear Schrödinger equation. This prevents reliable extrapolation to unobserved rovibrational states.
2.3 Ab Initio Data
Ab initio spectroscopic data have been calculated for many low-lying electronic states of ZrO. An important historical study was conducted by Langhoff & Bauschlicher (1990) for twelve electronic states using the MRCI/SA-CASSCF level of theory. Recently, an improved study was performed by Tabet et al. (2019) for twenty-four electronic states using a larger active space in the CASSCF calculations.
In this work, the ab initio study of Tabet et al. (2019) was adapted to consider larger bond lengths and explicitly calculate all off-diagonal dipole moment curves. These novel calculations were performed in Molpro 2020.1 (Werner et al., 2020) using the icMRCI-SD level of theory with reference orbitals obtained from SA-CASSCF calculations. Using the (, , , ) irreducible representation of the point group, (4, 2, 2, 1) active orbitals from (Zr: , , ), (2, 1, 1, 0) active orbitals from (O: , ) and (3, 1, 1, 0) closed core orbitals from (Zr: , ; O: ) were selected. These orbitals were optimised for the X , A , B , C , D , F , a , b , c , d , e , f and (1) electronic states with equal weighting. For the zirconium atom, a contracted version of the cc-pVTZ-PP basis set was employed in combination with the function of the aug-cc-pVQZ-PP basis set (Peterson et al., 2007). The associated ECP28MDF effective core potential was used for the twenty-eight frozen electrons in the orbitals. The remaining twelve electrons in the orbitals were explicitly taken into the valence space. For the oxygen atom, a contracted version of the aug-cc-pVQZ basis set (Kendall et al., 1992) was used in an all electron scheme.
| Parameter | X | A | B | C | F |
|---|---|---|---|---|---|
| +0.0000E+00 | +5.8854E+03 | +1.5458E+04 | +1.7099E+04 | +2.5156E+04 | |
| +1.7119E+00 | +1.7243E+00 | +1.7561E+00 | +1.7492E+00 | +1.7652E+00 | |
| +6.3637E+04 | +6.3637E+04 | +6.3637E+04 | +6.3637E+04 | +6.3637E+04 | |
| 1 | 1 | 2 | 1 | 2 | |
| 3 | 3 | 3 | 2 | 2 | |
| +1.7365E+00 | +1.7653E+00 | +1.7569E+00 | +1.8300E+00 | +1.9175E+00 | |
| +8.5932E–02 | +1.2397E–01 | +1.7479E–01 | –7.3237E–02 | +2.0378E–01 | |
| +5.5929E–02 | –7.1092E–01 | +1.2322E–01 | +8.8427E–01 | +1.0000E+00 | |
| –8.8825E–02 | +1.0855E+00 | +1.0925E–01 | – | – | |
| – | – | +9.3589E–05 | – | – |
| Parameter | a | b | d | e | f |
|---|---|---|---|---|---|
| +1.4179E+03 | +1.2159E+04 | +1.7194E+04 | +1.9146E+04 | +2.3039E+04 | |
| +1.7343E+00 | +1.7414E+00 | +1.7604E+00 | +1.7570E+00 | +1.7869E+00 | |
| +6.3637E+04 | +6.3637E+04 | +6.3637E+04 | +6.3637E+04 | +6.3637E+04 | |
| 1 | 2 | 1 | 1 | 2 | |
| 3 | 2 | 2 | 2 | 2 | |
| +1.6856E+00 | +1.7536E+00 | +1.7844E+00 | +1.7921E+00 | +1.8178E+00 | |
| +6.5169E–02 | +1.0791E–01 | +1.0543E–01 | –1.9849E–01 | +5.5247E–01 | |
| +3.0025E–01 | +2.7406E–01 | +2.5423E–01 | +9.5112E–01 | +1.0000E+00 | |
| –6.6929E–01 | – | – | – | – | |
| +3.1204E+02 | –2.9868E+02 | +6.1309E+02 | –1.1935E+02 | +3.6652E+02 | |
| –1.3596E+00 | +1.1238E+01 | +4.1128E+00 | –8.5077E+00 | +3.6586E+00 | |
| +6.7111E–03 | +9.9077E–04 | +1.0405E–02 | +8.3545E–03 | +1.1734E–02 | |
| –9.7375E–03 | +2.6961E–01 | +1.4856E+00 | +2.7173E–01 | +2.5983E+00 | |
| – | +1.0989E–01 | – | – | – | |
| – | –1.7547E+01 | – | – | – | |
| – | +1.1512E–04 | – | – | – |
3 90Zr16O Spectroscopic Model
There is currently no available spectroscopic model (McKemmish, 2021) (i.e. a set of self-consistent potential energy, coupling and dipole moment curves used in the variational model of a molecule) for 90Zr16O in the literature. The absence of this model hinders physically reasonable extrapolation of experimental data to new unobserved transitions.
Here, the 90Zr16O spectroscopic model is assembled for the ten X , a , A , b , B , C , d , e , f and F electronic states in a Duo (Yurchenko et al., 2016) .model input file. The D , E and c electronic states were excluded as there is no experimental data verifying their term energies and there are no allowed transitions with the low-lying X or a electronic states.
| State | RMSE | MAE | Maximum | |
|---|---|---|---|---|
| X | 0 | 1.059E–01 | 9.233E–02 | 2.737E–01 |
| 1 | 9.139E–02 | 8.528E–02 | 1.762E–01 | |
| 2 | 1.450E–01 | 1.402E–01 | 2.717E–01 | |
| 3 | 1.271E–01 | 1.217E–01 | 2.894E–01 | |
| 4 | 9.591E–02 | 8.155E–02 | 2.546E–01 | |
| 5 | 6.058E–02 | 4.363E–02 | 2.596E–01 | |
| 6 | 1.203E–01 | 1.020E–01 | 2.750E–01 | |
| 7 | 2.229E–01 | 2.131E–01 | 3.361E–01 | |
| a | 0 | 8.433E–01 | 4.567E–01 | 4.593E+00 |
| 1 | 8.138E–01 | 6.033E–01 | 4.086E+00 | |
| 2 | 8.516E–01 | 6.148E–01 | 4.115E+00 | |
| 3 | 7.107E–01 | 6.083E–01 | 2.433E+00 | |
| 4 | 9.587E–01 | 8.011E–01 | 1.834E+00 | |
| 5 | 1.395E+00 | 1.105E+00 | 2.423E+00 | |
| A | 0 | 2.576E–01 | 2.115E–01 | 5.842E–01 |
| 1 | 5.576E–01 | 4.065E–01 | 1.905E+00 | |
| b | 0 | 1.099E–01 | 7.866E–02 | 4.417E–01 |
| B | 0 | 3.685E–02 | 2.706E–02 | 1.645E–01 |
| 1 | 3.819E–02 | 2.657E–02 | 1.746E–01 | |
| 2 | 9.147E–02 | 5.152E–02 | 6.875E–01 | |
| 3 | 6.511E–02 | 4.658E–02 | 2.959E–01 | |
| 4 | 5.177E–02 | 3.980E–02 | 1.864E–01 | |
| 5 | 7.217E–02 | 5.803E–02 | 1.988E–01 | |
| C | 0 | 7.253E–02 | 5.394E–02 | 2.160E–01 |
| d | 0 | 2.426E+00 | 2.040E+00 | 7.437E+00 |
| 1 | 1.639E+00 | 1.355E+00 | 5.863E+00 | |
| 2 | 6.627E–01 | 3.900E–01 | 3.734E+00 | |
| 3 | 1.222E+00 | 1.041E+00 | 3.169E+00 | |
| 4 | 3.172E+00 | 2.897E+00 | 5.189E+00 | |
| e | 0 | 8.022E–01 | 5.677E–01 | 3.049E+00 |
| f | 0 | 1.291E+00 | 9.774E–01 | 3.444E+00 |
| F | 0 | 3.868E–01 | 3.400E–01 | 8.467E–01 |
| 1 | 5.116E–01 | 4.338E–01 | 1.001E+00 |
3.1 Energy Spectroscopic Model
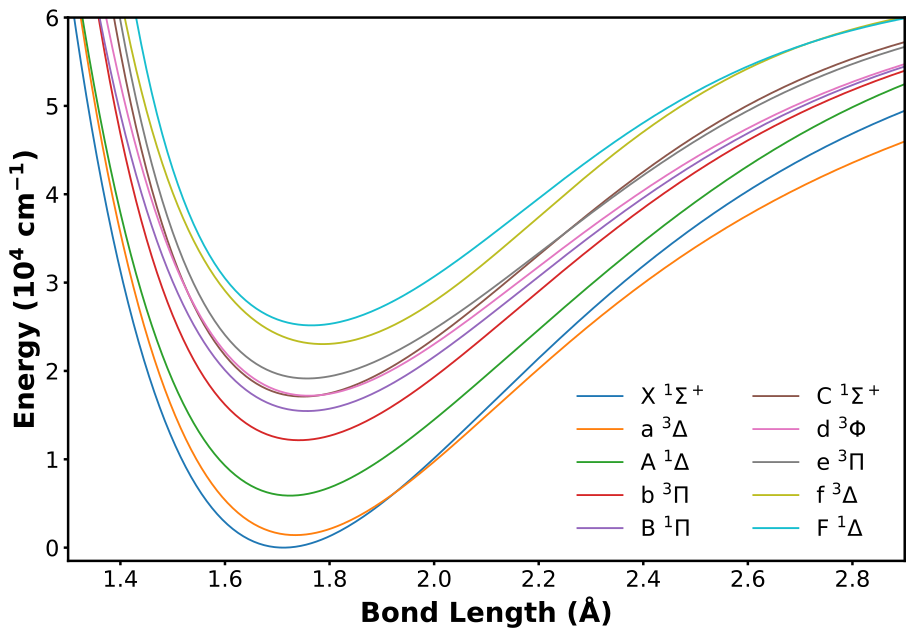
The 90Zr16O energy spectroscopic model comprises the potential energy curve of each electronic state, as well as the coupling and correction curves between these states. Firstly, the potential energy curves for the ten electronic states considered are shown in Figure 2, which were modelled using an extended Morse oscillator potential given by
| (1) |
where is the term energy, is the dissociation energy, is the equilibrium bond length and } are vibrational fitting parameters. The number of these fitting parameters differs on the left and right of the equilibrium bond length as specified by the parameters and in the .model input file, respectively. The dissociation asymptote was set to 7.89 eV = 63,637 cm-1 (Murad & Hildenbrand, 1975) for all ten electronic states.
| State | Parameter | ZorrO | H & H (1979) | MARVEL | MoLLIST | L & B (1990) |
|---|---|---|---|---|---|---|
| X | 63,637 | 63,315 | – | – | – | |
| 1.7119 | 1.7116 | – | 1.71199404 | 1.721 | ||
| 976.16 | 969.76 | 976.44 | 976.40869 | 979.1 | ||
| 3.3758 | 4.90 | 3.45 | 3.44153 | – | ||
| 0.42361 | 0.42263 | 0.42361 | 0.4235669 | – | ||
| 3.19 | 3.19 | 3.19 | – | – | ||
| 1.9572 | 2.3 | 1.97 | 1.9186 | – | ||
| B | 15,458 | 15,443 | 15,441.70 | – | 15,168 | |
| 63,637 | – | – | – | – | ||
| 1.7561 | 1.75832 | – | 1.75631230 | 1.756 | ||
| 859.35 | 859 | 859.59 | 859.424252 | 899.9 | ||
| 2.9669 | 3 | 2.99 | 2.921697 | – | ||
| 0.402576 | 0.40154 | 0.40246 | 0.402460322 | – | ||
| 3.53 | 3.52 | 3.50 | – | – | ||
| 1.9092 | – | 1.90 | 1.8770 | – |
The ten potential energy curves were fit to 8,083 unique MARVEL experimental energies (McKemmish et al., 2018), where the inverse square of each MARVEL uncertainty was applied as the weighting factor in the fitting procedure. The degenerate MARVEL rovibronic states with unresolved -doubling were duplicated with opposite parity for completeness. The ab initio potential energy curves from Section 2.3 were used to further confine the fit. The fitted parameters for each potential energy curve are provided in Tables 1 and 2.
Additionally, all spin-orbit (), spin-spin (), spin-rotation (), -doubling (, and ), angular momentum () and Born-Oppenheimer breakdown (BO) interactions were considered in this energy spectroscopic model. A constant value was utilised for these interactions across all bond lengths. For the off-diagonal spin-orbit and angular momenta curves, this constant value was set as its ab initio value at 1.71 Å, which is the equilibrium bond length of the ground X electronic state. The remaining values were fit using the MARVEL experimental data. The diagonal coupling parameters are provided in Tables 1 and 2 for all ten electronic states. The off-diagonal coupling parameters can be found in the Duo .model file.
Ultimately, the energy spectroscopic model constructed herein can accurately reproduce the MARVEL experimental energies for all ten electronic states. This is shown by the absolute energy residuals summarised statistically in Table 3, which were calculated as the absolute difference between the MARVEL experimental and variational energies.
In Table 4, the X and B equilibrium spectroscopic parameters from this 90Zr16O model are compared to selected literature studies. There is a general agreement across all sources, with strong agreement to the MARVEL experimental parameters (McKemmish et al., 2018) as expected from the fitting procedure. The greatest deviations are observed in comparison to the theoretical parameters (Langhoff & Bauschlicher, 1990) as expected due to the inaccuracies of quantum chemistry in modelling complex transition metal diatomic molecules (Tennyson et al., 2016).
3.2 Intensity Spectroscopic Model
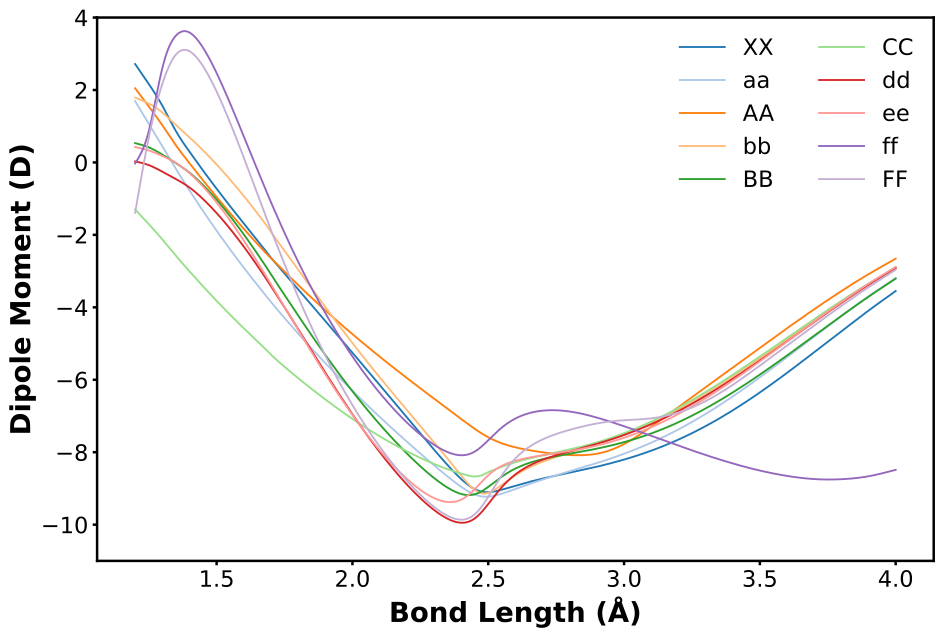
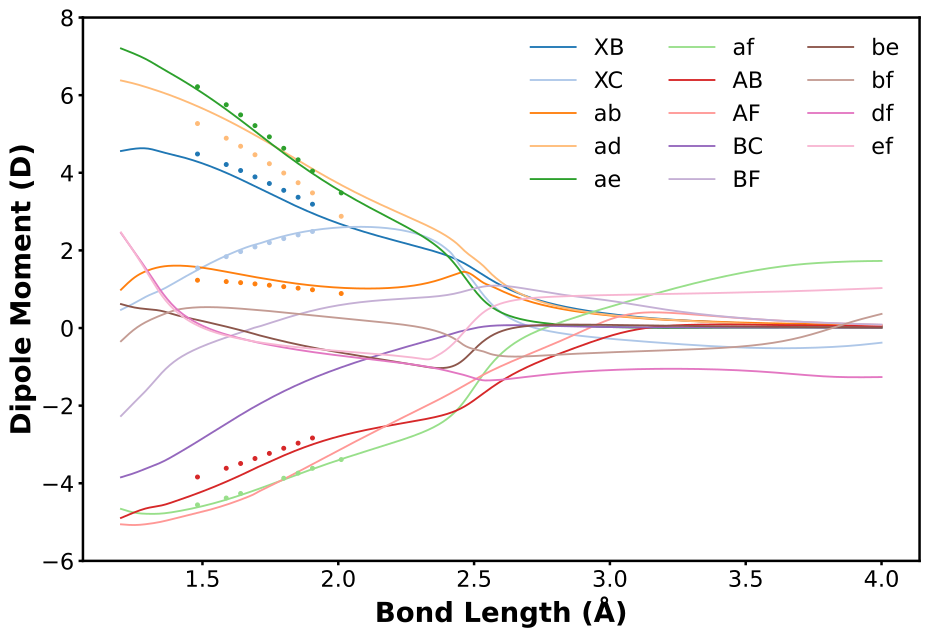
The 90Zr16O intensity spectroscopic model contains only ab initio dipole moment curves as is standard practice. These curves were inserted into the .model file without fitting to a functional form, where all interpolation was performed by Duo using natural splines. The intensity spectroscopic model includes all diagonal (permanent) and off-diagonal (transition) dipole moment curves shown in Figures 3 and 4, respectively. The latter also includes values calculated by Langhoff & Bauschlicher (1990) for various off-diagonal curves.
The ab initio dipole moment curves in Figures 3 and 4 are exceptional for a transition metal diatomic molecule. Importantly, all curves are smooth and well-defined around the equilibrium bond length of each electronic state. Apart from the f electronic state, all diagonal dipole moment curves follow the same pattern as they tend towards zero. The f diagonal curve likely approaches zero beyond 5 Å. Similarly, the off-diagonal dipole moment curves generally converge to zero. These off-diagonal curves are consistent with the values calculated by Langhoff & Bauschlicher (1990) around the equilibrium bond length. The off-diagonal dipole moment curves associated with the f electronic state again likely tend towards zero beyond 5 Å. The high f dipole moment values around 4 Å may be due to a remaining predominant ionic behaviour before reaching the neutral fragment at the dissociation. Nevertheless, it was found that the vibrational basis functions generated by Duo have negligible amplitude beyond 2.5 Å for all electronic states. This eliminates the need for these ab initio curves beyond this bond length.
| unc | State | Source | |||||||||||||
|---|---|---|---|---|---|---|---|---|---|---|---|---|---|---|---|
| 5633 | 18746.741719 | 13 | 6 | 9.2000E+00 | 2.3475E–03 | 9.4090E–02 | - | f | a3Delta | 20 | -2 | 0 | -2 | Ca | 18746.741719 |
| 5634 | 18778.561300 | 13 | 6 | 5.8000E–02 | 6.4538E–08 | 2.3798E–02 | - | f | B1Pi | 4 | -1 | 0 | -1 | EH | 18778.515781 |
| 5635 | 18817.703605 | 13 | 6 | 1.2000E–02 | 3.9329E–08 | 2.1485E–01 | - | f | d3Phi | 2 | -3 | 0 | -3 | Ma | 18817.782124 |
| Column | Symbol | Descriptor |
|---|---|---|
| 1 | State Index | |
| 2 | Energy (in cm-1) | |
| 3 | Total Degeneracy | |
| 4 | Total Angular Momentum | |
| 5 | unc | Uncertainty (in cm-1) |
| 6 | Lifetime (in s) | |
| 7 | Landé -Factor | |
| 8 | Total Parity | |
| 9 | Rotationless Parity | |
| 10 | State | Electronic State |
| 11 | Vibrational State | |
| 12 | Projection Along Internuclear Axis | |
| 13 | Projection Along Internuclear Axis | |
| 14 | Projection Along Internuclear Axis | |
| (with = + ) | ||
| 15 | Source | State Source (Ma, EH or Ca) |
| 16 | Variational Energy (in cm-1) |
| 391 | 1 | 4.7878E–07 |
| 392 | 1 | 9.9341E+00 |
| 393 | 1 | 2.5024E–02 |
| Column | Symbol | Descriptor |
|---|---|---|
| 1 | Final State Index | |
| 2 | Initial State Index | |
| 3 | Einstein A Coefficient (in s-1) |
4 ZrO Line List Construction
4.1 Methodology Overview
The line list construction approach of Syme & McKemmish (2021) is followed herein for ZrO, where the MARVEL experimental, MoLLIST perturbative and Duo variational energies are collated into a trihybrid line list. This methodology exploits the advantages of each methodology to produce the most accurate and comprehensive line list for ZrO.
In accordance with ExoMol line lists conventions, a trihybrid line list is prepared by updating the energies of the variational .states file. The trihybrid methodology prioritises the experimental energies due to their superior accuracy and reliable uncertainties. These replace the variational energies wherever possible with subsequent interpolation by the perturbative energies. The final trihybrid .states file includes the methodology and variational energy of each state, where the abbreviations Ma, EH and Ca represent the experimental (MARVEL), perturbative (effective Hamiltonian) and variational (calculated) methodologies, respectively.
The 90Zr16O variational line list is output directly from Duo using the energy and intensity spectroscopic model detailed in Section 3. The quantum numbers are given in terms of Hund’s coupling case (a). The 90Zr16O trihybrid line list was created by replacing the variational energies with MARVEL experimental energies (McKemmish et al., 2018) where available, followed by interpolation MoLLIST perturbative energies (Sorensen & Bernath, 2021) to cover any missing experimental data. These energy replacements were performed using an external Python script by grouping equivalent rovibronic states from each source by their electronic state, parity, , and quantum numbers.
For all other isotopologues, a variational line list can be constructed trivially by changing the nuclear masses in the main spectroscopic model. Following Polyansky et al. (2017), the accuracy of this line list can be improved by applying an isotopologue extrapolation term that shifts each energy based on the difference between the variational and trihybrid line lists of the main 90Zr16O isotopologue as
| (2) |
where is the calculated variational energy of the main isotopologue, is its trihybrid energy, is the calculated variational energy of a given isotopologue and is its isotopologue-extrapolated energy. In other words, it is assumed that the energy residuals between the hybridised and variational line lists are constant for all isotopologues.
| (K) | 90Zr16O | MARVEL | B & C (2016) | 91Zr16O | 92Zr16O | 93Zr16O | 94Zr16O | 96Zr16O |
|---|---|---|---|---|---|---|---|---|
| 0 | 1.00000E+00 | 1.00000E+00 | 1.00000E+00 | 6.00000E+00 | 1.00000E+00 | 6.00000E+00 | 1.00000E+00 | 1.00000E+00 |
| 1 | 2.02450E+00 | 2.02446E+00 | 2.02843E+00 | 1.21627E+01 | 2.02970E+00 | 1.21936E+01 | 2.03480E+00 | 2.03970E+00 |
| 10 | 1.68071E+01 | 1.68071E+01 | 1.68283E+01 | 1.01007E+02 | 1.68614E+01 | 1.01327E+02 | 1.69137E+01 | 1.69642E+01 |
| 100 | 1.64881E+02 | 1.64881E+02 | 1.65280E+02 | 9.90930E+02 | 1.65423E+02 | 9.94124E+02 | 1.65946E+02 | 1.66450E+02 |
| 300 | 5.06399E+02 | 5.06325E+02 | 5.07801E+02 | 3.04356E+03 | 5.08103E+02 | 3.05359E+03 | 5.09746E+02 | 5.11330E+02 |
| 500 | 1.00696E+03 | 1.00632E+03 | 1.01006E+03 | 6.05271E+03 | 1.01057E+03 | 6.07397E+03 | 1.01405E+03 | 1.01741E+03 |
| 800 | 2.51223E+03 | 2.50894E+03 | – | 1.51030E+04 | 2.52201E+03 | 1.51606E+04 | 2.53144E+03 | 2.54054E+03 |
| 1,000 | 4.19424E+03 | 4.18561E+03 | 4.20923E+03 | 2.52168E+04 | 4.21119E+03 | 2.53167E+04 | 4.22754E+03 | 4.24333E+03 |
| 1,500 | 1.11864E+04 | 1.10826E+04 | 1.12345E+04 | 6.72634E+04 | 1.12343E+04 | 6.75461E+04 | 1.12806E+04 | 1.13253E+04 |
| 2,000 | 2.25679E+04 | 2.18849E+04 | 2.26794E+04 | 1.35711E+05 | 2.26679E+04 | 1.36300E+05 | 2.27645E+04 | 2.28577E+04 |
| 3,000 | 6.02447E+04 | 5.32615E+04 | 6.06178E+04 | 3.62304E+05 | 6.05206E+04 | 3.63930E+05 | 6.07869E+04 | 6.10441E+04 |
| 5,000 | 2.10516E+05 | 1.36797E+05 | 2.14087E+05 | 1.26600E+06 | 2.11476E+05 | 1.27166E+06 | 2.12401E+05 | 2.13295E+05 |
4.2 Line List Overview
The ZorrO trihybrid .states file contains 227,118 rovibronic states with 13,075 (7,769 unique) experimental states, 106 perturbative states and 213,937 variational states. These were calculated up to the dissociation limit of 63,637 cm-1, although the electronic structure of ZrO is poorly understood above 30,000 cm-1 (McKemmish et al., 2018). An extract of the final .states files is shown Table 5 with associated column descriptors in Table 6.
The ZorrO trihybrid .trans file contains 47,662,773 transitions. A maximum transition frequency threshold of 30,000 cm-1 was applied as this range is suitable for most telescopes and ensures that the X and a bands are reliable. These transitions were only calculated for states with lower energy below 20,000 cm-1 given that this contains 99.999% of the total population at 2,000 K according to the Boltzmann distribution. A vibrational basis set up to = 30 was used for each electronic state with rotational states calculated to = 200. An extract of the final .trans files is shown Table 7 with associated column descriptors in Table 8. Additionally, isotopologue-extrapolated hybrid line lists were prepared for 91Zr16O, 92Zr16O, 93Zr16O, 94Zr16O and 96Zr16O using the technique in Section 4.1.
4.3 Uncertainties
The uncertainties assigned to the experimental, perturbative and variational energies were all evaluated differently.
For the main 90Zr16O isotopologue, the experimental uncertainties were obtained directly from the MARVEL analysis. The perturbative uncertainties were averaged from the experimental uncertainties with the same vibrational and rotational quantum numbers, where the experimental and perturbative energies are known to have similar accuracy when interpolating. The variational uncertainties were approximated using the energy residuals in Table 3. For energies within a vibrational state in the MARVEL analysis, the uncertainty is given as the largest energy residual with the same vibrational quantum number. For energies within a vibrational state unknown by the MARVEL analysis, the uncertainty is given as twice the largest energy residual in the same electronic state. All uncertainties were rounded to two significant figures.
For the five other isotopologues, all uncertainties were doubled to account for errors arising from the isotopologue-extrapolation technique.
5 ZrO Line List Analysis
ExoCross (Yurchenko et al., 2018) was used to generate partition functions, lifetimes and cross sections for all six ZrO isotopologues studied here.
5.1 Partition Functions
The partition functions were calculated using
| (3) |
where is the nuclear spin statistical weight factor, is the total angular momentum excluding nuclear spin, (in cm K), is the energy term value (in cm-1), and is temperature (in K).
In Table 9, the six partition functions are evaluated at selected temperatures. For 90Zr16O, the partition function is compared to values calculated by McKemmish et al. (2018) and Barklem & Collet (2016). There is strong agreement between the ZorrO data and Barklem & Collet (2016), even at 5,000 K, thus strongly corroborating both data sets. The MARVEL-only data are surprisingly complete to 2,000 K, although the lack of vibrational states results in an underestimation of the partition function at higher temperatures.
5.2 Lifetimes
The lifetime of each rovibronic state is calculated as
| (4) |
where are Einstein A coefficients.
In Table 10, selected excited vibronic lifetime of 90Zr16O are presented as averaged over all rotational states with with -resolution. For three electronic states, the vibronic lifetimes of ZorrO can be compared to experimental values from Hammer & Davis (1979) and Simard et al. (1988); this comparison provides the best experimental validation of the computed off-diagonal (transition) dipole moments. The C state agreement is exceptional. The B and e state theory-experiment agreement is reasonable, with our new theoretical predictions slightly closer to experimental data than the earlier theoretical calculations.
These vibronic lifetimes are also compared to theoretical values from Langhoff & Bauschlicher (1990), with typically strong agreement as expected given the similarity in the dipole moment curves. The largest error is for the b lifetime, which is unexpected since the dominant contribution, the b – a dipole moment curve, is almost identical. This was investigated to ensure the correct conversion from Molpro output to Duo input was performed, but the cause of this discrepancy could not be identified. It should be noted that the e – a transition was treated in the same way, resulting in e lifetimes very similar to Langhoff & Bauschlicher (1990) and close to experimental data. Any b experimental lifetimes will thus be helpful here.
| State | ZorrO | L & B (1990) | Experiment | ||
|---|---|---|---|---|---|
| b | 0 | 0 | 1580 | 1070 | – |
| 0 | 1 | 1630 | 1070 | – | |
| 0 | 2 | 1720 | 1070 | – | |
| B | 0 | 1 | 62.9 | 56.4 | 83 |
| C | 0 | 0 | 130 | 136 | 126(9) |
| d | 0 | 2 | 40.3 | 45.9 | – |
| 0 | 3 | 38.1 | 45.9 | – | |
| 0 | 4 | 35.8 | 45.9 | – | |
| e | 0 | 0 | 25.5 | 24.4 | 32.5(2) |
| 0 | 1 | 26.4 | 24.4 | 32.5(2) | |
| 0 | 2 | 27.3 | 24.4 | 32.5(2) | |
| f | 0 | 1 | 21.7 | 28.3 | – |
| 0 | 2 | 21.8 | 28.3 | – | |
| 0 | 3 | 21.5 | 28.3 | – |
5.3 Cross Sections
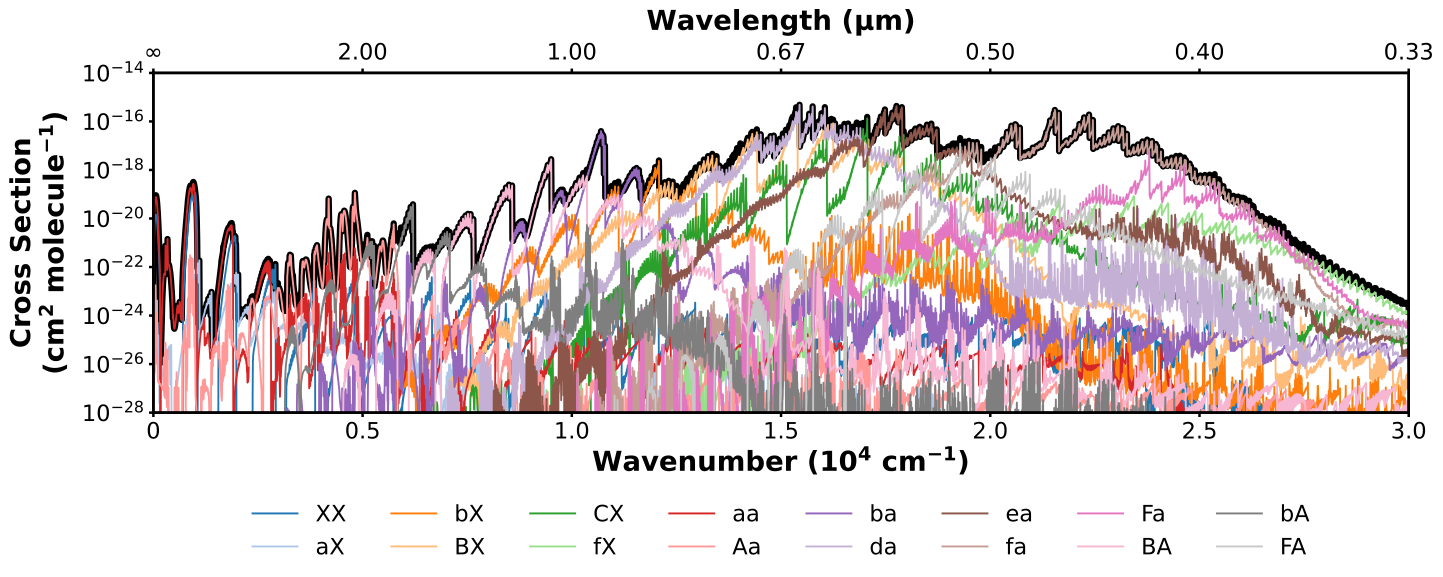
Here, cross sections are presented for the main 90Zr16O isotopologue only. The absorption cross sections in Figures 5, 6 and 7 were simulated using a Gaussian lineshape with a half-width at half-maximum of 2 cm-1. The emission cross section in Figure 8 was simulated using a half-width at half-maximum of 0.1 cm-1 to replicate the laboratory spectrum.
In Figure 5, the total 90Zr16O absorption cross section at 2,000 K is decomposed into its primary transition bands for 0 – 30,000 cm-1. The spectrum possesses many intense transitions in all spectral regions. The visible region is the most prominent, where the B – X , (f – a ), (e – a ), (d – a ) transitions dominate.
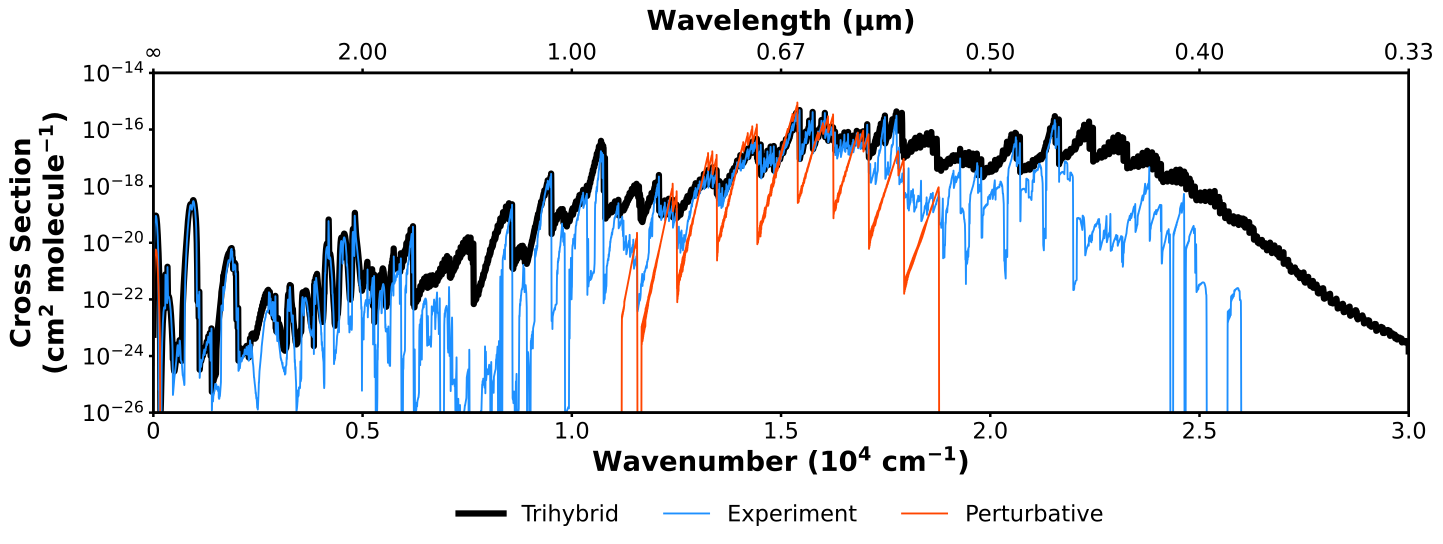
In Figure 6, the total 90Zr16O absorption cross section at 2,000 K is generated using three line lists. The black, blue and orange cross sections indicate transitions provided by the trihybrid, MARVEL experimental (with variational intensities) and MoLLIST perturbative line lists, respectively. As expected, the trihybrid line list produces the most comprehensive cross section due to its inclusion of the variational transition intensities calculated in this work. The MARVEL analysis offers good coverage in the visible and near-infrared spectral regions corresponding to the major B – X , , and rovibronic transitions. The MoLLIST cross section is only present for the B – X transition. Evidently, the MoLLIST line list can not sufficiently model the total 90Zr16O absorption cross section given that it does not account for many other overlapping transitions.
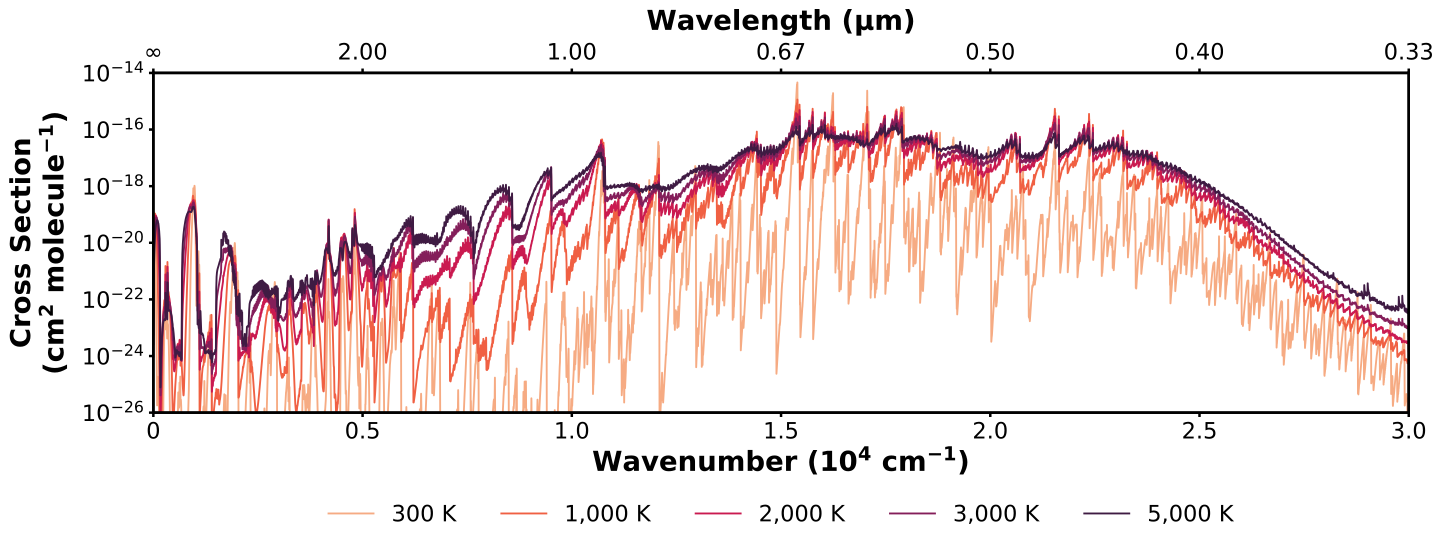
In Figure 7, the total 90Zr16O absorption cross section is simulated at several temperatures. The weaker bands in the cross section increase in intensity and become less defined with increasing temperature.
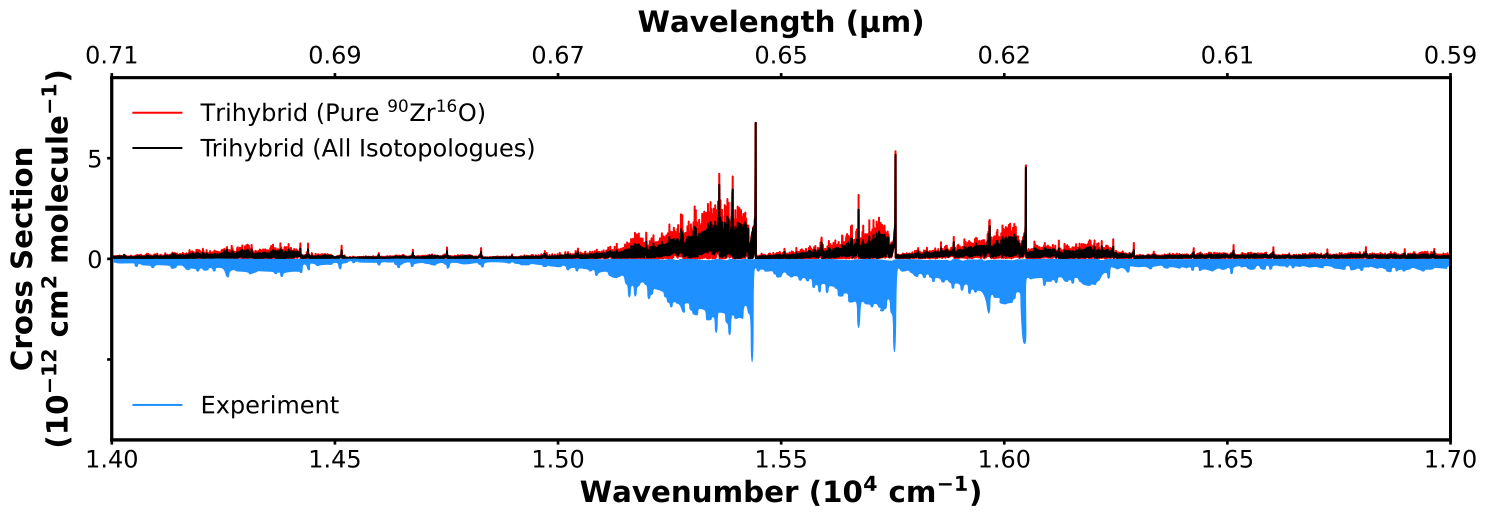
In Figure 8, the 90Zr16O emission cross section simulated from the trihybrid line list is compared with an experimental emission spectrum for 14,000 – 17,000 cm-1, which was recorded at 2,390 K with a resolution of 0.04 cm-1 and was used in the perturbative analysis of Sorensen & Bernath (2021). As expected, the transition frequencies are in excellent agreement between both spectra, including for many weaker bands. The transition intensities from the trihybrid line list provide an accurate description of the experimental spectrum, which supports the off-diagonal dipole moment curves in Figure 4. Overall, this comparison is a good improvement over an analogous figure provided by Sorensen & Bernath (2021) using their B – X line list.
5.4 High-Resolution Considerations
In order to assess the suitability of a line list for use in the high-resolution cross-correlation (abbreviated as HRCC) detection of a molecule, it is critical to know the accuracy with which line positions are known. The accuracy of a transition frequency depends on the source of the energies of its upper and lower state. If both the upper and lower state energies are known from MARVEL data (with typically low uncertainties), then its frequency can be assumed to be known to high accuracy. Conversely, if one or both of the energy levels are calculated from the Duo variational spectroscopic model, then the frequency will have much higher uncertainty; it is assumed here that it is insufficiently accurate for HRCC studies. The effective Hamiltonian perturbative data can be neglected from this discussion due to the low number of energies in the ZorrO line list.
Again, in Figure 6, the cross section of the full ZorrO trihybrid line list (assumed to be near complete based on partition function considerations and the inclusion of all predicted low-lying electronic states) is compared with the cross section predicted solely by MARVEL data (assumed to be highly accurate). In spectral regions where the two curves overlap, it should be understood that the transition frequency of the strong line is predicted to experimental (MARVEL) accuracy. In this case, Figure 6 shows that the ZorrO trihybrid line list is suitable for HRCC primarily between 12,500 – 17,500 cm-1 (571 – 800 nm) at 2,000 K, but not in most other spectral regions. Fortunately, this region is typically quite experimentally accessible. It should be noted that this figure can be readily generated at different temperatures using ExoCross and examined at higher resolutions to ensure suitability for a desired application.
Additionally, Figure 6 clearly demonstrates the challenges one might face using the previous Sorensen & Bernath (2021) data alone for HRCC. Narrow spectral windows would be needed, often undesirable as they reduce signal strength. Further, the d – a band (not present in this earlier data) overlaps almost entirely with the well-predicted B – X band; cross-correlation using the Sorensen & Bernath (2021) as template data would therefore utilise fewer lines and thus require a much higher signal-to-noise observational data for detection than cross-correlation using our new ZorrO line list data.
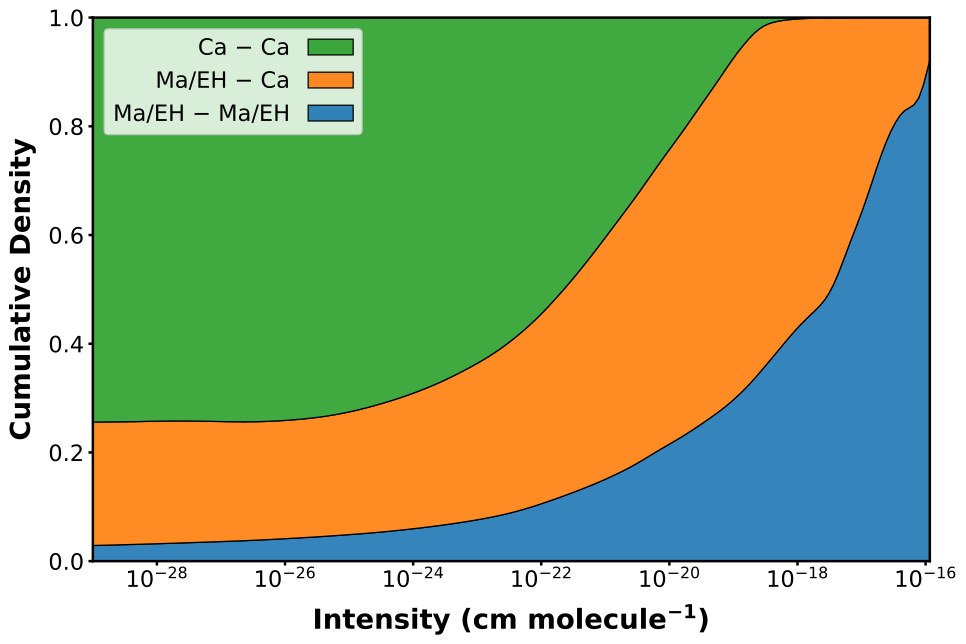
A useful complementary perspective on high-resolution completeness is obtained from Figure 9. This plot is read by looking at vertical slices to visualise the source of upper and lower state energies for transitions above that intensity. For example, the vertical slice at cm molecule-1 shows that about half of all transitions with intensity greater than cm molecule-1 have both upper and lower energies from the high-resolution MARVEL/MoLLIST data; this means that the ZorrO line list cannot be trusted to accurately predict about half of all transitions with strength above cm molecule-1 at 2,000 K. This statistic emphasises the importance of carefully selecting the spectral range for HRCC in ZrO. For molecules with sufficient MARVEL data, there is thus expected to be fewer restrictions on the spectral regions suitable for HRCC detections.
In order to improve the high-resolution completeness of the ZorrO trihybrid line list for HRCC studies, the 90Zr16O MARVEL analysis would need to be expanded with new experimental data. The most important gaps are the e and f electronic states, which will enable accuracy at shorter wavelengths than currently possible, while the b electronic state would be useful for longer wavelength studies.
6 Conclusions and Future Directions
Modern searches for molecules like ZrO rely on both traditional mid-resolution space-based observations (such as from JWST) and very high-resolution ground-based observations (such as from ESPRESSO/VLT). In order to enable the former and thus successfully model complex physical and chemical processes in astronomical bodies, experience has shown that a high coverage of absorption lines across a wide temperature and spectral range is important (Fortenberry, 2017; Tennyson & Yurchenko, 2012). In contrast, to enable molecule detection using the modern high-resolution cross-correlation spectroscopic technique, line positions for strong lines must be accurate to about 0.1 cm-1 over the desired spectral region; astronomers should select spectral regions based on the accuracy of the best available line lists.
Therefore, the joint goals of accuracy and completeness are achieved by carefully combining experimental data (to provide high accuracy) with computational models (to provide high completeness). In the construction of the ZorrO trihybrid line list for ZrO, experimental data are combined with data generated from perturbative (effective Hamiltonians) and variational models. The novel spectroscopic model presented herein considered the ten low-lying X , a , A , b , B , C , d , e , f and F electronic states of ZrO.
Through the trihybrid methodology, the ZorrO line list is now the most accurate and comprehensive line list available for ZrO. Line lists are available for the main 90Zr16O isotopologue, as well as the 91Zr16O, 92Zr16O, 93Zr16O, 94Zr16O and 96Zr16O isotopologues. This new data can be reliably used for molecular detections using high-resolution cross-correlation techniques in the 12,500 – 17,500 cm-1 (571 – 800 nm) spectral region, but should not be used at other wavelengths due to the insufficiently complete experimental data. Studies of other vibronic bands of the B – X and b – a transitions would enable use of high-resolution techniques in a wider spectral region.
Acknowledgements
This research was undertaken with the assistance of resources from the National Computational Infrastructure (NCI Australia), an NCRIS enabled capability supported by the Australian Government.
The authors declare no conflicts of interest.
Data Availability Statement
All line list data for this article are available on the ExoMol website, specifically:
-
•
The main ZorrO .model file (90Zr16O_ZorrO.model).
-
•
The main ZorrO partition function from 0 – 10,000 K (90Zr16O_ZorrO.pf).
-
•
The main ZorrO .states file (90Zr16O_ZorrO.states).
-
•
The main ZorrO .trans file (90Zr16O_ZorrO.trans).
-
•
All other isotopologue .model, .pf, .states and .trans files (in their respective folders).
The Duo spectroscopic model, partition function and .states files for the main 90Zr16O isotopologue are included as supporting information for this paper. The Molpro quantum chemistry input files are also included for the MRCI calculations.
References
- Barklem & Collet (2016) Barklem P. S., Collet R., 2016, Astronomy and Astrophysics, 588
- Bernath (2020) Bernath P. F., 2020, Journal of Quantitative Spectroscopy and Radiative Transfer, 240, 106687
- Birkby (2018) Birkby J. L., 2018, Spectroscopic Direct Detection of Exoplanets. Springer International Publishing, Cham, pp 1485–1508, doi:10.1007/978-3-319-55333-7˙16, https://doi.org/10.1007/978-3-319-55333-7_16
- Bobrovnikoff (1934) Bobrovnikoff N. T., 1934, The Astrophysical Journal, 79, 483
- Borsa et al. (2021) Borsa F., et al., 2021, Astronomy and Astrophysics, 645
- Brogi & Line (2018) Brogi M., Line M. R., 2018, The Astronomical Journal, 157, 114
- Fortenberry (2017) Fortenberry R. C., 2017, International Journal of Quantum Chemistry, 117, 81
- Furtenbacher et al. (2007) Furtenbacher T., Császár A. G., Tennyson J., 2007, Journal of Molecular Spectroscopy, 245, 115
- Hammer & Davis (1979) Hammer P. D., Davis S. P., 1979, Journal of Molecular Spectroscopy, 78, 337
- Huber & Herzberg (1979) Huber K. P., Herzberg G., 1979, Molecular Spectra And Molecular Structure, IV. Constants Of Diatomic Molecules
- Keenan (1954) Keenan P. C., 1954, The Astrophysical Journal, 120, 484
- Keenan & Boeshaar (1980) Keenan P. C., Boeshaar P. C., 1980, The Astrophysical Journal Supplement Series, 43, 379
- Kendall et al. (1992) Kendall R. A., Dunning T. H., Harrison R. J., 1992, The Journal of Chemical Physics, 96, 6796
- Landman et al. (2021) Landman R., Sánchez-López A., Mollière P., Kesseli A. Y., Louca A. J., Snellen I. A., 2021, Astronomy and Astrophysics, 656
- Langhoff & Bauschlicher (1990) Langhoff S. R., Bauschlicher C. W., 1990, The Astrophysical Journal, 349, 369
- McKemmish (2021) McKemmish L. K., 2021, WIREs Computational Molecular Science, 11
- McKemmish et al. (2018) McKemmish L. K., et al., 2018, The Astrophysical Journal, 867, 33
- McKemmish et al. (2019) McKemmish L. K., Masseron T., Hoeijmakers H. J., Pérez-Mesa V., Grimm S. L., Yurchenko S. N., Tennyson J., 2019, Monthly Notices of the Royal Astronomical Society, 488, 2836
- Murad & Hildenbrand (1975) Murad E., Hildenbrand D. L., 1975, The Journal of Chemical Physics, 63, 1133
- Nomura et al. (1983) Nomura M., Kogure K., Okamoto M., 1983, International Journal of Mass Spectrometry and Ion Physics, 50, 219
- Nugroho et al. (2017) Nugroho S. K., Kawahara H., Masuda K., Hirano T., Kotani T., Tajitsu A., 2017, The Astronomical Journal, 154, 221
- Peterson et al. (2007) Peterson K. A., Figgen D., Dolg M., Stoll H., 2007, Journal of Chemical Physics, 126
- Piccirillo (1980) Piccirillo J., 1980, Monthly Notices of the Royal Astronomical Society, 190, 441
- Plez (1998) Plez B., 1998, A new TiO line list, http://sumner.berkeley.edu/
- Plez et al. (2003) Plez B., Eck S. V., Jorissen A., Edvardsson B., Eriksson K., Gustafsson B., 2003, A MARCS grid of S-type Star Atmospheres
- Polyansky et al. (2017) Polyansky O. L., Kyuberis A. A., Lodi L., Tennyson J., Yurchenko S. N., Ovsyannikov R. I., Zobov N. F., 2017, Monthly Notices of the Royal Astronomical Society, 466, 1363
- Richardson (1931) Richardson R. S., 1931, Publications of the Astronomical Society of the Pacific, 43, 76
- Simard et al. (1988) Simard B., Mitchell S., Humphries M., Hackett P., 1988, Journal of Molecular Spectroscopy, 129, 186
- Sorensen & Bernath (2021) Sorensen J. J., Bernath P. F., 2021, The Astrophysical Journal, 923, 234
- Syme & McKemmish (2021) Syme A.-M., McKemmish L. K., 2021, Monthly Notices of the Royal Astronomical Society, 505, 4383
- Tabernero et al. (2021) Tabernero H. M., et al., 2021, Astronomy and Astrophysics, 646
- Tabet et al. (2019) Tabet J., Adem Z., Taher F., 2019, Computational and Theoretical Chemistry, 1160, 31
- Tennyson & Yurchenko (2012) Tennyson J., Yurchenko S. N., 2012, Monthly Notices of the Royal Astronomical Society, 425, 21
- Tennyson et al. (2016) Tennyson J., Lodi L., McKemmish L. K., Yurchenko S. N., 2016, Journal of Physics B: Atomic, Molecular and Optical Physics, 49, 102001
- Van Eck et al. (2017) Van Eck S., et al., 2017, Astronomy and Astrophysics, 601
- Werner et al. (2020) Werner H. J., et al., 2020, Journal of Chemical Physics, 152
- Yurchenko et al. (2016) Yurchenko S. N., Lodi L., Tennyson J., Stolyarov A. V., 2016, Computer Physics Communications, 202, 262
- Yurchenko et al. (2018) Yurchenko S. N., Al-Refaie A. F., Tennyson J., 2018, Astronomy & Astrophysics, 614, A131