Composite Bulges – III. A Study of Nuclear Star Clusters in Nearby Spiral Galaxies
Abstract
We present photometric and morphological analyses of nuclear star clusters (NSCs) – very dense, massive star clusters present in the central regions of most galaxies – in a sample of 33 massive disk galaxies within 20 Mpc, part of the “Composite Bulges Survey.” We use data from the Hubble Space Telescope including optical (F475W and F814W) and near-IR (F160W) images from the Wide Field Camera 3. We fit the images in 2D to take into account the full complexity of the inner regions of these galaxies (including the contributions of nuclear disks and bars), isolating the nuclear star cluster and bulge components. We derive NSC radii and magnitudes in all 3 bands, which we then use to estimate NSC masses. Our sample significantly expands the sample of massive late-type galaxies with measured NSC properties. We clearly identify nuclear star clusters in nearly 80% of our galaxies, putting a lower limit on the nucleation fraction in these galaxies that is higher than previous estimates. We find that the NSCs in our massive disk galaxies are consistent with previous NSC mass-NSC radius and Galaxy Mass-NSC Mass relations. However, we also find a large spread in NSC masses, with a handful of galaxies hosting very low-mass, compact clusters. Our NSCs are aligned in PA with their host galaxy disks but are less flattened. They show no correlations with bar or bulge properties. Finally, we find the ratio of NSC to BH mass in our massive disk galaxy sample spans a factor of 300.
1 Introduction
Most galaxies today have a central massive object that is indicative of current or past extreme activity at their centers. These central massive objects can be a supermassive black hole (SMBH), a nuclear star cluster (NSC), or a combination of both. A review of NSC properties has recently been compiled by Neumayer et al. (2020). NSCs are extremely luminous objects that are present in the centers of a majority of all types of galaxies (e.g., Phillips et al., 1996; Carollo et al., 1998; Böker et al., 2002; Côté et al., 2006; Georgiev et al., 2009). They are compact, massive star clusters with an effective radius ranging from 3 – 20 pc (e.g., Böker et al., 2004; Côté et al., 2006; Walcher et al., 2006; Georgiev & Böker, 2014; Georgiev et al., 2016) and dynamical and stellar populaton based masses from – (e.g., Walcher et al., 2005; Rossa et al., 2006; Erwin & Gadotti, 2012; Spengler et al., 2017; Nguyen et al., 2018). NSCs are known to be more massive and denser than GCs (Walcher et al., 2005; Hopkins & Quataert, 2010).
NSCs are mostly frequently found in intermediate-mass galaxies ( ) with a nucleation fraction (the fraction of galaxies studied that host an NSC) of –90% in the early-type galaxies (Côté et al., 2006; Turner et al., 2012; den Brok et al., 2014; Sánchez-Janssen et al., 2019; Hoyer et al., 2021) and % in the late-types (Böker et al., 2002; Seth et al., 2006; Georgiev & Böker, 2014; Neumayer et al., 2020; Hoyer et al., 2021) in this same mass range. More recent studies of early-type galaxies have shown a strong mass dependence and milder environmental dependence on the nucleation fraction. Sánchez-Janssen et al. (2019), Zanatta et al. (2021), and Carlsten et al. (2022) found the nucleation fraction to be as high as 90% for galaxy stellar masses of 109 M⊙, decreasing towards both lower and higher mass galaxies. Neumayer et al. (2020) and Hoyer et al. (2021) found a similar trend for late-type galaxies at lower masses, but at higher masses ( ) a lack of data means we do not know if the nucleation fraction of late-types decreases in the same way as early-types.
NSCs are located at the dynamical centers of their galaxies (Neumayer & Walcher, 2012). NSCs and SMBHs are known to co-exist, including in the Milky Way (e.g., Seth et al., 2008a; Graham & Spitler, 2009; Seth et al., 2010; Georgiev et al., 2016; Nguyen et al., 2019; Neumayer et al., 2020). The relative masses of NSCs and SMBHs appears to span a wide range, with NSCs being more massive than SMBHs in many lower mass galaxies, while SMBHs are the dominant component in higher mass galaxies (Graham & Spitler, 2009; Neumayer et al., 2020). The relationship between NSCs and SMBHs is complicated and unclear. NSCs may provide a seeding mechanism to create and/or grow massive black holes at the centers of galaxies (e.g. Stone et al., 2017; Inayoshi et al., 2020). A possible consequence of NSCs and SMBHs co-existing is the presence of Tidal Disruption Events (TDEs). This occurs when tidal forces pull apart a star as it approaches the SMBH. TDEs are observed mostly in low-mass galaxies with some intermediate-mass galaxies (galaxy stellar masses between 109–1010; Wevers et al., 2019).
The formation history of NSCs can be directly probed through their stellar populations. Spectroscopic analyses of NSCs show they have have multiple stellar populations, extended star formation histories, and strong rotation (e.g., Walcher et al., 2006; Rossa et al., 2006; Seth et al., 2006; Kacharov et al., 2018; Pinna et al., 2021; Fahrion et al., 2021; Hannah et al., 2021; Fahrion et al., 2022b). Another way of studying the formation mechanisms of NSCs is through their correlation with the SMBHs at their centers and their surrounding host galaxies. Mass measurements of NSCs and host galaxies have shown that these quantities are strongly correlated; initially these were thought to form a relation sismilar to SMBHs (e.g. Ferrarese et al., 2006; Wehner & Harris, 2006; Balcells et al., 2007; Graham, 2012; Scott et al., 2013); however, more recent work shows the NSC and SMBH scaling relations are quite different (e.g. Erwin & Gadotti, 2012; Georgiev et al., 2016; Sánchez-Janssen et al., 2019).
An in-depth analyses of NSC scaling relations in different galaxy environments can help us understand what physical mechanisms play an important role in NSC formation and how NSCs impact the overall evolution of the host galaxy. Evidence from previous studies (e.g., Hartmann et al., 2011; Antonini et al., 2012; Neumayer et al., 2020; Fahrion et al., 2021, 2022a) show that there are two primary formation mechanisms that drive the growth of NSCs, (1) star cluster mergers (Tremaine et al., 1975; Gnedin et al., 2014), or (2) in situ formation (Bekki, 2007; Antonini et al., 2015). The relative importance of these mechanisms seems to depend on the galaxy stellar mass. Specifically, recent work (Neumayer et al., 2020; Fahrion et al., 2021, 2022a, 2022b) finds that the NSCs of low mass galaxies primarily grow from cluster mergers, while in higher mass galaxies the NSCs grow from in situ formation. A reflection of this transition seems to be present in the scaling relations as well, with the NSC masses scaling with the square root of their host galaxy masses at lower masses but steepening to a more linear relationship in higher mass galaxies (den Brok et al., 2014; Sánchez-Janssen et al., 2019).
The changing properties of NSCs as a function of galaxy morphology and the resulting implications for their formation are not yet fully understood. Overall, there have been more studies of early-type than late-type galaxies, especially towards higher masses where dust and bulge contributions make studying late-type NSCs more challenging. Therefore, most observations of NSCs in late-type galaxies have focused on lower-mass galaxies; this includes both HST imaging to quantify structure (Georgiev et al., 2009; Böker et al., 2002, 2004; Georgiev & Böker, 2014; Carson et al., 2015; Hoyer et al., 2023a), and spectroscopic observations focused on kinematics and stellar populations (Walcher et al., 2005; Kacharov et al., 2018; Pinna et al., 2021; Fahrion et al., 2022b). These observations are broadly consistent with the NSC mass trends discussed in the previous paragraph. However, some differences have been suggested in NSCs in early vs. late-type galaxies. For instance, the compilation of data by Georgiev et al. (2016) found that the sizes of NSCs in massive early-type galaxy are 2 larger than those in late-type galaxies, although Neumayer et al. (2020) suggested this difference may only exist at the highest masses. Late-type galaxies also seem to show stronger rotation on average than early-type galaxies (Pinna et al., 2021).
Some studies exist of higher-mass, more bulge-dominated late-type galaxies as well, most notably the studies Carollo et al. (1998, 2002), which found that a a majority of massive spiral galaxies do host NSCs. However, the information available on these NSCs is quite heterogeneous (i.e. photometric bands, sizes) making them challenging to interpret together. Stellar population measurements of a subset of these galaxies by Rossa et al. (2006) found that these galaxies clusters tended to be older than those in lower mass late-type galaxies. The recent paper by Hoyer et al. (2023b) shows the promise of JWST for studying NSCs in massive galaxies due to its high angular resolution, ability to penetrate dust, and the broad spectral energy distribution measurements it can obtain. Despite these studies, we still know little about the populations of NSCs in massive late-type galaxies (like the Milky Way; MW hereafter), which leads to a lack of knowledge about the NSCs in these galaxies and their co-existence with the ubiquitous SMBHs in these galaxies. In this paper, we focus on NSCs in high-mass () late-type galaxies, presenting a study of NSCs in 33 galaxies with high resolution, uniform imaging from the Composite Bulges Survey (CBS; Erwin et al. in prep).
Section 2 describes the galaxy sample selected from CBS, the high resolution HST data, and the other data used in this work. In Section 3, we describe in detail the morphological modelling process for the galaxies and NSCs, including derivation of morphological NSC parameters. We also discuss the quality of the fits and error estimates. In Section 4, we focus on the properties of the NSCs, including the nucleation fraction of our sample, NSC magnitudes and masses, and correlations between NSC internal properties. In section 5, we present scaling relations of the NSCs with their host galaxies. We also discuss briefly the presence of SMBHs in our galaxy sample. Section 6 summarizes our work in this paper.
2 Data sample
The work shown in this paper is part of the Composite Bulges Survey (CBS; Erwin et al. in prep). This survey is aimed at a detailed analysis of the stellar morphology and populations in the inner 1–2 kpc of massive disk galaxies, using both HST optical and near-IR imaging and VLT-MUSE IFU data.
CBS is based on a mass- and volume-limited sample of disk galaxies. These galaxies were selected from the de Vaucouleurs et al. (1995, RC3) catalog, restricted to galaxies with distances Mpc, stellar masses , S0–Sbc morphologies, inclinations between 35∘ and 60∘, declinations , and galactic latitudes . Based on these selections, a total of 53 galaxies were selected; these include a large number of Virgo Cluster galaxies.
2.1 NSC and MW-like sample selection
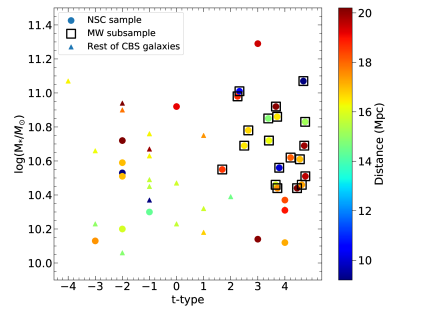
For the work shown in this paper we present NSC fits for a sub-sample of 33 galaxies from the parent CBS sample (hereafter the “NSC sample”). This sub-sample of the CBS survey was chosen to include a complete set of 20 galaxies form a complete Milky-Way like sample (hereafter the “MW-like” subsample). Our MW is a special galaxy which hosts the nearest NSC that can be studied in unparalleled detail. Understanding how typical or atypical the NSC in the MW is with the NSCs in similar galaxies is important. Hence we create this sample of MW-like galaxies which represents all galaxies having spiral morphologies () and stellar masses from to from CBS. We present NSC fits for the complete sample of CBS galaxies that have fit these criteria. In addition to these galaxies, we fit the NSCs of 13 additional galaxies – these galaxies are a random subsample of galaxies for which we had available larger scale models; the full sample of CBS galaxies morphological fits will be presented in Erwin et al. in prep. The circles in Figure 1 show all the 33 of the NSC sample galaxies; of these the MW-like subsample are shown as squares and the rest of the CBS sample as triangles. As can be seen, a majority of the CBS galaxies that are not included in our NSC sample are S0 type galaxies, while the NSC sample represents a nearly complete set of the Sa-Sbc galaxies. The properties of the NSC sample galaxies are summarized in Table 1.
2.2 HST data from CBS
For modeling the central morphology of each galaxy, we use a consistent set of high resolution HST data obtained using the Wide Field Camera 3 (WFC3) in the UVIS and IR modes (Cycle 25, Proposal ID 15133). We use the full-field WFC3/IR image in the F160W filter with a total integration time of 600s. The optical images were restricted to the C1K1C aperture for efficient readout and data transmission. This aperture is a 1024 X 1024-pixel subarray of the full-field WFC3/UVIS images centered on the galaxy nuclei. We use the F814W filter with a total integration time of 500s and the F475W filter with a total integration time of 700s. All of our images are divided into four dithered exposures to provide sub-pixel sampling. We note that the galaxies more than fill both detectors in many cases.
All the individual exposures from each band are combined using the Python-based DrizzlePac code. We set the output image scale for the UVIS images to 0.03″/pixel and for the IR images to 0.06″/pixel with a pixfrac = 0.7 in all cases. The sky subtraction during the processing of these images is turned off; we estimate the sky background using larger-scale ground-based or Spitzer IRAC1 images as explained in detail in Section 3.1.
2.3 Other data used in this work
For the large scale galaxy fitting and to determine the F160W image sky levels, we use Spitzer IRAC1 (3.6µm) images. The images for the galaxies come from either the S4G survey with a final mosaic pixel size of 0.75″/pixel (Sheth et al., 2010) or archive-generated mosaic images (Watkins et al., 2022) for galaxies not in S4G, with a default archive mosaic pixel of 0.6″/pixel. The program IDs for the IRAC1 images are listed in Table 1.
For determining the background sky levels in the UVIS images (Section 3.1), we use either SDSS and images or (for galaxies without SDSS images) , , and images from the Carnegie-Irvine Galaxy Survey (Ho et al., 2011), kindly provided by Luis Ho.
| Galaxy | Hubble type | RC3 type | Sample | log( M⋆/ M⊙) | Distance | Source | Spitzer program ID | AF814W | PAGal | log(M | |
|---|---|---|---|---|---|---|---|---|---|---|---|
| (Mpc) | degrees | M⊙ | |||||||||
| (1) | (2) | (3) | (4) | (5) | (6) | (7) | (8) | (9) | (10) | (11) | (12) |
| IC 2051 | 4 | SBbc | MW-like | 10.69 | 19.9 | 1 | 61060 | 0.18 | 70 | 0.42 | – |
| NGC 289 | 4 | SBbc | MW-like | 10.44 | 20.2 | 1 | 61064 | 0.03 | 130 | 0.29 | – |
| NGC 613 | 4 | SBbc | MW-like | 10.62 | 18.1 | 1 | 61064 | 0.03 | 115 | 0.19 | – |
| NGC 1097 | 3 | SBb | MW-like | 10.85 | 14.8 | 1 | 159 | 0.04 | 134 | 0.29 | – |
| NGC 1300 | 4 | SBbc | MW-like | 10.51 | 19.6 | 1 | 61065 | 0.05 | 87 | 0.17 | 7.91 |
| NGC 1440 | -2 | SB0 | NSC | 10.72 | 19.9 | 1 | 10043 | 0.16 | 25 | 0.20 | – |
| NGC 1566 | 4 | SABbc | MW-like | 10.61 | 17.0 | 1 | 159 | 0.01 | 34 | 0.14 | – |
| NGC 2775 | 2 | SAab | MW-like | 10.98 | 18.7 | 1 | 69 | 0.07 | 165 | 0.21 | – |
| NGC 3351 | 3 | SBb | MW-like | 10.56 | 10.0 | 3 | 159 | 0.04 | 10 | 0.29 | – |
| NGC 3368 | 2 | SABab | MW-like | 11.01 | 10.5 | 3 | 69 | 0.04 | 172 | 0.37 | 6.88 |
| NGC 3412 | -2 | SB0 | NSC | 10.53 | 11.0 | 2 | 10043 | 0.04 | 152 | 0.45 | 6.85 |
| NGC 4237 | 4 | SAbc | NSC | 10.31 | 18.9 | 5 | 50128 | 0.05 | 106 | 0.38 | – |
| NGC 4321 | 4 | SABbc | MW-like | 10.83 | 15.2 | 4 | 159 | 0.04 | 152 | 0.14 | – |
| NGC 4377 | -3 | SAB0 | NSC | 10.13 | 17.7 | 5 | 10043 | 0.06 | 5 | 0.20 | – |
| NGC 4380 | 3 | SAb | MW-like | 10.46 | 15.9 | 5 | 30496 | 0.04 | 157 | 0.46 | – |
| NGC 4450 | 2 | SABab | MW-like | 10.78 | 16.7 | 6 | 159 | 0.04 | 170 | 0.31 | – |
| NGC 4501 | 3 | SAb | MW-like | 10.86 | 16.5 | 6 | 30945 | 0.06 | 141 | 0.49 | 7.30 |
| NGC 4531 | -1 | SA0 | NSC | 10.30 | 15.2 | 5 | 61060 | 0.07 | 154 | 0.33 | – |
| NGC 4548 | 3 | SBb | MW-like | 10.72 | 16.2 | 3 | 3674 | 0.06 | 149 | 0.23 | – |
| NGC 4578 | -2 | SA0 | NSC | 10.20 | 16.4 | 5 | 10043 | 0.03 | 31 | 0.30 | – |
| NGC 4579 | 3 | SABb | MW-like | 10.92 | 20.1 | 5 | 159 | 0.06 | 95 | 0.22 | – |
| NGC 4608 | -2 | SB0 | NSC | 10.69 | 17.3 | 5 | 10043 | 0.03 | 105 | 0.18 | – |
| NGC 4612 | -2 | SAB0 | NSC | 10.51 | 17.3 | 5 | 10043 | 0.04 | 143 | 0.27 | – |
| NGC 4643 | 0 | SB0/a | NSC | 10.92 | 19.1 | 1 | 61063 | 0.05 | 53 | 0.20 | – |
| NGC 4689 | 4 | SAbc | NSC | 10.12 | 17.5 | 5 | 69 | 0.04 | 163 | 0.20 | – |
| NGC 4698 | 2 | SAab | MW-like | 10.69 | 16.5 | 7 | 30496 | 0.04 | 170 | 0.50 | – |
| NGC 4699 | 3 | SABb | NSC | 11.29 | 19.3 | 1 | 61064 | 0.05 | 35 | 0.19 | 8.24 |
| NGC 5121 | 1 | SAa | MW-like | 10.55 | 18.6 | 1 | N/A | 0.11 | 28 | 0.22 | – |
| NGC 5248 | 4 | SABbc | MW-like | 10.46 | 17.3 | 1 | 69 | 0.04 | 114 | 0.28 | – |
| NGC 5364 | 4 | SAbc | NSC | 10.37 | 18.4 | 1 | 61065 | 0.04 | 37 | 0.28 | – |
| NGC 6744 | 4 | SABbc | MW-like | 11.07 | 9.2 | 4 | 10136 | 0.07 | 14 | 0.37 | – |
| NGC 7177 | 3 | SABb | MW-like | 10.44 | 17.5 | 1 | 30496 | 0.11 | 83 | 0.31 | – |
| NGC 7513 | 3 | SBb | NSC | 10.14 | 19.8 | 1 | 61065 | 0.06 | 105 | 0.29 | – |
Note. — (1) Galaxy name, (2) morphological Hubble classification type, (3) Galaxy classification from the RC3 catalog (de Vaucouleurs et al., 1995), (4) NSC sample or MW-like sample defined in this work, (5) logarithmic galaxy stellar mass derived using the HyperLEDA band absolute magnitude, () color and M/L ratio from Bell et al. (2003), (6) Distance in Mpc, (7) Source for distances: 1 = Virgocentric-corrected redshift from HyperLEDA + H0 = 72; 2 = Surface Brightness Fluctuation (SBF; Jensen+2021); 3 = Surface Brightness Fluctuation (SBF; Tonry+2001, with correction from Mei+2005); 4 = Cepheids (metallicity-corrected values, Freedman+2001); 5 = TRGB (Anand+2021); 6 = SBF (Cantiello+2018); 7 = Default Virgo Cluster distance, (8) Spitzer ID program, (9) F814W galactic extinction obtained from Ned IPAC. For the F475W image and F160W images, we scale the extinction by 0.49 and 2.87 respectively, (10) Galaxy Position Angle (PA), (11) Galaxy Ellipticity, (12) Black Hole mass from Saglia et al. (2016) used in Section 5.3.
3 Dissecting the Galaxies’ Stellar Components
In this section we explain in detail the process of modeling each of the galaxy components for the NSC sample galaxies. We describe how we identify and create accurate models for the inner regions of the galaxy, especially the NSC component. The fits for each of the galaxies is done as a three-step process. First, we use the sky-subtracted IRAC1 images to fit the large-scale components (mainly the bar and disc related components) as explained in section 3.2. Using this fit, we then use the HST images (first the wider field-of-view (FOV) F160W images and then the UVIS images) to fit for the inner components (e.g., bulge, nuclear disc). Once we have a good model for the overall structure of the galaxy, we then identify, refine and constrain the NSC component using mostly the HST UVIS images as explained in section 3.3.
We fit our galaxies using the fast, multi-component image fitting program imfit111https://github.com/perwin/imfit version 1.8 (Erwin, 2015). This code creates 2-D models for each galaxy component using user-defined input parameters, adds them together, and then convolves the summed image with a user-supplied PSF image. These are fitted to the images with the default minimization using a Levenberg-Marquardt (L-M) minimization algorithm. In some cases where we run into local minima issues while modeling the images, we also use the Nelder-Mead (N-M) minimization algorithm to explore a wider range of solutions. The per-pixel uncertainties are estimated from the data values using the Gaussian approximation to Poisson statistics. When fitting models to the IRAC1 images, we convert the pixel values in the latter to ADUs with an assumed A/D gain of 3.7; the units of the HST images are in electrons and require no scaling.
We use a wide range of 2-D functions to accurately fit our galaxies disk, bulge and bar components as well as their NSCs. The most commonly used components are listed in detail in Appendix B.
3.1 Sky subtraction
While the primary goal of this paper is the nuclear morphology of galaxies, our modeling still requires accurate sky background estimates so that we can correctly model the large scale components of the glaaxies. The galaxies in our sample are massive and nearby, and thus they are almost always larger in angular size than the FOV of our HST images. (This is nearly always true for the FOV of WFC3-IR, and always true for our WFC3-UVIS C1K1C images.) It is thus not possible to accurately estimate the sky background from the HST images themselves. To determine reasonable estimates for the sky backgrounds, we match surface-brightness profiles from ellipse-fitting of the HST images to those from ground- or spaced-based images at similar wavelengths with larger FOV (i.e., large enough to determine the overall background outside the galaxy). The surface brightnesses were measured with the iraf ellipse task using ellipses with position angles and ellipticities matching the galaxy main-disk orientation; on the non-HST images, we used masks reproducing the orientation and FOV of the HST images. The resulting HST profile was then scaled to match the corresponding larger-FOV profile, using measurements outside the region strongly affected by differences in the PSFs, including an additive component representing the unknown HST background.
For the UVIS F475W and F814W images, the reference images are SDSS and -band images, respectively, where we apply a mask mimicking the orientation and FOV of the HST images. In the case of galaxies lacking SDSS images, we make use of images from the Carnegie-Irvine Galaxy Survey (Ho et al., 2011), matching their -band images to the F814W images and averaging the results from matching the - and -band images to the F475W images. For a small number of galaxies where the matching with ground-based profiles failed we use the average sky values obtained from the rest of the galaxies in the NSC sample: 9.14 electrons for F814W images and 13.56 electrons for the F475W images. For the HST F160W images we generally used Spitzer IRAC1 images as the reference images. (Exceptions were NGC 3351, where we used an -band image from the 2MASS Large Galaxy Atlas (Jarrett et al., 2003), and NGC 1300 and NGC 4321, where we made use of -band images from Grosbøl & Dottori (2012).) Just as with the optical images, we match the surface brightness profiles within the larger HST F160W FOV to that of the IRAC1 images. (See Erwin et al., in prep, for more details.)
The sky background is incorporated into our imfit modeling using a constant (fixed value) FlatSky function.
3.2 Large scale fitting
We initially use the large scale IRAC1 images to fit the larger, outer components of the galaxy. For all of our galaxies, we started with the combination of a single Sérsic component and a single Exponential component, and then added components to best fit the galaxy. These models were fit using an appropriate PSF; we have used the official in-flight Pixel-Response-Function (PRF) images222https://irsa.ipac.caltech.edu/data/SPITZER/docs/irac/calibrationfiles/psfprf/ that are down-sampled to the appropriate pixel scale from the original scale of 0.24″/pixel at column, row = 129,129; the approximate central location of most of our galaxies. We also generate a bad-pixel mask to remove bright foreground stars and background galaxies; we do this by running SExtractor (Bertin & Arnouts, 1996) on the image, and then scaling detected objects using circles (for stars) or ellipses (for background galaxies). Notable image defects are masked by hand.
After running our initial fit, we then refine the fit by adding components based on (1) visible patterns in the residual images, (2) surface brightness profiles, and (3) changes in the ellipticity and position angle of the galaxy isophotes. For some galaxies, we find significantly better fits if we replace the initial Exponential with a BrokenExponential component. (Figures 5 and 8 in Erwin et al. (2021) show examples of this for the galaxies NGC 4608 and NGC 4643.) We also incorporate information from the galaxy morphology (e.g. known rings or bars) from previous studies. We continue to add additional components to the model until the galaxy is well represented; specifically, when there are no clearly visible systematic residual patterns that could be fit with an additional component. Typically, this includes an exponential or broken exponential disk component, a bar component, and at least one bulge component. Occasionally, we also fit ring and spiral arm components, especially when this is critical for understanding the bar and bulge structures. These components are always an addition to the initial Sérsic + Exponential model, except for cases where we have replaced the initial Exponential with a BrokenExponential.
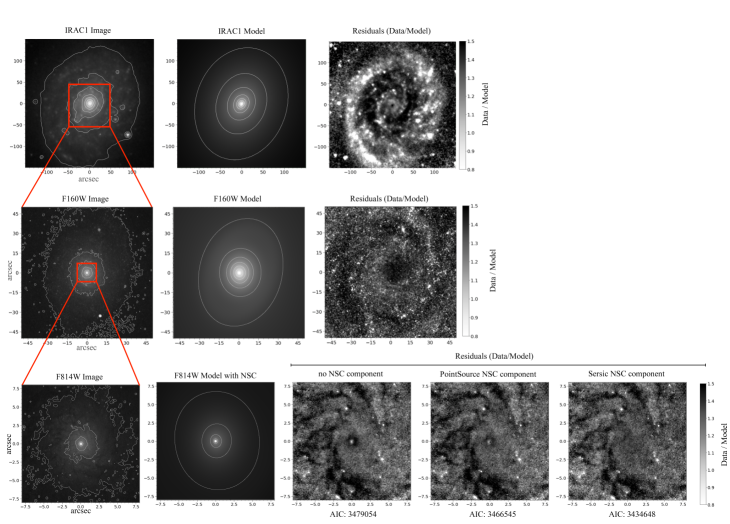
An example of this fitting procedure can be seen in the upper panel of Figure 2 which shows the IRAC1 image, best-fitting model and the residual ratio image for NGC 4689.
3.3 HST image fitting
Once we have the best-fit IRAC1 model, we then model the galaxy’s inner components in more detail using the HST images, beginning with the F160W image. This includes components such as a boxy-peanut bulge, classical bulge, star forming disk, etc..
PSFs – For each model we fit to the HST data (in all three band images), we provide an appropriate PSF image for convolution. For the HST images, we generated the PSF images using the grizli software333https://github.com/gbrammer/grizli. An “empirical PSF” image from Anderson (2016)444http://www.stsci.edu/~jayander/STDPSFs/WFC3IR/ is inserted into the each of the four individual exposures at the location of the galaxy center; these are then run through the same drizzling process used to prepare the final HST image (as explained in section 2.2). The final PSF image is then extracted from the combined, drizzled image.
Masks – Foreground objects and dust can prevent us from getting an accurate model fit to the data. We initially identify the foreground stars, background galaxies and other image defects using SExtractor (Bertin & Arnouts, 1996). We then create a mask to flag all those pixels in the image. We also mask other regions of the galaxies that are not well fit by our models, these include spiral arms in many cases, as well as other non-axisymmetric features that are challenging to model.
Dust extinction near the centers of our galaxies can also significantly impact the best-fit nuclear models. To mask dust features, we use UVIS F475W-F814W color maps to find reddened pixels. We mask pixels using the distribution of pixel values in unreddened regions, choosing a slightly different color threshold for each galaxy. We then translate this mask to the F160W image as well. In addition to masking reddened regions, we also mask star-forming regions in some cases using a blue color threshold.
Fitting the F160W images – We start the modeling of the F160W image by using the best-fitting IRAC1 model as an initial guess (this involves translating size and angular parameters to account for differences in the pixel scales and image orientation, and estimating the difference in intensity values for intensity parameters).
Since some galaxy components (i.e. the disk) from the IRAC1 model can extend well outside the F160W FOV, we model these components by holding the translated best-fit shape, orientation and size parameters fixed, and fit only for the intensity of these largest components. For components that are mostly or entirely within the F160W [or WFC3-IR] FOV, we use the IRAC1 values as initial guesses, but leave all parameters free. We then iterate by running imfit to determine the best-fit parameters, followed by inspection of the residuals, adding additional components to the model if needed and re-running the fit.
In addition to examining the residuals, we also apply a more quantitative approach to adding components. Specifically, we add components when (1) we see residuals in the radial profile that are % of the data value and when (2) the addition of a component improves (i.e., reduces) the Akaike Information Criterion (AIC; Akaike, 1974) of the fit by 1000 or more relative to the original fit (as in Erwin et al., 2021). Often at this stage we include an initial NSC component that fits for the central excess light; we describe our final NSC determinations below.
An example of this fitting procedure can be seen in the middle panel of figure 2 which shows the F160W image, best-fitting F160W model image and the residual ratio image for NGC 4689. We obtain a decent F160W model for this galaxy with a preliminary NSC component that fits for the central excess light.
Translation to the F814W images – The F814W images are read out in a sub-array, and thus they span a smaller region (the inner ) of the galaxy than the F160W images. They are also higher resolution than the F160W images, with an original pixel scale of 0.04 and a final processed image scale of 0.03 pixels (critically sampling the 007 FWHM PSF)
and thus provide better constraints on the nuclear structure than the F160W images as long as the galaxies are not too dusty. We translate the best-fit F160W model to create the initial guess for the F814W model by (1) scaling the intensity parameters by the ratio of fluxes in a fixed angular area in the two images, and (2) scaling the sizes of components to the higher resolution pixel scale. For components that extend well beyond the edge of our chip, we hold their shape parameters fixed and fit just for their intensity parameters.
As with the F160W images, we add components as necessary in the higher resolution F814W images; again this often includes an initial NSC fit to the central light excess.
Final NSC fitting – Once we have a good fit to the model that accurately represents the whole F814W band image, we focus on modeling the NSC component. We choose to use a Sérsic function to describe the NSC component, following previous work by several authors (e.g. Graham & Spitler, 2009; Carson et al., 2015; Nguyen et al., 2017).
As a first step, we check for the presence of a nuclear excess in the galaxy. For this, we exclude any NSC component from the F814W model and use the remaining components as initial conditions for a new fit – this allows us to check whether any nuclear light can be fit through adjusting the parameters of the larger components. We inspect the residuals of these fits and the surface brightness profiles in the central 10-15 pixels for the presence of the excess light. In all galaxies we find there is central excess light; in many cases this is due to an NSC. However, we expect central light excess can also be due to an AGN component, in which case we expect the light to be unresolved. Therefore, as a next step, we add a PointSource component to the model in an attempt to fit the nuclear excess.
| Galaxy | Sample | Primary Band | AIC | Quality | Notes | |
|---|---|---|---|---|---|---|
| (1) | (2) | (3) | (4) | (5) | (6) | (7) |
| IC 2051 | MW-like | F160W | 6 | 3.04x10⁵ | 2 | Dust in UVIS affecting NSC fits |
| NGC 289 | MW-like | – | – | – | 0 | Very dusty, bad fit NSC |
| NGC 613 | MW-like | F160W | 6 | 1.01x10² | 1 | Unresolved NSC, weak AGN emissions |
| NGC 1097 | MW-like | F160W | 7 | 3.52x10⁴ | 2 | Dust in UVIS affecting NSC fits |
| NGC 1300 | MW-like | F814W | 6 | 5.03x10² | 1 | Unresolved NSC, weak AGN emissions |
| NGC 1440 | NSC | F814W | 6 | 2.41x10² | 1 | Unresolved NSC |
| NGC 1566 | MW-like | – | – | – | 0 | Center saturated with strong AGN emission |
| NGC 2775 | MW-like | F814W | 5 | 1.11x10³ | 1 | Unresolved NSC |
| NGC 3351 | MW-like | F814W | 7 | 3.48x10⁴ | 4 | |
| NGC 3368 | MW-like | F814W | 8 | 3.61x10⁵ | 4 | |
| NGC 3412 | NSC | F814W | 7 | 4.18x10⁴ | 5 | |
| NGC 4237 | NSC | F814W | 3 | 4.65x10⁵ | 4 | |
| NGC 4321 | MW-like | F160W | 10 | 1.22x10⁵ | 2 | Dust in UVIS affecting NSC fits |
| NGC 4377 | NSC | F814W | 6 | 1.24x10⁴ | 5 | |
| NGC 4380 | MW-like | F160W | 6 | 1.75x10⁴ | 2 | |
| NGC 4450 | MW-like | F814W | 9 | 1.08x10⁴ | 4 | |
| NGC 4501 | MW-like | F160W | 3 | 4.71x10⁵ | 2 | Dust in UVIS affecting NSC fits |
| NGC 4531 | NSC | F814W | 5 | 1.42x10⁵ | 4 | |
| NGC 4548 | MW-like | F160W | 7 | 1.64x10⁴ | 2 | Dust in UVIS affecting NSC fits |
| NGC 4578 | NSC | F814W | 5 | 5.19x10⁴ | 5 | |
| NGC 4579 | MW-like | F814W | 5 | 4.92x10⁴ | 2 | Dust in UVIS affecting NSC fits |
| NGC 4608 | NSC | F814W | 6 | 4.12x10⁵ | 5 | |
| NGC 4612 | NSC | F814W | 7 | 5.81x10³ | 3 | |
| NGC 4643 | NSC | F814W | 6 | 4.74x10⁵ | 4 | |
| NGC 4689 | NSC | F814W | 5 | 4.32x10³ | 4 | |
| NGC 4698 | MW-like | F814W | 7 | 7.28x10³ | 5 | |
| NGC 4699 | NSC | F814W | 9 | 1.24x10⁵ | 4 | |
| NGC 5121 | MW-like | F814W | 7 | 2.17x10³ | 4 | |
| NGC 5248 | MW-like | F814W | 7 | 2.29x10⁴ | 5 | |
| NGC 5364 | NSC | F814W | 6 | 3.21x10³ | 4 | |
| NGC 6744 | MW-like | F160W | 5 | 4.05x10⁴ | 2 | Dust in UVIS affecting NSC fits |
| NGC 7177 | MW-like | – | – | – | 0 | Very dusty, bad fit NSC |
| NGC 7513 | NSC | F814W | 5 | 4.76x10⁵ | 4 |
Note. — (1) Galaxy name, (2) NSC sample or MW-like subsample, (3) primary band used for modelling the different components in the galaxy, (4) total number of components we fit for in the galaxy (including the NSC component), (5) NSC component PointSource vs. Sérsic AIC values (explained in detail in section 3.3), (6) quality of the NSC fits, see Section 3.4, (7) brief notes on the NSC fits.
We inspect the residuals of the centers for any visible pattern that is not being modeled. If the central light excess appears to be resolved, we then replace the PointSource function with a Sérsic function. We consider this central component to be unresolved if the (i) AIC between the PointSource and Sérsic function is 3000 and (ii) the difference in the surface brightness profile residuals between the PointSource and Sérsic function fits is 5. We consider resolved sources to be NSCs. Table 2 indicates sources that are unresolved as well as the PointSource vs. Sérsic AIC values. For some galaxies with known strong AGN, we use an additional PointSource component along with the NSC Sérsic component. The evidence for AGN and details on the fits are given in Appendix C. Out of the 33 galaxies we fit, we find four of them to have unresolved nuclear components (using the AIC constraint discussed above). We discuss these four sources in more detail in Section 4.1 below.
An example of this fitting procedure can be seen in the lower panel of Figure 2, which shows the HST F814W image, the best-fitting F814W model image and the residual ratio images for three models: the first with no central (NSC) component, the second with a central PointSource component and the the third with the best-fitting NSC Sersıc component. From these three residual ratio images, we can visually judge the presence of a NSC component. The superiority of the third model, with the absence of any residual nuclear excess is evident. The AIC values for each of the 3 models are given below their respective residual ratio images; the NSC-Sérsic model has AIC .
In most cases, we use the F814W image as the primary filter for modeling the NSCs. Once we have a good fitting model in the F814W filter, we then translate all the components to the F475W image as well as the F160W image – we fit only for the intensity of these components, and keep the shape parameters fixed to scaled best-fit F814W values. This ensures that we measure accurate colors for the NSCs (and other components). Allowing the NSC shape parameters to be fit independently in each filter can result in unphysical colors when e.g. the NSC component is much larger in one filter than another.
For galaxies that are very dusty in their centers (10 out of the 33), we instead use the F160W image as the primary band to fit our NSCs, and perform the methods outlined above on the F160W image directly, without translating to F814W. The lower extinction in F160W helps us better fit the nuclear structure despite the lower spatial resolution. In these cases, we still fit the F475W and F814W images with shape parameters fixed to the best-fit F160W values in order to derive colors for the NSCs in all three filters. Once we have the best-fitting model in all three filters, we then calculate the magnitudes for all of the components – explained in detail in section 4.2. Table 2 includes the primary filter used for modelling the NSCs.
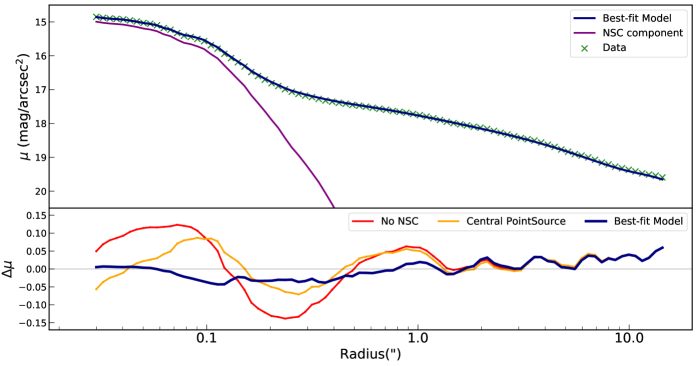
The top panel in figure 3 shows an example of the 1-D surface brightness profiles we create to inspect the quality of the fit. These profiles were derived using circular aperture photometry with python’s photutils library. We ignore masked pixels in deriving the surface brightness of both the original image (green points) as well as the best-fitting model (blue solid line). The NSC Sérsic component (purple solid line) can be identified as the visible bump seen at the smallest radii. The bottom panel shows the residuals (model – data) in magnitudes; radii where the data is brighter than the model have positive values in this panel. We also show the residuals for models with no central component (shown in red) and a central PointSource component (shown in orange). Here, we can observe changes in the residuals due to improving the NSC model fits. The residual based on the best-fitting model has residual below 0.05 magnitudes all the way out to 10″.
3.4 Fit Quality, AGN, and Exceptions
Here we discuss the process of evaluating the goodness of the fits to the galaxy data. As mentioned in section 3.2 and section 3.3, our quality check and criteria for adding new components for the each fit to the galaxy are based on (1) improvements in the residuals and (2) improvements in the AIC.
Some of the galaxies in our NSC sample (especially in the MW-like subsample) have literature data that indicates they have an AGN. Detailed descriptions of these AGN components and associated X-ray sources are provided in Appendix A). For galaxies with a known AGN, we test whether an additional point source component needs to be included in the model as well, but find no cases where both a point-source and resolved NSC component provide a significantly improved fit. In one case, NGC 1566, the AGN is bright enough (and in fact saturation artifacts affect the central region in the optical images) that no clear NSC component is visible. Accordingly, we do not present NGC 1566 in our NSC parameters table.
Dust can also prevent us from obtaining good fits to the NSCs. In two galaxies (NGC 289 and NGC 7177) we are unable to determine accurate NSC morphologies due to dust obscuring the centers of all three bands.
We rate the overall quality of our fits using a single number. The quality values are as follows:
Quality 0: These galaxies are those for which we do not obtain good fits for the NSCs – this includes the galaxies discussed above, NGC 289, NGC 1566 and NGC 7177. No fits to these galaxies are shown in Table 3.
Quality 1: Unresolved NSC components in four galaxies. When comparing a point source component to a Sérsic component fit the AIC between these fits is 1000, giving minimal evidence that the nuclear component is resolved. The nature of these sources is discussed in Section 4.1.
Quality 2: dusty galaxies where dust absorption is evident all the way to the center. However, we are able to estimate NSC properties using the F160W images in these galaxies.
Quality 3: galaxies with complex central regions with poorly modeled structures (e.g., spiral arms) that result in large radial surface-brightness profile residuals (0.1 mag).
Quality 4: galaxies with some dust in the nuclear regions (but not crossing the center). Fits have surface brightness profile residuals 0.1 magnitudes.
Quality 5: galaxies with no dust within the central 2. Fits have surface brightness profile residuals 0.1 magnitudes.
There are 27 galaxies with quality 2. For the plots in the paper, we exclude all NSCs with Quality 2, while Quality 2 fits are shown with open symbols.
3.5 Error Estimation
We estimate the errors on our imfit models using bootstrap resampling. This method allows us to capture asymmetric errors and the covariance of NSC parameters with the other fitted components. It also provides more accurate errors than those estimated from the Leavenberg-Marquardt algorithm. We performed 200 iterations of bootstrapping for each galaxy model. For the NSC models, the effective radii have median errors of 9%, while the median error on Sérsic indices are 14%. For ellipticities above 0.05, the errors on the ellipticity are just 7%.
4 NSC properties and results
4.1 Nucleation Fraction
Of the 33 galaxies in our sample, we find unambiguous, resolved NSCs with radii 50 pc in 26. Previously measured NSCs have typical effective radii of 3 pc with a small tail towards larger sizes and a cutoff suggested at 50 pc by Neumayer et al. (2020). In three galaxies, the presence of a nuclear cluster can’t be constrained due to dust opaque enough to obscure the nucleus even in F160W (NGC 289 and NGC 7177), or the presence of a very bright AGN (NGC 1566) as discussed in Section 3.4. In another four galaxies, the potential NSC components are unresolved: NGC 613 and NGC 1300 have a low luminosity AGN, and thus may not be NSCs. On the other hand in NGC 2775 and NGC 1440 the nuclear light appears to be stellar; specifically, the nuclear sources in both have very similar colors to the surrounding galaxy light, and the nuclear spectra (Ho et al., 1995) shows very little emission. Therefore it is likely these two galaxies host compact NSCs that we just cannot resolve with HST. The best-fit Sérsic are used here as upper limits; for NGC 2775 and NGC 1440 these are 3.87 pc and 4.65 pc or 0042 and 0048. Our ability to resolve NSCs in our CBS galaxies is complicated due to varying galaxy backgrounds, however, it does extend to more compact sources than these in some galaxies – the most compact clearly resolved NSC is in NGC 4377 with an of 1.91 pc or 022; this is similar to the limit on resolving NSCs found for galaxies at similar distances by Côté et al. (2006).
Using only the unambiguous resolved NSCs, we get a nucleation fraction of 78.8% (26/33) for the full sample, with errors calculated using the Wilson interval. The nucleation fraction is 68.4% (13/19) for the MW-like subsample. On the other hand, we cannot exclude the presence of NSCs in any of our galaxies, thus the nucleation fraction in both samples could be as high as 100%. We note that our galaxy sample are all high mass () and mostly late-type galaxies; if we take all late-types in our sample, we get 76.0% (19/25) with NSCs.
Two previous measurements exist for the nucleation fraction of massive late-type galaxies. We took the data from Neumayer et al. (2020) and Hoyer et al. (2021) to find a comparable nucleation fraction for galaxies with (); from the Neumayer et al. (2020) compilation, 10/21 (47.6%) galaxies in this mass range are nucleated, while in the Hoyer et al. (2021) Local Volume sample, 10/15 (66.7%) galaxies with nucleation measurements are nucleated. Thus we find a higher nucleation fraction than either study, with our results being consistent with the measurement in Hoyer et al. (2021). Our values are much higher than the nucleation fraction of 30% seen in early-type galaxies with similar mass (Neumayer et al., 2020; Hoyer et al., 2021).
4.2 Magnitude and color
For all the NSCs, we estimate the magnitude using the imfit makeimage program, which can calculate fluxes and magnitudes for each component in the model. To determine the magnitudes of the NSC in the 3 HST bands, we divide the total counts by the total exposure time; 600s for F160W band, 500s for F814W band and 700s for F475W band. We then use the following zeropoints: 24.6949 in F160W, 24.684 in F814W, and 25.801 in F475W 555https://www.stsci.edu/hst/instrumentation/wfc3/data-analysis/photometric-calibration/uvis-photometric-calibration. These are Vega based zeropoints, and thus all magnitudes listed here are in the Vega system. We correct for foreground extinction using the values and conversions to the other two bands in Table 1 and the notes to that table. The extinction corrected NSC magnitudes in each filter band are presented in Table 3.
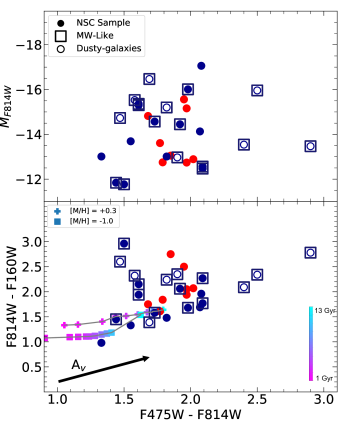
Figure 4 shows the color-magnitude and color-color (UVIS-IR) diagrams of the NSCs. Padova PARSEC 1.2S single-stellar population models (Bressan et al., 2012) with ages from 1-13 Gyr and at two metallicities are overploted. A majority of the galaxies are consistent with these models with modest extinction up to (). Of these, only two require populations younger than 10 Gyr – due to the age-extinction degeneracy it is not possible to separately constrain the ages and extinctions using our colors. Almost half of the galaxies fall redwards of these SSP models in the F814WF160W color in a way that is inconsistent with the reddening vector (which assume ), in some cases by 1 magnitude. This offset in F814WF160W color could be due to (1) a mismatch between the data and SSP models, or (2) issues with calculating the NSC magnitudes. To investigate this last issue, we measured aperture photometry within the center 05, and compared these aperture colors to the model NSC colors. For clusters with bright, prominent NSCs, the aperture and integrated NSC values agreed. However, for fainter NSCs that make up a smaller light fraction of the galaxy, we see a blueward offset of up to 0.5 mags for the aperture magnitudes relative to the NSC model magnitudes. This blueward offset can be explained by a combination of the lower encircled energy in F160W and bluer surrounding bulge components. Overall, this test suggests we are accurately measuring the NSC colors with our model magnitudes. While some NSCs have clear evidence for significant dust absorption (i.e. the open circles), others appear dust-free, suggesting that the PARSEC models may under-predict the F814WF160W colors of NSCs.
4.3 Mass
We determine the NSC masses using the F814W magnitude and color- relations from Roediger & Courteau (2015). Specifically, we first convert our F814W magnitude to the Sloan band and then convert our HST F475WF814W color to using relations derived from PARSEC 1.2S stellar population models (Bressan et al., 2012):
We then use the color vs band magnitude relation of Table 2 in (Roediger & Courteau, 2015) to determine the -band ratio. The resulting NSC masses are presented in Table 3. For our NSCs the values range from 5.7 to 8.74 with a median of 7.16 for all our NSCs and 7.26 for the NSCs in the MW-like subsample. We determine the errors for the derived NSC mass using the bootstrap sampling (see Section 3.5), recalculating the luminosities, colors, and derived s for each sample.
4.4 NSC size, mass relations
We use the derived color and mass to understand our NSCs and compare them with the available literature from both early- and late-type galaxies. In Figure 5 we plot the radius of the NSCs (in pc) versus their derived masses. The solid circles denote our NSC sample galaxies, with surrounding squares indicating the MW-like subsample. All galaxies are color coded into early- (red) and late- (blue) type. The dashed line show the relationships for early- and late-type galaxies from Georgiev et al. (2016). As has been found in many previous studies (e.g. Hopkins & Quataert, 2010; Norris et al., 2014; Georgiev et al., 2016; Neumayer et al., 2020), the NSC radii correlate with their masses, i.e., massive NSCs have a larger radii. Our NSC sample improves the available literature, especially for the massive late-type galaxies (). Overall, the masses and radii of these clusters agree well with the overall trend seen in previously published data (shown as small stars in Fig. 5). Georgiev et al. (2016) fit mass-radii relations and find that the NSCs in the late-type galaxies (blue-dashed line) are roughly two times smaller than the NSCs in early-type galaxies (red dashed line). Our data does not seem to support this difference; in particular most of the late-type galaxies in our sample fall above the blue dashed line, while all of the early-type galaxies fall below the red-dashed line. This weakens the previous literature findings that there is a difference in the mass-radius relationship in early and late-type galaxies.
The biggest NSCs ( pc) in our sample are found in IC 2051, NGC 4380, NGC 4501, NGC 4699, NGC 5248 and NGC 7513. These largest objects may be ambiguous in their classification as NSCs, however, the continuity of the mass–radius relationship suggests these are related components. For NGC 7513, Carollo et al. (2002) found the NSC to be a very compact source unlike in our model. The difference in the NSC model is discussed in detail in section 4.6.
Four objects (NGC 613, NGC 1300, NGC 1440 and NGC 2775) are unresolved in our sample but nonetheless appear to be NSCs; these are shown as upper limits on the mass radius diagram. These galaxies fall on the compact side of the locus of previous NSC measurements and thus are significantly denser than typical NSCs.
| Galaxy | PAnsc | nnsc | re | mF475W | mF814W | mF160W | log(MNSC) | B/Tpm | Lbar | |
|---|---|---|---|---|---|---|---|---|---|---|
| pc | mag | mag | mag | M⊙ | L⊙ | |||||
| (1) | (2) | (3) | (4) | (5) | (6) | (7) | (8) | (9) | (10) | (11) |
| IC 2051 | 64.44 | 0.17 | 2.65 | 37.26 | 16.71 | 15.02 | 13.63 | 8.23 | 0.46 | 9.67 |
| NGC 289 | – | – | – | – | – | – | – | – | – | – |
| NGC 613 | 143.72 | 0.00 | 0.50 | 2.86 | 21.02 | 19.52 | 16.56 | 6.18 | 0.17 | 10.89 |
| NGC 1097 | 59.14 | 0.16 | 3.23 | 14.77 | 17.60 | 16.12 | 13.53 | 7.34 | 0.16 | 10.94 |
| NGC 1300 | 73.04 | 0.15 | 1.53 | 8.32 | 18.93 | 17.01 | 14.95 | 7.62 | – | 10.80 |
| NGC 1440 | 93.67 | 0.00 | 3.48 | 4.65 | 20.29 | 18.44 | 15.69 | 7.00 | 0.67 | 10.17 |
| NGC 1566 | – | – | – | – | – | – | – | – | – | – |
| NGC 2775 | 131.77 | 0.00 | 0.52 | 3.87 | 20.98 | 18.89 | 16.62 | 6.98 | 0.40 | – |
| NGC 3351 | 150.00 | 0.00 | 0.79 | 4.35 | 19.60 | 18.16 | 16.71 | 6.16 | 0.70 | 10.14 |
| NGC 3368 | 60.68 | 0.16 | 2.21 | 10.41 | 16.42 | 14.81 | 12.87 | 7.69 | 0.75 | 10.67 |
| NGC 3412 | 152.98 | 0.31 | 1.78 | 6.34 | 17.07 | 15.39 | 13.64 | 7.56 | 0.36 | 9.59 |
| NGC 4237 | 116.78 | 0.03 | 4.63 | 7.36 | 19.70 | 18.37 | 17.39 | 6.53 | 0.05 | – |
| NGC 4321 | 55.85 | 0.13 | 2.34 | 17.92 | 17.53 | 15.71 | 13.47 | 7.83 | 0.14 | 10.63 |
| NGC 4377 | 158.94 | 0.21 | 5.73 | 1.91 | 20.28 | 18.49 | 16.65 | 6.82 | 0.42 | 9.75 |
| NGC 4380 | 149.79 | 0.18 | 6.95 | 27.04 | 19.88 | 17.47 | 15.39 | 7.67 | 0.17 | 9.12 |
| NGC 4450 | 2.69 | 0.00 | 4.95 | 15.70 | 17.36 | 15.75 | 13.60 | 7.72 | 0.49 | 10.55 |
| NGC 4501 | 143.74 | 0.22 | 1.58 | 29.99 | 17.63 | 15.13 | 12.79 | 8.72 | 0.14 | – |
| NGC 4531 | 6.89 | 0.05 | 4.36 | 10.86 | 19.07 | 17.30 | 15.69 | 7.15 | 0.22 | – |
| NGC 4548 | 147.12 | 0.20 | 2.47 | 19.89 | 20.49 | 17.58 | 14.80 | 8.07 | 0.36 | 10.31 |
| NGC 4578 | 10.96 | 0.14 | 2.76 | 12.09 | 17.87 | 15.91 | 13.97 | 7.94 | 0.62 | – |
| NGC 4579 | 64.28 | 0.30 | 1.54 | 7.09 | 17.57 | 15.99 | 13.67 | 7.75 | 0.30 | 10.48 |
| NGC 4608 | 145.63 | 0.13 | 1.19 | 2.90 | 20.42 | 18.45 | 16.40 | 6.97 | 0.72 | 10.27 |
| NGC 4612 | 117.04 | 0.02 | 3.14 | 11.74 | 17.58 | 15.63 | 13.14 | 8.08 | – | – |
| NGC 4643 | 114.16 | 0.00 | 0.75 | 4.11 | 20.53 | 18.52 | 16.45 | 7.08 | 0.37 | 10.61 |
| NGC 4689 | 160.36 | 0.00 | 2.85 | 5.03 | 20.03 | 18.21 | 16.73 | 6.95 | 0.06 | 9.28 |
| NGC 4698 | 66.76 | 0.48 | 1.39 | 7.64 | 20.62 | 18.53 | 16.76 | 7.01 | 0.44 | – |
| NGC 4699 | 152.00 | 0.00 | 1.87 | 25.75 | 16.46 | 14.37 | 12.41 | 8.80 | 0.14 | 10.19 |
| NGC 5121 | 5.41 | 0.14 | 1.26 | 6.56 | 18.51 | 16.78 | 15.19 | 7.50 | 0.34 | 9.67 |
| NGC 5248 | 107.37 | 0.27 | 0.97 | 33.99 | 17.16 | 15.18 | 13.50 | 8.29 | – | – |
| NGC 5364 | 159.09 | 0.16 | 3.53 | 18.29 | 19.18 | 17.63 | 16.30 | 7.00 | 0.26 | – |
| NGC 6744 | 14.44 | 0.38 | 2.28 | 11.33 | 18.75 | 16.85 | 14.50 | 7.01 | 0.15 | 9.99 |
| NGC 7177 | – | – | – | – | – | – | – | – | – | – |
| NGC 7513 | 74.66 | 0.00 | 5.92 | 43.54 | 19.42 | 17.35 | 15.66 | 7.60 | 0.12 | 9.94 |
Note. — (1) Galaxy name, (2) NSC position angle (PA), (3) ellipticity, (4) Sérsic index, (5) effective radius, (6) F475W magnitude, (7) F814W magnitude, (8) F160W magnitude, (9) logarithmic stellar mass estimated using the ratio (see Section 4.3, (10) Photometric bulge to total ratio of the galaxy (see Section 5.2.1), (11) bar luminosity determined using the bar component magnitudes. All magnitudes are corrected for Galactic extinction.
4.5 NSC mass vs. ellipticity and Sérsic index
In Figure 6, we compare the NSC mass with the NSC Sérsic index (top panel) and ellipticity (bottom panel).
We see no correlation between NSC masses and Sérsic indices, indicating that the NSCs have a wide range of concentrations (see also Hoyer et al., 2023a). One of the possible reasons for a high Sérsic index () is the presence of multiple components within the NSC, as seen in previous studies of very nearby NSCs where these components can be resolved (e.g., Seth et al., 2006, 2010; Nguyen et al., 2018). The Sérsic indexes of our NSCs range from 0.1–5.9 with a median value of 2.7. The median value of the Sérsic indices of the MW-like subsample is 2.2. We have no evidence for multiple component NSCs in our sample except for in NGC 4612, in which we obtain a two component fit. We only plot the average ellipticity obtained from the two component NSC in Figure 6 and do not plot the Sérsic index of this NSC. More information about the NSC fit for this galaxy is provided in the Appendix C.
A trend of higher ellipticities in higher mass NSCs was seen in early-type galaxies by Spengler et al. (2017), however, we find no correlation between the NSC mass and ellipticity (bottom panel in figure 6). The ellipticities of all our NSCs range from 0–0.5 with a median value of 0.14 (0.16 for the MW-like subsample).
4.6 NSC literature comparison
The NSCs of five of the galaxies from our sample – NGC 289, NGC 1566, NGC 4237, NGC 4612 and NGC 7513 – have been studied previously in the literature. Two of these galaxies (NGC 289 and NGC 1566) have NSCs presented in Carollo et al. (2002); due to the bright AGN component (in NGC 1566) and dust (in NGC 289), we are unable to obtain reliable, unambiguous NSC fits for them, and so we focus on the other three objects, below.
NGC 4237 – This unbarred Virgo Cluster spiral galaxy has been previously studied in Georgiev & Böker (2014). They determine the effective radius of the NSC to be 007 with an F814W magnitude of 17.74. They model the NSC using multiple images from HST including F606W and F814W band. From our work, the NSC in this galaxy has an effective radius of , with an F814W magnitude of 18.37. So while the effective radii are similar, our fit to the NSC is considerably fainter than Georgiev & Böker (2014). This is likely due to our more careful modeling of the galaxy background. We note we also are fitting higher resolution images than the wide field chip WFPC2 images fitted in Georgiev & Böker (2014).
NGC 4612 – This barred S0 Virgo Cluster galaxy was previously studied in Côté et al. (2006) and Spengler et al. (2017) as part of the ACS Virgo Cluster Survey. They determine the NSC in this galaxy to be unresolved with an effective radius of . In our model, we find that the NSC is best fit by a two component model, a compact Sérsic surrounded by a larger exponential with a combined effective radius of . This model is preferred to a point source model with a AIC of 5810. We can directly compare the F475W magnitudes of the sources; they find 17.73 (after conversion to Vega magnitudes), while our combined NSC has a magnitude of 17.66, thus these agree quite well. We note that our approaches differ significantly; Côté et al. (2006) fit 1-D profiles with a single Sérsic background galaxy models, while we fit a more sophisticated galaxy model and fit in 2D.
NGC 7513 –This barred galaxy was previously studied in Carollo et al. (2002). They modeled the NSC using NICMOS2 data in the F110W and F160W filters and determine the NSC in this galaxy to have an F160W magnitude of 18.3 and an effective radsius of 006 (0.97 pc), slightly smaller than the 0075 pixels.
We find a much bigger and brighter NSC component in this galaxy, with an effective radius of (43.54 pc) and an F160W magnitude of 15.66; an unresolved point source or compact component provides a much worse fit to the nuclear regions. The Carollo et al. (2002) fits did not model the galaxy background at all, and we suspect that this methodological difference may be responsible for this discrepancy.
5 NSC-Galaxy relations
In this section, we discuss in detail the relation of the NSCs to the properties of their host galaxies. We also briefly discuss the relations between the NSC mass and supermassive black hole mass from Saglia et al. (2016) for 4 galaxies in our sample in Section 5.3.
5.1 Structural Parameters
In Figure 7 we compare the ellipticity () and position angle (PA) of our NSCs relative to their host galaxies. For the host galaxies, we use the PA and from Table 1. It is important to note that the CBS selection criteria selects galaxies with inclinations between 35∘ and 60∘. In the left panel of the figure, we see the NSCs have ellipticies equal to or smaller than the ellipticites of their host galaxies, suggesting that NSCs are typically rounder than their host galaxy disks.
The right panel of the figure shows the difference in PA between the NSCs and the galaxies. Here we plot the difference for all NSCs with ellipticities where we can robustly estimate the NSC PA. We see that the distribution does not appear to be uniform as would be expected if there was no correlation between the galaxy disks and NSCs, but instead most of the NSCs have PAs within 25∘ of their host galaxies. Using Kolmogorov-Smirnov and Anderson-Darling tests, we can reject the relative PAs being drawn from a uniform distribution at high significance (-values of 0.0072 and 0.00075). This result is similar to what is seen in our Milky Way and in edge-on galaxies, where the NSC and galaxy PAs are typically aligned (Seth et al., 2006, 2008b; Feldmeier et al., 2014). However, this correlation of PAs is not seen by Georgiev & Böker (2014). Their sample included a much wider range of inclinations, and less correlation between NSC and galaxy PAs would be expected to be visible in more face-on galaxies.
The correlation of NSC and galaxy PAs suggests that NSCs are flattened and aligned with their large-scale galaxy disks. This favors NSC formation from material in the disk – either from gas accretion followed by in situ star formation, or by formation and inspiral of young star clusters (e.g. Seth et al., 2006; Agarwal & Milosavljević, 2011; Tsatsi et al., 2017), and is consistent with strong rotation seen in many NSCs (Pinna et al., 2021). It disfavors NSC formation from inspiral of a more spherical distribution of globular clusters (e.g. Tremaine et al., 1975; Hartmann et al., 2011). This result is in agreement with previous work that suggests NSC formation is dominated by in situ star formation in more massive galaxies (log()9) like those in the CBS sample (Neumayer et al., 2020; Fahrion et al., 2021, 2022a).
5.2 Correlations of NSC Mass with Host Galaxy Properties
Previous studies have found scaling relations between the mass of the NSC and its host galaxy properties. This includes scaling relations with bulge luminosity, velocity dispersion, and total stellar mass (e.g., Ferrarese et al., 2006; Wehner & Harris, 2006; Rossa et al., 2006). Initially, the NSC scaling relations were found to be similar to the BH scaling relations, but recent studies with more data over wider ranges of host galaxy properties have shown that, unlike BH scaling relations, the NSC mass correlates better with galaxy mass than bulge mass or stellar velocity dispersionf, and does not follow the same scaling relations (e.g., Erwin & Gadotti, 2012; Georgiev et al., 2016; Sánchez-Janssen et al., 2019).
In Figure 8, we plot the NSCs mass against their host galaxy stellar mass. We observe that the bulk of our galaxies fall among the highest NSC masses as expected given their high galaxy stellar mass. All the NSCs in our sample have masses , with a median mass of . The typical masses fall along the relation for late-type galaxies from Georgiev et al. (2016), with a tight cluster of points around the median sample mass. However there is also a very large, 2 order of magnitude spread in the NSC mass, with several significant low outliers including NGC 3351 ( and ) and NGC 6744 ( and ) and the very compact NSC in NGC 2775 ( and ). This broad range of masses suggests a wide range of formation and evolutionary processes in the NSCs in these massive (mostly late-type) galaxies. As noted in Section 4.1, the nucleation fraction in our NSC sample is much higher than the nucleation fraction of early-type galaxies with similar mass (Côté et al., 2006; Neumayer et al., 2020), where binary BH mergers might have destroyed NSCs (e.g. Milosavljević & Merritt, 2001). With the ongoing formation of NSCs in late-type galaxies (e.g. Walcher et al., 2006; Rossa et al., 2006), the absence of an NSC after a binary BH merger would likely be short-lived and the existence of low mass outliers may trace galaxies where NSCs have been destroyed in the relatively recent past. The compact radii ( pc) of two of these clusters may be due to the reformation resulting in more compact NSCs; recent star formation is seen to be centrally concentrated in nearby NSCs including the Milky Way (Feldmeier-Krause et al., 2015), M31 (Lauer et al., 2012), and other nearby late-type NSCs (Carson et al., 2015).
5.2.1 Bulge and Bar Relations
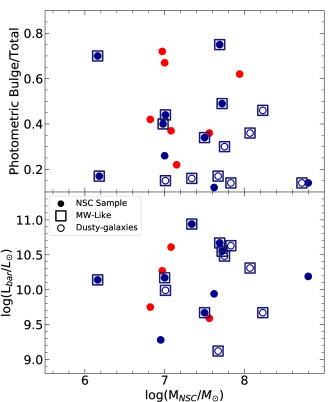
Given that NSCs are located in the centers of galaxies, it is interesting to understand how they relate with the bulge and bar components in their hosts. Understanding this relationship might provide insights into their formation mechanism. In this section, we discuss in detail the correlations of the NSC mass with the fraction of light in the photometric bulge and the luminosity of the bar components hosted by our sample of galaxies. In Figure 9, we plot the NSC mass against the photometric bulge to total () light ratio (top panel) and the bar luminosities (bottom panel). We define the photometric bulge to consist of all the components (including the NSCs) except the bar and the disk. We determine the luminosity of the bar components in the galaxy, integrating the flux of the bar and the boxy-peanut bulge components (we note that 8/26 of the galaxies with NSCs lack bar components and are not included). Also, since we do not model the disk in NGC 1300 and NGC 5248, we exclude these galaxies from the top panel in the figure.
We find no correlation between the NSC mass and the photometric ratio in our sample. This indicates that the bulges in galaxies appear to be uncorrelated with the formation of the NSCs. Similarly, we do not see any correlation between the NSC mass and the bar luminosities.
5.3 NSC-Black Hole relations
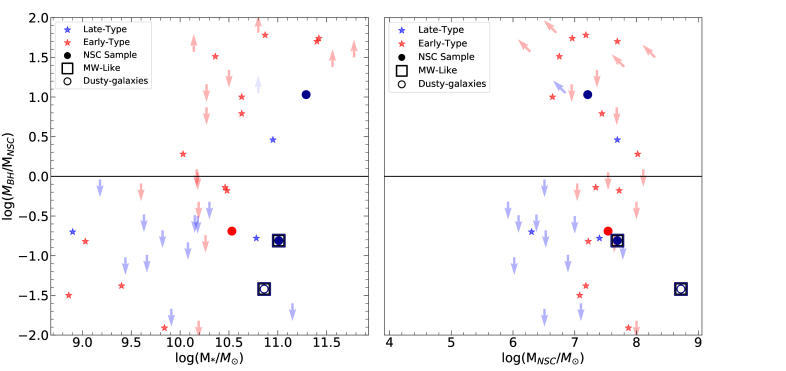
NSCs and BH are found to co-exist in many massive galaxies ( 10, e.g. Seth et al., 2008a; González Delgado et al., 2008). Early studies of scaling relations and the relative masses of these quantities suggested there may be a transition between NSCs dominating the nuclear mass in low mass galaxies and BHs dominating in higher mass galaxies (Ferrarese et al., 2006; Wehner & Harris, 2006; Graham & Spitler, 2009). The recent compilation of co-existing BH and NSC mass measurements in Neumayer et al. (2020) shows a clear trend where NSCs are typically more massive than BHs in lower-mass galaxies, while the opposite is true in higher mass galaxies. NSCs become less common in massive early-type galaxies (). This could be due to the dynamical impact of binary BH mergers (e.g. Milosavljević & Merritt, 2001; Antonini et al., 2015). However, the trend in NSC/BH mass is not a simple one – This large scatter can be seen in the very different relative masses of the BHs and NSCs in the Milky Way (where the NSC is 10 the BH mass) and M31 (where the opposite is true). Unfortunately, a lack of NSC mass measurements in massive spiral galaxies has limited our ability to make this comparison more widely for MW-like galaxies.
From our galaxies with good NSC measurements, 4 galaxies have black hole mass measurements available in the Saglia et al. (2016) compilation (NGC 3368, NGC 3412, NGC 4501, and NGC 4699). In Figure 10 we show the ratio of BH and NSC mass of these galaxies against their host galaxy stellar mass (left panel) and the NSC mass (right panel) added to the data from Neumayer et al. (2020). The solid line in the figure represents equal NSC and BH mass. The objects above this line (including our measurement for the very massive late-type galaxy NGC 4699) have a more massive BH than NSC. Our measurement confirm that there are a wide range of BH to NSC mass ratios in massive galaxies.
6 Conclusions
In this paper, we have presented the photometric and morphological analyses of nuclear star clusters in 33 nearby galaxies from the Composite Bulges Survey. This includes a subsample of 20 MW-like galaxies with spiral morphologies (T = 1–4) and stellar mass from to . This MW-like subsample is a complete volume-limited sample of galaxies similar to the Milky Way that also meet the distance ( Mpc), inclination (35 to 60∘), and Galactic latitude () criteria of the complete CBS sample.
Using imfit, we obtain accurate models for the nuclear regions of the galaxies. We model the NSCs using Sérsic profiles in three HST filters and derive their sizes, colors, and masses. We present the Sérsic profile fit parameters of the NSCs in Table 2 and their derived properties in Table 3.
Our main results are:
-
•
We clearly identify NSCs in 78.8% of our 33 galaxies, and 68.4% for the MW-like subsample. NSCs may be present in other galaxies, but are missed due to dust or AGN, thus these nucleation fractions are lower limits. This work significantly expands the number of nucleated galaxies known in higher mass, late-type galaxies. The nucleation fractions are higher than, but consistent within the errors of the determination in Neumayer et al. (2020).
-
•
We calculated the mass of our NSCs using color- relations, and find a median mass of NSCs in our galaxies of .
- •
-
•
We find a large scatter in NSC mass over a small range of galaxy mass, with two prominent low-mass outliers. These outliers also have small radii, suggesting a possible difference in NSC formation mechanism or evolution.
-
•
Our NSCs are preferentially aligned with but are less flattened than their host galaxy disks. This alignment suggests these NSCs are forming either from gas accretion or star clusters inspiraling from the disk due to dynamical friction.
-
•
Our NSCs do not show any correlation with the bar luminosity or photometric ratios.
-
•
We add four more galaxies to the small number of galaxies with known NSC and BH masses. One has a BH times the mass of the NSC, while the others have NSCs that greatly exceed their BH masses. This confirms that massive galaxies have a wide range of NSC-to-BH mass ratios.
ACKNOWLEDGEMENTS
We would like to thank David Ohlson for sharing his galaxy catalog with us pre-publication. We would also like to thank Luis Ho for providing us with optical images from the Carnegie-Irvine Galaxy Survey and Preben Grosbøl for providing us with near-IR images from Grosbøl & Dottori (2012).
This research is based on observations made with the NASA/ESA Hubble Space Telescope obtained from the Space Telescope Science Institute, which is operated by the Association of Universities for Research in Astronomy, Inc., under NASA contract NAS 5–26555. These observations are associated with program HST-GO-15133. Support for this work was provided from that program. J.M.A. acknowledges the support of the Viera y Clavijo Senior program funded by ACIISI and ULL. This work is based in part on observations made with the Spitzer Space Telescope, which was operated by the Jet Propulsion Laboratory, California Institute of Technology under a contract with NASA. It has also made use of the NASA/IPAC Extragalactic Database (NED), which is operated by the Jet Propulsion Laboratory, California Institute of Technology, under contract with the National Aeronautics and Space Administration. We also made use of data from the Sloan Digital Sky Survey.
References
- Agarwal & Milosavljević (2011) Agarwal, M., & Milosavljević, M. 2011, ApJ, 729, 35, doi: 10.1088/0004-637X/729/1/35
- Akaike (1974) Akaike, H. 1974, IEEE Transactions on Automatic Control, 19, 716
- Alloin et al. (1985) Alloin, D., Pelat, D., Phillips, M., & Whittle, M. 1985, ApJ, 288, 205, doi: 10.1086/162783
- Anderson (2016) Anderson, J. 2016, Empirical Models for the WFC3/IR PSF, Space Telescope WFC Instrument Science Report
- Antonini et al. (2015) Antonini, F., Barausse, E., & Silk, J. 2015, ApJ, 812, 72, doi: 10.1088/0004-637X/812/1/72
- Antonini et al. (2012) Antonini, F., Capuzzo-Dolcetta, R., Mastrobuono-Battisti, A., & Merritt, D. 2012, ApJ, 750, 111, doi: 10.1088/0004-637X/750/2/111
- Astropy Collaboration et al. (2013) Astropy Collaboration, Robitaille, T. P., Tollerud, E. J., et al. 2013, A&A, 558, A33, doi: 10.1051/0004-6361/201322068
- Astropy Collaboration et al. (2018) Astropy Collaboration, Price-Whelan, A. M., Sipőcz, B. M., et al. 2018, AJ, 156, 123, doi: 10.3847/1538-3881/aabc4f
- Balcells et al. (2007) Balcells, M., Graham, A. W., & Peletier, R. F. 2007, ApJ, 665, 1084, doi: 10.1086/519752
- Bekki (2007) Bekki, K. 2007, PASA, 24, 77, doi: 10.1071/AS07008
- Bell et al. (2003) Bell, E. F., McIntosh, D. H., Katz, N., & Weinberg, M. D. 2003, ApJS, 149, 289, doi: 10.1086/378847
- Bertin & Arnouts (1996) Bertin, E., & Arnouts, S. 1996, A&AS, 117, 393, doi: 10.1051/aas:1996164
- Bi et al. (2020) Bi, S., Feng, H., & Ho, L. C. 2020, ApJ, 900, 124, doi: 10.3847/1538-4357/aba761
- Böker et al. (2002) Böker, T., Laine, S., van der Marel, R. P., et al. 2002, AJ, 123, 1389, doi: 10.1086/339025
- Böker et al. (2004) Böker, T., Sarzi, M., McLaughlin, D. E., et al. 2004, AJ, 127, 105, doi: 10.1086/380231
- Brammer (2019) Brammer, G. 2019, Grizli: Grism redshift and line analysis software, Astrophysics Source Code Library, record ascl:1905.001. http://ascl.net/1905.001
- Bressan et al. (2012) Bressan, A., Marigo, P., Girardi, L., et al. 2012, MNRAS, 427, 127, doi: 10.1111/j.1365-2966.2012.21948.x
- Carlsten et al. (2022) Carlsten, S. G., Greene, J. E., Beaton, R. L., & Greco, J. P. 2022, ApJ, 927, 44, doi: 10.3847/1538-4357/ac457e
- Carollo et al. (1998) Carollo, C. M., Stiavelli, M., & Mack, J. 1998, AJ, 116, 68, doi: 10.1086/300407
- Carollo et al. (2002) Carollo, C. M., Stiavelli, M., Seigar, M., de Zeeuw, P. T., & Dejonghe, H. 2002, AJ, 123, 159, doi: 10.1086/324725
- Carson et al. (2015) Carson, D. J., Barth, A. J., Seth, A. C., et al. 2015, AJ, 149, 170, doi: 10.1088/0004-6256/149/5/170
- Côté et al. (2006) Côté, P., Piatek, S., Ferrarese, L., et al. 2006, ApJS, 165, 57, doi: 10.1086/504042
- da Silva et al. (2017) da Silva, P., Steiner, J. E., & Menezes, R. B. 2017, MNRAS, 470, 3850, doi: 10.1093/mnras/stx1458
- de Vaucouleurs et al. (1995) de Vaucouleurs, G., de Vaucouleurs, A., Corwin, H. G., et al. 1995, VizieR Online Data Catalog, VII/155
- den Brok et al. (2014) den Brok, M., Peletier, R. F., Seth, A., et al. 2014, MNRAS, 445, 2385, doi: 10.1093/mnras/stu1906
- Eigenthaler et al. (2018) Eigenthaler, P., Puzia, T. H., Taylor, M. A., et al. 2018, ApJ, 855, 142, doi: 10.3847/1538-4357/aaab60
- Erwin (2015) Erwin, P. 2015, ApJ, 799, 226, doi: 10.1088/0004-637X/799/2/226
- Erwin & Debattista (2013) Erwin, P., & Debattista, V. P. 2013, MNRAS, 431, 3060, doi: 10.1093/mnras/stt385
- Erwin & Gadotti (2012) Erwin, P., & Gadotti, D. A. 2012, Advances in Astronomy, 2012, 946368, doi: 10.1155/2012/946368
- Erwin et al. (2021) Erwin, P., Seth, A., Debattista, V. P., et al. 2021, MNRAS, 502, 2446, doi: 10.1093/mnras/stab126
- Fahrion et al. (2022a) Fahrion, K., Leaman, R., Lyubenova, M., & van de Ven, G. 2022a, A&A, 658, A172, doi: 10.1051/0004-6361/202039778
- Fahrion et al. (2021) Fahrion, K., Lyubenova, M., van de Ven, G., et al. 2021, A&A, 650, A137, doi: 10.1051/0004-6361/202140644
- Fahrion et al. (2022b) Fahrion, K., Bulichi, T.-E., Hilker, M., et al. 2022b, A&A, 667, A101, doi: 10.1051/0004-6361/202244932
- Feldmeier et al. (2014) Feldmeier, A., Neumayer, N., Seth, A., et al. 2014, A&A, 570, A2, doi: 10.1051/0004-6361/201423777
- Feldmeier-Krause et al. (2015) Feldmeier-Krause, A., Neumayer, N., Schödel, R., et al. 2015, A&A, 584, A2, doi: 10.1051/0004-6361/201526336
- Ferrarese et al. (2006) Ferrarese, L., Côté, P., Dalla Bontà, E., et al. 2006, ApJ, 644, L21, doi: 10.1086/505388
- Georgiev & Böker (2014) Georgiev, I. Y., & Böker, T. 2014, MNRAS, 441, 3570, doi: 10.1093/mnras/stu797
- Georgiev et al. (2016) Georgiev, I. Y., Böker, T., Leigh, N., Lützgendorf, N., & Neumayer, N. 2016, MNRAS, 457, 2122, doi: 10.1093/mnras/stw093
- Georgiev et al. (2009) Georgiev, I. Y., Hilker, M., Puzia, T. H., Goudfrooij, P., & Baumgardt, H. 2009, MNRAS, 396, 1075, doi: 10.1111/j.1365-2966.2009.14776.x
- Gnedin et al. (2014) Gnedin, O. Y., Ostriker, J. P., & Tremaine, S. 2014, ApJ, 785, 71, doi: 10.1088/0004-637X/785/1/71
- González Delgado et al. (2008) González Delgado, R. M., Pérez, E., Cid Fernandes, R., & Schmitt, H. 2008, AJ, 135, 747, doi: 10.1088/0004-6256/135/3/747
- Graham (2012) Graham, A. W. 2012, MNRAS, 422, 1586, doi: 10.1111/j.1365-2966.2012.20734.x
- Graham & Spitler (2009) Graham, A. W., & Spitler, L. R. 2009, MNRAS, 397, 2148, doi: 10.1111/j.1365-2966.2009.15118.x
- Grosbøl & Dottori (2012) Grosbøl, P., & Dottori, H. 2012, A&A, 542, A39, doi: 10.1051/0004-6361/201118099
- Hack et al. (2013) Hack, W. J., Dencheva, N., & Fruchter, A. S. 2013, in Astronomical Society of the Pacific Conference Series, Vol. 475, Astronomical Data Analysis Software and Systems XXII, ed. D. N. Friedel, 49
- Hannah et al. (2021) Hannah, C. H., Seth, A. C., Nguyen, D. D., et al. 2021, AJ, 162, 281, doi: 10.3847/1538-3881/ac282e
- Hartmann et al. (2011) Hartmann, M., Debattista, V. P., Seth, A., Cappellari, M., & Quinn, T. R. 2011, MNRAS, 418, 2697, doi: 10.1111/j.1365-2966.2011.19659.x
- Ho et al. (1995) Ho, L. C., Filippenko, A. V., & Sargent, W. L. 1995, ApJS, 98, 477, doi: 10.1086/192170
- Ho et al. (1997) Ho, L. C., Filippenko, A. V., & Sargent, W. L. W. 1997, ApJS, 112, 315, doi: 10.1086/313041
- Ho et al. (2011) Ho, L. C., Li, Z.-Y., Barth, A. J., Seigar, M. S., & Peng, C. Y. 2011, ApJS, 197, 21, doi: 10.1088/0067-0049/197/2/21
- Hopkins & Quataert (2010) Hopkins, P. F., & Quataert, E. 2010, MNRAS, 405, L41, doi: 10.1111/j.1745-3933.2010.00855.x
- Hoyer et al. (2021) Hoyer, N., Neumayer, N., Georgiev, I. Y., Seth, A. C., & Greene, J. E. 2021, MNRAS, 507, 3246, doi: 10.1093/mnras/stab2277
- Hoyer et al. (2023a) Hoyer, N., Neumayer, N., Seth, A. C., Georgiev, I. Y., & Greene, J. E. 2023a, MNRAS, 520, 4664, doi: 10.1093/mnras/stad220
- Hoyer et al. (2023b) Hoyer, N., Pinna, F., Kamlah, A. W. H., et al. 2023b, ApJ, 944, L25, doi: 10.3847/2041-8213/aca53e
- Inayoshi et al. (2020) Inayoshi, K., Visbal, E., & Haiman, Z. 2020, ARA&A, 58, 27, doi: 10.1146/annurev-astro-120419-014455
- Jarrett et al. (2003) Jarrett, T. H., Chester, T., Cutri, R., Schneider, S. E., & Huchra, J. P. 2003, AJ, 125, 525, doi: 10.1086/345794
- Kacharov et al. (2018) Kacharov, N., Neumayer, N., Seth, A. C., et al. 2018, MNRAS, 480, 1973, doi: 10.1093/mnras/sty1985
- Lauer et al. (2012) Lauer, T. R., Bender, R., Kormendy, J., Rosenfield, P., & Green, R. F. 2012, ApJ, 745, 121, doi: 10.1088/0004-637X/745/2/121
- Liu et al. (2022) Liu, H., Wu, Q., & Lyu, B. 2022, ApJ, 930, 46, doi: 10.3847/1538-4357/ac5fa5
- Milosavljević & Merritt (2001) Milosavljević, M., & Merritt, D. 2001, ApJ, 563, 34, doi: 10.1086/323830
- Neumayer et al. (2020) Neumayer, N., Seth, A., & Böker, T. 2020, A&A Rev., 28, 4, doi: 10.1007/s00159-020-00125-0
- Neumayer & Walcher (2012) Neumayer, N., & Walcher, C. J. 2012, Advances in Astronomy, 2012, 709038, doi: 10.1155/2012/709038
- Nguyen et al. (2017) Nguyen, D. D., Seth, A. C., den Brok, M., et al. 2017, ApJ, 836, 237, doi: 10.3847/1538-4357/aa5cb4
- Nguyen et al. (2018) Nguyen, D. D., Seth, A. C., Neumayer, N., et al. 2018, ApJ, 858, 118, doi: 10.3847/1538-4357/aabe28
- Nguyen et al. (2019) —. 2019, ApJ, 872, 104, doi: 10.3847/1538-4357/aafe7a
- Norris et al. (2014) Norris, M. A., Kannappan, S. J., Forbes, D. A., et al. 2014, MNRAS, 443, 1151, doi: 10.1093/mnras/stu1186
- Pechetti et al. (2020) Pechetti, R., Seth, A., Neumayer, N., et al. 2020, ApJ, 900, 32, doi: 10.3847/1538-4357/abaaa7
- Phillips et al. (1996) Phillips, A. C., Illingworth, G. D., MacKenty, J. W., & Franx, M. 1996, AJ, 111, 1566, doi: 10.1086/117896
- Pinna et al. (2021) Pinna, F., Neumayer, N., Seth, A., et al. 2021, ApJ, 921, 8, doi: 10.3847/1538-4357/ac158f
- Roediger & Courteau (2015) Roediger, J. C., & Courteau, S. 2015, MNRAS, 452, 3209, doi: 10.1093/mnras/stv1499
- Rossa et al. (2006) Rossa, J., van der Marel, R. P., Böker, T., et al. 2006, AJ, 132, 1074, doi: 10.1086/505968
- Saglia et al. (2016) Saglia, R. P., Opitsch, M., Erwin, P., et al. 2016, ApJ, 818, 47, doi: 10.3847/0004-637X/818/1/47
- Sánchez-Janssen et al. (2019) Sánchez-Janssen, R., Côté, P., Ferrarese, L., et al. 2019, ApJ, 878, 18, doi: 10.3847/1538-4357/aaf4fd
- Scott et al. (2013) Scott, N., Graham, A. W., & Schombert, J. 2013, ApJ, 768, 76, doi: 10.1088/0004-637X/768/1/76
- Seth et al. (2008a) Seth, A., Agüeros, M., Lee, D., & Basu-Zych, A. 2008a, ApJ, 678, 116, doi: 10.1086/528955
- Seth et al. (2008b) Seth, A. C., Blum, R. D., Bastian, N., Caldwell, N., & Debattista, V. P. 2008b, ApJ, 687, 997, doi: 10.1086/591935
- Seth et al. (2006) Seth, A. C., Dalcanton, J. J., Hodge, P. W., & Debattista, V. P. 2006, AJ, 132, 2539, doi: 10.1086/508994
- Seth et al. (2010) Seth, A. C., Cappellari, M., Neumayer, N., et al. 2010, ApJ, 714, 713, doi: 10.1088/0004-637X/714/1/713
- Sheth et al. (2010) Sheth, K., Regan, M., Hinz, J. L., et al. 2010, PASP, 122, 1397, doi: 10.1086/657638
- Spengler et al. (2017) Spengler, C., Côté, P., Roediger, J., et al. 2017, ApJ, 849, 55, doi: 10.3847/1538-4357/aa8a78
- Stone et al. (2017) Stone, N. C., Küpper, A. H. W., & Ostriker, J. P. 2017, MNRAS, 467, 4180, doi: 10.1093/mnras/stx097
- Storchi-Bergmann et al. (1993) Storchi-Bergmann, T., Baldwin, J. A., & Wilson, A. S. 1993, ApJ, 410, L11, doi: 10.1086/186867
- Tremaine et al. (1975) Tremaine, S. D., Ostriker, J. P., & Spitzer, L., J. 1975, ApJ, 196, 407, doi: 10.1086/153422
- Tsatsi et al. (2017) Tsatsi, A., Mastrobuono-Battisti, A., van de Ven, G., et al. 2017, MNRAS, 464, 3720, doi: 10.1093/mnras/stw2593
- Turner et al. (2012) Turner, M. L., Côté, P., Ferrarese, L., et al. 2012, ApJS, 203, 5, doi: 10.1088/0067-0049/203/1/5
- Walcher et al. (2006) Walcher, C. J., Böker, T., Charlot, S., et al. 2006, ApJ, 649, 692, doi: 10.1086/505166
- Walcher et al. (2005) Walcher, C. J., van der Marel, R. P., McLaughlin, D., et al. 2005, ApJ, 618, 237, doi: 10.1086/425977
- Watkins et al. (2022) Watkins, A. E., Salo, H., Laurikainen, E., et al. 2022, arXiv e-prints, arXiv:2201.08381. https://arxiv.org/abs/2201.08381
- Wehner & Harris (2006) Wehner, E. H., & Harris, W. E. 2006, ApJ, 644, L17, doi: 10.1086/505387
- Wevers et al. (2019) Wevers, T., Stone, N. C., van Velzen, S., et al. 2019, MNRAS, 487, 4136, doi: 10.1093/mnras/stz1602
- Zanatta et al. (2021) Zanatta, E., Sánchez-Janssen, R., Chies-Santos, A. L., de Souza, R. S., & Blakeslee, J. P. 2021, MNRAS, 508, 986, doi: 10.1093/mnras/stab2348
Appendix A AGN detections in the NSC sample of galaxies
| Name | Nuclear Class | AGN Source | log( [ergs/s]) | Notes |
|---|---|---|---|---|
| NGC0289 | ||||
| NGC0613 | S? | 2 | ||
| NGC1097 | L/S1 | 2 | 40.96 | (a) |
| NGC1300 | T | 2 | 40.12 | |
| NGC1440 | ||||
| IC2051 | ||||
| NGC1566 | S1.2 | 3 | 41.1-42.5 | (b) |
| NGC2775 | ||||
| NGC3351 (M95) | H | 1 | ||
| NGC3368 (M96) | L2 | 1 | ||
| NGC3412 | A | 1 | ||
| NGC4643 | T2 | 1 | ||
| NGC4699 | ||||
| NGC5121 | ||||
| NGC5248 | H | 1 | 38.32 | |
| NGC5364 | H | 1 | ||
| NGC6744 | ||||
| NGC7513 | ||||
| NGC4237 | ||||
| NGC4321 (M100) | T2 | 1 | ||
| NGC4377 | ||||
| NGC4380 | H | 1 | ||
| NGC4450 | L1.9 | 1 | 40.55 | |
| NGC4501 (M88) | S2 | 1 | 40.16 | |
| NGC4528 | ||||
| NGC4531 | ||||
| NGC4548 (M91) | L2 | 1 | 39.93 | |
| NGC4578 | A | 2 | ||
| NGC4579 (M58) | S1.9/L1.9 | 1 | 41.61 | |
| NGC4608 | ||||
| NGC4612 | A | 1 | ||
| NGC4689 | H | 1 | ||
| NGC4698 | S2 | 1 | 38.93 |
Note. — Nuclear class gives nuclear classifications based on optical spectra: L=LINER, S=Seyfert A=Absorption, H=HII, and T=Transition spectrum, and number indicates Type 1 (broad line) or Type 2 (narrow line). AGN Source provides the reference of the AGN nuclear classification: (1) Ho et al. (1997), (2) compiled by Bi et al. (2020), (3) Alloin et al. (1985). The log( [ergs/s]) give 2-10 keV X-ray luminosities; all are from Bi et al. (2020) rescaled to the distances for each galaxy used in this paper except where noted. Notes: (a) changing look AGN including change from LINER to Seyfert Storchi-Bergmann et al. (1993), classified as L1 in Bi et al. (2020), (b) X-ray fluxes varying values from (Liu et al., 2022), changing look AGN (e.g. da Silva et al., 2017).
Appendix B Common Components Used in Our imfit Modeling
Below we list the most frequently used components used in our imfit fits.
-
•
FlatSky – a uniform sky background (as discussed in section 3.1).
-
•
Exponential – an elliptical 2D exponential function. We use this primarily for fitting the disk and other highly elliptical components.
-
•
BrokenExponential – two exponential zones having different scale lengths joined by a transition region of variable sharpness. We use this for fitting the outer disk component in some galaxies.
-
•
GaussianRing – an elliptical ring with a radial profile consisting of a Gaussian function. We use this to ring or pseudoring features, such as nuclear rings.
-
•
FlatBar – this is meant to represent the outer parts of bars, with a major-axis broken-exponential profile and a single-exponential minor-axis profile; it is described further in Erwin et al. (2021).
-
•
Sersic_GenEllipse – an elliptical 2D Sérsic function using generalized ellipses (“boxy” to “disky” shapes). We use this to fit boxy-shaped bulge features.
-
•
Sersic – an elliptical 2D Sérsic function. We use this to fit NSC and the (non-boxy) bulge features.
-
•
PointSource – a scaled representation of the image PSF, used primarily to model unresolved AGN emission.
We provide detailed notes on each galaxy in the next section, including a handful of additional components other than these listed here.
Appendix C Detailed notes on individual galaxy decomposition from the NSC sample
In this section, we describe the components of the best-fitting models for each galaxy in the NSC sample. The models are obtained in the primary band filter provided in Table 2 (column 3). For each component, we provide our best interpretation of what kind of structure it is, the imfit image function used (in brackets), and then the best-fit parameter values. The ordering generally reflects an inside-out description. Note that bar “spurs” refers to the outer, more elongated part of a bar, outside of the B/P-bulge part of the bar (see, e.g. Erwin & Debattista, 2013; Erwin et al., 2021).
IC 2051
-
•
NSC [Sersíc] (PA=17.0, =0.18, n=2.65, =14.60, =0.39″)
-
•
Nuclear disk(?) [Sersíc] (PA=22.3, =0.40, n=0.98, =15.95, =2.98″)
-
•
B/P bulge [SersícGenEllipse] (PA=27.4, =0.40, n=1.44, =18.22, =7.06″)
-
•
Bar spurs [FlatBar] (PA=144.7, =0.63, =17.11, Rbrk=19.6″)
-
•
Inner ring [GaussianRingAZ] (PA=12.0, =0.29, Amaj=19.15, Amin-rel=27.34, =28.10″, =6.44″)
-
•
Outer disk [BrokenExponential] (PA=23.3, =0.45, =19.15, Rbrk=60.17″)
NGC 289
We do not trust the NSC measurements for this galaxy due to strong dust lanes obscuring the NSC, as mentioned in Section 3.4. Hence, we do not provide the best-fit models for this galaxy.
NGC 613
The NSC in this galaxy is unresolved (see section 4.1). For the purpose of determining the NSC properties, we provide a Sersíc component fit. Note that the FlatBar component is offset by from the other components.
-
•
NSC [Sersíc] (PA=0, =0.0, n=0.5, =11.53, =0.03″)
-
•
Classical bulge(?) [Sersíc] (PA=144.3, =0.11, n=0.79, =14.88, =0.71″)
-
•
Nuclear disk [Exponential] (PA=151, =0.32, =13.94, h=3.23″)
-
•
B/P bulge [SersícGenEllipse] (PA=160, =0.32, n=0.2, =18.90, =16.4″)
-
•
Bar spurs [FlatBar] (PA=162, =0.92, =17.70, Rbrk=51.64″)
-
•
Outer disk [Exponential] (PA=154, =0.41, =17.93, h=47.06″)
NGC 1097
-
•
NSC [Sersíc] (PA=117.1, =0.16, n=3.23, =13.20, =0.21″)
-
•
Inner-bar B/P bulge [Sersíc] (PA=178.1, =0.05, n=1.09, =15.32, =3.08″)
-
•
Inner-bar spurs [FlatBar] (PA=86.3, =0.62, =15.00, Rbrk=6.39″
-
•
Nuclear ring [GaussianRing] (PA=29.7, =0.18, A=15.91, =10.19″, =0.89″)
-
•
Nuclear disk [BrokenExponential] (PA=10.4, =0.20, =16.61, Rbrk=12.93″)
-
•
Outer-bar B/P bulge [Sersíc] (PA=11.1, =0.29, n=0.38, =18.21, =27.72″)
-
•
Outer-bar spurs [FlatBar] (PA=26.3, =0.92, =17.75, Rbrk=73.74″)
NGC 1300
-
•
NSC [Sersíc] (PA=59.9, =0.15, n=1.53, =14.49, =0.09″)
-
•
Classical bulge(?) [Sersíc] (PA=90.3, =0.11, n=0.49, =16.37, =0.40″)
-
•
Nuclear disk [Exponential] (PA=83.7, =0.12, =15.65, h=1.56″)
-
•
Nuclear Ring [GaussianRing2Side] (PA=86.7, =0.16, Amin=19.35, Amaj=13.60, =3.86″, =0.27″, =1.64″)
-
•
B/P Bulge [SersícGenEllipse] (PA=86.7, =0.42, n=0.78, =20.19, =25.13″)
-
•
Bar spurs [FlatBar] (PA=90.9, =0.91, =23.82, Rbrk=80.43″)
NGC 1440
The NSC in this galaxy is unresolved (see section 4.1). For the purpose of determining the NSC properties, we provide a Sersíc component fit.
-
•
NSC [Sersíc] (PA=0, =0.0, n=3.48, =15.34, =0.05″)
-
•
Classical bulge(?) [Sersíc] (PA=112.2, =0.13, n=2.13, =17.28, =1.73″)
-
•
Nuclear disk [Sersíc] (PA=106.9, =0.19, n=64, =18.02, =1.96″)
-
•
B/P bulge [Sersíc] (PA=120.0, =0.16, n=41, =18.51, =6.34″)
-
•
Bar spurs [FlatBar] (PA=140.9, =0.77, =18.60, Rbrk=18.245″)
-
•
Main disk [BrokenExponential] (PA=108.1, =0.23, =19.93, Rbrk=36.85″)
NGC 1566
Due to significant nuclear saturation in all bands, we do not provide fits for this galaxy (see section 3.4).
NGC 2775
-
•
NSC [Sersíc] (PA=0, =0.0, n=0.52, =14.51, =0.04″)
-
•
Classical bulge(?) [Sersíc] (PA=23.8, =0.12, n=2.81, =18.20, =6.05″)
-
•
Outer bulge [Sersíc] (PA=26.5, =0.12, n=1.06, =19.34, =17.12″)
-
•
Ring [GaussianRing] (PA=24.0, =0.21, A=22.03, =31.51″, =17.81″)
-
•
Main disk [Exponential] (PA=31.7, =0.22, =19.14, h=42.59″)
NGC 3351
-
•
NSC [Sersíc] (PA=0, =0.0, n=0.8, =15.56, =0.09″)
-
•
Classical bulge(?) [Sersíc] (PA=58.1, =0.32, n=0.42, =16.85, =0.75″)
-
•
Nuclear disk + ring [BrokenExponential] (PA=33.3, =0.12, =16.88, Rbrk=6″)
-
•
B/P bulge [SersícGenEllipse] (PA=46.1, =0.28, n=0.89, =18.89, =14.58″)
-
•
Bar spurs [FlatBar] (PA=142.8, =0.74, =19.02, Rbrk=41.18″)
-
•
Inner ring [GaussianRing] (PA=20.4, =0.14, A=20.03, =59.92″, =15.70″)
-
•
Main disk [BrokenExponential] (PA=41, =0.27, =21.25, Rbrk=141.6″)
NGC 3368
-
•
NSC [Sersíc] (PA=81.7, =0.16, n=2.21, =14.29, =0.204″)
-
•
Classical bulge(?) or inner-bar B/P bulge [Sersíc] (PA=27.6, =0.33, n=0.21, =15.86, =0.93″)
-
•
Inner-bar spurs [SersícGenEllipse] (PA=141, =0.61, n=0.31, =16.69, =3.41″)
-
•
Nuclear disk [Sersíc] (PA=2.8, =0.22, n=0.33, =17.13, =5.42″)
-
•
B/P bulge [SersícGenEllipse] (PA=-1.8, =0.28, n=1.73, =18.98, =30.52″)
-
•
SE outer-bar spur [Sersíc] (PA=9.7, =0.54, n=0.70, =21.39, =37.56″)
-
•
NW outer-bar spur [Sersíc] (PA=5.6, =0.48, n=0.73, =22.69, =32.76″)
-
•
Disk [BrokenExponential] (PA=13.9, =0.36, =20.48, Rbrk=178.65″)
NGC 3412
-
•
NSC [Sersíc] (PA=149.0, =0.31, n=1.78, =13.38, =0.12″)
-
•
Classical bulge(?) [Sersíc] (PA=151.0, =0.36, n=1.05, =15.37, =0.95″)
-
•
Inner elliptical (counter-rotating) component [SersícGenEllipse] (PA=148.9, =0.29, n=0.87, =16.35, =2.68″)
-
•
B/P bulge [SersícGenEllipse] (PA=137.2, =0.22, n=0.56, =18.75, =5.46″)
-
•
Bar spurs [SersícGenEllipse] (PA=106.6, =0.30, n=0.51, =18.63, =10.79″)
-
•
Disk [BrokenExponential] (PA=150.2, =0.50, =19.81, Rbrk=69.41″)
-
•
Halo [Sersíc] (PA=144.6, =0.34, n=0.64, =22.28, =57.78″)
NGC 4237
-
•
NSC [Sersíc] (PA=132.7, =0.12, n=4.42, =17.56, =0.21″)
-
•
Bulge [Sersíc] (PA=121.0, =0.27, n=0.75, =18.46, =1.92″)
-
•
Disk [Exponential] (PA=121.3, =0.40, =17.95, h=14.81″)
NGC 4377
-
•
NSC [Sersíc] (PA=10.2, =0.21, n=5.73, =13.60, =0.02″)
-
•
Classical bulge [Sersíc] (PA=47.4, =0.13, n=1.62, =16.10, =0.74″)
-
•
B/P Bulge [SersícGenEllipse] (PA=13.1, =0.16, n=1.27, =16.78, =2.61″)
-
•
Bar spurs [FlatBar] (PA=1.4, =0.81, =18.80, Rbrk=6.91″)
-
•
Outer ring [GaussianRing] (PA=39.8, =0.14, A =23.12, =20.12″, =5.70″)
-
•
Disk [Exponential] (PA=30.8, =0.19, =18.20, h=10.89″)
NGC 4380
-
•
NSC [Sersíc] (PA=166.7, =0.18, n=7.0, =16.59, =0.35″)
-
•
Classical bulge(?) [Sersíc] (PA=177.1, =0.21, n=1.73, =17.55, =2.46″)
-
•
Inner ring [GaussianRing] (PA=173.9, =0.46, A =19.05, =12.15″, =6.47″)
-
•
Inner disk(?) [Sersíc] (PA=174.2, =0.42, n=0.5, =17.63, =5.50″)
-
•
Outer ring [GaussianRing] (PA=169.2, =0.43, A =20.56, =27.42″, =3.87″)
-
•
Main disk [BrokenExponential] (PA=173.3, =0.47, =18.60, Rbrk=71.48″)
NGC 4450
-
•
NSC [Sersíc] (PA=0, =0.0, n=4.95, =15.73, =0.19″)
-
•
Classical bulge(?) or inner-bar B/P bulge [Sersíc] (PA=86.7, =0.21, n=1.21, =16.06, =0.64″)
-
•
Inner bar (spurs?) [Sersíc] (PA=46.5, =0.12, n=0.89, =17.07, =1.62″)
-
•
Nuclear ring [GaussianRing] (PA=168.6, =0.43, A =18.99, =3.54″, =1.01″)
-
•
Nuclear disk [Exponential] (PA=81.8, =0.22, =16.34, h=3.24″)
-
•
Outer-bar B/P bulge [SersícGenEllipse] (PA=87.1, =0.35, n=1.0, =19.53, =28.30″)
-
•
N outer-bar spur [SersícGenEllipse] (PA=49.4, =0.37, n=0.85, =22.71, =22.34″)
-
•
S outer-bar spur [SersícGenEllipse] (PA=51.7, =0.38, n=1.0, =22.43, =31.0″)
-
•
Disk [BrokenExponential] (PA=166.0, =0.33, =21.11, Rbrk=108.27″)
NGC 4501
-
•
NSC [Sersíc] (PA=144.2, =0.22, n=1.58, =13.33, =0.38″)
-
•
Bulge [Sersíc] (PA=135.9, =0.33, n=3.02, =16.93, =10.67″)
-
•
Disk [Exponential] (PA=140.4, =0.51, =16.24, h=41.17″)
NGC 4531
-
•
NSC [Sersíc] (PA=39.5, =0.05, n=4.36, =16.59, =0.15″)
-
•
Unclear [Exponential] (PA=71.1, =0.73, =21.29, h=10.18″)
-
•
Inner disk/pseudobulge(?) [Sersíc] (PA=152.1, =0.23, n=1.24, =21.06, =15.06″)
-
•
Ring [GaussianRing] (PA=24.3, =0.22, A =21.92, =17.98″, =2.83″)
-
•
Disk [Exponential] (PA=14.8, =0.46, =19.27, h=29.62″)
NGC 4548
-
•
NSC [Sersíc] (PA=0, =0.20, n=2.47, =14.35, =0.25″)
-
•
Inner-bar B/P bulge(?) [Sersíc] (PA=157.1, =0.03, n=0.60, =15.86, =0.62″)
-
•
Inner bar [Sersíc] (PA=132.7, =0.30, n=0.50, =17.60, =2.01″)
-
•
Nuclear disk [Sersíc] (PA=158.2, =0.12, n=1.0, =18.19, =5.66″)
-
•
Outer-bar B/P bulge [Sersíc] (PA=113.5, =0.15, n=0.37, =19.76, =16.90″)
-
•
Outer-bar spurs [FlatBar] (PA=97.7, =0.80, =20.42, Rbrk=41.16″)
-
•
W spiral arm [LogSpiralBrokenExp] (PA=0, =0, =124.38″, =17.81″, =19.78, =108.97″, =70.13″, =56.99″)
-
•
E spiral arm [LogSpiralBrokenExp] (PA=163.0, =0.14, =115.95″, =29.31″, =19.67, =134.24″, =70.13″, =14.32″)
-
•
Disk [BrokenExponential] (PA=173.0, =0.21, =20.33, Rbrk=116.09″)
NGC 4578
-
•
NSC [Sersíc] (PA=42.0, =0.14, n=2.76, =14.89, =0.15″)
-
•
Classical bulge [Sersíc] (PA=64.8, =0.23, n=2.47, =18.39, =4.96″)
-
•
Nuclear ring [GaussianRing] (PA=62.3, =0.27, A =18.50, =0.75″, =3.74″)
-
•
Outer ring [GaussianRing] (PA=64.9, =0.31, A =21.88, =44.99″, =27.51″)
-
•
Disk [Exponential] (PA=62.5, =0.32, =18.46, h=12.92″)
NGC 4579
-
•
NSC [Sersíc] (PA=95.0, =0.30, n=1.54, =10.52, =0.07″)
-
•
Classical bulge or nuclear disk [Sersíc] (PA=118.2, =0.19, n=2.49, =15.53, =5.18″)
-
•
B/P Bulge [Sersíc] (PA=93.7, =0.36, n=0.78, =18.53, =20.78″)
-
•
Bar spurs [FlatBar] (PA=86.3, =0.90, =17.33, Rbrk=30.13″)
-
•
Disk [Exponential] (PA=125.0, =0.20, =17.42, h=47.82″)
NGC 4608
-
•
NSC [Sersíc] (PA=164.0, =0.13, n=1.19, =13.80, =0.03″)
-
•
Classical bulge [Sersíc] (PA=105.7, =0.05, n=2.75, =18.96, =8.01″)
-
•
B/P bulge [SersícGenEllipse] (PA=46.7, =0.18, n=1.07, =19.42, =11.40258″)
-
•
Bar spurs [FlatBar] (PA=44.9, =0.87, =19.40, Rbrk=40.71″)
-
•
Inner ring [GaussianRingAz] (PA=124.5, =0.09, Amaj =20.46, Amin-rel=22.07, =48.03″, =6.44″)
-
•
Disk [BrokenExponential] (PA=124.9, =0.13, =23.82, Rbrk=69.78″)
NGC 4612
The NSC in this galaxy is fitted using a two-component model. The properties of this NSC provided in Table 3 are integrated over the two NSC components below.
-
•
Inner NSC [Sersíc] (PA=0, =0.0, n=3.14, =12.39, =0.03″)
-
•
Outer NSC [Exponential] (PA=23.25, =0.22, =14.05, h=0.14″)
-
•
Nuclear disk [Exponential] (PA=26.9, =0.22, =14.84, h=1.16″)
-
•
B/P bulge [ExponentialGenEllipse] (PA=33.3, =0.30, =17.90, h=5.01″)
-
•
Bar spurs [FlatBar] (PA=156.7, =0.35, =18.37, Rbrk=16.23″)
-
•
Inner ring [GaussianRing] (PA=21.9, =0.40, A =21.69, =28.02″, =8.13″)
-
•
Disk [BrokenExponential] (PA=15.7, =0.27, =20.02, Rbrk=48.51″)
NGC 4643
-
•
NSC [Sersíc] (PA=0, =0.0, n=0.76, =14.37, =0.04″)
-
•
Classical bulge(?) [Sersíc] (PA=96.6, =0.11, n=0.69, =15.79, =0.32″)
-
•
Nuclear disk [BrokenExponential] (PA=118.3, =0.13, =15.19, Rbrk=2.99″)
-
•
B/P bulge [Sersíc] (PA=8.4, =0.13, n=0.62, =18.44, =12.92″)
-
•
Bar spurs [FlatBar] (PA=18.9, =0.90, =19.08, Rbrk=44.49″)
-
•
Disk [Exponential] (PA=124.6, =0.18, =20.55, h=81.27″)
NGC 4689
The precise structural/morphological nature of the 2nd–4th components in our model is currently unclear, so we only refer to them as “inner components”.
-
•
NSC [Sersíc] (PA=0, =0.0, n=2.85, =15.33, =0.06″)
-
•
Inner component 1 [Sersíc] (PA=13.4, =0.22, n=0.70, =19.91, =0.91″)
-
•
Inner component 2 [Sersíc] (PA=2.8, =0.14, n=1.47, =20.63, =6.74″)
-
•
Inner component 3 [Sersíc] (PA=79.6, =0.13, n=0.88, =20.63, =7.19″)
-
•
Ring [GaussianRing] (PA=66.5, =0.30, A =21.81, =16.92″, =2.97″)
-
•
Disk [Exponential] (PA=87.7, =0.26, =19.75, h=43.68″)
NGC 4698
-
•
NSC [Sersíc] (PA=76.6, =0.48, n=1.39, =15.61, =0.10″)
-
•
Orthogonal bulge [Sersíc] (PA=80.2, =0.53, n=1.96, =17.64, =2.36″)
-
•
Classical bulge(?) [Sersíc] (PA=171.3, =0.08, n=3.10, =19.78, =20.01″)
-
•
Inner ring [GaussianRing2Side] (PA=176.9, =0.67, A=21.13, =40.39″, =8.62″, =15.29″)
-
•
Outer ring [GaussianRing] (PA=178.9, =0.67, A =22.86, =64.25″, =3.41″)
-
•
Disk [BrokenExponential] (PA=176.5, =0.63, =22.10, Rbrk=67.91″)
-
•
Halo [Sersíc] (PA=179.3, =0.32, n=1.21, =21.99, =54.79″)
NGC 4699
-
•
NSC [Sersíc] (PA=0, =0.0, n=1.87, =14.62, =0.28″)
-
•
Classical bulge(?) [Sersíc] (PA=73.3, =0.21, n=1.13, =14.79, =1.52″)
-
•
B/P bulge [SersícGenEllipse] (PA=73.2, =0.39, n=0.43, =16.48, =3.21″)
-
•
Bar spurs [SersícGenEllipse] (PA=78.4, =0.56, n=0.26, =17.49, =7.93″)
-
•
NE bar ansa [Sersíc] (PA=8.1, =0.38, n=0.88, =19.13, =3.60″)
-
•
SW bar ansa [Sersíc] (PA=87.7, =0.35, n=0.96, =19.40, 4.18″)
-
•
Inner disk [Exponential] (PA=67.5, =0.26, =16.29, h=12.58″)
-
•
Ring [GaussianRing2Side] (PA=67.7, =0.38, A=21.17, =49.39″, =2.38″, =18.04″)
-
•
Main disk [Exponential] (PA=57.8, =0.14, =20.14, h=67.34″)
NGC 5121
-
•
NSC [Sersíc] (PA=35.2, =0.14, n=1.26, =13.84, =0.07″)
-
•
Classical bulge(?) or nuclear-bar B/P bulge [Sersíc] (PA=111.1, =0.17, n=0.57, =15.32, =0.28″)
-
•
Nuclear bar [FlatBar] (PA=45.5, =0.74, =15.57, Rbrk=1.13″)
-
•
Nuclear disk [Exponential] (PA=57.1, =0.12, =14.27, h=0.87″)
-
•
Outer-bar B/P bulge(?) [SersícGenEllipse] (PA=84.2, =0.03, n=0.44, =18.18, =3.90″)
-
•
Outer-bar spurs(?) [Sersíc] (PA=51.3, =0.25, n=0.21, =19.69, =8.98″)
-
•
Disk [BrokenExponential] (PA=57.0, =0.21, =18.45, Rbrk=36.23″)
NGC 5248
-
•
NSC [Sersíc] (PA=128.3, =0.27, n=0.97, =15.60, =0.41″)
-
•
Classical bulge(?) [Sersíc] (PA=156.2, =0.30, n=0.38, =17.71, =1.02″)
-
•
Nuclear disk [Exponential] (PA=125.5, =0.32, =16.34, h=4.34″)
-
•
Boxy zone [SersícGenEllipse] (PA=123.0, =0.44, n=0.21, =20.20, =18.75″)
-
•
N inner spiral [LogSpiralArc] (PA=0, =0, r=64.17, =20.39, =10.60″, =0.45″, =9.0″)
-
•
S inner spiral [LogSpiralArc] (PA=0 =0, r=52.55, =20.62, =11.23″, =1.96″, =3.19″)
-
•
Bar [Sersíc] (PA=157.4, =0.36, n=1.0, =21.44, =66.78″)
NGC 5364
-
•
NSC [Sersíc] (PA=0, =0.16, n=3.52, =17.36, =0.21″)
-
•
Classical bulge(?) [Sersíc] (PA=55.4, =0.26, n=0.65, =18.66, =0.69″)
-
•
Pseudobulge(?) [Sersíc] (PA=28.3, =0.17, n=1.0, =19.90, =6.26″)
-
•
Ring [GaussianRing] (PA=70.1, =0.49, A=21.84, =31.04″, =9.39″)
-
•
Inner disk [Exponential] (PA=67.8, =0.46, =19.56, h=25.80″)
-
•
Outer disk [Exponential] (PA=28.6, =0.32, =20.49, h=59.47″)
NGC 6744
-
•
NSC [Sersíc] (PA=41.7, =0.38, n=2.28, =14.12, =0.25″)
-
•
Classical bulge [Sersíc] (PA=38.4, =0.15, n=3.05, =17.35, =7.18″)
-
•
B/P bulge [SersícGenEllipse] (PA=31.6, =0.38, n=0.89, =17.41, =15.52″)
-
•
Bar spurs [Sersíc] (PA=25.6, =0.74, n=0.64, =19.33, =71.10″)
-
•
Disk [BrokenExponential] (PA=39.5, =0.31, =19.02, Rbrk=99.73″)
NGC 7177
We do not trust the NSC measurements for this galaxy due to strong dust lanes obscuring the NSC, as mentioned in Section 3.4. Hence, we do not provide the best-fit models for this galaxy.
NGC 7513
-
•
NSC [Sersíc] (PA=150.0, =0.0, n=5.92, =19.29, =0.45″)
-
•
Classical bulge(?) [Sersíc] (PA=133.3, =0.18, n=0.66, =19.98, =1.97″)
-
•
B/P bulge [SersícGenEllipse] (PA=151.4, =0.26, n=0.96, =20.01, =8.58″)
-
•
Bar spurs [FlatBar] (PA=145.5, =0.92, =19.39, Rbrk=30.31″)
-
•
Disk [BrokenExponential] (PA=3.4, =0.33, =21.08, Rbrk=62.04″)