Rearrangement of Granular Surfaces on Asteroids due to Thermal Cycling
Abstract
In granular systems, thermal cycling causes compaction, creep, penetration of dense objects, and ratcheting of grains against each other. On asteroid surfaces, thermal cycling is high amplitude and can happen billions of times in a few million years. We use a 1-dimensional thermophysical conductivity model to estimate the relative displacement of grains in proximity to one another, caused by variations in thermal conductivity or shadows. We find that grains would experience relative displacements of order a few microns during each thermal cycle. If thermal cycling causes diffusive transport, then the asteroid’s few centimeters deep thermal skin depth could flow a few centimeters in a million years. Thermal cycling could cause long-distance flows on sloped surfaces, allowing fine materials to collect in depressions.
1 Introduction
Most asteroids rotate rapidly, with spin rotational periods of only a few hours (Pravec et al., 2008). Asteroids have little atmosphere to insulate their surfaces, hence asteroids experience sizable hundred Kelvin diurnal variations in surface temperature. Asteroid surfaces host heterogeneous granular systems (e.g., Walsh (2018); DellaGiustina et al. (2019); Sugita et al. (2019)), thus understanding the thermal response of granular systems is key to understanding the evolution of their surfaces.
Thermophysical modeling of optical and infrared light curves gives information about the composition and structure of asteroid surfaces through measurements of thermal inertia;
| (1) |
where is the thermal conductivity, is the mean density, and is the specific heat. Thermal inertia is a material’s ability to resist temperature change (Rozitis et al., 2020). Measured values of an asteroid’s thermal inertia can span a large range from about 10 to 1000 J m-2 s-1/2 K-1 (Delbo and Tanga, 2009; Rozitis and Green, 2011; Delbo et al., 2015; Harris and Drube, 2020). A surface comprised of a small-grained granular material is predicted to have lower thermal inertia than solid rock (e.g., Gundlach and Blum (2013)). Surfaces covered in fine regolith have extremely low measured thermal inertia values (Delbo and Tanga, 2009; Rozitis and Green, 2011; Gundlach and Blum, 2013; Murdoch et al., 2015; Harris and Drube, 2020). For example, asteroid (21) Lutetia has J m-2 s-1/2 K-1 (Keihm et al., 2012) which is attributed to a thick layer of fine regolith (Gundlach and Blum, 2013). Porosity can also affect thermal inertia. From imaging of the asteroid (162173) Ryugu, some apparently solid boulders also have low thermal inertia, implying that these boulders have low porosity (Grott et al., 2019).
The surfaces of asteroid (101955) Bennu and asteroid (162173) Ryugu exhibit a large scatter in their local thermal inertia values, values measured at different positions on the asteroid surface, ranging from about 200 to 400 J m-2 s-1/2 K-1 (Rozitis et al., 2020; Shimaki et al., 2020). The heterogeneity of the surface and this wide range in local thermal inertia values implies that materials with different thermal properties are often in proximity. When materials with different thermal expansion coefficients are in contact, thermal stress due to thermal cycling can cause cumulative damage when microscopic cracks widen and are extended. This phenomenon is known as ”thermal fatigue” (Delbo et al., 2014) and is a fragmentation and regolith generation mechanism. While previous studies have focused on fracturing within solids on the surfaces of asteroids, here we focus on the connection between thermal cycling and the potential for dynamics within the granular system. When a granular medium with grains of various sizes is subjected to vibrations grains will experience size segregation. Larger objects can rise to the top regardless of density (Rosato et al., 1987). This is called the Brazil Nut Effect and has been theorized as a mechanism for grain sorting on asteroid surfaces (Hestroffer et al., 2019) caused by vibrations from impacts and seismic activity (Asphaug et al., 2001). While thermal cycling has not been found to induce the Brazil Nut Effect, the expansion and contraction of grains due to thermal cycling might induce granular flow.
The effect of temperature variations on a granular medium has been examined and discussed in laboratory settings for industrial applications (Divoux, 2010; Chen et al., 2009; Blanc and Geminard, 2013; Percier et al., 2013). Thermal cycling in granular systems causes a variety of phenomena, including rearrangements of the force chain network (Clement et al., 1997; Wang and Bai, 2018), compaction (Chen et al., 2006; Vargas and McCarthy, 2007; Chen et al., 2009), creep (Divoux et al., 2008; Percier et al., 2013; Blanc and Geminard, 2013; Deshpande et al., 2021), fluctuations in transport properties (Liu and Nagel, 1992), and penetration of dense objects (Chen et al., 2009). Asteroid surfaces can experience a large day-night variation in temperature, , and while strains caused by a single thermal cycle are small, each thermal cycle occurs once per rotation period. As rotation periods are hours to days (Pravec et al., 2008; Harris et al., 2009), during the 10 million year lifetime of a near-earth asteroid (Gladman et al., 2000), a billion cycles could occur. Effects associated with thermal cycling could be significant if they accumulate over time.
In this manuscript, we explore how thermal cycling might affect the heterogeneous granular systems that exist on asteroid surfaces by using 1-dimensional thermophysical models. We explore the role of inhomogeneous thermal conductivity and shadows in affecting variations of temperature as a function of depth and the associated relative thermal expansion. Using this we estimate the relative motions of the material as it undergoes thermal cycling. Relative displacements from the thermophysical models are used to estimate how far grains could move with respect to one another. If grains are able to ratchet against one another or this relative motion is occurring on a slope, permanent relative motions would accumulate over the many thermal cycles that an asteroid experiences.
2 Relative Displacements due to Heterogeneous Thermal Properties
We adopt a 1-dimensional thermal conductivity model, following the procedure that is summarized in section 2.2 of Rozitis and Green (2011). The model integrates the heat diffusion equation vertically (in ) with an energy-balanced surface boundary condition that takes into account the absorption and radiation of solar energy. We apply a zero heat flux lower boundary condition. The resulting model gives temperature where is depth below the surface and specifies the phase of the rotation of the asteroid. Additional details of this model are described in A.
2.1 Fiducial model
We adopt a fiducial thermophysical model and then consider variations from it. The parameters for the fiducial model are listed in Table 1. The parameters used for the fiducial model follow the review of thermophysical properties given by Harris and Lagerros (2002) and Delbo et al. (2015). We used a typical value for specific heat intensity based on measurements of stony meteorites (Consolmagno et al., 2013). For density, we adopt a typical value of based on the compilation by Carry (2012) and recent asteroid thermophysical models (Hung et al., 2022). For the rotational period, we select hours, within the range measured from surveys of asteroid light curves (Pravec et al., 2008). For the bond albedo, we use , typical of asteroid thermophysical models (Hung et al., 2022). For thermal emissivity, we use . For the linear thermal expansion coefficient we adopt following measurements for common minerals by Hazen (1977). The fiducial model has a thermal skin depth of 5.2 cm where the thermal skin depth,
| (2) |
characterizes the depth of the surface layer that undergoes thermal cycling. The thermal diffusivity depends on the thermal conductivity, density, and specific heat;
| (3) |
Because the variations in mean density and specific heat are not expected to be large, the large range in measurements of thermal inertia on asteroid surfaces is interpreted to arise from variations in thermal conductivity that are associated with layers of fine dust (Delbo and Tanga, 2009; Harris and Drube, 2020; Hung et al., 2022) or variations in rock porosity (Grott et al., 2019; Rozitis et al., 2020).
Because we are not varying porosity in our model we often equate thermal inertia and thermal conductivity. Global maps of thermal inertia on asteroid Bennu (Rozitis et al., 2020) reveal that the surface is heterogeneous. The areas with the lowest thermal inertia ( 180 to 250 J m-2 K-1 s-1/2) on Bennu are populated by large, low-reflectance grains, whereas areas with higher thermal inertia ( 350 to 400 J m-2 K-1) have mixtures of low and high-reflectance grains. This suggests that grains with very different thermal conductivity can come into contact. The ratio of lowest to highest thermal inertia on Bennu is about 1.7, corresponding to a ratio of lowest to highest thermal conductivity of about 3. We use this amplitude of variations to estimate the relative displacements of materials with different conductivities.
Quantity Symbol Value Spin rotation period 6 hr Heliocentric distance 1 AU Bond albedo 0.1 Thermal emissivity 1 Density 2000 kg m-3 Specific heat 500 J kg-1 K-1 Thermal conductivity W m-1 K-1 Thermal diffusivity m2 s-1 Thermal inertia 100 K m-2 s K-1 Thermal skin depth 5.2 cm Linear thermal expansion coefficient K-1 Illumination function Equation 24 Shadow function 0
2.2 Sensitivity of the thermal model to variations in thermal conductivity
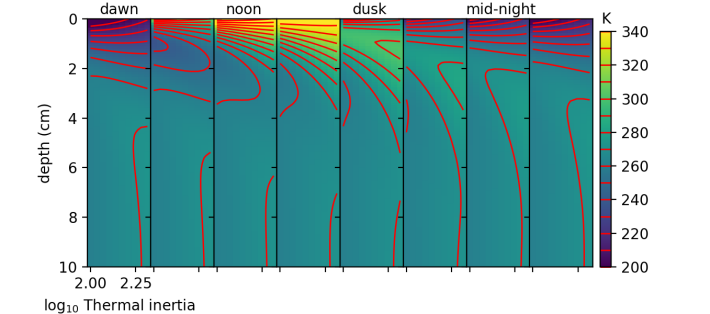
We vary the thermal conductivity from our thermophysical model to see how temperature as a function of depth and rotational phase is sensitive to conductivity. For each value of thermal conductivity we compute the temperature as a function of depth and rotation phase . This gives us a three-dimensional array . The resulting temperature as a function of depth for eight different orbital phases is shown in Figure 1 with physical parameters for the thermophysical model listed in Table 1 but with thermal conductivity ranging from to W m-1 K-1. We select a range for thermal conductivity that matches the range in thermal inertia measured on Bennu’s surface. In Figure 1, the x-axes show the log of thermal inertia, the y-axis shows depth, the colorbar shows temperature, and each panel shows a different rotation phase. For the model shown in Figure 1, the skin depth for the lowest thermal conductivity is about 5 cm and is twice as large as for the highest thermal conductivity. Each panel shows the temperature profile as a function of depth and thermal conductivity. Because the skin depth is a function of thermal conductivity, below the surface two substrates with different thermal conductivities would have different temperature profiles. At a depth of about 2 cm, the highest conductivity material is cooler at dawn and hotter past noon, than the lowest conductivity material. These temperature differences would cause variations in thermal expansion. The hotter material expands more than the cooler material and this can cause grains or pebbles in proximity to rub or slide against each other.
2.3 Height variations as a function of thermal conductivity
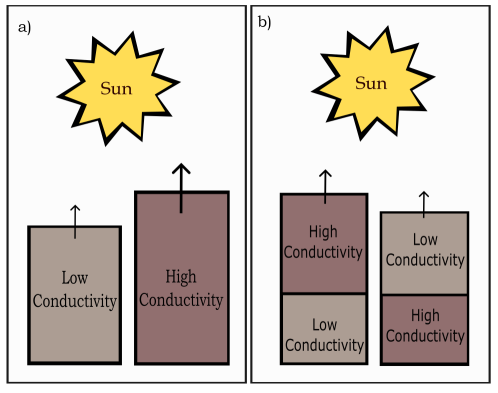
We use our thermophysical models of temperature as a function of depth to estimate variations in height caused by thermal expansion. Because temperature variations are small below the thermal skin depth, we assume that the base of each column of material is fixed. We use the differences in column height to characterize the size of the relative motions of grains in proximity that are caused by differences in thermal properties, such as thermal conductivity. This is illustrated in Figure 2, where two columns of material with different conductivity are next to one another and rub against each other due to variations in thermal expansion.
Vertical displacement in a column of material caused by thermal expansion is estimated by integrating displacement from the base where the temperature is nearly constant;
| (4) |
This is an estimate for the vertical displacement as a function of depth , at any particular rotational phase , and as a function of thermal conductivity .
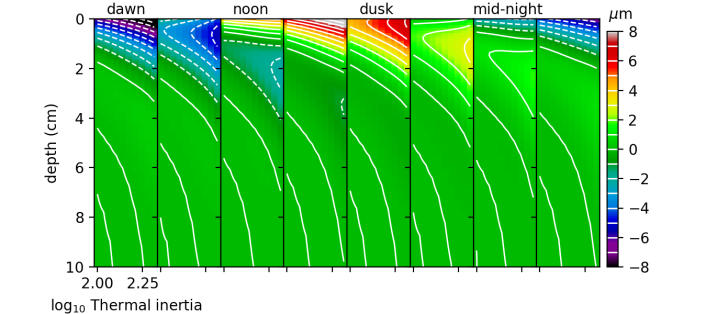
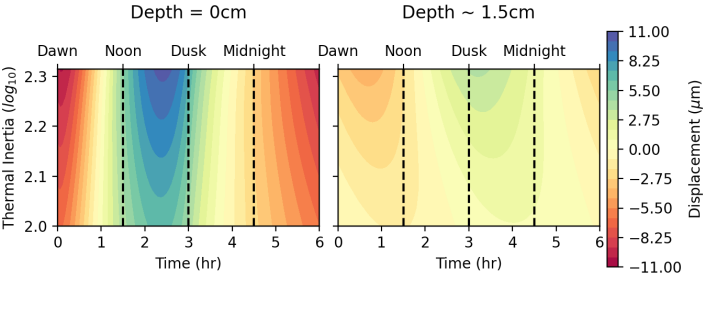
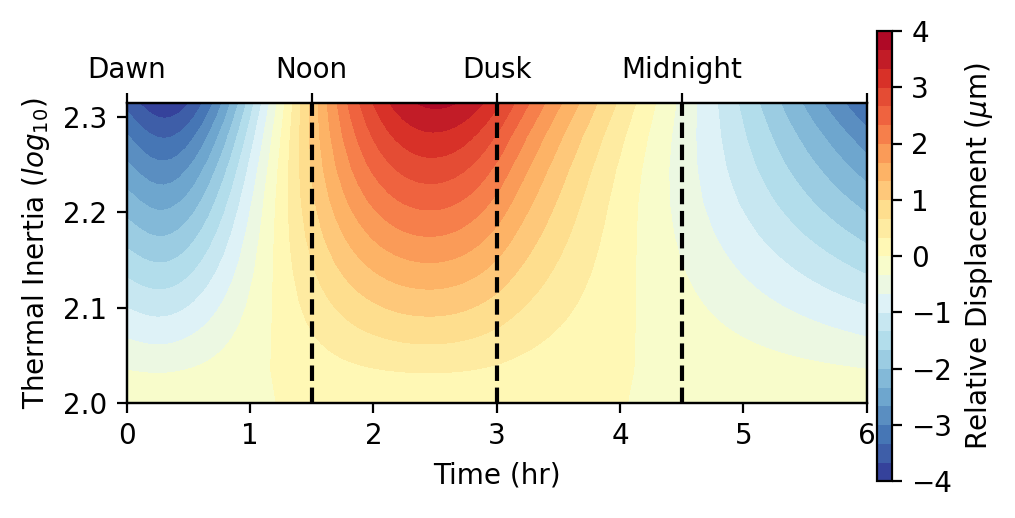
For a range of thermal conductivities and depths at eight different rotational phases, we show in Figure 3 the vertical displacement , computed from Equation 4 assuming an expansion coefficient of K-1. This figure is generated using the temperature profiles shown in Figure 1. In Figure 3, the x-axes are thermal inertia, the y-axis is depth and each panel shows a different orbital phase. In Figure 4 the x-axis is the orbital phase in hours (rather than at selected snapshots), the y-axis is thermal inertia, and each panel shows a different depth. In both Figures 3 and 4 the colorbar shows the displacement in microns. Figures 3 and 4 show that two columns of material with different thermal conductivity would have different functions (at a given rotational phase), thus would move up and down with respect to one another. At dawn, the material with the higher thermal conductivity would be lower near the surface than that with lower conductivity, but the opposite trend is seen before dusk. The two columns would flex periodically with respect to one another.
We characterize the extent that particles move with respect to one another with a relative displacement function that depends on their relative conductivity . In Figure 5 we plot the relative displacement at the surface as a function of thermal inertia where we use the fiducial model as the reference point.
Based on the scale given in the colorbars in Figure 3, 4, and 5 we find that the size of the relative displacement per cycle is of order a few microns for the maximized variations in local thermal conductivity that are expected for a heterogeneous surface such as asteroid Bennu.
2.4 Displacements from a different conductivity surface layer
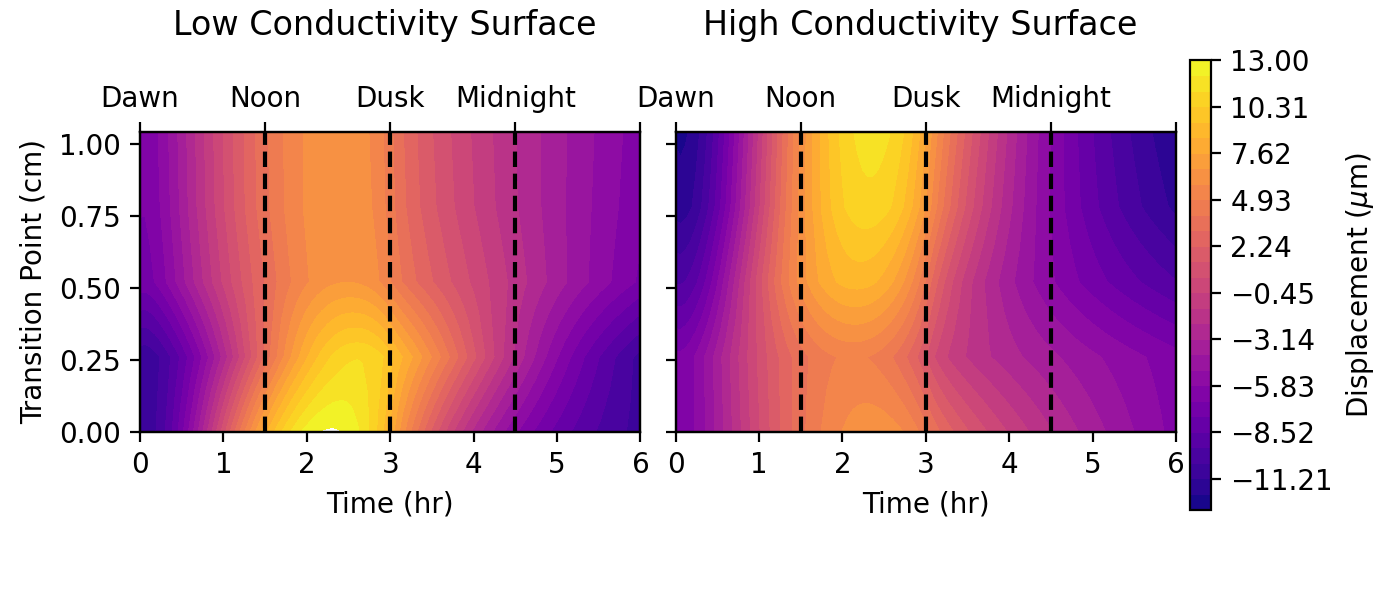
In the previous section, we discussed the simple case where each vertical column consists of a single material but columns in proximity to one another can differ in their thermal properties giving relative motions. This case is shown in Figure 2 a) (on the left). We now consider the case where conductivity can vary as a function of depth, as shown in Figure 2 b) (on the right). In this case, at a particular depth, there is a transition to a different conductivity material. Figure 6 shows the effect this has on the displacement at the surface and how this is affected by the depth where the transition between conductivities occurs. The left panel in Figure 6 has a low conductivity surface, while the right panel has a high conductivity surface. The low conductivity material has thermal conductivity W m-1 K-1, consistent with our fiducial model as shown in Table 1. The high conductivity material has thermal conductivity W m-1 K-1, corresponding to the maximum thermal conductivity used in Figures 1, 3, and 4 and is otherwise consistent with our fiducial model. Two columns with differences in the thermal conductivity of their layers would also have different functions (at a given rotational phase) and would move up and down with respect to one another, similar to what is seen with columns without layered materials.
2.5 Displacements caused by shadows
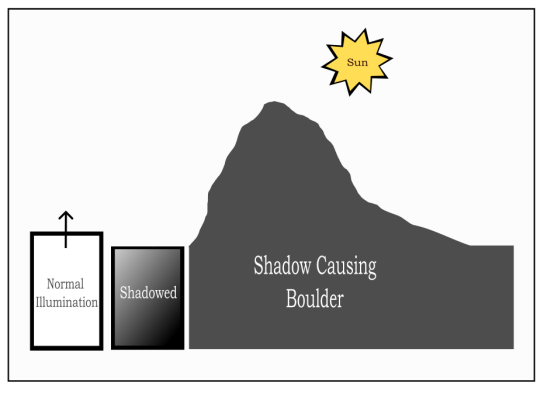
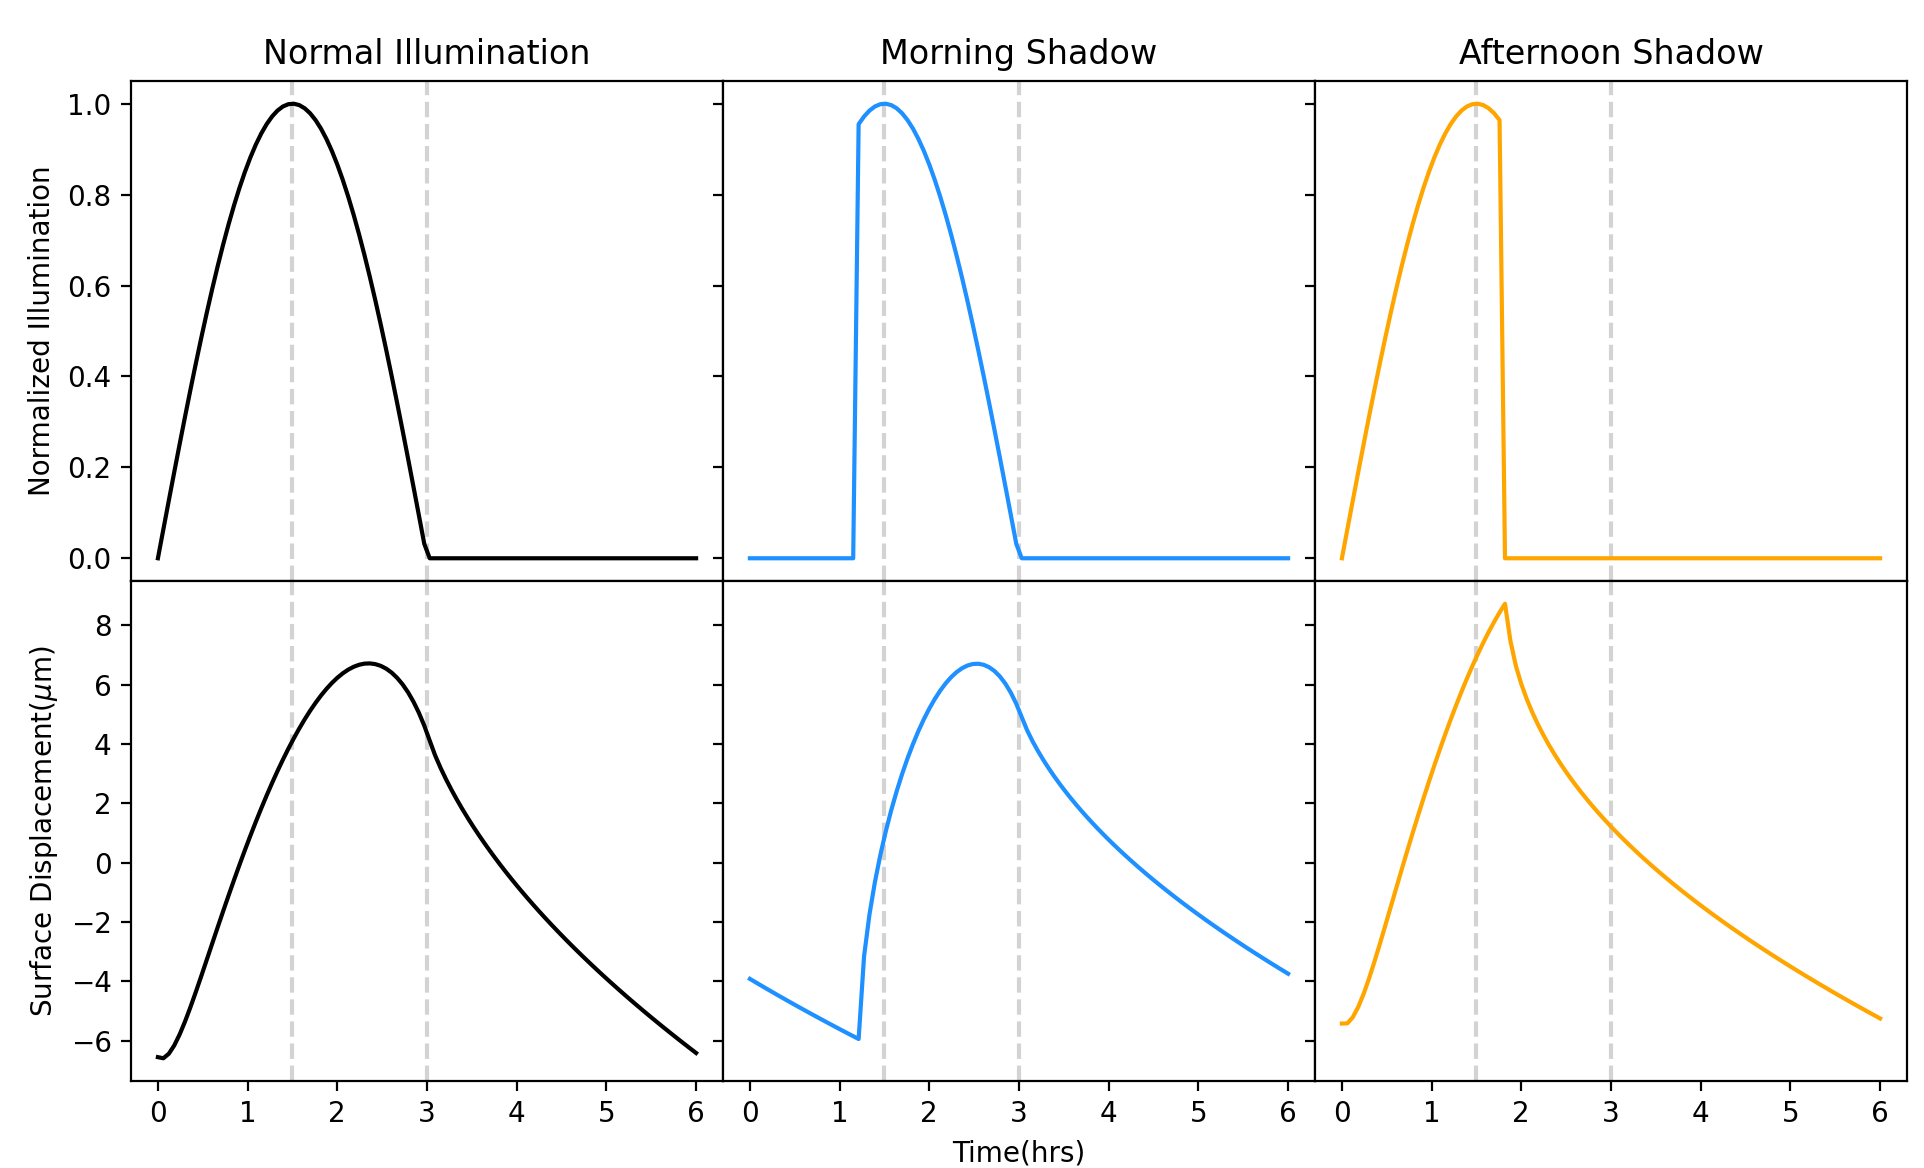
In addition to depending on thermal conductivity, the thermal expansion and contraction of a substrate also depend on illumination, as we see throughout the rotational period. Figure 7 shows how shadows can cause a difference in illumination between nearby regions. Because of the heterogeneity of grain size, larger rocks and boulders could cast shadows on granular media. To simulate shadows, we create more complicated illumination functions than the sinusoidal one used for the fiducial model, given in equation 24. We can shift the shadow throughout the daylight hours to show how shadows at different points in the day affect both temperature and integrated vertical displacement. The illumination function is either zero or 1 but we can vary the time of transition. The top panels of Figure 8 show the difference between the normal illumination function used in the fiducial model and the illumination functions from morning and afternoon shadows. The bottom panels show the resulting displacement for each case. A shadow present in the morning would delay the heating of the surface, while a shadow present in the afternoon hastens nighttime cooling. Two columns that receive different amounts of illumination throughout their 6-hour period would have different functions (at a given rotational phase) and would move up and down with respect to one another. The size of the relative displacement caused by shadows is similar to what is seen when we varied the conductivity in Figure 4.
3 Discussion
3.1 Diffusive behavior caused by thermal cycling
Molecular dynamics simulations of thermal cycling in granular systems have suggested that particle motions are diffusive (Percier et al., 2013). Assuming that diffusive behavior caused by thermal cycling takes place on asteroids, we estimate the maximum distance that a particle can travel in a given amount of time.
Because the magnitude of the temperature change in each thermal cycle depends on the distance to the Sun, we expect (using equation 27). Since our surface displacement depends on the change in temperature that causes the thermal expansion, this gives surface displacement due to thermal expansion . As mentioned previously, the skin depth characterizes the depth of material that undergoes temperature variations due to thermal cycling. Consequently, we expect the height variation . If the relative displacement between two grains is caused by variations in thermal conductivity, then we expect where characterizes the differences in thermal conductivity. Putting together these factors, we expect
| (5) |
where the value is approximately taken from Figure 3 at (the surface) for the largest difference in displacement (at dawn or dusk) between the lowest and highest conductivity materials.
Suppose the relative displacement characterizes the size of motions in a random walk, as suggested by the 2D molecular dynamics simulations of thermal cycling in granular systems by Percier et al. (2013). Following Percier et al. (2013), we model ratcheting with a diffusion coefficient that depends on the size of the relative displacement and the cycling period
| (6) |
Assuming the thermal cycling gives rise to a diffusive behavior, the distance that a grain travels during a time is
| (7) |
giving
| (8) |
In the most optimal conditions, in a million years, diffusive behavior could give transport for particles in the skin depth layer significantly further than the skin depth itself.
Continuing to follow Percier et al. (2013), diffusive behavior depends on the variation in grain size due to thermal cycling which is approximately . Percier et al. (2013) compare this quantity to the ratio of the gravitational force on a grain to the product of elastic and frictional forces. Because the gravitational acceleration is low on an asteroid, the cycling amplitude (in terms of temperature) vastly exceeds the ratio of weight to an elastic or friction force throughout the thermal skin depth where is a grain mass and the gravitational acceleration. We can compare to the ratio of hydrostatic pressure at the depth of the thermal skin depth and the elastic modulus of the medium;
| (9) |
This ratio is really small, implying that thermal cycling would likely give stresses that allow motion throughout the thermal skin depth. If the diffusive behavior seen in the simulations by Percier et al. (2013) applies to an asteroid, we would expect the entire skin depth to flow due to thermal cycling, rather than exhibit stick-slip behavior. These estimates suggest that in the right conditions, pebbles can migrate diffusively a distance of order a few centimeters over a million years due to the expansion and contraction that takes place during thermal cycling.
This expression should also include a factor that is dependent on the difference in thermal inertia or thermal conductivity of nearby rocks. Here we put as the ratio of high to low thermal conductivity among the different rocks. Note that in equation 6 the spin period cancels out due to the dependence of on giving a diffusion coefficient that is independent of the spin period. This implies that creep due to thermal cycling would not preferentially occur on fast rotators.
3.2 Ratcheting
By applying vertical stress cycles in a 2-dimensional simulation of polygons, Alonso-Marroquin and Herrmann (2004) show that stress cycling in a granular system can cause a ratcheting effect. The micromechanical origin of this effect is due to fluctuations in the complex network of contacts. Even small variations in stress can allow tangential contacts to reach a sliding condition giving irreversible motions. Because of the load-unload asymmetry of the contact forces, a net accumulation of plastic deformation can be observed in each cycle. This leads to a constant increase in plastic strain.
Another possibility is that ratcheting of grains not only gives diffusive behavior but allows downhill creep (e.g., Deshpande et al. (2021)). If the distance moved by a grain via ratcheting is linearly dependent on time, then the maximum distance a grain could travel would be as large as,
| (10) |
This linear dependence on time contrasts with that estimated diffusively in equation 7 where no direction is preferred. If transport occurs preferentially in a particular direction, then it is possible for particles in the right conditions to travel large distances across the surface. In contrast, diffusive behavior would arise because of stochastic rearrangements in the force and contact networks rather than ratcheting in a preferred direction.
Over long periods of time, material within the thermal skin depth would creep or flow downhill. The surface of asteroids contains regions with downhill slopes. Creep associated with thermal cycling gives another possible mechanism that could account for the formation of terraces on Bennu (Barnouin et al., 2022) that are held up by larger boulders or collections of fine-grain materials in depressions.
3.3 Compaction
Experiments and simulations show that thermal cycling leads to compaction with packing fraction increasing by a few percent over tens of cycles (Chen et al., 2006, 2009; Vargas and McCarthy, 2007). Past a characteristic number of cycles, the packing fraction continues to increase but more slowly, and logarithmically, as typical of a relaxation mechanism (Chen et al., 2006, 2009; Vargas and McCarthy, 2007; Divoux et al., 2008; Divoux, 2010; Blanc and Geminard, 2013). Experiments have been carried out for a few thousand cycles, suggesting that the packing fraction would continue to slowly increase with even higher numbers of cycles (Divoux et al., 2008; Divoux, 2010; Blanc and Geminard, 2013).
Chen et al. (2006) and Chen et al. (2009) carried out thermal cycling experiments on spherical glass grains in cylindrical glass containers. The initial packing fraction for both experiments was approximately 58.9. A full thermal cycle was roughly 20 hours with temperature differences of roughly 100 K and 40 K. Dozens of thermal cycles were performed and both cycling temperatures behaved logarithmically, but the packing fraction for the 100 K cycling temperature initially increased more rapidly but fell off sooner. A similar simulated result was found by Vargas and McCarthy (2007) for similar cycling temperatures and experimentally by Blanc Blanc and Geminard (2013) and Divoux et al. (2008) for small cycling temperatures. In Chen et al. (2006) and Chen et al. (2009) the packing fraction verse cycles was fit to a double relaxation function, . Extrapolating out to 100 cycles the packing fraction had increased by 5 and subsequent cycles increased the packing fraction by less than a percent. For smaller cycling temperatures more cycles impacted the packing fraction but resulted in the same amount of compaction after enough time. Because the large cycling temperatures on asteroids are large if sediment was loosely packed enough for compaction to occur, it would happen very rapidly compared to the lifetime of asteroids. Compaction is also aided by gravity, so on asteroid’s surfaces the change in packing fraction might not be as significant.
3.4 Penetration
With the Brazil Nut Effect, vibrations allow size segregation, moving larger grains to the surface above smaller grains. Chen et al. (2009) studied the displacement from thermal cycling of an ”intruder” grain introduced into a container of uniform grains. The uniform grains were made of polystyrene while the intruders were made of brass and Teflon with varying diameters. Chen et al. (2009) found that unlike with the Brazil Nut Effect, these intruders sank further below the surface. The higher the cycling temperature, the deeper the intruding object would sink. They also found that the depth penetrated depended both on the intruder’s size and density. Intruders with lower density and smaller diameters than the surrounding grains were not able to penetrate as deeply. This does not match what is expected from the Brazil Nut Effect where larger grains rise, smaller grains sink, and there is little or no dependence on grain density (Rosato et al., 1987).
Blanc and Geminard (2013) conducted a similar experiment to Chen et al. (2009) but using containers with mixed grain diameters and did not track individual grains. Both studies, as mentioned in the previous section, found that all of the grains compactified. This suggests that the penetration of certain grains and the potential size segregation is part of the processes of compaction of the granular media. Regardless, if denser grains tend to sink, this could lead to more porous grains at the surface, possibly explaining unexpectedly low thermal inertia values (Rozitis et al., 2020), especially at the equator where there would be the highest day-night variation in temperature.
3.5 Caveats
It is important to note that we used a 1-dimensional thermal conductivity model to estimate the size of relative displacements, so we neglected the role of thermal conductivity in 2 dimensions. Anywhere there is contact between adjacent rocks, heat would travel between them. Heat could also be transferred via radiation between them (Persson and Biele, 2022). However, because the heat source is at the surface the primary heat flow would be perpendicular to the surface in the z-direction. We also neglect the dependence of thermal conductivity on temperature in our model (e.g., Vasavada et al. (2012)). These effects are unlikely to affect the estimate of the relative displacement size to order of magnitude but could be investigated in future work.
There are additional processes that reshape the surface of asteroids. Mass flows associated with spinup due to the YORP effect, tidal perturbations from planetary encounters, thermal fracturing, and impacts can also displace surface materials (DeMeo et al., 2023). Future work can compare the role of transport associated with thermal cycling to these other processes.
As mentioned previously, laboratory experiments of thermal cycling in granular materials have been conducted for industrial applications (Divoux, 2010; Chen et al., 2009; Blanc and Geminard, 2013). The conditions for these studies are not similar to conditions on asteroid surfaces. In these experiments, they attempt to heat the grains evenly (Divoux, 2010; Chen et al., 2009; Blanc and Geminard, 2013). However, on asteroid surfaces, the grains are not heated as evenly, because heat propagates from the surface due to illumination. This causes differences in the expansion of the grain with depth. Most experiments and simulations have only been carried out for at most 1000 cycles (Divoux, 2010; Chen et al., 2009; Blanc and Geminard, 2013) and it is difficult to extrapolate to millions of thermal cycles. In many of these experiments, the grains are smooth spheres (Divoux, 2010; Chen et al., 2009; Blanc and Geminard, 2013). The grains on asteroids are varied and have more jagged shapes than spheres or disks. They also have more varied grain sizes than those used in these experiments. This might explain why grains ratcheting upward were not seen in the experiments by Chen et al. (2009).
Asteroid surfaces are low-g and airless environments. While experiments of thermal cycling granular media have not been conducted in microgravity conditions, parabolic flights have shown that gravity has an effect on granular flow. Murdoch et al. (2013) found that while the primary flow in their system was unaffected by gravity, a secondary convective flow was nonexistent in the absence of the Earth’s strong gravity. Because Chen et al. (2009) found penetration and size segregation of grains depends on density, reduced gravity could affect this effect as well. Further simulations and experiments could help us to understand the effect that the microgravity and airless environment of asteroid surfaces would have on thermal cycling granular material.
4 Conclusions
In this manuscript, we have explored the relative motions of grains on an asteroid’s surface due to thermal cycling. Recent observations show that material on asteroid surfaces has a wide range of thermophysical properties. Based on the variations in thermal inertia seen on Ryugu and Bennu, pebbles in proximity to one another could have thermal conductivities that differ by a factor of 5. This implies that grains in proximity experience different levels of temperature extremes which would give relative motions between them. With a 1-dimensional thermophysical model, we estimate the relative difference in surface height between two columns of materials with different conductivity. We find that the relative height varies by about a few microns during an asteroid’s spin rotation period. We also looked at layers of materials with different conductivity and the effect of grains receiving differences in illumination during the day due to shadows. These variations produced a similar size relative displacement.
If grains are in contact, the variations in relative displacement would cause them to them ratchet against each other. Even though this relative displacement of a few microns is small, the large number of thermal cycles (millions to billions) taking place on an asteroid might make this process important within the thermal skin depth, which is the top few centimeters of a rubble surface. If the ratcheting behavior is diffusive, we find that pebbles in the right conditions can move up to a few centimeters in a million years. This implies that the skin depth of an asteroid with a granular surface could evolve slowly due to relative motions induced by thermal cycling. Thermal cycling experiments also tend to show creep in the downhill direction (e.g., Deshpande et al. (2021)), which could allow surface particles to travel even further than a few centimeters.
Laboratory experiments in granular media find that thermal cycling can cause compaction (Divoux, 2010), larger and more dense grains to sink (Chen et al., 2009), and downhill creep (Deshpande et al., 2021). These effects are enhanced by gravity and might be diminished on asteroid surfaces because of their lower gravity. However, we estimate that the ratio between stress due to thermal cycling and hydrostatic pressure is higher on an asteroid than on the Earth. This suggests that diffusive transport due to thermal cycling could be more effective in low g environments than on the Earth.
If cumulative, over the lifetime of an asteroid, transport associated with thermal cycling could have an impact on an asteroid’s surface. Future work could determine whether this process is important compared to other resurfacing processes, such as spinup from the YORP effect, tidal perturbations during planetary encounters, thermal fracturing, and impacts (DeMeo et al., 2023). Current experiments and simulations (e.g., Alonso-Marroquin and Herrmann (2004); Chen et al. (2009); Blanc and Geminard (2013); Divoux (2010)) give us an idea of how a thermal cycled granular medium would behave on an asteroid surface. However, more work is needed to determine the effect of microgravity and airless environments on thermal cycling induced granular flow.
5 Acknowledgements
This material is based upon work supported in part by Craig McMurtry and by the University of Arizona through the Near-Earth Object Surveyor Mission, Phase B under NASA Grant 80MSFC20C0045, by Cornell University through New York Space Grant 80NSSC20M0096 and to A. C. Quillen through NASA grant 80NSSC21K0143.
References
- Alonso-Marroquin and Herrmann (2004) Alonso-Marroquin, F., Herrmann, H. J., 2004. Ratcheting of granular materials. Phys. Rev. Lett. 92, 054301.
- Asphaug et al. (2001) Asphaug, E., King, P. J., Swift, M. R., Merrifield, M. R., Mar. 2001. Brazil Nuts on Eros: Size-Sorting of Asteroid Regolith. In: Lunar and Planetary Science Conference. Lunar and Planetary Science Conference. p. 1708.
- Barnouin et al. (2022) Barnouin, O., Daly, M., Seabrook, J., Zhang, Y., Thuillet, F., Michel, P., Roberts, J., Daly, R., Perry, M., Susorney, H., Jawin, E., Ballouz, R., Walsh, K., Sevalia, M., Asad, M., Johnson, C., Bierhaus, E., Gaskell, R., Palmer, E., Lauretta, D., 04 2022. The formation of terraces on asteroid (101955) bennu. Journal of Geophysical Research: Planets 127.
- Blanc and Geminard (2013) Blanc, B., Geminard, J.-C., 2013. Intrinsic creep of a granular column subjected to temperature changes. Physical Review E vol. 88 (2), 022201.
- Carry (2012) Carry, B., 2012. Density of asteroids. Planetary and Space Science 73 (1), 98–118.
- Chen et al. (2006) Chen, K., Cole, J., Conger, C., Draskovic, J., Lohr, M., Klein, K., Scheidemantel, T., Schiffer, P., 2006. Packing grains by thermal cycling. Nature 442, 257.
- Chen et al. (2009) Chen, K., Harris, A., Draskovic, J., Schiffer, P., 2009. Granular fragility under thermal cycles. Granular Matter 11, 237–242.
- Clement et al. (1997) Clement, E., Serero, Y., Rajchenbach, J., Duran, J., 1997. Fluctuating aspects of the pressure in a granular column. In: Behringer, R. P., Jenkins, J. T. (Eds.), Proceedings of the IIIrd International Conference on Powders & Grains (1997; Durham, N.C.). Vol. Powders and Grains 97 of Powders and Grains 97. CRC Press, (Boca Raton, Florida), pp. 18–23.
- Consolmagno et al. (2013) Consolmagno, G. J., Schaefer, M. W., Schaefer, B. E., Britt, D. T., Macke, R. J., Nolan, M. C., Howell, E. S., 2013. The measurement of meteorite heat capacity at low temperatures using liquid nitrogen vaporization. Planetary and Space Science 87 (146-156).
- Delbo et al. (2014) Delbo, M., Libourel, G., Wilkerson, J., Murdoch, N., Michel, P., Ramesh, K. T., Ganino, C., Verati, C., Marchi, S., 2014. Thermal fatigue as the origin of regolith on small asteroids. Nature 508 (7495), 233–236.
- Delbo et al. (2015) Delbo, M., Mueller, M., Emery, J. P., Rozitis, B., Capria, M. T., 2015. Asteroid thermophysical modeling. In: Michel, P., DeMeo, F. E., Botke, W. F. (Eds.), Asteroids IV. University of Arizona Press. Tucson, AZ, pp. 107–128.
- Delbo and Tanga (2009) Delbo, M., Tanga, P., 2009. Thermal inertia of main belt asteroids smaller than 100 km from iras data. Planetary and Space Science 57 (2), 259–265.
- DellaGiustina et al. (2019) DellaGiustina, D., Emery, J., Golish, D., Rozitis, B., Bennett, C., Burke, K., Ballouz, R., Becker, K., Christensen, P., Drouet d’Aubigny, C., Hamilton, V., Reuter, D., Rizk, B., Simon, A., Asphaug, E., Bandfield, J., Barnouin, O., Barucci, M., Bierhaus, E., Bernacki, M., 04 2019. Properties of rubble-pile asteroid (101955) bennu from osiris-rex imaging and thermal analysis. Nature Astronomy 3, 1.
- DeMeo et al. (2023) DeMeo, F. E., Marsset, M., Polishook, D., Burt, B. J., Binzel, R. P., Hasegawa, S., Granvik, M., Moskovitz, N. A., Earle, A., Bus, S. J., Thomas, C. A., Rivkin, A. S., Slivan, S. M., 2023. Isolating the mechanisms for asteroid surface refreshing. Icarus 389, 115264.
- Deshpande et al. (2021) Deshpande, N. S., Furbish, D. J., Arratia, P. E., Jerolmack, D. J., 2021. The perpetual fragility of creeping hillslopes. Nature Communications 12, 3909.
- Divoux (2010) Divoux, T., 2010. Invited review: Effect of temperature on a granular pile. Papers in Physics 2, 020006.
- Divoux et al. (2008) Divoux, T., Gayvallet, H., Géminard, J.-C., 2008. Creep motion of a granular pile induced by thermal cycling. Physical review letters 101 14, 148303.
- Gladman et al. (2000) Gladman, B., Michel, P., Froeschlé, C., 07 2000. The near-earth object population. Icarus 146, 176–189.
- Grott et al. (2019) Grott, M., Knollenberg, J., Hamm, M., Ogawa, K., Jaumann, R., Otto, K. A., Delbo, M., Michel, P., Biele, J., Neumann, W., Knapmeyer, M., Kührt, E., Senshu, H., Okada, T., Helbert, J., Maturilli, A., Müller, N., Hagermann, A., Sakatani, N., Tanaka, S., Arai, T., Mottola, S., Tachibana, S., Pelivan, I., Drube, L., Vincent, J.-B., Yano, H., Pilorget, C., Matz, K. D., Schmitz, N., Koncz, A., Schröder, S. E., Trauthan, F., Schlotterer, M., Krause, C., Ho, T.-M., Moussi-Soffys, A., 2019. Low thermal conductivity boulder with high porosity identified on C-type asteroid (162173) ryugu. Nature Astronomy 3 (11), 971–976.
- Gundlach and Blum (2013) Gundlach, B., Blum, J., Mar. 2013. A new method to determine the grain size of planetary regolith. Icarus 223 (1), 479–492.
- Harris et al. (2009) Harris, A., Fahnestock, E., Pravec, P., 02 2009. On the shapes and spins of “rubble pile” asteroids. Icarus 199, 310–318.
- Harris and Drube (2020) Harris, A. W., Drube, L., 2020. Asteroid thermal inertia estimates from remote infrared observations: The effects of surface roughness and rotation rate. The Astrophysical Journal 901, 140.
- Harris and Lagerros (2002) Harris, A. W., Lagerros, J. S. V., 2002. Asteroids in the thermal infrared. In: Bottke, W. F., Cellino, A., Paolicchi, P., Binzel, R. P. (Eds.), Asteroids III. Space Science Series. University of Arizona Press. Tucson, AZ, pp. 205–218.
- Hazen (1977) Hazen, R. M., 1977. Temperature, pressure and composition: structurally analogous variables. Phys. Chem. Miner. 1, 83–94.
- Hestroffer et al. (2019) Hestroffer, D., Sánchez, D., Staron, L., Bagatin, A., Eggl, S., Losert, W., Murdoch, N., Opsomer, E., Radjai, F., Richardson, D., Salazar, M., Scheeres, D., Schwartz, S., Taberlet, N., Yano, H., 06 2019. Small solar system bodies as granular media. The Astronomy and Astrophysics Review 27.
- Hung et al. (2022) Hung, D., Hanus, J., Masiero, J. R., Tholen, D. J., 2022. Thermal properties of 1847 wise-observed asteroids. The Planetary Science Journal 3 (3), 56.
- Keihm et al. (2012) Keihm, S., Tosi, F., Kamp, L., Capaccioni, F., Gulkis, S., Grassi, D., Hofstadter, M., Filacchione, G., Lee, S., Giuppi, S., Janssen, M., Capria, M., 09 2012. Interpretation of combined infrared, submillimeter, and millimeter thermal flux data obtained during the rosetta fly-by of asteroid (21) lutetia. Icarus 221, 395–404.
- Liu and Nagel (1992) Liu, C., Nagel, S., 1992. Sound in sand. Physics Review Letters 68, 2301.
- Murdoch et al. (2013) Murdoch, N., Rozitis, B., Nordstrom, K., Green, S. F., Michel, P., de Lophem, T.-L., Losert, W., 2013. Granular convection in microgravity. Phys. Rev. Lett. 110, 018307.
- Murdoch et al. (2015) Murdoch, N., Sánchez, P., Schwartz, S. R., Miyamoto, H., 2015. Asteroid Surface Geophysics. In: Asteroids IV. University of Arizona Press, pp. 767–792.
- Percier et al. (2013) Percier, B., Divoux, T., Taberlet, N., 2013. Insights on the local dynamics induced by thermal cycling in granular matter. Europhysics Letters 104 (2), 24001.
- Persson and Biele (2022) Persson, B. N. J., Biele, J., 10 2022. Heat transfer in granular media with weakly interacting particles. AIP Advances 12 (10).
- Pravec et al. (2008) Pravec, P., Harris, A. W., Vokrouhlický, D., Warner, B. D., Kušnirák, P., Hornoch, K., Pray, D. P., Higgins, D., Oey, J., Galád, A., Gajdoš, Š., Kornoš, L., Világi, J., Husárik, M., Krugly, Y. N., Shevchenko, V., Chiorny, V., Gaftonyuk, N., Cooney, W. R., Gross, J., Terrell, D., Stephens, R. D., Dyvig, R., Reddy, V., Ries, J. G., Colas, F., Lecacheux, J., Durkee, R., Masi, G., Koff, R. A., Goncalves, R., Oct. 2008. Spin rate distribution of small asteroids. Icarus 197 (2), 497–504.
- Rosato et al. (1987) Rosato, A., Strandburg, K. J., Swendsen, R. H., 1987. Why the brazil nuts are on top: Size segregation of particulate matter by shaking. Phys. Rev. Lett. 58, 1038.
- Rozitis and Green (2011) Rozitis, B., Green, S. F., 2011. Directional characteristics of thermal–infrared beaming from atmosphereless planetary surfaces – a new thermophysical model. Monthly Notices of the Royal Astronomical Society 415, 2042–2062.
- Rozitis et al. (2020) Rozitis, B., Ryan, A. J., Emery, J. P., Christensen, P. R., Hamilton, V. E., Simon, A. A., Reuter, D. C., Asad, M. A., Ballouz, R.-L., Bandfield, J. L., Barnouin, O. S., Bennett, C. A., Bernacki, M., Burke, K. N., Cambioni, S., Clark, B. E., Daly, M. G., Delbo, M., DellaGiustina, D. N., Elder, C. M., Hanna, R. D., Haberle, C. W., Howell, E. S., Golish, D. R., Jawin, E. R., Kaplan, H. H., Lim, L. F., Molaro, J. L., Munoz, D. P., Nolan, M. C., Rizk, B., Siegler, M. A., Susorney, H. C. M., Walsh, K. J., Lauretta, D. S., 2020. Asteroid (101955) Bennu’s weak boulders and thermally anomalous equator. Scientific Advances 6, eabc3699.
- Shimaki et al. (2020) Shimaki, Y., Senshu, H., Sakatani, N., Okada, T., Fukuhara, T., Tanaka, S., Taguchi, M., Arai, T., Demura, H., Ogawa, Y., Suko, K., Sekiguchi, T., Kouyama, T., Hasegawa, S., Takita, J., Matsunaga, T., Imamura, T., Wada, T., Kitazato, K., Hirata, N., Hirata, N., Noguchi, R., Sugita, S., Kikuchi, S., Yamaguchi, T., Ogawa, N., Ono, G., Mimasu, Y., Yoshikawa, K., Takahashi, T., Takei, Y., Fujii, A., Takeuchi, H., Yamamoto, Y., Yamada, M., Shirai, K., ichi Iijima, Y., Ogawa, K., Nakazawa, S., Terui, F., Saiki, T., Yoshikawa, M., Tsuda, Y., ichiro Watanabe, S., 2020. Thermophysical properties of the surface of asteroid 162173 ryugu: Infrared observations and thermal inertia mapping. Icarus 348, 113835.
- Sugita et al. (2019) Sugita, S., Honda, R., Morota, T., Kameda, S., Sawada, H., Tatsumi, E., Yamada, M., Honda, C., Yokota, Y., Kouyama, T., Sakatani, N., Ogawa, K., Suzuki, H., Okada, T., Namiki, N., Tanaka, S., Iijima, Y., Yoshioka, K., Hayakawa, M., Cho, Y., Matsuoka, M., Hirata, N., Hirata, N., Miyamoto, H., Domingue, D., Hirabayashi, M., Nakamura, T., Hiroi, T., Michikami, T., Michel, P., Ballouz, R., Barnouin, O., Ernst, C., Schröder, S., Kikuchi, H., Hemmi, R., Komatsu, G., Fukuhara, T., Taguchi, M., Arai, T., Senshu, H., Demura, H., Ogawa, Y., Shimaki, Y., Sekiguchi, T., Müller, T., Hagermann, A., Mizuno, T., Noda, H., Matsumoto, K., Yamada, R., Ishihara, Y., Ikeda, H., Araki, H., Yamamoto, K., Abe, S., Yoshida, F., Higuchi, A., Sasaki, S., Oshigami, S., Tsuruta, S., Asari, K., Tazawa, S., Shizugami, M., Kimura, J., Otsubo, T., Yabuta, H., Hasegawa, S., Ishiguro, M., Tachibana, S., Palmer, E., Gaskell, R., Le Corre, L., Jaumann, R., Otto, K., Schmitz, N., Abell, P., Barucci, M., Zolensky, M., Vilas, F., Thuillet, F., Sugimoto, C., Takaki, N., Suzuki, Y., Kamiyoshihara, H., Okada, M., Nagata, K., Fujimoto, M., Yoshikawa, M., Yamamoto, Y., Shirai, K., Noguchi, R., Ogawa, N., Terui, F., Kikuchi, S., Yamaguchi, T., Oki, Y., Takao, Y., Takeuchi, H., Ono, G., Mimasu, Y., Yoshikawa, K., Takahashi, T., Takei, Y., Fujii, A., Hirose, C., Nakazawa, S., Hosoda, S., Mori, O., Shimada, T., Soldini, S., Iwata, T., Abe, M., Yano, H., Tsukizaki, R., Ozaki, M., Nishiyama, K., Saiki, T., Watanabe, S., Tsuda, Y., 2019. The geomorphology, color, and thermal properties of ryugu: Implications for parent-body processes. Science 364 (6437).
- Vargas and McCarthy (2007) Vargas, W. L., McCarthy, J. J., 2007. Thermal expansion effects and heat conduction in granular material. Phys Rev E 76, 041301.
- Vasavada et al. (2012) Vasavada, A. R., Bandfield, J. L., Greenhagen, B. T., Hayne, P. O., Siegler, M. A., Williams, J.-P., Paige, D. A., 2012. Lunar equatorial surface temperatures and regolith properties from the diviner lunar radiometer experiment. Journal of Geophysical Research, 117, E00H18.
- Walsh (2018) Walsh, K. J., Sep. 2018. Rubble Pile Asteroids. Annual Review of Astronomy and Astrophysics 56, 593–624.
- Wang and Bai (2018) Wang, X.-L., Bai, D.-Y., 2018. Thermal expansion and thermal fluctuation effects in a binary granular mixture. International Journal of Heat and Mass Transfer 116, 84–92.
Appendix A 1-D Thermophysical Model
We follow the 1-dimensional thermal conductivity model and the procedure for computing it that is summarized in section 2.2 by Rozitis and Green (2011). The temperature is a function of depth and time where is the depth below the surface. The surface lies at . Conservation of energy on the surface gives the surface boundary condition:
| (11) |
Here is the emissivity, is the Stefan-Boltzmann constant, is the Bond albedo, indicates how the surface is shadowed at time , and is the thermal conductivity. The shadow function is if the surface is in shadow, and is 0 otherwise. The energy flux is the integrated (over wavelength) solar flux at the distance of the object from the Sun, with solar constant W m-2 and equal to the heliocentric distance of the body in AU. The fluxes and are the total scattered and thermal radiated fluxes incident on the surface region. The albedo of the surface at infrared wavelengths is . The function returns the cosine of the Sun’s illumination angle at a time , which depends on the facet and rotation pole orientations, and it changes periodically as the planetary body rotates. For our model we set , , and .
Below the surface, heat conduction is described in 1-dimension. In the absence of internal heat sources, the heat equation is;
| (12) |
where is density, is specific heat and is the thermal diffusivity. We discretize the temperature in space and time. At each grid position and time, the temperature is , with index specifying the spatial position and referring to the time. The grid spacing is even in both space and time with giving the distance between depth positions and the duration of each time step.
The heat diffusion equation (equation 12) is integrated with an explicit scheme;
| (13) |
which requires for numerical stability. Equation 13 is used to update the temperature at all points in the grid, except for the bottom-most and the top-most (or surface) grid points. With points in the spatial grid, our grid index ranges from to .
At the bottom of the spatial grid we assume a zero flux boundary condition
| (14) |
The lower boundary condition is equivalent to
| (15) |
After equation 13 is used to update the temperature at all grid points except the bottom and top, Equation 15 is used to update the bottom grid point temperature.
Next is to find a way to update , the temperature at the surface using equation 11. We define a function for the surface temperature
| (16) |
where is the temperature at the grid point just below the surface grid point after we have updated the temperature array with equation 13. The function for a surface temperature that is consistent with the boundary condition in equation 11 (but neglecting scattering, shadows and radiative heat). The Newton-Raphson technique is used to iteratively find the surface temperature. Starting with we iteratively perform the operation
| (17) |
After about 10 iterations, is satisfied at high precision giving us a value for and completing a full update of the temperature array.
The illumination function we use is
| (24) |
with
| (25) |
giving the orbital phase, and equal to the spin rotation period. Here noon corresponds to and dawn is at . We only consider equatorial illumination for a spinning object with obliquity of zero and ignore the poles.
It is convenient to define a thermal skin depth at which the phase lag of the internal temperature variation is about
| (26) |
We use a grid that has maximum depth at least twice the skin depth.
In the absence of shadows, scattering, absorption of radiated thermal heat from nearby surfaces, and heat flux from below, equation 11 gives an estimate for the temperature at noon.
| (27) |
We initialize the temperature array with at the surface. We set the temperature to be at the bottom of the grid and linearly interpolate between the surface and base. Starting with this initial condition for and at , corresponding to dawn, we integrate the system, by consecutively updating the temperature array at each time step for a total of 200 spin rotation periods. Note that the surface boundary condition is time-dependent due to the illumination function. After this integration time, transients in the system have decayed and the temperature gradient at the base is constant. After transients have decayed we can compute at any desired orbital phase by integrating for an additional length of time equal to .