The role of APOBEC3-induced mutations in the differential evolution of monkeypox virus
Xiangting Li1\Yinyang, Sara Habibipour2\Yinyang, Tom Chou1,3¤, Otto O. Yang2,
1 Department of Computational Medicine, UCLA, Los Angeles, CA, United States
2 Depts. of Medicine and Microbiology, Immunology, and Molecular Genetics, UCLA, Los Angeles, CA, United States
3 Department of Mathematics, UCLA, Los Angeles, CA, United States
\Yinyang
These authors contributed equally to this work.
Abstract
Recent studies show that newly sampled monkeypox virus (MPXV) genomes exhibit mutations consistent with Apolipoprotein B mRNA Editing Catalytic Polypeptide-like3 (APOBEC3)-mediated editing, compared to MPXV genomes collected earlier. It is unclear whether these single nucleotide polymorphisms (SNPs) result from APOBEC3-induced editing or are a consequence of genetic drift within one or more MPXV animal reservoirs. We develop a simple method based on a generalization of the General-Time-Reversible (GTR) model to show that the observed SNPs are likely the result of APOBEC3-induced editing. The statistical features allow us to extract lineage information and estimate evolutionary events.
Introduction
Monkeypox (MPX), or Mpox, is a viral zoonotic disease that has been reported sporadically in western and central Africa. It is caused by the orthopoxvirus MPXV, which is related to Variola Virus, the past cause of the smallpox pandemic. MPX resides in a yet unidentified animal reservoir, and whether it has achieved endemicity in humans is unclear [57, 26, 25].
In 1970, the first human case of monkeypox was reported in the Democratic Republic of the Congo (DRC) [12]. Since then, it has been suggested that MPX may have become endemic in the DRC, and spread to several other Central and West African countries [16]. Outside of Africa, there were sporadic cases of MPX reported from 2003 to 2021, until the recent 2022 worldwide outbreak [57, 26, 25]. These previous sporadic cases were shown to be related to travel to Africa [16]. While cases in the most recent outbreak did not involve travel to or from Africa, the sequences from the 2022 outbreak were found to be clustered with 2018-2019 cases [38]. Moreover, O’Toole and Rambaut first reported signs of Apolipoprotein B mRNA Editing Catalytic Polypeptide-like3 (APOBEC3)-mediated editing in those sequences [2, 3, 1].
APOBEC3 is a group of human enzymes of the innate immune system capable of inhibiting certain types of viruses through deaminating cytosine to uracil, causing a G-to-A mutation in the complement strand when it is synthesized [64]. Most human APOBEC3 molecules tend to deaminate TC dinucleotides, except APOBEC3G, which prefers CC dinucleotides [75, 67, 34, 17, 8]. Compared to MPXV sequences collected in the 1970s, the single nucleotide polymorphisms (SNPs) in the 2022 outbreak were found to be biased for the pattern “TC TT” and “GA AA” [2, 3, 1]. O’Toole and Rambaut hypothesized that the observed SNPs in the 2022 outbreak were the result of APOBEC3-induced editing, and that they are evidence of within-human evolution of MPXV [2, 3, 1].
Subsequent phylogenetic analysis of the genomes collected between 2017 and 2022 revealed significantly high frequencies of APOBEC3-associated SNPs, further supporting the hypothesis of within-human evolution of MPXV [38, 29]. In addition, all the 2022 sequences appeared to cluster together and little evidence of APOBEC3-related mutations was found prior to 2016. In the context of those studies, the APOBEC3-associated SNPs were defined as specific “dinucleotide mutation” of the form “TC TT” and “GA AA.”
Because DNA evolution is a complex process involving mutation and selection, there may be a number of different explanations for the higher fraction of APOBEC3-associated SNPs observed in later sequences; we wish to quantify the influence of APOBEC3 editing by factoring out the effects of these other mechanisms. If the average mutation rates per site of the TC TT type are intrinsically higher than other types of mutations, independent of APOBEC3 activity, then a high fraction of APOBEC3-associated SNPs could be explained without invoking APOBEC3 involvement. Here, we take “intrinsically” to mean APOBEC3-like mutations [74, 35, 15] caused by mutagens unrelated to APOBEC3 such as UV radiation that induce “C T” mutations [20]. Besides the mutagens, the observed mutations themselves may confer higher fitness to MPXV, for instance, by enabling the virus to evade immune surveillance and attack cells more effectively and by exploiting tRNA abundance via codon usage biases[59]. Mutations that are indistinguishable from those induced by APOBEC3 activity can thus be selected even in the absence of APOBEC3.
To distinguish APOBEC3-induced mutations from other high-frequency mutations, we can establish a baseline by investigating early (pre-2016) MPXV genomes. However, time-varying mutation rates, uncertainty in sampling time points, and a limited number of early sequences complicates ancestor sequence reconstruction and mutation event timing. To circumvent these uncertainties, we develop a method to quantify relative mutation rates and find (i) that even in genomes collected before 2016, the TC TT mutation rate relative to other types is higher than average and (ii) that TC TT mutations are even more abundant in genomes collected after 2016. Mutagens induced by UV radiation may account for the higher mutation rate of TC TT in the pre-2016 genomes, while our hypothesis is that the acceleration of TC TT mutations in the later (post-2016) genomes arise from human-specific APOBEC3 editing.
To factor out selection, we examine the evolution of synonymous SNPs which do not alter the amino acid sequence and have minimal influence on the viral fitness. Even within different synonymous mutations, codon usage bias may arise; however, a previous study on the codon usage bias of monkeypox virus collected before 2016 concluded that the genome-wide frequency of nucleotide at the third codon position was not dependent on nucleotides at the first or second position [40], suggesting that natural selection did not favor particular codons in the MPXV genomes. We count the number of synonymous mutations and synonymous APOBEC3-relevant mutations by first identifying all mutations at all sites, then identifying specific mutations that are synonymous. We also consider the preceding nucleotide, which may or may not be within the same codon, to count the number of APOBEC-relevant dinucleotide mutations such as TC TT.
Our model allows for variation in the “raw” or absolute mutation rate across different genomic sites, lineages, and generations. For example, one specific lineage of the virus may acquire a beneficial mutation at a specific time, allowing the virus to replicate faster and thus increasing the subsequent mutation rates in this faster-growing lineage. However, to quantitatively understand the evolution of synonymous SNPs, we make a key assumption that the ratio of rates of any two types of mutation is the same across all sites, lineages, and across time, even though the raw rates may vary across sites, lineages and time. Our method is designed to capture common patterns of relative mutation rates shared by all members of a lineage sharing a common ancestor.
The assumption of constant mutation rate ratios underpins all Markov models of DNA nucleotide substitutions, such as the JC69 [39] and GTR [68] models. Evolution models used in maximum likelihood and Bayesian inference phylogenetic methods also implicitly rely on the constant rate ratio assumption [22, 54, 23] as typical phylogenetic methods are derived based on relative rates of mutations and do not involve absolute time. Thus, our key assumption of constant relative mutation rates is commonly used. Under such an assumption, the number of the observed mutations of a given type will be proportional to the number of another type in the same way across genomes from different lineages and generations. The assumption of linear proportionality is similar to that used in a strict molecular clock theory, which predicts that the mean number of (neutral) mutations increases linearly with physical time. This similarity inspires us to integrate phylogenetic models with principles derived from molecular clocks. We aim to correlate the number of synonymous mutations with a conceptualized relative time scale. We refer to the linear proportionality of the number of a specific mutation to the total number of synonymous mutations as the “relative molecular clock”.
In the next (Materials and Methods) section, we formalize and validate our ideas by first introducing a complete DNA substitution model with raw rates and absolute time. The raw rates will cancel each other when we consider ratios of mutations in our final results. We also introduce an additional assumption of independence between sites which allows us to easily model the distribution of mutations using a simple binomial distribution and perform statistical hypothesis testing based on this distribution. In particular, our method does not require any knowledge of the ancestor sequence.
Using representative MPXV genomes collected from the National Center for Biotechnology Information (NCBI), we demonstrate that our relative molecular clocks can describe the distribution of the fraction of APOBEC3-associated SNPs to the total number of synonymous SNPs. The genomes collected before and after 2016 clearly separate into two groups, with each group exhibiting a shared relative rate of APOBEC3-associated mutations. We surmise that these two groups of genomes were derived from two different evolutionary environments. The genomes collected before 2016 were likely direct descendants from the animal reservoir, while the genomes collected after 2016 were likely derived from the human host. Given that MPXV jumped from the animal reservoir to humans [33], we can infer statistical properties such as the number of synonymous mutations between the common ancestor of the post-2016 genomes (which has not yet undergone APOBEC3-editing) and a reference genome. This statistically inferred common ancestor can be older than the last common ancestor of the same group and provide a better estimate of the time of zoonotic MPXV transmission. Based on the inferred relative rates and additional independence assumption, we also developed a statistical test to determine whether a given genome can be considered as the common ancestor of the post-2016 genomes. Evolution of other viruses with APOBEC3-induced editing can also be analyzed using the models presented here.
Materials and Methods
DNA evolution model
We construct a relative clock by using the number of synonymous SNPs. To relate our method to both molecular clock and phylogenetic models, we start with a formal substitution model with raw mutation rates and absolute time.or the sake of simplicity, we first consider a variant of the GTR model [68] that accounts for local dinucleotide context and mutation rates that are homogeneous across the genome, all lineages, and all generations. We then discuss how relaxing these homogeneity assumptions, by proper rescaling of absolute time, can still lead to a constant-relative-mutation-rate structure.
Single-site DNA evolution models typically use a 44 matrix whose elements describe substitutions among the four nucleotides. For example, the entry might describe the A C mutation rate, defined by the expected number of mutations per site per unit time. The rate matrix can be decomposed into the product of the mutation probabilities per site per replication cycle and the raw replication rate. The JC69 model assumes each available mutation is equally likely to occur and uses a single parameter that describes the overall mutation rate. Therefore, in JC69, where is a normalized substitution matrix if and . Similarly, the rate matrix in the GTR model can be decomposed into , where and are both parameters of the model.
To reformulate the DNA evolution model to include local dinucleotide context, we extend to a 1616 matrix with entries describing the normalized rate of mutations between each pair of dinucleotides. In the following subsections, we allow to be dependent on genomic sites , lineage , and time , while is a constant matrix to be shared by all mutation sites, lineages, and generations. Under this generalization, the mutation rate matrix for lineage at time and site is . Because the mutation rate separates from the constant substitution matrix , the ratios of mutation rates are independent of the mutation rate prefactor .
Several factors can influence the substitution matrix, including the DNA replication and proofreading mechanisms, the environmental factors such as UV, pH, and temperature that may induce spontaneous base substitution, and other proteins that actively edit the DNA sequence, such as the APOBEC3 family of proteins. As an orthopoxvirus, MPXV carries its own replication proteins and replicates in the cytoplasm of the host cell [60]. Within the human host, the environmental factors and host proteins are relatively constant. Therefore, we conclude that the ratio of mutation rates are mostly conserved, and our key assumption is reasonable.
Here, we focus primarily on synonymous SNPs. Historically, synonymous SNPs can be considered as neutral mutations and are often associated with the molecular clock [24]. However, selection pressure related to codon usage [69] can differentially affect synonymous mutations. Our model does not require neutrality, but it does require that mutations of the same type occur with similar rates relative to other mutations. Statistically, different synonymous mutations of the same pattern, e.g., TA TT, are considered as identical. This allows us to count the number of synonymous mutations of the same type and infer the relative rates of these mutations. Our consideration mostly involves DNA substitution models rather than codon substitution models[31, 72]. We identify synonymous dinucleotide mutations by the context along the whole sequence rather than only through synonymous sites.
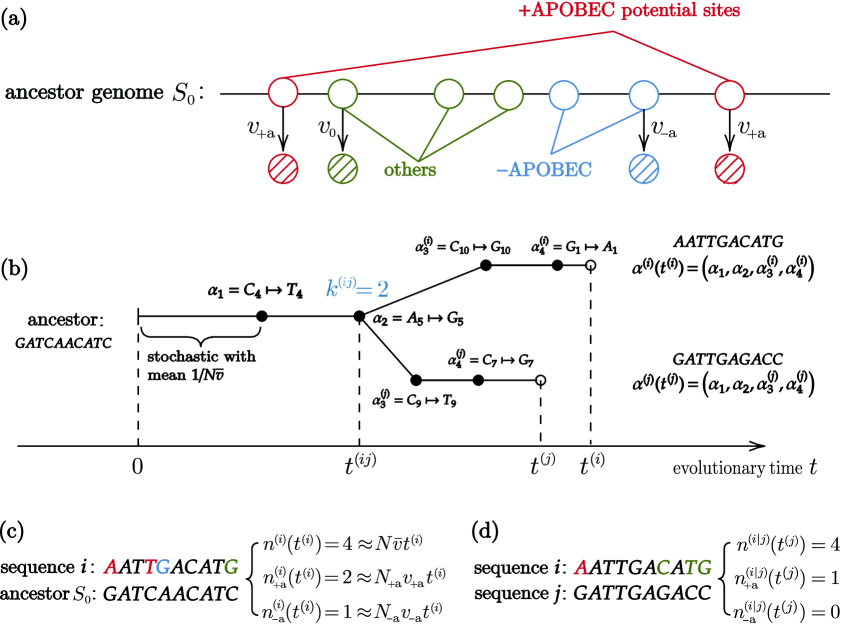
Now suppose there is a common ancestor sequence in which there are a total of possible synonymous mutations, i.e., roughly codons since most codons have 3 synonymous alternatives, a total of possible synonymous APOBEC3-induced mutations (TC TT and GA AA), and a total of possible synonymous reverse-APOBEC3 mutations (TT TC and AA GA). To quantify and , each possible nucleotide change that retains the subsequent amino acid is counted as a separate synonymous mutation. As shown in Fig. 1(a), the basic idea is to assume that each mutation of the same type along the genome is independent and identically distributed with a type-specific rate.
Synonymous APOBEC3-induced mutations are defined as synonymous mutations that match the pattern TC TT or its reverse complement GA AA. The reverse-APOBEC3 synonymous mutations are defined as synonymous mutations that match the pattern TT TC or its complement AA GA. Together, these two types of synonymous mutations will be denoted “APOBEC3-relevant” in the following sections. The remaining possible number of synonymous mutations are non-APOBEC3-relevant.
We assume that all possible synonymous mutations of the same type have the same mutation rate and that each mutation occurs independently of others. For example, the mutation rate for synonymous APOBEC3-induced mutations is , and the mutation rate for synonymous reverse-APOBEC3 mutations is . The average mutation rate for synonymous non-APOBEC3-induced mutations is . The average mutation rate across all possible synonymous mutations is thus
| (1) |
Table 1 summarizes the notation used in the following sections.
| Name | Symbol | Typical values for MPXV |
|---|---|---|
| No. of possible synonymous mutations (of a given type) | , () | 100,000 |
| No. of observed synonymous mutations (of a given type) | , () | 100 |
| Mutation rate of a single nucleotide (of a given type) | , () | – |
| A specific mutation out of possible mutations | ||
| No. of observed synonymous mutations up to time | 100 | |
| Sequence of mutations of lineage | – | |
| (chronological) mutation in lineage | ||
| No. of observed mutations of genome relative to | 100 | |
| Sampling time of lineage or genome | – | |
| Emergence time of last common ancestor of lineages | – | |
| No. of mutations shared by lineages and | – |
The different types of mutations invoked in our model are listed in Table 2.
| Mutation type | Symbol | Synonymous Mutation Type |
|---|---|---|
| Index | ||
| APOBEC3-induced | , | |
| reverse-APOBEC3 | , | |
| APOBEC3-relevant | , | |
| synonymous | all types of synonymous mutations | |
| non-APOBEC3-relevant | all but APOBEC3-relevant mutations | |
| – | , | |
| – | , |
Single lineage evolution.
First consider a single lineage of MPXV genomes evolving out of the common ancestor starting at time . In terms of the synonymous mutations, the lineage observed at time is described by a sequence , where each labels the location (which also defines the mutation type) of the (chronological) synonymous mutation, relative to some reference genome (e.g., ). Here, describes the total number of synonymous mutations that have occurred up to time . An example of two lineages and is shown in Fig. 1(b).
To simplify the analysis, we also adopt an infinite sites assumption [47] in which the total number of synonymous mutations of lineage satisfies . For the MPXV genomes we investigated, the number of observed synonymous mutations is around 100, and the total number of possible synonymous mutations is around 100,000. Therefore, we can safely assume that all observed mutations occurs on different genomic sites for different lineages and chronological order . Multiple mutations and back mutations occurring on the same site are rare and neglected. We note that the infinite sites assumption is not fundamental to our calculation. To drop this assumption, we need to consider the relation between the number of observed mutations and the number of actual mutations. For example, if one back mutation occurs, the observed number of mutations will be two less than the actual number of mutations. Given the total number of actual mutations, one can calculate the expected number of observed mutations. Inversely, when the number of observed mutations is known, we can obtain an estimate of the number of actual mutations by the number that produces a matching expected number of observed mutations. In the current setting, the chances of back mutations and multiple mutations on the same nucleotide are small. Therefore, the difference between the number of observed mutations and the number of actual mutations is also very small.
The average synonymous mutation rate (Eq. 1) comes into play when we measure the number of mutations of the lineage at time . The expected number of mutations is then given by
| (2) |
and the expected number of mutations of type is given by . To obtain a probability distribution of different types of mutations, we assume that mutation events on different dinucleotide sites are independent, allowing for at least a dinucleotide level of site dependence.
This independent-site assumption is also widely adopted in the literature [22, 54, 23] and reflects the stochastic nature of molecular processes and the feature that DNA replication and proofreading manifest themselves locally at nucleotide sites. Under this independence assumption, we have the following conditional probability:
| (3) |
where defines the type of the mutation, which is implicitly defined by the sequence .
Now, let denote the number of synonymous APOBEC3-induced mutations ( and ) in the lineage , as exemplified in Fig. 1(c). Similarly, we let , denote the number of synonymous reverse-APOBEC3 mutations ( and ) and synonymous non-APOBEC3 mutations, respectively. When the ancestor can be used as the reference sequence, only the number of APOBEC3-induced mutations is considered. However, as we discuss in the next section, when the ancestor sequence is unknown, the forward APOBEC3 mutation on the test sequence and reverse-APOBEC3 mutations on the reference sequence can not be distinguished. Conditioned on a total of mutations, the probability of synonymous APOBEC3-induced mutations arising is
| (4) |
In other words, the random variable given follows a binomial distribution with parameter and probability .
If the ancestor sequence is known, we can infer that for all samples , the number of synonymous APOBEC3-induced mutations follows a binomial distribution with parameters and . If is sufficiently large, we expect that
| (5) |
Eq. (5) reveals a simple linear relationship followed by all samples. Unfortunately, we do not know the ancestor sequence and in order to extract evolution information from data, we must compare the evolution across multiple lineages.
Multi-lineage evolution.
We now consider multiple lineages evolved from the same ancestor sequence and sampled at time . The statistics are straightforward if different lineages evolved independently. However, in reality, some lineages are related to each other by sharing parts of their evolutionary paths, as depicted in Fig. 1(b).
Shared evolutionary paths change how distinct mutations are enumerated. Suppose that two lineages and share the first mutations and diverge at the -st mutation. After divergence, they acquire mutations independently. Among a total of mutations in these two lineages, there are pairs of identical mutations. The subsequent random mutations are mutually independent of each other.
To construct a systematic notation, for any two lineages and , we define to be the largest integer such that for all . For unrelated lineages, .
Let denote the set of all mutations across all lineages. Under our working assumptions, the mutation in lineage and mutation in lineage are identical if and only if they have identical chronological order () in the common evolution history before the two lineages diverged ( and ). When the condition is not satisfied, the mutations are unrelated. Unrelated mutations are independent and identically distributed. Examples of related mutations and unrelated mutations are shown in Fig. 1(b).
Now, pick any two lineages and , and define the relative number of mutations of with respect to as the number of synonymous mutations identified when is assumed to be the ancestor sequence, i.e., when the reference genome is . Fig. 1(d) provides an example of . Let be the time when two lineages and diverged, as indicated in Fig. 1(b). Then, . Under our infinite sites assumption,
| (6) | ||||
If , substituting Eq. (5) into the right-hand side of Eq. (6), we find order of magnitude relationships between the number of mutations between lineage and reference lineage and the times of sampling and lineage divergence:
| (7) | ||||
Therefore, upon defining , we find the asymptotic expression:
| (8) |
Due to the inability to distinguish APOBEC3-induced mutations on genome from reverse-APOBEC3 mutations on genome , the number of observed APOBEC3-induced mutations of genome with respect to genome is the sum of and . This quantity depends on and , the branch lengths of both lineage and lineage . Therefore, the ratio will also depend on the branch lengths and is not a constant when . To avoid this complication, we must consider both the forward and reverse mutations, which leads to the desired linearity in Eq. (8). Conditioned on , still follows the binomial distribution with mean and probability parameters and :
| (9) | ||||
When an unrelated genome is used as a reference, the proportionality indicated in Eq. (8) is no longer valid. In this case, because of unrelatedness and the infinite sites assumption, we have and , where and are two values that are independent of . Consequently, and are not proportional to each other but follow the linear relationship
| (10) |
The fraction and constant are parameters to be obtained from data. If genomes and have evolved from the same ancestor with the same mutation rates, the constant term is zero. Nonzero constant term partially measures the degree to which the mutation rates of the two lineages are different.
Relaxing relative clock assumptions.
So far in our relative clock construction, we assumed that the raw mutation rates are constant over genomic locations, lineages, and time. Although this assumption is not realistic, phylogenetic-like models do not require specification of raw mutation rates. Since our hybrid approach shares features with phylogenetic methods, we can relax the constant mutation rate assumption while retaining key relative rate information. The assumption of constant mutation rates across lineages and generations can be relaxed by properly reinterpreting the time variable , while the assumption of constant mutation rates across genomic locations can be relaxed by changing how total mutation rates are calculated.
For time-varying overall mutation rates, , we define a new nonlinear measure of time , over which the mutation rate is again constant. Interpreted biologically, is interpreted biologically as being proportional to the number of DNA replication cycles since the last common ancestor. It has been found that the mutation rate is positively correlated with DNA replication frequency, and negatively correlated with the generation time [14, 45, 50]. Under those circumstances, we replace the absolute time in the previous sections with a pseudo-time that measures the number of generations since the last common ancestor, which is universal across all different lineages. Since Eqs. (5) and (8) are independent of the time variable, they are invariant for the new time .
Incorporating possible heterogeneity in mutation rates across different sites requires a more complex argument. Genomic sites with an overall higher mutation rate contribute most significantly to the mutations observed between lineages. Instead of simply multiplying by the number of sites available for the mutation of type , we need to calculate the total mutation rate of type via a sum that weights the mutation rates at each site . As the mutations accumulate, indirect and complex cellular interactions may also change the rate of mutation. However, under an infinite sites approximation, only a very small fraction of the sites have mutated. Therefore, the total mutation rates and their ratios remain constant for a very long time. Only in extreme cases where very few sites have extremely high mutation rates while all other sites have negligible mutation rates, is the infinite sites assumption effectively violated and ratios of the total mutation rates can no longer be assumed constant. In light of this argument, we conclude that the spatial homogeneity assumption can be effectively relaxed provided the distribution of mutation rates are not too disperse. After relaxation of these assumptions and proper reinterpretation, our previous calculations and equations hold.
Statistical tests for changes in the mutation rate.
Although time-dependent changes in separable mutation rates can be taken into account and do not affect mutation rate ratios, our modeling approach allows one to statistically test for inseparable shifts in the mutation rate where ratios of mutation rates change. A model in which mutation rates change in time is simulated in Appendix “Hypothetical scenarios” and shown in Fig. S1(a). Specifically, Eq. (9) (the distribution of the count of a specific mutation type, conditioned on known relative mutation rates and the total number of synonymous mutations) enables the calculation of a 95% prediction interval. Instances where samples fall outside this interval suggest a significant alteration in the mutation rate. We provide an example of this test in the Results and in Fig. S1(b).
Eq. (9) can be further used to test whether a focal genome and a set of known genomes share the same relative mutation rates. To enhance resolution, the focal genome is used as a reference and its coordinates are to the origin . The null hypothesis that reference genome and the set of other genomes exhibit the same relative mutation rate can be tested by how well represent draws from the binomial distribution given in Eq. (9). For example, one can can apply least-squares regression on the data points for each genome . Under the null hypothesis, the -intercept of the regression line should be at . A -test statistic given by can then be used, providing a sensitive test of the null hypothesis.
Selection effects and model validation via simulation
Our theoretical analysis predicts a linear relationship between and , which we test by implementing two types of simulations.
Mutation-only processes.
First, we simulate DNA evolution using independent and identically distributed (i.i.d.) GTR processes. For simplicity, we first exclude selection pressure and assume equal frequencies and equal mutation rates of all four nucleotides, aligning our model with the JC69 limit [39].
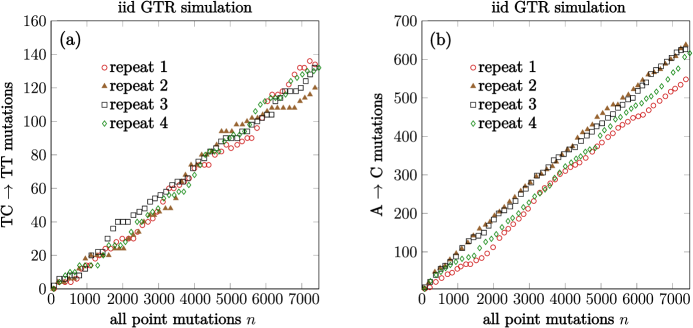
For each trial, we randomly sample nucleotides from the equilibrium distribution of A,T,C,G to construct an initial sequence. For each nucleotide position, we then simulate a Markov mutation process using the JC69 transition matrix and a variant of the Gillespie algorithm [30]. During the simulation of the substitution model, we count the total number of mutations and plot the associated numbers of TC TT and A C mutations in Fig. 2(a) and (b), respectively. Across all four independent trajectories shown, the linear relationship between the number of all mutation types and the total mutation number holds, even up to mutations. This justifies and implies broad applicability of the infinite sites assumption.
Mutation-selection processes.
In a second set of simulations, we factor in selection pressure, using a simple asexual reproduction logistic growth model with a shared carrying capacity . In this simulation, track the population of genes through the numbers of background synonymous mutations , synonymous APOBEC3-driven mutations , and “hidden” (nonsynonymous) beneficial mutations . The population undergoes a birth-death process defined by birth and death rates
| (11) | ||||
| (12) |
where is the total population of genomes, and is the carrying capacity, and the selection coefficient is given by
| (13) |
The selection coefficient depends linearly on the numbers of mutations and through the selection strengths and and . Genomes that have larger reproduce faster.
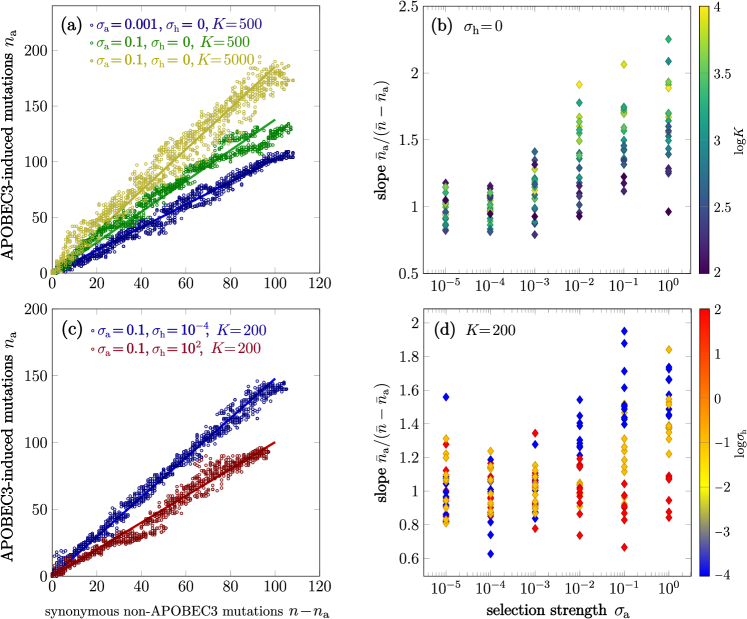
At birth, one daughter has a probability to acquire an additional mutation of specified type. Mutation probabilities are chosen such that the total rates of each type of mutation are identical. To connect with the real-world evolutionary process, after each unit of time (corresponding to the average time between replication of a single genome), a sample of the population is drawn and genomes with specific number of synonymous non-APOBEC3 mutations are collected, along with their associated numbers of synonymous APOBEC3 mutations . These points are collected across all sampled time points and plotted in Figs. 3(a) and (c). From the infinite sites approximation, Eq. 2, and the constant relationship between different types of mutation, is tightly associated with time.
We assign different selection coefficients and to understand how selection on the synonymous APOBEC3 mutations and other beneficial mutations may alter the linear relationship between and . In a mutation-only process (negligible and ), the expected number of mutations of each type is the same as the others, e.g., , as indicated by the blue trajectory in Fig. 3(a). In Fig. 3(b), we plot, for each value of indicated, the trajectory slopes for 25 different values of uniformly sampled within or . The increased mutation rate with larger population size is consistent with prior theoretical understanding of selection effects [44, 37]. Even when the selection for APOBEC3 mutations is strong () and the carrying capacity is large (), the effective APOBEC3 mutation rate is at most doubled, as shown in Fig. 3(b).
If the selection of the hidden beneficial mutations is large (say, ), the ratio , as shown by the red trajectory in Fig. 3(c) and the marked red values of slopes (diamonds) in Fig. 3(d). Here, the hidden beneficial mutations drive selection, leading again to comparable and .
Summarizing, our simulations verify (i) that the infinite sites hypothesis holds up to mutations in a genome of bp, (ii) that the linear relationship between the number of different types of mutations holds even under selection, (iii) that the effective mutation rate of APOBEC3-driven mutations can be increased by selection only if they are relatively strongly selected for (), and (iv) that strong selection for other beneficial mutations can mask the increase in the effective mutation rate of APOBEC3-driven mutations due to selection.
Sequence analysis and alignments
We obtained the sequences of 237 MPXV genomes from the NCBI database as listed in Table LABEL:table1. To date, there are hundreds of MPXV genomes available. Dates of the sequences are inferred from the collection date and other contextual information. However, a majority of them are samples collected from the most recent outbreak. Thus, a large number of them are closely related, and using our proposed analysis, contribute little information to the evolutionary history of MPXV. The sequences were aligned using the affine gap model from the BioAlignments package [18] in Julialang [10]. Alignment results are manipulated using the BioSequences and GenomicAnnotations packages in Julialang.
The dinucleotide and synonymous mutations were identified by first enumerating all mutations in the alignment, in the context of whole genome sequences. Then, we identify the synonymous mutations by comparing the amino acid sequences of the genes. These considerations are not restricted to the third codon position.
For sequences without gene annotations, we used NC_063383 as the template to annotate the genes. Then, these annotations were used to generate pairwise alignment results and identify synonymous mutations. The statistical tests were developed based on likelihood ratio tests for binomial distributions.
Appendix Lineage Analysis provides details on the inference of a tree based on ordering of genome mutations. Our result is shown in Fig. S3(a) and compares well with the phylogenetic tree shown in Fig. S3(b) which as derived from using standard NCBI BLAST [41]. However, BLAST does not correctly resolve subtle ancestral relationships between recently collected genomes, which our method does.
Results
Statistically distinct subgroups with different evolutionary features
For the reasons discussed in Multi-lineage evolution, when the phylogenetic tree is not resolved, we cannot distinguish APOBEC3-induced mutations from their reverse mutation. If the phylogenetic tree is established, these two directions of substitutions can be distinguished from established methods such as the UNREST model[71]. Here, APOBEC3-relevant mutations are defined as the mutations matching patterns or , as detailed in Table 2. The number of these synonymous mutations is . For a time-scaled phylogenetic tree construction method, “root-to-tip” regression is used to estimate the evolutionary rate of the virus, represented by the slope of the regression line[62]. In the absence of a resolved phylogenetic tree, a linear fit of two types of mutations in our relative clock is essentially a “tip-to-tip” regression.
Successful application of the relative molecular clock to pre-2016 genomes.
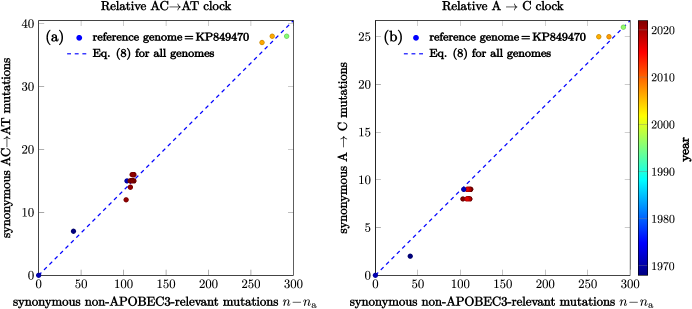
We obtained 6 MPXV genomes collected before 2016 from GenBank. The genome KP849470 was arbitrarily chosen as the reference genome against which other genomes are aligned. For each genome , we calculate the relative number of synonymous mutations and number of APOBEC3-relevant mutations . For simplicity, we omit the reference genome in the superscript and write and respectively. Each genome is then plotted on the plane, where they fall near a line which we find by using a least-squares fit and Eq. (8). As shown in Fig. 4(a), the data points are well fitted by the linear model, allowing us to conclude the pre-2016 MPXV genomes have evolved with a constant set of relative mutation rates.
Given the shared relative mutation rates, we can use the linear fit as a baseline to compare the APOBEC3-relevant mutation rates. A total of possible synonymous mutations were identified on the reference genome KP849470, with of them APOBEC3-induced, and of them reverse-APOBEC3-induced. In total, APOBEC3-relevant mutations account for about 11% of all possible synonymous mutations. By contrast, the slope of the linear fit in Fig. 4(a) is , which represents the fraction of observed APOBEC3-relevant mutations . This fraction is significantly larger than the fraction of possible APOBEC3-relevant mutations , suggesting that the APOBEC3-relevant mutation rate is higher than that of the average mutation already extant in the pre-2016 MPXV genomes. The ratio serves as a better baseline to test whether the APOBEC3-relevant mutation rate is higher in the post-2016 MPXV genomes.
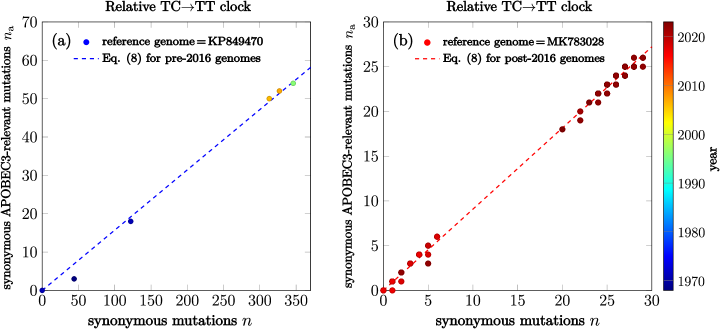
Successful application of the relative molecular clock to post-2016 genomes.
We obtained 226 MPXV genomes from GenBank collected after 2016. Genome MK783028 was chosen to be the reference genome against which other genomes are aligned. The relative number of synonymous mutations and number of APOBEC3-relevant mutations are computed and each genome is plotted in the plane. The results are shown in Fig. 4(b). These points also fall near a line, indicating that the post-2016 MPXV genomes also evolved with a constant set of relative mutation rates.
The total number of possible mutations of different types on the reference genome MK783028 is similar to that of KP849470. However, the slope of the linear fit in Fig. 4(b) is which is significantly larger than the baseline slope of the pre-2016 genomes.
Interpretation of different APOBEC3-relevant mutation rates.
In conclusion, our key assumption of constant ratios of mutation rates is separately applicable to the two subgroups of genomes (distinguished by their year of collection). The mutation rate ratios are particular to each group. Because we have factored out the selection pressure by considering only synonymous mutations, selection is unlikely to account for the difference in the two mutation rate ratios. If this difference is due to random neutral mutations within the animal hosts, we would expect that the ratio of the number of APOBEC3-relevant mutations to the number of all synonymous mutations is the same for both groups of genomes resulting in similar slope in Fig. 4. In addition, since the total number of possible mutations of different types on the reference genome is similar for both groups of genomes, the difference in the observed frequencies of APOBEC3-relevant mutations can only be explained by the difference in the relative APOBEC3-relevant mutation rate.
The SNP variants across the pre-2016 genomes that often belong to different clades likely reflect the evolution of the virus in unknown animal reservoirs. By contrast, the genomes in the post-2016 group are clustered into a single clade, and the associated SNP variants likely reflect the evolution of the virus in the human host. Therefore, we conclude that the APOBEC3-relevant mutation frequency is relatively higher in the pre-2016 group (), possibly due to some intrinsic or extrinsic physical or chemical mutagens like UV radiation, as mentioned previously. The APOBEC3-relevant mutation rate is extremely high in the post-2016 group, which could be a result of persistent APOBEC3-editing in the human host.
APOBEC3 and other human-specific environmental factors may also impose selection pressure that favors certain mutations. For example, tRNA abundance may be different in the human host compared to the animal reservoirs. However, such effects are generally expected to be gene-specific, exhibiting a stronger effect on highly expressed genes. Our analysis in Appendix “Distribution of APOBEC3-induced mutations” does not support this hypothesis as we do no find exceptionally high APOBEC3-relevant per-site mutation rates in specific genes (see Fig. S4). Neither are mutation types correlated across genes (see Fig. S5). Moreover, our simulations show that even a strong selection coefficient favoring APOBEC3-relevant mutations can at most double the APOBEC3-relevant mutation rate, which is much smaller than the observed difference between the pre-2016 and post-2016 groups (see Fig. 3). Other beneficial nonsynonymous mutations could further reduce the increase in the ratio. Therefore, we conclude that the observed difference in APOBEC3-relevant mutation rate is mostly likely due to a difference between the APOBEC3-editing activity in animal reservoirs and the human host.
General applicability of relative molecular clocks and bias for APOBEC3-relevant mutations.
We have shown that our recalibrated molecular clock method is applicable to both pre- and post-2016 genomes in the context of APOBEC3-relevant mutations versus all synonymous mutations. In fact, the relative molecular clock method is applicable to other types of synonymous mutations as well. For example, we considered the A C type of synonymous mutations versus synonymous non-APOBEC3-relevant mutations in Fig. S6. The linearity is still observed and is consistent in both pre- and post-2016 genomes. This observation suggests not only that the relative molecular clock method is generally applicable.
The ancestor of post-2016 MPXV genomes
The geometry of pre- and post-2016 genomes on the same plane.
By choosing a common reference genome for the two groups of genomes, we can visualize them on the same -plane. The geometric relationship between the two groups of genomes reveal information about the evolutionary history of the virus in these two groups of hosts.
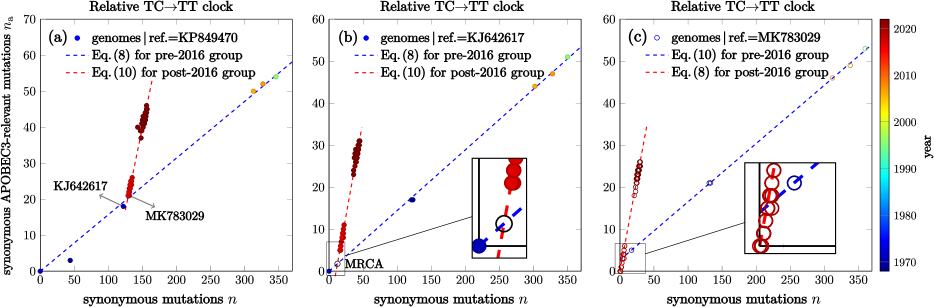
When KP849470 is used as the reference genome, the post-2016 genomes are still distributed along a line in the -plane, as shown in Fig. 5(a). However, since the post-2016 genomes have undergone a different evolutionary history, the genome KP849470 should not be co-linear with the post-2016 genomes. In other words, the line representing the post-2016 genomes should not pass through the origin, but the lines of the pre- and post-2016 genomes will intersect at some point. Genomes at this intersection will share a common evolutionary history in both the animal reservoir and the human host. Since the post-2016 genomes may come from the animal reservoir, the intersection point represents the most recent common ancestor (MRCA) of the post-2016 genomes in the animal reservoir.
The genomes KJ642617 and MK783029 lie approximately at the intersection of the two lines when the genome KP849470 is used as reference. They are thus good candidates for the MRCA of the post-2016 genomes. Small deviations from the precise intersection point of the two lines can be explained by the stochastic nature of mutations.
Statistical tests to determine the MRCA of the post-2016 MPXV genomes.
In order to minimize the effects of stochasticity and improve precision, we determine whether genomes KJ642617 and MK783029 are the MRCA of interest by choosing them as the reference genome (setting their positions to ), respectively. Next, we determine how well the two lines corresponding to the pre-2016 and post-2016 genomes intersect at the origin.
Using least-squares regression, we found that when KJ642617 is used as the reference genome (Fig. 5(b)), the -intercept of the linear fit of the post-2016 genomes is but when MK783029 is used as reference (Fig. 5(c)), the -intercept of the pre-2016 genomes is . In both cases, the p-values of the null hypothesis that the -intercept is zero are less than 0.01. Thus, neither KJ642617 nor MK783029 is representative of the MRCA of the post-2016 MPXV genomes.
However, when we apply the combined p-value test described previously, based on the conditional probability formula Eq. (9), the p-values for the null hypotheses are both greater than 0.05. This discrepancy reflects the fact that the observed number of APOBEC3-relevant mutations has a sharper distribution concentrated around the mean value than the distribution predicted in theory. This sharper distribution might result from multiple factors, including the close phylogenetic relationship between genomes and selection pressure.
Statistical inference of the MRCA in the animal host.
Although neither KJ642617 nor MK783029 are good candidates for the MRCA in the animal hosts, we can infer the number of synonymous mutations with respect to a given reference genome by analyzing the intersection of the linear fits to the pre- and post-2016 genomes.
To estimate the time at which the MRCA first emerges, the reference genome should be chosen from the pre-2016 group. Only if the reference genome is chosen from the pre-2016 group will the critical ancestor have a fewer number of synonymous mutations than other post-2016 genomes. Such a choice would allow us to linearly extrapolate the strict molecular clock fit to the post-2016 genomes and find the emergence time of the MRCA.
Although we can use any pre-2016 genome as a reference, KJ642617 is the most similar to the post-2016 genomes, as measured by the number of observed synonymous mutations. For mutations that occur in a Poisson-like process, the effects of stochasticity measured by standard deviation is proportional to the square root of total number of mutations. Therefore, using KJ642617 as the reference reduces the number of observed mutations and therefore the noise, providing a more precise estimate. As shown in Fig. 5(a), ordinary least-squares regression provides an estimate of the 95% confidence interval of the number of synonymous mutations of the critical ancestor with respect to KJ642617.
Molecular clock of the post-2016 group
The knowledge of the relative number of synonymous mutations of the critical ancestor is helpful for timing its emergence assuming a strict molecular clock is present during its subsequent evolution.
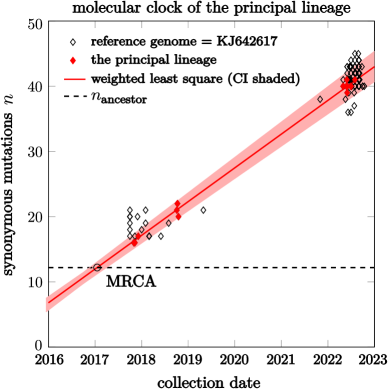
In order to understand whether mutation rates have changed over time, we apply in Appendix Lineage analysis the root-to-tip regression, using the genetic distance defined by the number of synonymous mutations and calibration data defined by manually identified collection dates of the genomes, over a phylogenetic tree constructed by asymmetry of TC TT mutations. The total rate of synonymous mutations for the post-2016 genomes is estimated to be around 5 per year. Their number of synonymous mutations are plotted against the collection date, as shown in Fig. 6.
Multiple factors such as differences between emergence and collection times, cross-lineage and cross-generation differences in the mutation rates, and different geographic locations can result in deviations from the linear relationship between the number of mutations and the collection time predicted by the strict molecular clock. Consequently, unlike the relative clocks shown in Figs. 4 and 5, many genomes seem to have a significant deviation from the predictions of a strict clock. Relatedness between genomes will make the observed number of mutations correlated and not truly independent, rendering statistics such as and p-values biased and less reliable. More specifically, a large fraction of samples collected in 2022 have almost identical number of synonymous mutations. Any fitting method that passes through the center of these samples will have a high .
In order to minimize the deviation from predictions of a strict molecular clock, we considered the principal lineage defined by the longest branch length identified by the phylogenetic method described in the next section, shown in Appendix Lineage analysis and Fig. S3. For the 22 genomes sampled along this the principal lineage, the linear fit between the number of synonymous mutations to collection date yields a slope of synonymous mutations per year. As shown in Fig. 6, this fit is quite good with .
Weighted least square fitting is preferred for dating the MRCA.
When the strict molecular clock assumption of constant mutation rates is valid, the precise number of synonymous mutations with respect to time is given by a constant-rate Poisson process. After a given time , both the mean and the variance in the number of synonymous mutations is proportional to .
To account for the change in variance, we use a weighted least-squares method to fit the data. The weights are inversely proportional to the variance in the number of mutations, and thus inversely proportional to time . To convert collection dates to time , we need to have a primary estimate of the emergence time of the MRCA. This is obtained by ordinary least-squares fitting of the data and is set to 2016-10-01. However, due to sampling bias, the variance of the number of mutations for the whole dataset is not proportional to time , so we restricted our analysis to the genomes within the principal lineage of MPXV.
The linear relationship between the mean number of synonymous mutations and time suggests that no major change in the mutation rate occurred along the principal lineage, including during the unsampled period between 2019 and 2021. A few genomes collected in 2022 have a different number of synonymous mutations. This deviation may be due to cross-lineage variations. More observations are needed to test whether the mutation rate has changed since the 2022 global outbreak.
We then extrapolated the linear fit obtained via weighted least-squares and found a 95% confidence interval of the time of emergence of the ancestor . The main source of uncertainty is the uncertainty in the weighted least-squares fit, where the weighting accounts for possible correlations between different samples. This estimate is close to that of a previously published estimate [1].
Discussion and Conclusions
We developed a simple molecular clock-based method for analyzing relative mutation rates that is applicable to a broad class of DNA evolution models. Molecular clock theory assumes constant a evolutionary rate across lineages and generations. However, this assumption is often violated due to differences in environment and evolutionary mechanisms. Using a less restrictive assumption of constant ratios of mutation rates, we developed a method to recalibrate a molecular clock using, instead of time, another molecular clock. If the relative rates of different types of mutations are constant, different lineages from the same ancestor will have the same relative numbers of these different types of mutations. When we applied our analysis to monkeypox virus (MPXV), we find that there are two distinct groups of MPXV genomes, those collected before 2016 and those after. Each group adheres to the recalibrated molecular clock prediction, with unique relative mutation rates, indicating different evolutionary pressures potentially caused by variations in animal and human hosts. The post-2016 group of sequences share biased hypermutations of the pattern TC TT, which is characteristic of APOBEC3-induced editing. Imposing an additional assumption of independence between sites, we are able to statistically characterize the initial common ancestor of lineages appearing after 2016. Further invoking an infinite sites assumption mathematically simplifies the relation between different types of mutations and the overall analysis. These assumptions allowed us to predict a mean number of mutations that increases linearly with time (Eqs. 2, 7, and 14), as well as a linear relationship between the mutations of a specific type to the total number of mutations (Eqs. 5 and 8), respectively.
Applying our analysis to MPXV samples shows that they evolved in a way that is quantitatively consistent with our assumptions and that there are two distinct epochs of mutations characterized by differences in the rates of the specific dinucleotide mutation TC TT, typical of APOBEC3 editing. We ruled out several alternative possibilities for the high APOBEC3-relevant mutation frequencies such as selection or drift in animal hosts, or differences in the number of available mutation sites. Dynamic biases in mutation rates driven by physical or chemical mutagens are also unlikely since the pre-2016 group of MPXV genomes represent a baseline that incorporates the effects of mutagens other than human-specific enzymes.
Additionally, our analysis not only identified the statistical departure, but also showed that the relative mutation rate of TC TT is preserved in the pre-2016 and the post-2016 sequences, respectively, as shown in Fig. 4. The tight linear proportionality observed is also worth reporting and further investigation. It may reflect a relatively homogeneous environment for different individuals in the host populations. It can also allow one to discern subtle changes in relative mutation rates. In particular, our analysis suggests that the KJ642617 sequence is not a direct ancestor of the post-2016 group, despite it being very close. Similarly, the MK783029 sequence in the post-2016 group is very likely to have undergone a few APOBEC3-editing events since the MRCA of the post-2016 group.
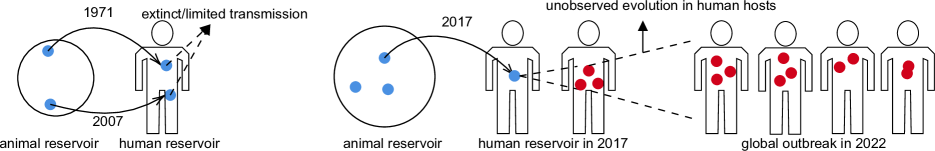
We conclude that the most likely scenario is that pre-2016, MPXV genomes evolved in the animal host. The post-2016 group of MPXV genomes has undergone persistent and continuous human APOBEC3 editing after zoonotic transmission circa late 2016/early 2017. This scenario is implied in Fig. 7.
Unlike applications of DNA evolution models to phylogenetic inference [61], our method provides a simple and vivid goodness-of-fit measure by checking whether different genomes share the same linear relationship between different types of mutations. While high APOBEC3-relevant mutation rates have been observed and reported in previous studies, our evolutionary model-based approach delineates shared features within and between the pre- and post-2016 groups of MPXV genomes. Our model also allows us to identify and characterize the critical ancestor of the post-2016 group, which may contain information about post-2016 epidemics. Quantification of the molecular clock of MPXV suggested that they have a constant mutation rate in the principal lineage of the post-2016 group. This allowed us to estimate the time of the ancestral zoonotic transmission leading to the post-2016 MPXV genomes.
We further validated strong APOBEC3-editing in post-2016 genomes by comparing the lineage analysis results with the results from the BLAST Tree algorithm. Both trees show similar clusters of genomes, but our method provides better resolution of the subtle phylogenetic relations () between genomes collected in 2017 and 2018.
We have not explored the quantitative interpretations of connections between the rate of synonymous mutations and the rate of nonsynonymous mutations; nonetheless, our linear model and analysis can be directly applied to other viruses experiencing APOBEC3-driven evolution. For example, the synonymous mutation rate of SARS-Cov-2 was found to be relatively stable, while its nonsynonymous mutation rate varied over time [53]. There have been some research into the relationship between the mutation rates of synonymous and nonsynonymous mutations [66, 11, 76] but they have focused on improving the inference of the phylogenetic tree. Low levels of nonsynonymous mutations have already been observed in Feline parvovirus and Canine parvovirus, and are related to strong selection [70].
The idea of inferring evolutionary insights from mutation ratios, such as the nonsynonymous to synonymous mutation ratio (dN/dS), is well established and has been used to infer selective pressures on protein-coding regions[66, 11, 76]. Other methods have been developed to identify site-specific mutation rate shifts[21, 51, 71]. However, these methods often involve phylogenetic tree reconstruction using computationally intensive approaches like maximum likelihood or Bayesian inference, and they lack an intuitive goodness-of-fit measure. In contrast, our method bypasses the need for phylogenetic trees, utilizes only sequence alignments against a common reference, and offers an intuitive way to measure fit to data. We can also evaluate the probability of nonsynonymous mutations per replication, but this can depend on selection since past nonsynonymous mutations would have likely changed the fitness of the genome. A sequence with more potentially beneficial mutations is more likely to exhibit a higher effective rate of nonsynonymous mutations, while excess deleterious mutations lead to slower nonsynonymous mutation. While the basic mutation rate is not directly affected by individual mutations, beneficial mutations are more likely to survive and spread, whereas deleterious ones tend to be eliminated. The effective mutation rate, influenced by selection, provides insight into the evolutionary landscape. Therefore, APOBEC3-driven (nonsynonymous) mutations may disrupt the dynamic mutation-selection balance, which may profoundly influence the evolution of molecular phenotypes under stabilizing selection [63, 32, 56]. Finding beneficial mutations is mathematically similar to the problem of a high-dimensional random walk searching for target sites. The interplay between target (beneficial mutations) search and APOBEC3 editing may be an interesting direction of for future analysis. Combining these features with previously developed virus dynamics models could yield a more realistic picture of virus evolution in human [46, 42].
Acknowledgements
TC acknowledges support from the NIH through grant R01HL146552.
Author Contributions
XL conceived and constructed the evolution model and performed the statistical analysis. SH and OY conceived the initial problem and constructed the virus phylogeny. XL, SH, and TC wrote the manuscript. TC and OY assisted in editing the manuscript.
Disclosure and competing interests
The authors have no competing interests.
References
- [1] Áine O’Toole and Andrew Rambaut. An APOBEC3 molecular clock to estimate the date of emergence of hMPXV. https://virological.org/t/an-apobec3-molecular-clock-to-estimate-the-date-of-emergence-of-hmpxv/885, 2022. (Accessed on 10/16/2022).
- [2] Áine O’Toole and Andrew Rambaut. Initial observations about putative APOBEC3 deaminase editing driving short-term evolution of MPXV since 2017. https://virological.org/t/initial-observations-about-putative-apobec3-deaminase-editing-driving-short-term-evolution-of-mpxv-since-2017/830, 2022. (Accessed on 10/16/2022).
- [3] Áine O’Toole and Andrew Rambaut. Update to observations about putative APOBEC3 deaminase editing in the light of new genomes from USA. https://virological.org/t/update-to-observations-about-putative-apobec3-deaminase-editing-in-the-light-of-new-genomes-from-usa/847, 2022. (Accessed on 10/16/2022).
- [4] Pablo Aja-Macaya, Soraya Rumbo-Feal, Margarita Poza, Angelina Cañizares, Juan A. Vallejo, and Germán Bou. A new and efficient enrichment method for metagenomic sequencing of monkeypox virus. medRxiv, 2022.
- [5] Isao Arita and Donald A. Henderson. Monkeypox and whitepox viruses in west and central africa. Bulletin of the World Health Organization, 53(4):347, 1976.
- [6] C. Baliere, V. Hourdel, A. Kwasiborski, Q. Grassin, M. Feher, D. Hoinard, J. Vanhomwegen, F. Taieb, P.-H. Consigny, J.-C. Manuguerra, I. Leclercq, C. Batejat, and V. Caro. Complete genome sequence of Monkeypox virus from a French clinical sample and the corresponding isolated strain using nanopore sequencing. Unpublished, 2023.
- [7] H. Barbian, S. Green, K. Kunstman, F. Araujo Perez, S. Bobrovska, M. Hayden, and N. Moore. Direct submission. Submitted (19-DEC-2022) Regional Innovative Public Health Laboratory (RIPHL), Rush University Meical Center, 1750 W Harrison St., Chicago, Illinois 60612, USA, 2022.
- [8] Rupert C. L. Beale, Svend K. Petersen-Mahrt, Ian N. Watt, Reuben S. Harris, Cristina Rada, and Michael S. Neuberger. Comparison of the differential context-dependence of DNA deamination by APOBEC enzymes: Correlation with mutation spectra in vivo. Journal of Molecular Biology, 337(3):585–596, 2004.
- [9] I.I.B. Betancur, C.-A. C. V. Velarde-Hoyos, R. R. G. Gomez, and M. M. R. Mercado-Reyes. Direct submission. Submitted (16-DEC-2022) Antioquia, Laboratorio Departamental de Salud Publica de Antioquia, Cra 72A 141 78b, Robledo, Medellin, Antioquia 050036, Colombia, 2023.
- [10] Jeff Bezanson, Alan Edelman, Stefan Karpinski, and Viral B. Shah. Julia: A fresh approach to numerical computing. SIAM Review, 59(1):65–98, 2017.
- [11] Jesse D. Bloom. An experimentally informed evolutionary model improves phylogenetic fit to divergent lactamase homologs. Molecular Biology and Evolution, 31(10):2753–2769, 2014.
- [12] Joel G. Breman, M. V. Steniowski, E. Zanotto, A. I. Gromyko, I. Arita, et al. Human monkeypox, 1970-79. Bulletin of the World Health Organization, 58(2):165, 1980.
- [13] Annika Brinkmann, Claudia Kohl, Katharina Pape, Daniel Bourquain, Andrea Thuermer, Janine Michel, Lars Schaade, and Andreas Nitsche. Possible adaption of the 2022 Monkeypox virus to the human host through gene duplication and loss. bioRxiv, 2022.
- [14] Lindell Bromham and David Penny. The modern molecular clock. Nature Reviews Genetics, 4(3):216–224, 2003.
- [15] Timothy Budden and Nikola Bowden. The role of altered nucleotide excision repair and UVB-induced DNA damage in melanomagenesis. International Journal of Molecular Sciences, 14(1):1132–1151, 2013.
- [16] Eveline M. Bunge, Bernard Hoet, Liddy Chen, Florian Lienert, Heinz Weidenthaler, Lorraine R. Baer, and Robert Steffen. The changing epidemiology of human monkeypox–a potential threat? a systematic review. PLoS Neglected Tropical Diseases, 16(2):e0010141, 2022.
- [17] Michael B. Burns, Lela Lackey, Michael A. Carpenter, Anurag Rathore, Allison M. Land, Brandon Leonard, Eric W. Refsland, Delshanee Kotandeniya, Natalia Tretyakova, Jason B. Nikas, Douglas Yee, Nuri A. Temiz, Duncan E. Donohue, Rebecca M. McDougle, William L. Brown, Emily K. Law, and Reuben S. Harris. APOBEC3b is an enzymatic source of mutation in breast cancer. Nature, 494(7437):366–370, 2013.
- [18] Thomas A. Christensen, Ciarán O’Mara, Alexey Stukalov, Kenta Sato, Jakob Nybo Nissen, Sabrina Jaye Ward, Kevin Bonham, Daniel C. Jones, Tim Holy, Morten Piibeleht, and tanhevg. Biojulia/bioalignments.jl: v3.0.0, 2022.
- [19] Inbar Cohen-Gihon, Ofir Israeli, Ohad Shifman, Noam Erez, Sharon Melamed, Nir Paran, Adi Beth-Din, and Anat Zvi. Identification and whole-genome sequencing of a Monkeypox virus strain isolated in Israel. Microbiology Resource Announcements, 9(10):e01524–19, 2020.
- [20] Regen Drouin and Jean-Philippe Therrien. UVB-induced cyclobutane pyrimidine dimer frequency correlates with skin cancer mutational hotspots in p53. Photochemistry and Photobiology, 66(5):719–726, 1997.
- [21] Louis Duchemin, Vincent Lanore, Philippe Veber, and Bastien Boussau. Evaluation of methods to detect shifts in directional selection at the genome scale. Molecular Biology and Evolution, 40(2), 2022.
- [22] Joseph Felsenstein. Evolutionary trees from DNA sequences: A maximum likelihood approach. Journal of Molecular Evolution, 17(6):368–376, 1981.
- [23] Joseph Felsenstein. Taking variation of evolutionary rates between sites into account in inferring phylogenies. Journal of Molecular Evolution, 53(4-5):447–455, 2001.
- [24] Walter M. Fitch and Charles H. Langley. Evolutionary rates in proteins: Neutral mutations and the molecular clock. In Molecular Anthropology, pages 197–219. Springer US, 1976.
- [25] Centers for Disease Control and Prevention. About monkeypox. https://www.cdc.gov/poxvirus/monkeypox/about/index.html, 2022. (Accessed on 10/16/2022).
- [26] European Centre for Disease Prevention and Control. Risk assessment: Monkeypox multi-country outbreak. https://www.ecdc.europa.eu/en/publications-data/risk-assessment-monkeypox-multi-country-outbreak, 2019. (Accessed on 10/16/2022).
- [27] Stanley O. Foster, Edward W. Brink, Deane L. Hutchins, John M. Pifer, Bernard Lourie, Claude R. Moser, Evelyn C. Cummings, O. E. K. Kuteyi, Reginald E. A. Eke, J. B Titus, et al. Human monkeypox. Bulletin of the World Health Organization, 46(5):569, 1972.
- [28] K. T. Gagnon. Direct submission. Submitted (26-SEP-2022) Molecular Biology, Microbiology, and Biochemistry, Southern Illinois University, 1245 Lincoln Drive, Neckers Building, Rm 208, Carbondale, IL 62901, USA, 2022.
- [29] Crystal M. Gigante, Bette Korber, Matthew H. Seabolt, Kimberly Wilkins, Whitni Davidson, Agam K. Rao, Hui Zhao, Todd G. Smith, Christine M. Hughes, Faisal Minhaj, et al. Multiple lineages of monkeypox virus detected in the United States, 2021–2022. Science, pages 560–565, 2022.
- [30] Daniel T. Gillespie. Exact stochastic simulation of coupled chemical reactions. The Journal of Physical Chemistry, 81(25):2340–2361, dec 1977.
- [31] N. Goldman and Z. Yang. A codon-based model of nucleotide substitution for protein-coding DNA sequences. Molecular Biology and Evolution, 1994.
- [32] Sidhartha Goyal, Daniel J. Balick, Elizabeth R. Jerison, Richard A. Neher, Boris I. Shraiman, and Michael M. Desai. Dynamic mutation-selection balance as an evolutionary attractor. Genetics, 191(4):1309–1319, 2012.
- [33] Yong Huang, Li Mu, and Wei Wang. Monkeypox: epidemiology, pathogenesis, treatment and prevention. Signal Transduction and Targeted Therapy, 7(1), 2022.
- [34] Judd F. Hultquist, Joy A. Lengyel, Eric W. Refsland, Rebecca S. LaRue, Lela Lackey, William L. Brown, and Reuben S. Harris. Human and rhesus APOBEC3d, APOBEC3f, APOBEC3g, and APOBEC3h demonstrate a conserved capacity to restrict Vif-deficient HIV-1. Journal of Virology, 85(21):11220–11234, 2011.
- [35] Mahmoud R. Hussein. Ultraviolet radiation and skin cancer: molecular mechanisms. Journal of Cutaneous Pathology, 32(3):191–205, 2005.
- [36] Y. J. Hutin, R. Joel Williams, Philippe Malfait, Richard Pebody, Vladamir N. Loparev, Susan L. Ropp, Mariangelli Rodriguez, Janice C. Knight, Florimont K. Tshioko, Ali S. Khan, et al. Outbreak of human monkeypox, Democratic Republic of Congo, 1996 to 1997. Emerging infectious diseases, 7(3):434, 2001.
- [37] Pär K. Ingvarsson. Molecular evolution of synonymous codon usage in populus. BMC Evolutionary Biology, 8(1):307, 2008.
- [38] Joana Isidro, Vítor Borges, Miguel Pinto, Daniel Sobral, João Dourado Santos, Alexandra Nunes, Verónica Mixão, Rita Ferreira, Daniela Santos, Silvia Duarte, Luís Vieira, Maria José Borrego, Sofia Núncio, Isabel Lopes de Carvalho, Ana Pelerito, Rita Cordeiro, and João Paulo Gomes. Phylogenomic characterization and signs of microevolution in the 2022 multi-country outbreak of monkeypox virus. Nature Medicine, 28(8):1569–1572, 2022.
- [39] Thomas H. Jukes and Charles R. Cantor. Evolution of protein molecules. In Mammalian Protein Metabolism, pages 21–132. Elsevier, 1969.
- [40] Sudeesh Karumathil, Nimal T. Raveendran, Doss Ganesh, Sampath Kumar N. S., Rahul R. Nair, and Vijaya R. Dirisala. Evolution of synonymous codon usage bias in West African and Central African strains of Monkeypox virus. Evolutionary Bioinformatics, 14:117693431876136, jan 2018.
- [41] Stuart King, Yanni Sun, James Cole, and Sakti Pramanik. BLAST tree: Fast filtering for genomic sequence classification. In 2010 IEEE International Conference on BioInformatics and BioEngineering. IEEE, 2010.
- [42] Jesse Kreger, Natalia L. Komarova, and Dominik Wodarz. A hybrid stochastic-deterministic approach to explore multiple infection and evolution in HIV. PLOS Computational Biology, 17(12):1–26, 2021.
- [43] Jeffrey R. Kugelman, Sara C. Johnston, Prime M. Mulembakani, Neville Kisalu, Michael S. Lee, Galina Koroleva, Sarah E. McCarthy, Marie C. Gestole, Nathan D. Wolfe, Joseph N. Fair, et al. Genomic variability of monkeypox virus among humans, Democratic Republic of the Congo. Emerging infectious diseases, 20(2):232, 2014.
- [44] Richard C. Lewontin, Kōstas V. Krimpas, et al. Evolutionary Genetics: From Molecules to Morphology, volume 1. Cambridge University Press, 2000.
- [45] Wen-Hsiung Li, Darrell L. Ellsworth, Julia Krushkal, Benny H.-J. Chang, and David Hewett-Emmett. Rates of nucleotide substitution in primates and rodents and the generation-time effect hypothesis. Molecular Phylogenetics and Evolution, 5(1):182–187, 1996.
- [46] Jennifer S. Lord and Michael B. Bonsall. The evolutionary dynamics of viruses: virion release strategies, time delays and fitness minima. Virus Evolution, 7(1), 2021. veab039.
- [47] Jian Ma, Aakrosh Ratan, Brian J. Raney, Bernard B. Suh, Webb Miller, and David Haussler. The infinite sites model of genome evolution. Proceedings of the National Academy of Sciences, 105(38):14254–14261, 2008.
- [48] Matthew R. Mauldin, Andrea M. McCollum, Yoshinori J. Nakazawa, Anna Mandra, Erin R. Whitehouse, Whitni Davidson, Hui Zhao, Jinxin Gao, Yu Li, Jeffrey Doty, Adesola Yinka-Ogunleye, Afolabi Akinpelu, Olusola Aruna, Dhamari Naidoo, Kuiama Lewandowski, Babak Afrough, Victoria Graham, Emma Aarons, Roger Hewson, Richard Vipond, Jake Dunning, Meera Chand, Colin Brown, Inbar Cohen-Gihon, Noam Erez, Ohad Shifman, Ofir Israeli, Melamed Sharon, Eli Schwartz, Adi Beth-Din, Anat Zvi, Tze Minn Mak, Yi Kai Ng, Lin Cui, Raymond T. P. Lin, Victoria A. Olson, Tim Brooks, Nir Paran, Chikwe Ihekweazu, and Mary G. Reynolds. Exportation of Monkeypox Virus From the African Continent. The Journal of Infectious Diseases, 225(8):1367–1376, 2020.
- [49] C. Milhaud, M. Klein, and J. J. E. A. Virat. Analyse d’un cas de variole du singe (monkeypox) chez le chimpanzé (pan troglogdytes). Experimentation animale, 2:121–35, 1969.
- [50] Priya Moorjani, Carlos Eduardo G. Amorim, Peter F. Arndt, and Molly Przeworski. Variation in the molecular clock of primates. Proceedings of the National Academy of Sciences, 113(38):10607–10612, 2016.
- [51] Ben Murrell, Tulio de Oliveira, Chris Seebregts, Sergei L. Kosakovsky Pond, and Konrad Scheffler and. Modeling HIV-1 drug resistance as episodic directional selection. PLoS Computational Biology, 8(5):e1002507, 2012.
- [52] Yoshinori Nakazawa, Matthew Mauldin, Ginny Emerson, Mary Reynolds, R. Lash, Jinxin Gao, Hui Zhao, Yu Li, Jean-Jacques Muyembe, Placide Kingebeni, Okito Wemakoy, Jean Malekani, Kevin Karem, Inger Damon, and Darin Carroll. A phylogeographic investigation of African Monkeypox. Viruses, 7(4):2168–2184, 2015.
- [53] Richard A. Neher. Contributions of adaptation and purifying selection to SARS-CoV-2 evolution, 2022.
- [54] Lam-Tung Nguyen, Heiko A. Schmidt, Arndt von Haeseler, and Bui Quang Minh. IQ-TREE: A fast and effective stochastic algorithm for estimating maximum-likelihood phylogenies. Molecular Biology and Evolution, 32(1):268–274, 2014.
- [55] N. Nnaemeka, O. Akanbi, C. Chukwu, O. Ayansola, A. Ahmad, A. Yinka-Ogunleye, A. Akinpelu, O. Babatunde, C. Ihekweazu, I. Adetifa, M. R. Mauldin, C. M. Gigante, D. Batra, M. Weigand, D. Howard, M. Sheth, M. H. Seabolt, and Y. Li. 2017-2018 Nigeria Monkeypox outbreak samples. Unpublished, 2022.
- [56] Armita Nourmohammad, Stephan Schiffels, and Michael Lässig. Evolution of molecular phenotypes under stabilizing selection. Journal of Statistical Mechanics: Theory and Experiment, 2013(01):P01012, 2013.
- [57] World Health Organization. Monkeypox fact sheet. https://www.who.int/news-room/fact-sheets/detail/monkeypox, 2022. (Accessed on 10/16/2022).
- [58] N. C. Palmateer. Direct submission. Submitted (21-NOV-2022) Public Health and Environmental Laboratories, New Jersey Department of Health, 3 Schwarzkopf Dr, Ewing, NJ 08628, USA, 2022.
- [59] Sujatha Thankeswaran Parvathy, Varatharajalu Udayasuriyan, and Vijaipal Bhadana. Codon usage bias. Molecular Biology Reports, 49(1):539–565, 2021.
- [60] Qi Peng, Yufeng Xie, Lu Kuai, Han Wang, Jianxun Qi, George F. Gao, and Yi Shi. Structure of monkeypox virus DNA polymerase holoenzyme. Science, 379(6627):100–105, 2023.
- [61] David Posada. Phylogenetic models of molecular evolution: Next-generation data, fit, and performance. Journal of Molecular Evolution, 76(6):351–352, 2013.
- [62] Andrew Rambaut, Tommy T. Lam, Luiz Max Carvalho, and Oliver G. Pybus. Exploring the temporal structure of heterochronous sequences using TempEst (formerly path-o-gen). Virus Evolution, 2(1):vew007, jan 2016.
- [63] Igor M. Rouzine, Éric Brunet, and Claus O. Wilke. The traveling-wave approach to asexual evolution: Müller’s ratchet and speed of adaptation. Theoretical Population Biology, 73(1):24–46, 2008.
- [64] Shiva Sadeghpour, Saeideh Khodaee, Mostafa Rahnama, Hamzeh Rahimi, and Diako Ebrahimi. Human APOBEC3 variations and viral infection. Viruses, 13(7):1366, 2021.
- [65] Jaydee Sereewit, Nicole A. P. Lieberman, Hong Xie, Shah A. K. Mohamed Bakhash, B. Ethan Nunley, Benjamin Chung, Margaret G. Mills, Pavitra Roychoudhury, and Alexander L. Greninger. ORF-Interrupting Mutations in Monkeypox Virus Genomes from Washington and Ohio, 2022. Viruses, 14(11):2393, 2022.
- [66] Stephanie J. Spielman and Claus O. Wilke. Extensively parameterized mutation-selection models reliably capture site-specific selective constraint. Molecular Biology and Evolution, 33(11):2990–3002, 2016.
- [67] Mark D. Stenglein, Michael B. Burns, Ming Li, Joy Lengyel, and Reuben S. Harris. APOBEC3 proteins mediate the clearance of foreign DNA from human cells. Nature Structural & Molecular Biology, 17(2):222–229, 2010.
- [68] Simon Tavaré. Some probabilistic and statistical problems in the analysis of DNA sequences. Lect Math Life Sci (Am Math Soc), 17:57–86, 1986.
- [69] Edward W. J. Wallace, Edoardo M. Airoldi, and D. Allan Drummond. Estimating selection on synonymous codon usage from noisy experimental data. Molecular Biology and Evolution, 30(6):1438–1453, 2013.
- [70] Xiuwan Wang, Maura Carrai, Kate Van Brussel, Shuo Feng, Julia A. Beatty, Mang Shi, Edward C. Holmes, Jun Li, and Vanessa R. Barrs. Low intrahost and interhost genetic diversity of carnivore protoparvovirus 1 in domestic cats during a feline panleukopenia outbreak. Viruses, 14(7), 2022.
- [71] Ziheng Yang. Estimating the pattern of nucleotide substitution. Journal of Molecular Evolution, 39(1), jul 1994.
- [72] Ziheng Yang. Molecular Evolution. Oxford University PressOxford, 2014.
- [73] Adesola Yinka-Ogunleye, Olusola Aruna, Mahmood Dalhat, Dimie Ogoina, Andrea McCollum, Yahyah Disu, Ibrahim Mamadu, Afolabi Akinpelu, Adama Ahmad, Joel Burga, et al. Outbreak of human monkeypox in Nigeria in 2017–18: a clinical and epidemiological report. The Lancet Infectious Diseases, 19(8):872–879, 2019.
- [74] Y.-H. You. Cyclobutane pyrimidine dimers form preferentially at the major p53 mutational hotspot in UVB-induced mouse skin tumors. Carcinogenesis, 21(11):2113–2117, 2000.
- [75] Qin Yu, Renate König, Satish Pillai, Kristopher Chiles, Mary Kearney, Sarah Palmer, Douglas Richman, John M. Coffin, and Nathaniel R. Landau. Single-strand specificity of APOBEC3G accounts for minus-strand deamination of the HIV genome. Nature Structural & Molecular Biology, 11(5):435–442, 2004.
- [76] J. Zhang. Evaluation of an improved branch-site likelihood method for detecting positive selection at the molecular level. Molecular Biology and Evolution, 22(12):2472–2479, 2005.
Data availability
The computer code produced in this study are available at:
-
•
Analysis computer scripts: Github (github.com/hsianktin/monkeypox).
This study includes no data deposited in external repositories.
Supporting Information
Hypothetical scenarios
In this paper, we proposed an idea of visualizing the evolution of genomes by plotting the number of a specific type of mutations against the number of synonymous mutations.
Although alternative methods of detecting mutation rate changes in the evolution of genomes exist, including the UNREST method and root-to-tip regression over the reconstructed phylogenetic trees, as utilized by O’Toole and Rambaut [2, 3, 1], our method has several advantages. First, it provides a visual presentation for goodness-of-fit whereas phylogenetic tree-based methods often do not provide an easily interpretable statistic for goodness-of-fit. Our method not only detects the change of relative mutation rates, but also reveals a preserved set of relative mutation rates within the pre-2016 and post-2016 groups.
Variations in the number of APOBEC3-relevant mutations is smaller than those theoretically predicted, suggesting additional mechanisms or processes that may have contributed to controlling the ratios of mutation rates. This observation invites further study. A closely followed linear relationship allows us to extrapolate the linear fit and detect small deviations from the linear relationship. In the case of monkeypox virus, the grouping is primarily based on the collection date. However, the lack of the direct ancestor sequence makes it hard to determine whether or not the MK783029 sequence has already undergone APOBEC3-editing. As shown in Fig. 5(a), a simple calculation of mutation rates for the MK783029 sequence would suggest that it has similar relative mutation rates as the pre-2016 group since it just entered human hosts and had not undergone much APOBEC3-editing. By using MK783029 as the reference genome, and using linear fitting to extrapolate both the relative mutation rates and the variation of the rates, we can detect subtle changes in relative mutation rates.
We now discuss two hypothetical scenarios under which our approach may be particularly useful. The first example is a simulated scenario wherein the activity of APOBEC3-editing increases linearly over time. This leads to a quadratic relationship between the number of APOBEC3-relevant mutations () and the number of synonymous non-APOBEC3-relevant mutations (), as shown in Fig. S1(a).
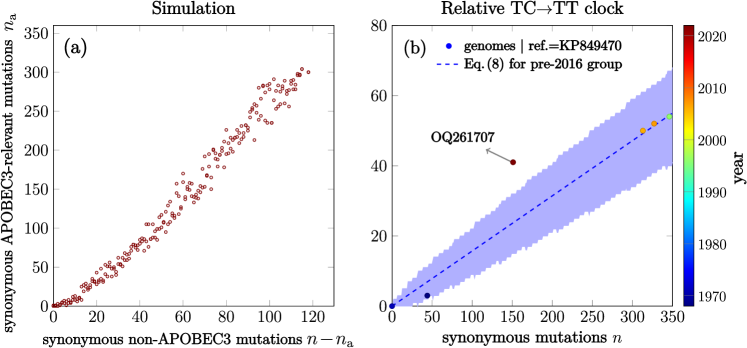
Our second example is rooted in real-world data derived from currently available genome sequences. Earlier evidence by O’Toole et al. of APOBEC3-editing in the post-2016 genomes hinges on the presence of multiple post-2016 genomes sampled at different time points and a genome (KJ642617) that is closely related to the MRCA. These contributed to a root-to-tip regression estimate of the APOBEC3 editing rate. Now, consider a hypothetical scenario where the genome KJ642617 is not available, and only a single genome from the post-2016 group, namely OQ261707 sampled in 2022, is accessible. In this situation, a comparison of OQ261707 to any other genome from the pre-2016 group does not reveal a dominance of APOBEC3-signature mutations over other synonymous mutations, as depicted in Fig. S1(b). To discern the APOBEC3-editing activity from natural mutations, reconstructing the phylogenetic tree and ancestral sequences becomes challenging and introduces further layers of uncertainty.
However, our method proves effective in this scenario as it automatically generates the 95% prediction interval for the number of APOBEC3-relevant mutations () for genome OQ261707 under the null hypothesis that APOBEC3-editing activity is absent, as shown by the shaded region in Fig. S1(b). The observed number of APOBEC3-relevant mutations considerably exceeds the 95% prediction interval indicating, even with such limited data, the significance of the APOBEC3-editing activity.
S1 Table.
Accession numbers and dates used in this study. When the exact date of collection is not known, we round the date to be beginning of the known year or month.
| Accession | Date | Clade | Reference |
|---|---|---|---|
| KJ642616 | 1968-01-01 | IIa | [49, 52] |
| KJ642617 | 1971-01-01 | IIb | [27, 52] |
| KP849470 | 1971-01-01 | IIa | [5, 52] |
| NC_003310 | 1996-01-01 | I | [36] |
| JX878410 | 2006-11-24 | I | [43] |
| JX878428 | 2007-06-30 | I | [43] |
| OP535341 | 2017-10-01 | IIb | [55] |
| OP535340 | 2017-10-01 | IIb | [55] |
| OP535337 | 2017-10-01 | IIb | [55] |
| OP535336 | 2017-10-01 | IIb | [55] |
| OP535335 | 2017-10-01 | IIb | [55] |
| OP535323 | 2017-10-01 | IIb | [55] |
| OP535322 | 2017-10-01 | IIb | [55] |
| MK783032 | 2017-11-01 | IIb | [73] |
| OP535320 | 2017-11-01 | IIb | [55] |
| MK783028 | 2017-11-09 | IIb | [73] |
| MK783031 | 2017-11-09 | IIb | [73] |
| MK783030 | 2017-11-30 | IIb | [73] |
| MK783029 | 2017-12-06 | IIb | [73] |
| OP535333 | 2018-01-01 | IIb | [55] |
| OP535324 | 2018-02-01 | IIb | [55] |
| OP535312 | 2018-02-01 | IIb | [55] |
| OP535329 | 2018-03-01 | IIb | [55] |
| OP535328 | 2018-03-01 | IIb | [55] |
| OP535327 | 2018-03-01 | IIb | [55] |
| OP535325 | 2018-06-01 | IIb | [55] |
| NC_063383 | 2018-08-01 | IIb | [48] |
| MT903341 | 2018-08-14 | IIb | [48] |
| MN648051 | 2018-10-04 | IIb | [19] |
| MT903344 | 2018-10-09 | IIb | [48] |
| MT903345 | 2018-10-09 | IIb | [48] |
| MT903343 | 2018-10-17 | IIb | [48] |
| MT903342 | 2019-04-30 | IIb | [48] |
| ON676708 | 2021-11-01 | IIb | [29] |
| ON563414 | 2022-05-01 | IIb | [29] |
| ON694329 | 2022-05-01 | IIb | [13] |
| OP120937 | 2022-05-01 | IIb | [4] |
| ON649713 | 2022-05-19 | IIb | [38] |
| ON843173 | 2022-05-27 | IIb | [38] |
| ON843172 | 2022-05-27 | IIb | [38] |
| ON843174 | 2022-05-30 | IIb | [38] |
| OP225968 | 2022-06-01 | IIb | [29] |
| ON813267 | 2022-06-01 | IIb | [13] |
| ON813266 | 2022-06-01 | IIb | [13] |
| ON813261 | 2022-06-01 | IIb | [13] |
| ON813255 | 2022-06-01 | IIb | [13] |
| ON813251 | 2022-06-01 | IIb | [13] |
| OP764628 | 2022-06-01 | IIb | [13] |
| OP604533 | 2022-06-01 | IIb | [29] |
| OP604532 | 2022-06-01 | IIb | [29] |
| OP604530 | 2022-06-01 | IIb | [29] |
| OP604529 | 2022-06-01 | IIb | [29] |
| OP604528 | 2022-06-01 | IIb | [29] |
| OP604527 | 2022-06-01 | IIb | [29] |
| OP604522 | 2022-06-01 | IIb | [29] |
| OP837353 | 2022-06-01 | IIb | [13] |
| OP837352 | 2022-06-01 | IIb | [13] |
| OP837351 | 2022-06-01 | IIb | [13] |
| OP837350 | 2022-06-01 | IIb | [13] |
| OP837349 | 2022-06-01 | IIb | [13] |
| OP837347 | 2022-06-01 | IIb | [13] |
| OP837346 | 2022-06-01 | IIb | [13] |
| OP837345 | 2022-06-01 | IIb | [13] |
| OP837344 | 2022-06-01 | IIb | [13] |
| OP837343 | 2022-06-01 | IIb | [13] |
| OP837342 | 2022-06-01 | IIb | [13] |
| OP837341 | 2022-06-01 | IIb | [13] |
| OP837340 | 2022-06-01 | IIb | [13] |
| OP837339 | 2022-06-01 | IIb | [13] |
| OP837338 | 2022-06-01 | IIb | [13] |
| OP837337 | 2022-06-01 | IIb | [13] |
| OP837336 | 2022-06-01 | IIb | [13] |
| OP837335 | 2022-06-01 | IIb | [13] |
| OP837334 | 2022-06-01 | IIb | [13] |
| OQ099608 | 2022-06-01 | IIb | [29] |
| OP120938 | 2022-06-01 | IIb | [4] |
| ON843176 | 2022-06-02 | IIb | [38] |
| OQ249660 | 2022-06-08 | IIb | [6] |
| OP536686 | 2022-06-09 | IIb | [28] |
| OP536688 | 2022-06-12 | IIb | [28] |
| OQ249661 | 2022-06-14 | IIb | [6] |
| OP536697 | 2022-06-17 | IIb | [28] |
| OP536702 | 2022-06-21 | IIb | [28] |
| OP536704 | 2022-06-22 | IIb | [28] |
| OP536709 | 2022-06-23 | IIb | [28] |
| OP536712 | 2022-06-24 | IIb | [28] |
| OP536711 | 2022-06-24 | IIb | [28] |
| OP536713 | 2022-06-25 | IIb | [28] |
| OP536731 | 2022-06-30 | IIb | [28] |
| OP123044 | 2022-07-01 | IIb | [65] |
| OP123045 | 2022-07-01 | IIb | [65] |
| OP123041 | 2022-07-01 | IIb | [65] |
| OP123040 | 2022-07-01 | IIb | [65] |
| OP536738 | 2022-07-01 | IIb | [28] |
| OP536737 | 2022-07-01 | IIb | [28] |
| OP536732 | 2022-07-01 | IIb | [28] |
| OP743951 | 2022-07-01 | IIb | [65] |
| OP434519 | 2022-07-01 | IIb | [65] |
| OP392531 | 2022-07-01 | IIb | [65] |
| OP604531 | 2022-07-01 | IIb | [29] |
| OP604526 | 2022-07-01 | IIb | [29] |
| OP604525 | 2022-07-01 | IIb | [29] |
| OP604524 | 2022-07-01 | IIb | [29] |
| OP604523 | 2022-07-01 | IIb | [29] |
| OP604521 | 2022-07-01 | IIb | [29] |
| OP604520 | 2022-07-01 | IIb | [29] |
| OP604519 | 2022-07-01 | IIb | [29] |
| OP881956 | 2022-07-01 | IIb | [29] |
| OP881955 | 2022-07-01 | IIb | [29] |
| OP881954 | 2022-07-01 | IIb | [29] |
| OQ054242 | 2022-07-01 | IIb | [29] |
| OQ099609 | 2022-07-01 | IIb | [29] |
| OQ099607 | 2022-07-01 | IIb | [29] |
| OQ099606 | 2022-07-01 | IIb | [29] |
| OQ099605 | 2022-07-01 | IIb | [29] |
| OQ099604 | 2022-07-01 | IIb | [29] |
| OP536742 | 2022-07-02 | IIb | [28] |
| OP536740 | 2022-07-02 | IIb | [28] |
| OP536745 | 2022-07-06 | IIb | [28] |
| OP536718 | 2022-07-06 | IIb | [28] |
| OP879722 | 2022-07-26 | IIb | [58] |
| OP879723 | 2022-07-27 | IIb | [58] |
| OP257247 | 2022-08-01 | IIb | [65] |
| OP257243 | 2022-08-01 | IIb | [65] |
| OP215267 | 2022-08-01 | IIb | [13] |
| OP743962 | 2022-08-01 | IIb | [65] |
| OP743961 | 2022-08-01 | IIb | [65] |
| OP743960 | 2022-08-01 | IIb | [65] |
| OP743959 | 2022-08-01 | IIb | [65] |
| OP743958 | 2022-08-01 | IIb | [65] |
| OP743957 | 2022-08-01 | IIb | [65] |
| OP743956 | 2022-08-01 | IIb | [65] |
| OP743955 | 2022-08-01 | IIb | [65] |
| OP743954 | 2022-08-01 | IIb | [65] |
| OP743953 | 2022-08-01 | IIb | [65] |
| OP743952 | 2022-08-01 | IIb | [65] |
| OP392553 | 2022-08-01 | IIb | [65] |
| OP392552 | 2022-08-01 | IIb | [65] |
| OP392551 | 2022-08-01 | IIb | [65] |
| OP392549 | 2022-08-01 | IIb | [65] |
| OP392548 | 2022-08-01 | IIb | [65] |
| OP392547 | 2022-08-01 | IIb | [65] |
| OP392546 | 2022-08-01 | IIb | [65] |
| OP392545 | 2022-08-01 | IIb | [65] |
| OP392544 | 2022-08-01 | IIb | [65] |
| OP392543 | 2022-08-01 | IIb | [65] |
| OP392542 | 2022-08-01 | IIb | [65] |
| OP392541 | 2022-08-01 | IIb | [65] |
| OP392540 | 2022-08-01 | IIb | [65] |
| OP392539 | 2022-08-01 | IIb | [65] |
| OP392538 | 2022-08-01 | IIb | [65] |
| OP392536 | 2022-08-01 | IIb | [65] |
| OP392535 | 2022-08-01 | IIb | [65] |
| OP392534 | 2022-08-01 | IIb | [65] |
| OP392533 | 2022-08-01 | IIb | [65] |
| OP392532 | 2022-08-01 | IIb | [65] |
| OP881952 | 2022-08-01 | IIb | [29] |
| OP881951 | 2022-08-01 | IIb | [29] |
| OP881950 | 2022-08-01 | IIb | [29] |
| OP881948 | 2022-08-01 | IIb | [29] |
| OP881941 | 2022-08-01 | IIb | [29] |
| OQ054241 | 2022-08-01 | IIb | [29] |
| OQ054235 | 2022-08-01 | IIb | [29] |
| OQ054229 | 2022-08-01 | IIb | [29] |
| OP820455 | 2022-08-08 | IIb | [7] |
| OQ121956 | 2022-08-28 | IIb | [7] |
| OP743993 | 2022-09-01 | IIb | [65] |
| OP743992 | 2022-09-01 | IIb | [65] |
| OP743991 | 2022-09-01 | IIb | [65] |
| OP743990 | 2022-09-01 | IIb | [65] |
| OP743989 | 2022-09-01 | IIb | [65] |
| OP743988 | 2022-09-01 | IIb | [65] |
| OP743987 | 2022-09-01 | IIb | [65] |
| OP743986 | 2022-09-01 | IIb | [65] |
| OP743985 | 2022-09-01 | IIb | [65] |
| OP743984 | 2022-09-01 | IIb | [65] |
| OP743983 | 2022-09-01 | IIb | [65] |
| OP743982 | 2022-09-01 | IIb | [65] |
| OP743981 | 2022-09-01 | IIb | [65] |
| OP743980 | 2022-09-01 | IIb | [65] |
| OP743979 | 2022-09-01 | IIb | [65] |
| OP743978 | 2022-09-01 | IIb | [65] |
| OP743976 | 2022-09-01 | IIb | [65] |
| OP743975 | 2022-09-01 | IIb | [65] |
| OP743974 | 2022-09-01 | IIb | [65] |
| OP743973 | 2022-09-01 | IIb | [65] |
| OP743972 | 2022-09-01 | IIb | [65] |
| OP743971 | 2022-09-01 | IIb | [65] |
| OP743970 | 2022-09-01 | IIb | [65] |
| OP743969 | 2022-09-01 | IIb | [65] |
| OP743968 | 2022-09-01 | IIb | [65] |
| OP743967 | 2022-09-01 | IIb | [65] |
| OP743966 | 2022-09-01 | IIb | [65] |
| OP743965 | 2022-09-01 | IIb | [65] |
| OP743964 | 2022-09-01 | IIb | [65] |
| OP715789 | 2022-09-01 | IIb | [65] |
| OP715788 | 2022-09-01 | IIb | [65] |
| OP881953 | 2022-09-01 | IIb | [29] |
| OP881949 | 2022-09-01 | IIb | [29] |
| OP881947 | 2022-09-01 | IIb | [29] |
| OP881946 | 2022-09-01 | IIb | [29] |
| OP881945 | 2022-09-01 | IIb | [29] |
| OP881944 | 2022-09-01 | IIb | [29] |
| OP881943 | 2022-09-01 | IIb | [29] |
| OP881942 | 2022-09-01 | IIb | [29] |
| OQ054247 | 2022-09-01 | IIb | [29] |
| OQ054246 | 2022-09-01 | IIb | [29] |
| OQ054245 | 2022-09-01 | IIb | [29] |
| OQ054244 | 2022-09-01 | IIb | [29] |
| OQ054243 | 2022-09-01 | IIb | [29] |
| OQ054240 | 2022-09-01 | IIb | [29] |
| OQ054239 | 2022-09-01 | IIb | [29] |
| OQ054238 | 2022-09-01 | IIb | [29] |
| OQ054237 | 2022-09-01 | IIb | [29] |
| OQ054236 | 2022-09-01 | IIb | [29] |
| OQ054234 | 2022-09-01 | IIb | [29] |
| OQ054233 | 2022-09-01 | IIb | [29] |
| OQ054232 | 2022-09-01 | IIb | [29] |
| OQ054231 | 2022-09-01 | IIb | [29] |
| OQ054230 | 2022-09-01 | IIb | [29] |
| OQ054228 | 2022-09-01 | IIb | [29] |
| OQ054227 | 2022-09-01 | IIb | [29] |
| OQ054226 | 2022-09-01 | IIb | [29] |
| OQ054225 | 2022-09-01 | IIb | [29] |
| OQ054224 | 2022-09-01 | IIb | [29] |
| OQ054223 | 2022-09-01 | IIb | [29] |
| OQ054222 | 2022-09-01 | IIb | [29] |
| OQ054221 | 2022-09-01 | IIb | [29] |
| OQ054220 | 2022-09-01 | IIb | [29] |
| OQ054219 | 2022-09-01 | IIb | [29] |
| OQ054218 | 2022-09-01 | IIb | [29] |
| OP820454 | 2022-09-07 | IIb | [7] |
| OP820456 | 2022-09-08 | IIb | [7] |
| OQ121962 | 2022-09-25 | IIb | [7] |
| OP764629 | 2022-10-01 | IIb | [13] |
| OP837354 | 2022-10-01 | IIb | [13] |
| OQ261707 | 2022-10-14 | IIb | [9] |
Lineage analysis
APOBEC3-editing is asymmetric with . As shown in Fig. S2, few reverse-APOBEC3 synonymous mutations were observed in the post-2016 group compared to genome KJ642617. According to Eq. (7), since ,
| (14) | ||||
By comparing any two genomes from the post-2016 group, the values of and provide information about the relation among , , and . If , then . This suggests that genomes and are approximately on the same node of the phylogenetic tree. If , then , suggesting that genome is close to an ancestor of genome .
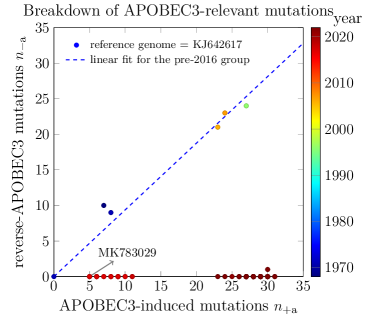
We use these comparisons to infer a phylogenetic tree. By comparing all genomes in the post-2016 group, we first identify subgroups of genomes which contain the same APOBEC3-induced mutations. In our method, genomes within each of these subgroups are indistinguishable from each other and are thus lumped into the same box in Fig. S3(a). If all APOBEC3-induced mutations in genome appear in genome , then is likely an ancestor of and inherited the APOBEC3-induced mutations. We denote this ancestral relationship as . This relationship naturally extends to groups of genomes with the same APOBEC3-induced mutations.
A phylogenetic tree can be constructed by merging all the maximal chains with respect to the ancestral relationship into a single tree. A maximal chain is a chain that cannot be a subsequence of a longer chain and represents a complete path of evolution in the observed genomes. For example, suppose that there are 5 groups of indistinguishable genomes and that , , , , , and . Then, all the maximal chains in this set are , , . And is the common root of the tree, and are two direct descendants of , and and are two direct descendants of .
This proposed algorithm to identify maximal chains typically requires fewer computational resources than other probability-model-based phylogenetic tree reconstruction methods. The reconstructed tree using 40 representative samples from the 237 genomes shown in Fig. S3(a) has similar clusters of genomes as the tree constructed by the BLAST Tree algorithm [41] shown in Fig. S3(b), which also relies on pairwise comparisons of genomes. However, the BLAST algorithm does not correctly resolve the subtle ancestral relationships between genomes collected in 2017 and 2018, highlighted in red.
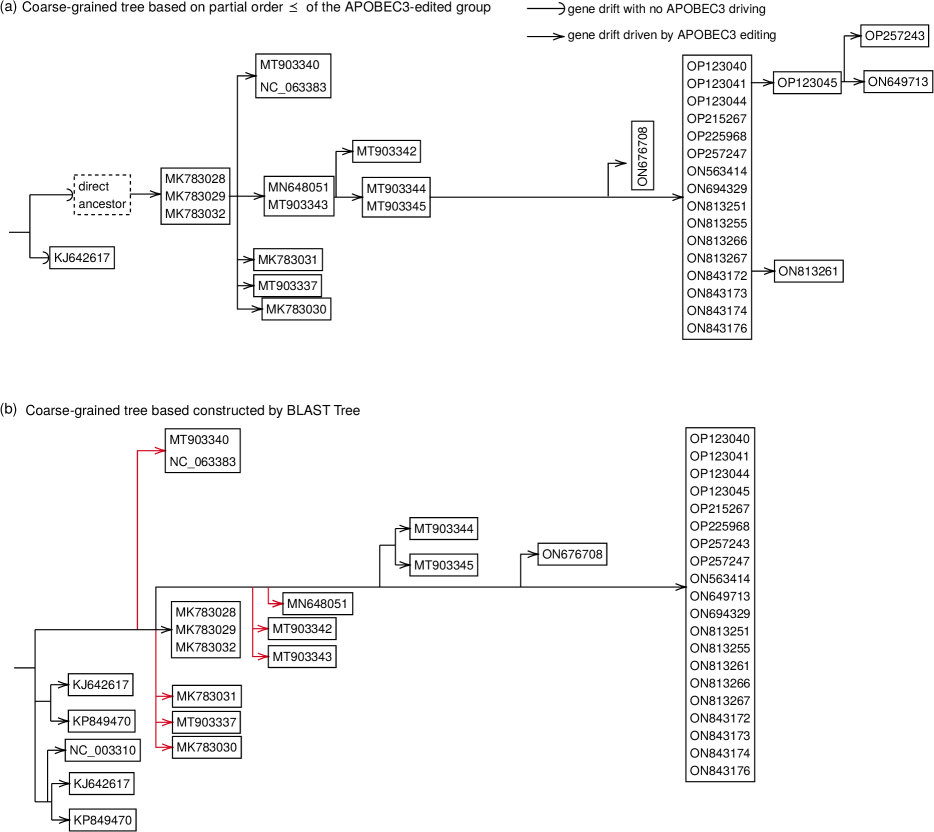
Distribution of APOBEC3-induced mutations
Since the APOBEC3 enzyme can diffuse along the DNA strand while editing, it can potentially generate clusters of APOBEC3-induced mutations localized to within processive footprints. On the other hand, rapid adaptation of MPXV to human hosts may lead to preferred mutation sites within specific viral genes. To quantify how APOBEC3-induced mutations are distributed along MPXV genomes, we counted their number within each gene. Using KJ642617 as a reference, the number of possible APOBEC3-induced mutations and the actual number of APOBEC3-induced mutations are evaluated for each gene. Fig. S4 shows a scatter plot of these values for each gene.

Because the number of observed mutations () is much smaller than the number of genes (), we cannot draw any statistical conclusion from this plot. As expected, most genes do not carry any APOBEC3-induced mutations, and most of the others have only one mutation. There are three genes carrying 2, 3, and 4 mutations, respectively. But these genes do also have more possible mutation sites than average. Finally, we also analyzed the correlation between and within the number of synonymous and nonsynonymous APOBEC3 mutations in each gene from the post-2016 genomes.
To calculate the correlations between genes, we consider gene-specific mutation counts as random variables, tally mutations within each gene for every genome, and use the empirical distribution as the random variable distribution. For example, suppose genome carries two mutations in gene 1 and no mutations in gene 2, while genome carries three mutations in gene 1 and one mutation in gene 2. We treat the numbers of mutations in gene 1 and gene 2 as two random variables and . Considering only genomes and , the configurations and both arise with probability . In the same way, we obtain the joint distribution of different random variables corresponding to different genes in the post-2016 genomes and calculate the correlation coefficient between them. During the enumeration process, we separately consider the number of synonymous APOBEC3-induced mutations and the number of nonsynonymous APOBEC3-induced mutations for each gene. Correlations in the number of mutations across genes are typically low as shown in Fig. S5.
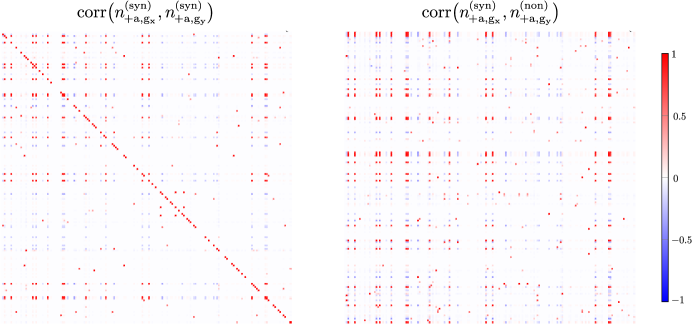
A few highly correlated sites observed are unlikely to arise from functional relationships among genes. Rather, these correlations arise from relatedness since most of the genomes collected in 2022 and are from a single lineage that acquired some mutations between 2018 and 2021. By this same relatedness among sample genomes, there is a strong correlation between the number of synonymous APOBEC3-induced mutations of the same subset of genes and the number of nonsynonymous APOBEC3-induced mutations for a different subset of genes, as is shown in the right panel of Fig. S5. Since the set of genes exhibiting correlations depends on the mutations that arose between 2018 and 2021, it is not surprising that for nonsynonymous mutations, there is a different set of strongly correlated genes. Overall, there is little structure in the sequence-dependence of mutations, consistent with our independent sites assumption.