Single crystal growth and characterization of antiferromagnetically ordering EuIn2
Abstract
We report the single crystal growth and characterization of EuIn2, a magnetic topological semimetal candidate according to our density functional theory (DFT) calculations. We present results from electrical resistance, magnetization, Mössbauer spectroscopy, and X-ray resonant magnetic scattering (XRMS) measurements. We observe three magnetic transitions at K, K and K, signatures of which are consistently seen in anisotropic temperature dependent magnetic susceptibility and electrical resistance data. Mössbauer spectroscopy measurements on ground crystals suggest an incommensurate sinusoidally modulated magnetic structure below the transition at K, followed by the appearance of higher harmonics in the modulation on further cooling roughly below K, before the moment distribution squaring up below the lowest transition around K. XRMS measurements showed the appearance of magnetic Bragg peaks below K, with a propagation vector of , with varying with temperature, and showing a jump at K. The temperature dependence of between K and K shows incommensurate values consistent with the Mössbauer data. XRMS data indicate that remains incommensurate at low temperatures and locks into .
I Introduction
The search for new topological materials and understanding their physics has driven new materials physics research in the last few years. Hsieh et al. (2008); Hasan and Kane (2010); Burkov and Balents (2011); Burkov (2016); Chiu et al. (2016); Yan and Felser (2017); Armitage et al. (2018); Tokura et al. (2019) The robust surface states and the intriguing magneto-transport and optical behaviors of topological materials, such as quantum anomalous Hall effect, axion behavior, circular polarized galvanic effect, etc. Wan et al. (2011); Parameswaran et al. (2014); Chan et al. (2016); Jia et al. (2016); Chan et al. (2017); Shekhar et al. (2018) are expected to further our understanding of quantum materials as well as drive technology innovations. Yan and Felser (2017); Zhang et al. (2019)
One such interesting class of materials is Weyl semimetals (WSM), which can be attained by breaking either the time reversal symmetry (TRS) or the inversion symmetry of a parent Dirac semimetal, which has degenerate bands crossing with a linear dispersion, hence hosting massless electronic excitations. In magnetic Weyl semimetals, magnetism coexists with and modifies the non-trivial topology of the electronic bands of the material, by breaking symmetries, through either providing a wave vector associated with a low temperature antiferromagnetic (AFM) state, or by imposing a long-range internal field via adopting a state with an ferromagnetic (FM) component. In case of FM-WSM, magnetism breaks time reversal symmetry, and in AFM-WSM, an effective TRS, which could be a combination of TRS and a discrete crystal symmetry such as translation.
Divalent Eu-containing binary and ternary compounds have become fertile grounds for looking for magnetic Weyl semimetal candidates. May et al. (2014); Soh et al. (2019); Jo et al. (2020); Pakhira et al. (2020); Riberolles et al. (2021); Wang et al. (2021) When present in its valence, Europium is magnetic with an effective angular momentum that is fully associated with the electron spin with being zero. In many cases, magnetism can be tuned by chemical doping Jo et al. (2020), hydrostatic pressure Gati et al. (2021), strain, etc., which then leads to many possibilities of manipulating topological phases in these systems. Wang et al. (2021)
Recently a theoretical study predicted that EuTl2, which forms in the CaIn2 structure type with the hexagonal structure in space group (194), to host a variety of topological phases depending on the strength of the magnetic interactions, as well as by varying strain. Wang et al. (2021) EuIn2, which is much more amenable to growths than the toxic and volatile Tl, crystallizes in the same CaIn2 structure and could be a possible candidate for various topological phases. In the literature, EuIn2 was synthesized in polycrystalline form and magnetic measurements were only done for temperatures above K. Iandelli (1964); Yatsenko et al. (1983) However, no reports exist about the low-temperature behavior of this compound and, therefore, the nature or even existence of magnetic order is unknown. As such EuIn2 is a compound that merits further investigation in order to clarify its status as a potentially topologically non-trivial material.
Here, we report the results of DFT calculations on EuIn2, predicting the existence of Dirac points in the non-magnetic state, which makes it a candidate for a magnetic topological semimetal if magnetic ordering can be confirmed and delineated. We report the single crystal synthesis, electrical transport measurements, and magnetic characterization of EuIn2. We find signatures of three magnetic ordering temperatures at K, K and K in temperature dependent magnetization and electrical resistance measurements. Further measurements of Mössbauer spectroscopy and X-ray resonant magnetic scattering results provide initial insight into the nature of the magnetic ordering occurring below these temperatures. Taken together our results indicate that EuIn2 is a promising candidate for further studies of magnetic and potential topological properties.
II Experimental and Computational Methods
Single crystals of EuIn2 were grown out of excess In using the high-temperature solution growth method. Canfield and Fisk (1992); Canfield et al. (2016); Canfield (2020) Elements (Eu - Ames Laboratory, 99.99+ % and In - Alfa Aesar, 99.999%) with an initial stoichiometry of Eu15In85 were weighed out into a fritted alumina crucible set (Canfield Crucible Set) Canfield et al. (2016) and sealed in a fused silica tube with a partial pressure of Argon. The prepared ampoule was then heated up to C over 4 hours and held there for 3 hours. This was followed by a slow cooling to C over 50 hours and decanting the excess flux using a centrifuge. Canfield and Fisk (1992); Canfield (2020) The choice of decanting temperature at C is to avoid the possible formation of EuIn4 below the C peritectic line (ASM Diagram #901007 Okamoto (2016)). The crystals obtained had a hexagonal morphology and were air sensitive, with the surface turning white/oxidized within about 15 minutes of exposure to air. They were stored and handled inside a Nitrogen filled glovebox.
Powder x-ray diffraction measurements were carried out to determine the phase purity. The powder x-ray diffraction pattern was collected on ground crystals using a Rigaku Miniflex diffractometer inside a Nitrogen filled glovebox, with Cu radiation. Crystallographic parameters were obtained from a Rietveld refinement using GSAS-II software. Toby and Von Dreele (2013)
The magnetic measurements were carried out in a Quantum Design Magnetic Property Measurement System with applied fields up to kOe. The samples were mounted on a Poly-Chloro-Tri-Fluoro-Ethylene disk, and the separately measured background of the disk was subtracted. The AC resistivity measurements were done in a Quantum Design Physical Property Measurement System in the standard four point configuration. The current was passed along the axis with mA and Hz. Contacts were made using Dupont-4929N silver paint.
The 151Eu Mössbauer spectroscopy measurements were carried out on ground samples of EuIn2, using a 4 GBq 151SmF3 source, driven in sine-mode and calibrated using a standard 57CoRh/-Fe foil. Isomer shifts are quoted relative to EuF3 at ambient temperature. The sample was hand-ground under hexane (to minimise oxidation) and mixed with boron nitride before being loaded into a thin-window delrin sample holder. The sample was cooled in a vibration-isolated closed-cycle helium refrigerator with the sample in helium exchange gas. The spectra taken below 10 K and above 15 K could be fitted conventionally using a sum of Lorentzian lines with the positions and intensities derived from a full solution to the nuclear Hamiltonian. Voyer and Ryan (2006) However, spectra taken in the incommensurate modulated phase between 10 K and 15 K (see discussions below) were fitted using a model that derives a distribution of hyperfine fields from an (assumed) incommensurate sinusoidally modulated magnetic structure. Bonville et al. (2001); Maurya et al. (2014)
X-ray resonant magnetic scattering (XRMS) measurements were made at end station -ID-B at the Advanced Photon Source, Argonne National Laboratory, for the Eu edge ( keV Solé et al. (2007)) using the Huber Psi-circle geometry diffractometer. An approximately mm thick single-crystal with a cross section of mm was mounted on a Cu sample holder with carbon tape and the holder was thermally anchored to the cold head of a He displex with the crystalline axis horizontal. Care was taken to minimize the exposure time of the sample to air. The instrument was operated in vertical geometry which allowed for access to several reciprocal-lattice points. Incident x-rays were linearly polarized perpendicular to the vertical scattering plane ( polarized) and no polarization analysis of the diffracted beam was performed. A -dimensional Pilatus 100K detector was employed and the incident beam size was mm (height by width). An attenuator with a calculated transmission of was used when recording the data shown below in order to mitigate beam heating of the sample. Nevertheless, comparison of the XRMS data with the thermodynamic, transport, and Mössbauer spectroscopy data indicated a K difference in features in the data which is presumably due to beam heating. We have accordingly shifted the temperature of the XRMS data presented below by K.
Band structures of non-magnetically-ordered EuIn2 have been calculated without Eu 4f orbitals in density functional theoryHohenberg and Kohn (1964); Kohn and Sham (1965) using PBEPerdew et al. (1996) as exchange-correlation functional with spin-orbit coupling (SOC) effect included. All DFT calculations have been performed in VASPKresse and Furthmüller (1996, 1996) with a plane-wave basis set and projector augmented waveBlöchl (1994) method. We used the hexagonal unit cell of 6 atoms with a -centered Monkhorst-PackMonkhorst and Pack (1976) () point mesh with a Gaussian smearing of 0.05 eV. The kinetic energy cutoff was 400 eV.
III Results and Discussion
III.1 DFT Results
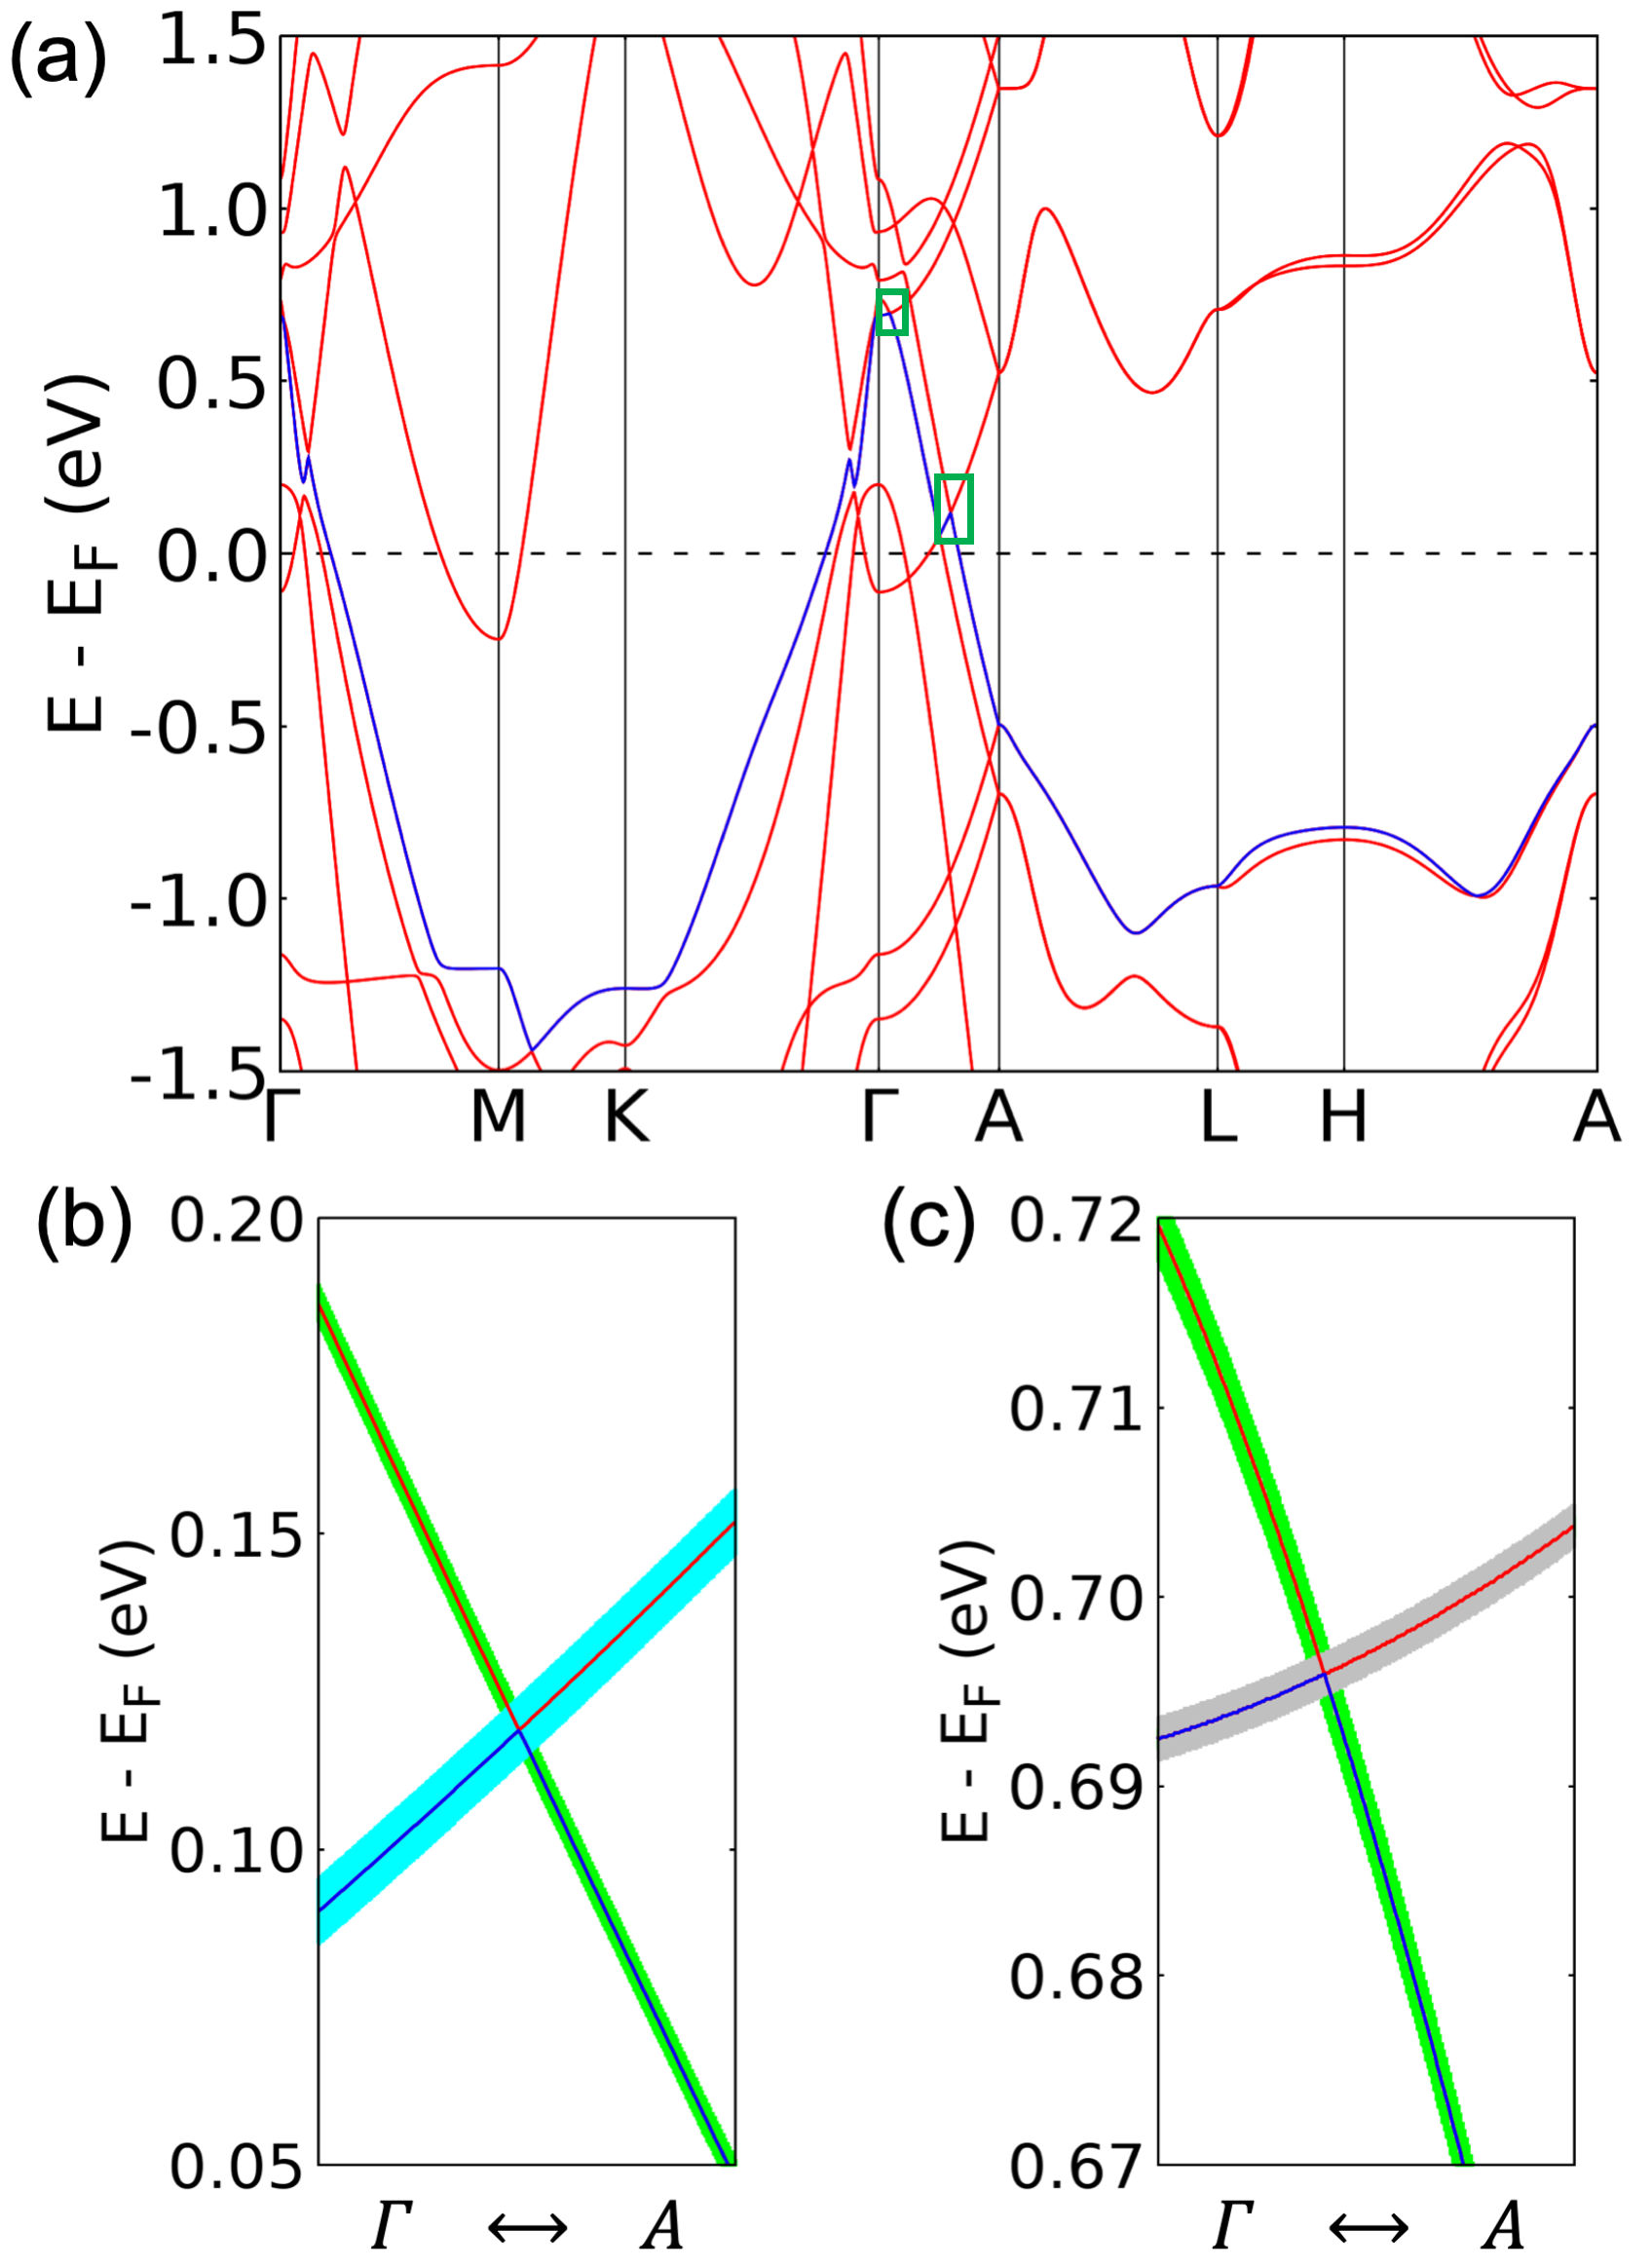
The bulk band structure of non-magnetically-ordered EuIn2, without Eu 4f orbitals, is plotted in Fig. 1(a) with the highest valence band in blue according to simple filling. The valence and conduction bands are generally well removed from the Fermi level, E, over most of the Brillouin zone except for an electron pocket at the point and the overlap between valence and conduction bands around the point. Especially along the direction, there are two gapless crossing points between the top valence and bottom conduction bands protected by the three-fold rotational symmetry and are Dirac points. As zoomed in Fig.1(b) and (c), these two Dirac points are above E and have the momentum-energy of (0, 0, ±0.24 Å-1; E+0.12 eV) and (0, 0, ±0.04 Å-1; E+0.70 eV), respectively. The lower Dirac point has a switch of orbital character between In and In , whereas the upper Dirac point is between In and Eu . Similar to EuTl2Wang et al. (2021), these Dirac points can act as the parent gapless phase to be transformed into different descendent phases, depending on the existence and nature of magnetic ordering. As such, it is of interest to know what type of magnetic structures EuIn2 hosts.
III.2 Powder X-ray Diffraction, Resistivity, and Magnetization
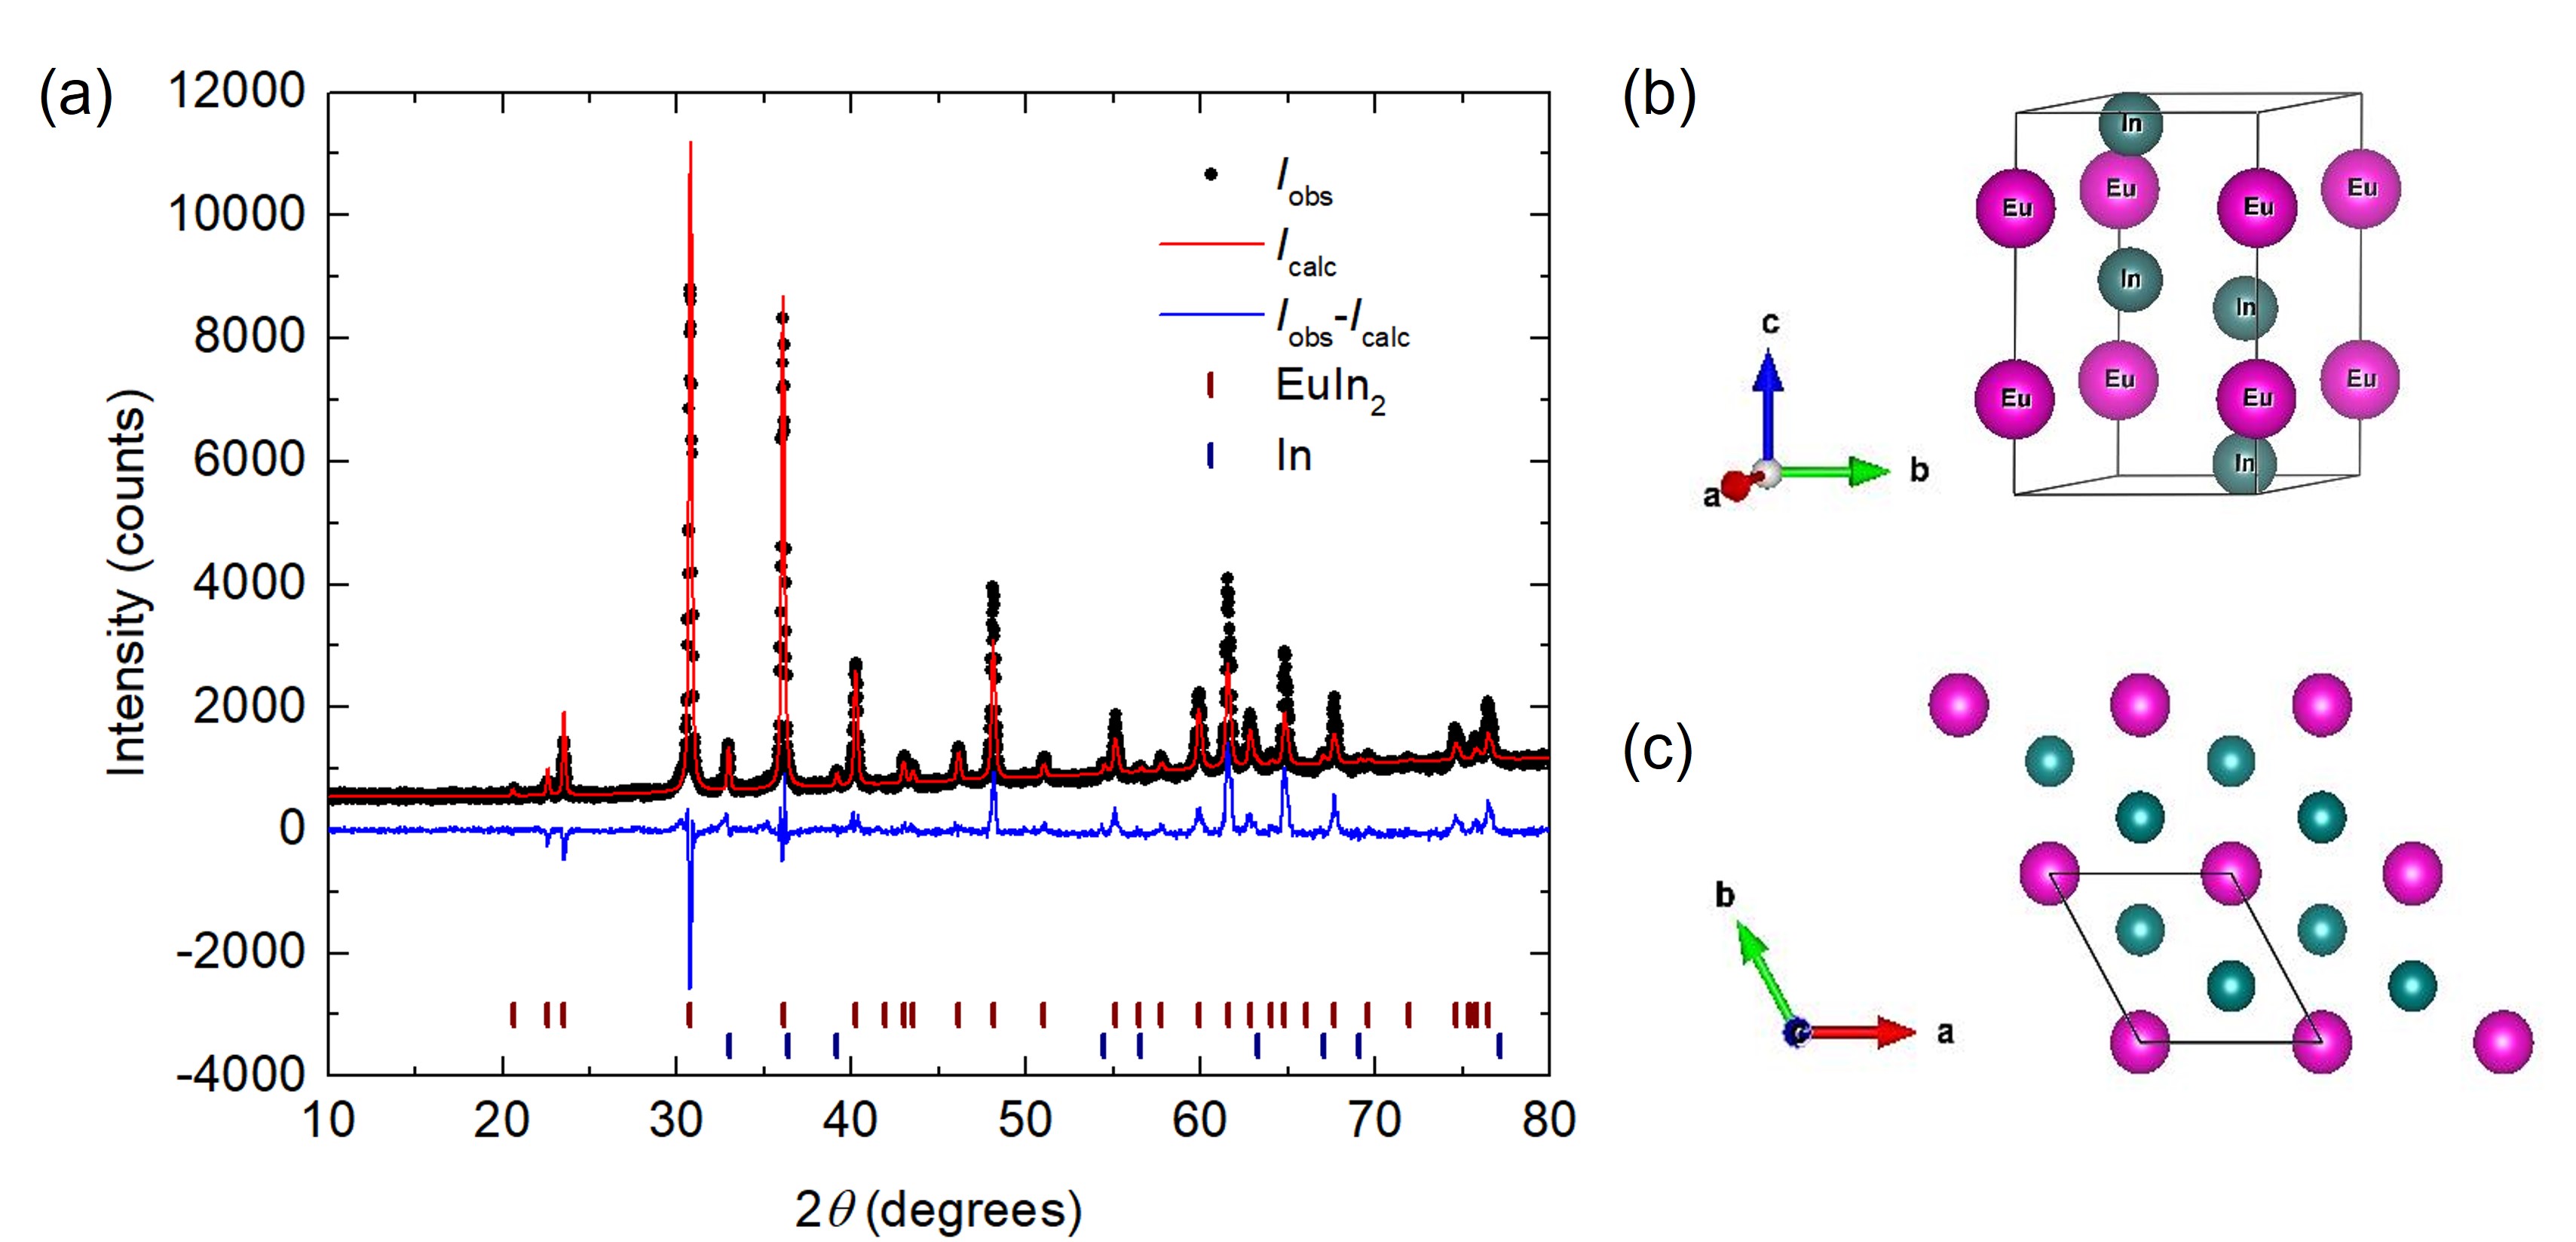
The powder x-ray diffraction pattern shown in Fig. 2(a) confirms the structure of EuIn2, with lattice parameters Å and Å obtained from Rietveld refinement (with the goodness of fit %). Some impurity peaks are present, which can be identified as In, with about 6% phase fraction of In present. Given that the EuIn2 is grown out of an excess of In, this is the expected impurity. The In most likely comes from small droplets of solidified, excess liquid that adhered to the EuIn2 crystals through the decanting step. Lattice parameters obtained from Rietveld refinement agree with the existing report Å and Å. Iandelli (1964) Figure 2(b) shows the three dimensional crystal structure of EuIn2, and (c) shows the projection along the axis. The Eu atoms form a triangular lattice in the plane, a geometry conducive to magnetic frustration.
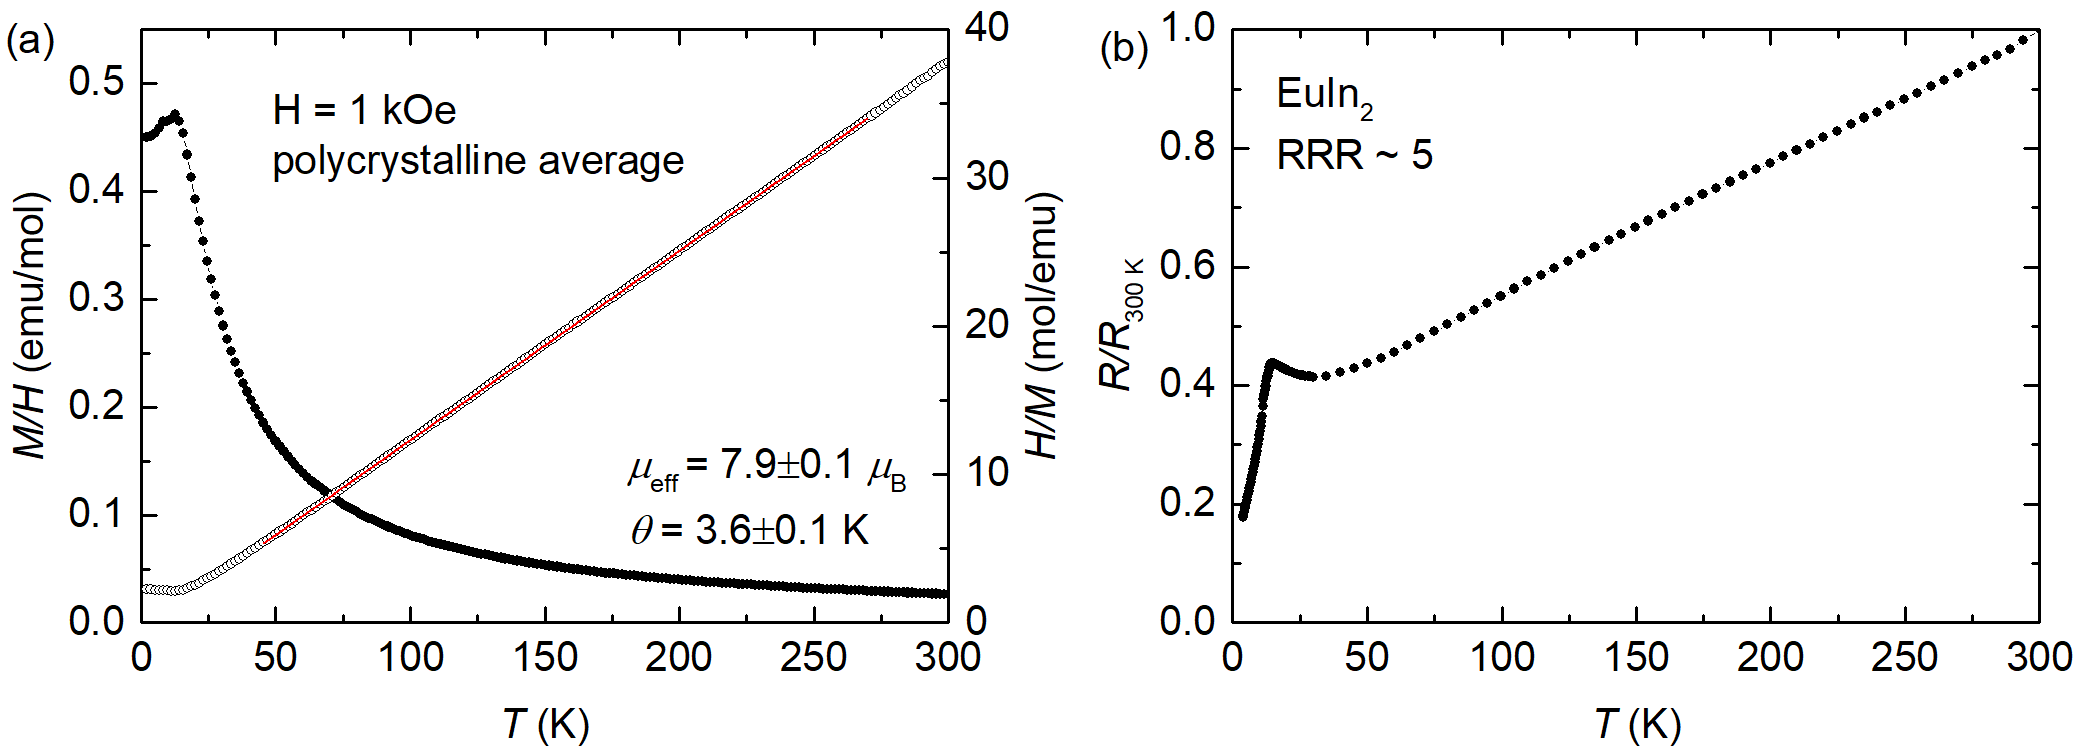
We first survey the temperature dependence of and over a wide temperature range (K K). The low-field magnetization data and the resistivity data shown in Fig. 3 and Fig. 4 are truncated at K as the In flux present becomes superconducting below this temperature which gives rise to small discontinuities. The polycrystalline average of the magnetic susceptibility was obtained using , where the subscripts ‘parallel’ and ‘perp’ denote the applied field directions and respectively. Figure 3(a) shows the polycrystalline average of plotted as a function of temperature, for an applied field of kOe. The high-temperature region shows a Curie-Weiss behavior. The right-hand axis of Fig. 3(a) shows the inverse susceptibility with a linear fit. The fitting parameters of the linear fit gave an effective moment of (consistent with the 7.94 theoretically anticipated for Eu2+) and K. Normalized electrical resistance is plotted in Fig. 3(b). The sample has a residual resistivity ratio of . The low-temperature resistivity shows a slight upturn followed by a sharp decrease due to loss of spin disorder scattering. A signature characteristic of antiferromagnetic ordering below K is clearly seen in both as well as data.
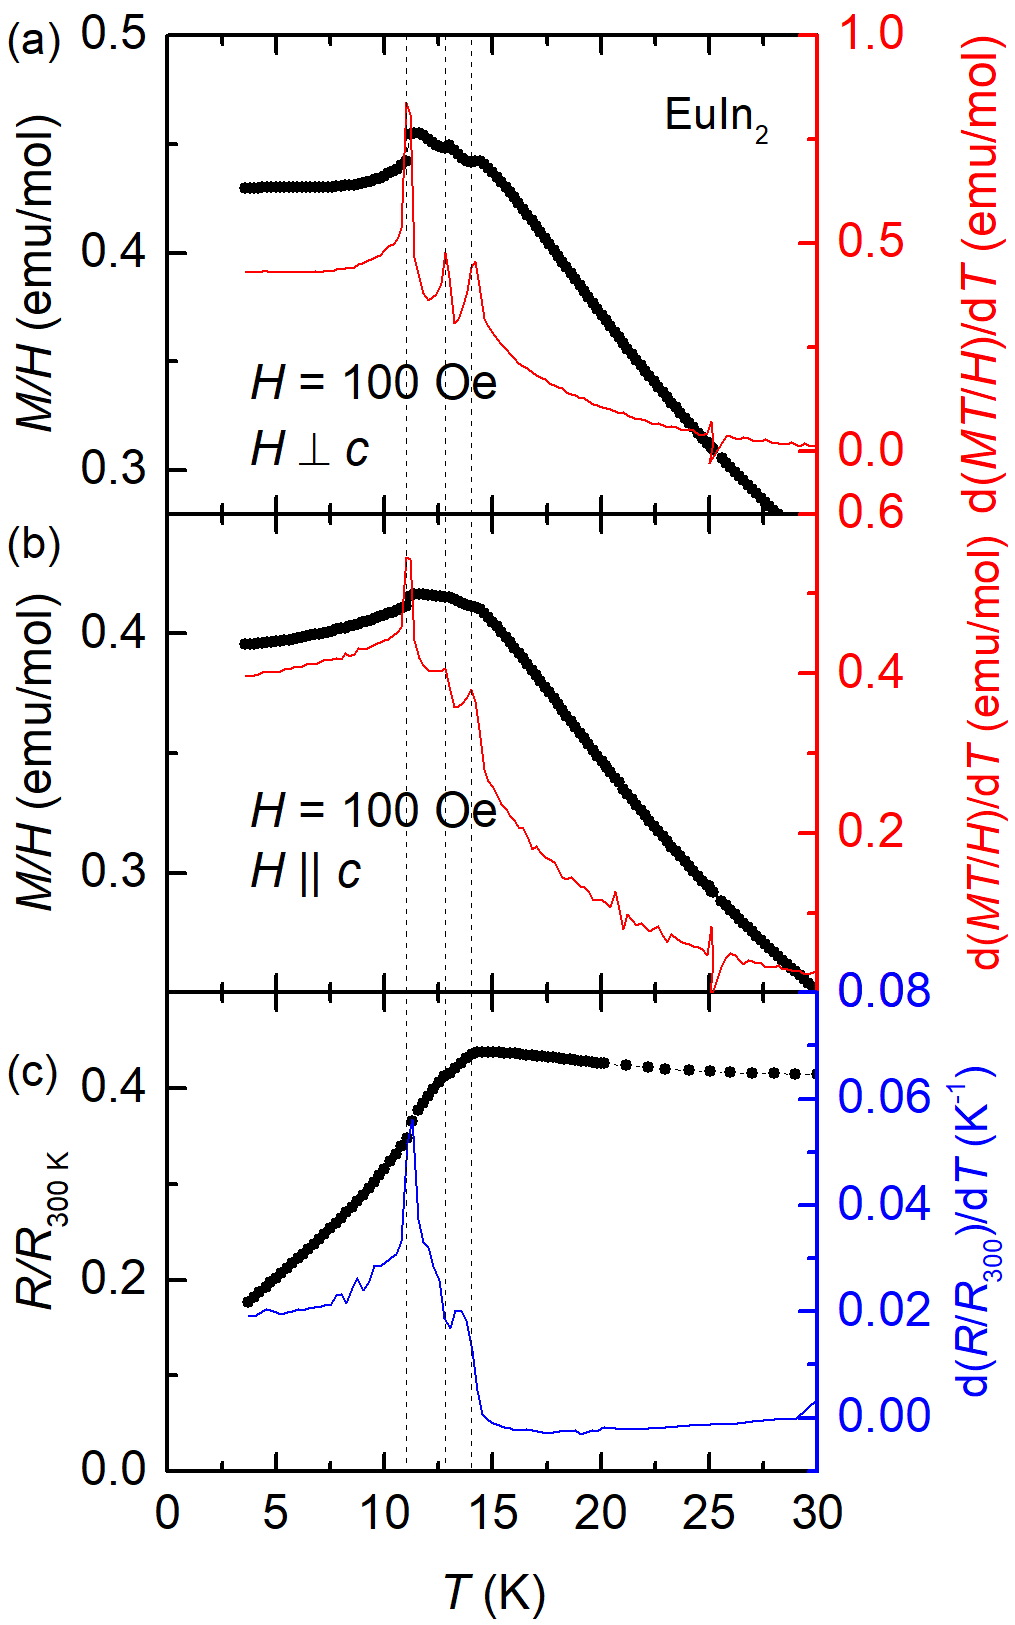
As we go to lower temperatures, we see signatures of up to three transitions in the magnetization data between K. These can be clearly seen in the anisotropic magnetic susceptibilities and resistivity along with their derivatives, shown in Fig. 4. Figure 4(a) shows magnetic susceptibility , measured under field cooling, and the temperature derivative Fisher (1962) as a function of , for an applied field of Oe, with . Similar data for is shown in Fig. 4(b). Figure 4(c) shows the normalized resistance and its temperature derivative, , Fisher and Langer (1968) on the right axis. The signatures of three transitions are seen in the derivatives of both data sets, with transition temperatures of , and K. Similar transition temperatures can be inferred from the data. Whereas the two higher temperature transitions have features consistent with second order phase transitions, the more discontinuous nature of the and data for the lowest temperature transition, along with the shape of the derivative curves, suggest that K may be associated with a first order phase transition.
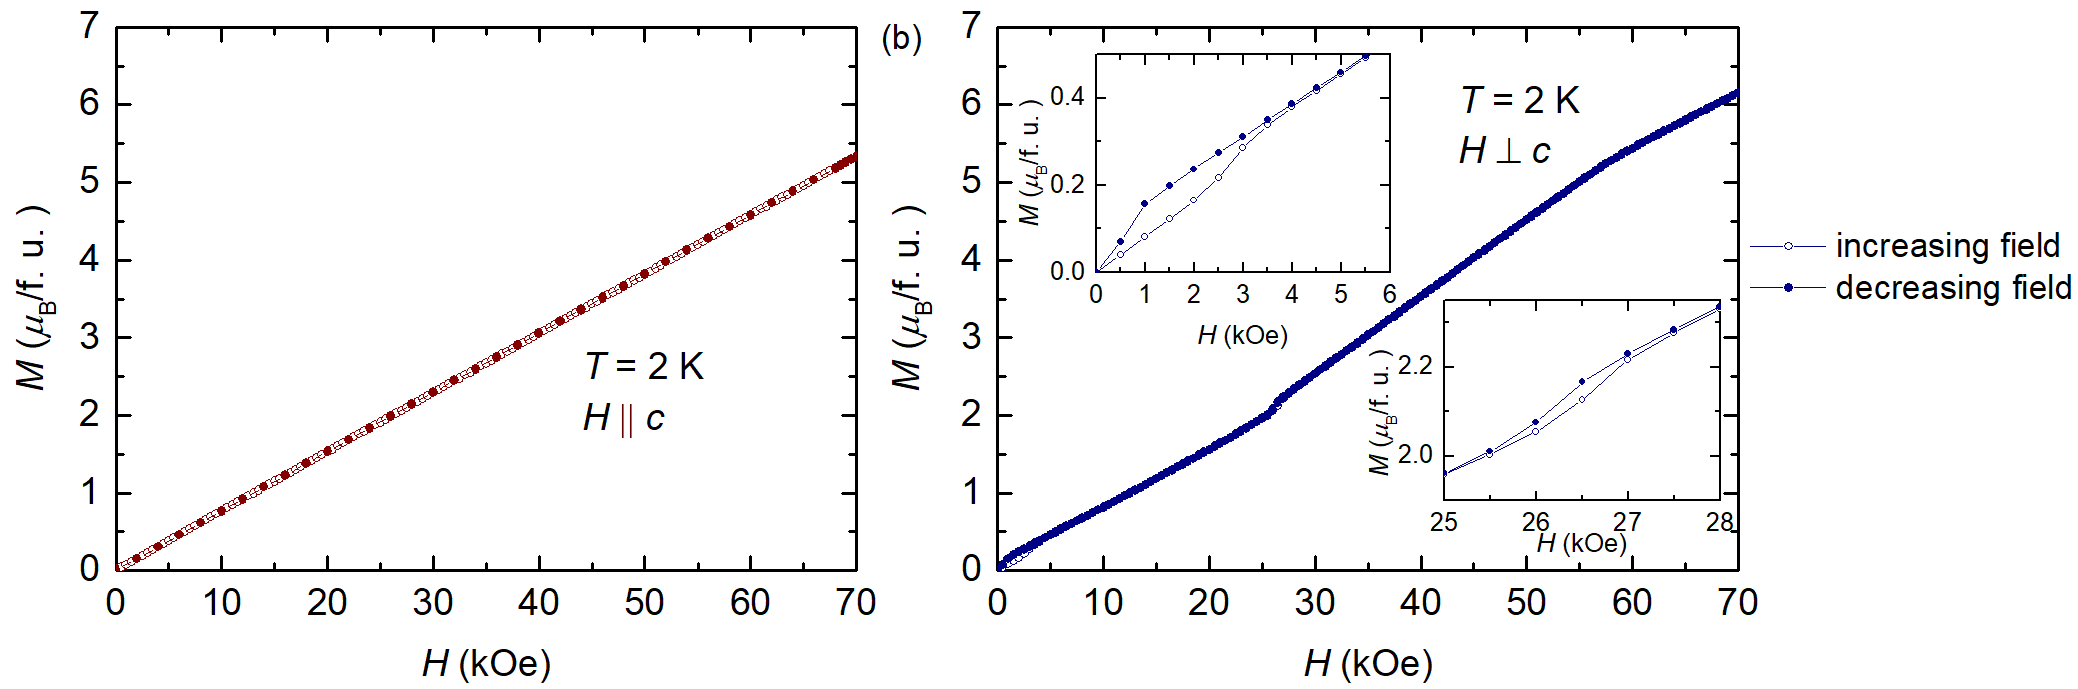
Magnetization as a function of field data for K is shown in Fig. 5(a) for and (b) for . Superconducting Indium has a critical field of Oe, at K, Shaw et al. (1960) so the effects on data are minimal. Also, In features, would be isotropic because the In is primarily in the form of tiny polycrystalline droplets or streaks adhering to the surface of the crystal. The measurement was done by cooling the sample to K in zero field and then measuring while increasing and decreasing the magnetic field. The data show linear behavior, with increasing and decreasing fields overlapping each other. On the other hand, for show subtle features corresponding to various possible spin re-orientation transitions. There is a low field, hysteretic transition between kOe, shown more clearly in the inset of Fig. 5(b). There are two more subtle features in the ; one around kOe also shows a small hysteresis [second inset of Fig. 5(b)], and another change of slope around kOe where no discernible hysteresis is observed.
III.3 Mössbauer Spectroscopy
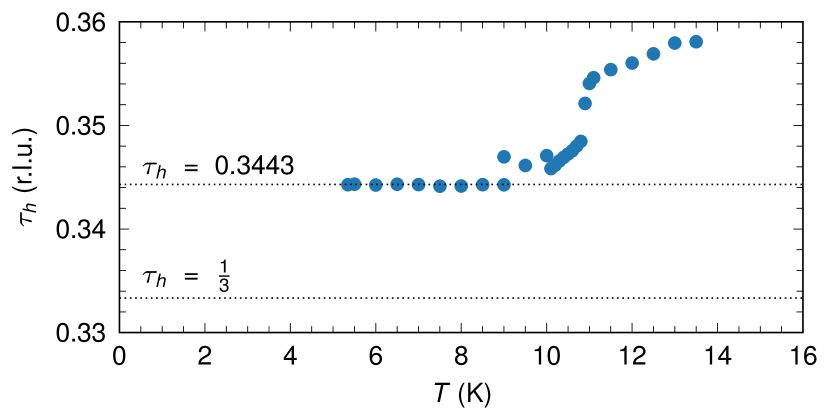
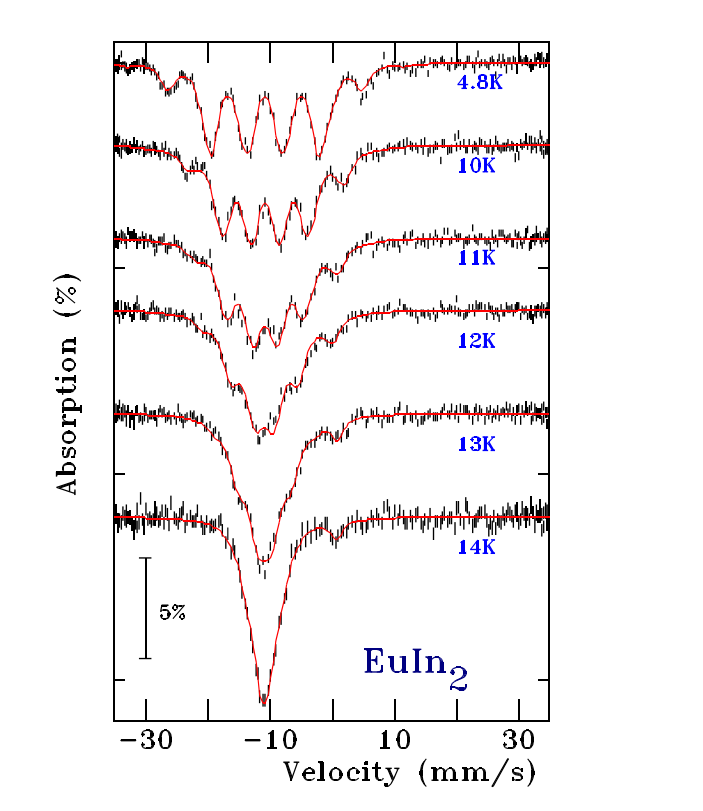
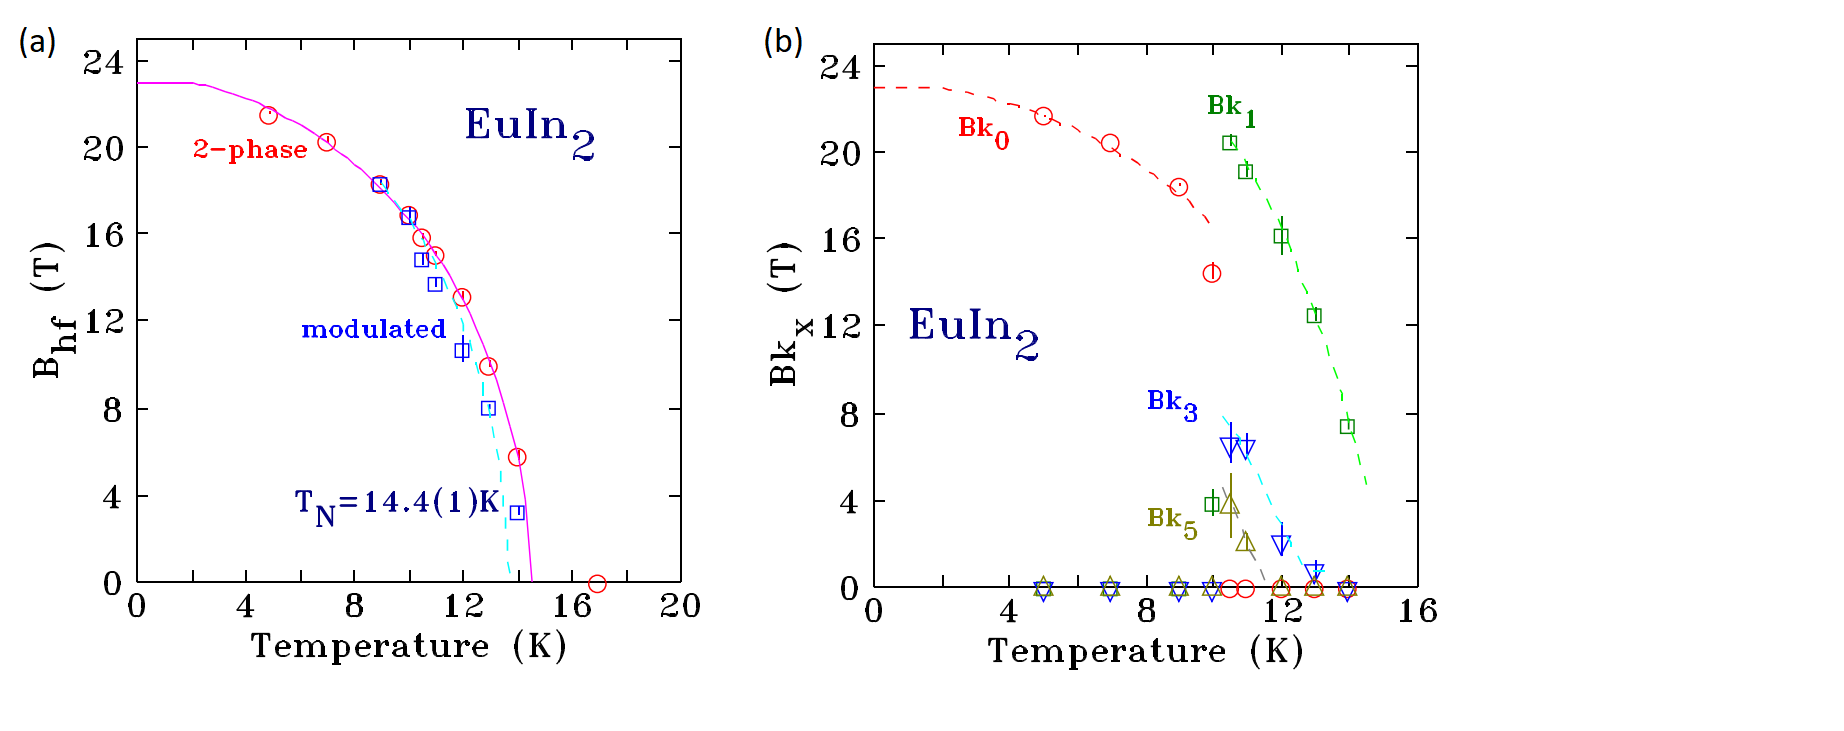
Figure 6 shows 151Eu Mössbauer spectra for EuIn2 taken at representative, low temperatures. There is a clear signature of magnetic ordering as well as the evolution of splitting as the temperature is lowered through 14 K. At 4.8 K the 151Eu Mössbauer spectrum of EuIn2 shows a well-split magnetic pattern with a hyperfine field (Bhf) of 21.5(1) T and an isomer shift of 10.74(3) mm/s, values typical for a magnetically ordered Eu2+ compound Long and Grandjean (1989)(Fig. 6 top spectrum). No information on the ordering direction within the crystallographic cell can be obtained from this spectrum as the observed quadrupole contribution, 0.0(3) mm/s is consistent with zero. On warming, the spectra show the expected narrowing as Bhf decreases, but the spectral shape also changes, developing more weight in the center. A simple two-component fit (one magnetic with a temperature dependent Bhf, the other with no magnetic splitting) models the rapidly growing central area but does not yield satisfactory fits. However, fitting the derived Bhf(T) using a J= Brillouin function provides an estimated ordering temperature of 14.4(1) K, consistent with , as shown in Fig. 7(a). We note that a 5% Eu3+ impurity is apparent in the higher temperature spectra (the weak line at 0 mm/s), which could be coming from some of the sample being oxidized, and this was included in all of the fits.
In order to fit the data with the modulated model, if we assume that the moment modulation along the direction of the propagation vector k can be written in terms of its Fourier components, and further assume that the observed hyperfine field is a linear function of the Eu moment at any given site, then the variation of Bhf with distance along the propagation vector k can be written as Bonville et al. (2001):
| (1) |
where the are the odd Fourier coefficients of the field modulation. As Bhf and Bhf are indistinguishable, only needs to run over half the modulation period, and in this case, a square-wave modulated structure can be modeled either as a sum over a very large number of Fourier coefficients or by simply using the term with all of the other set to zero. We found the fits to be far more stable with the term included rather than using a large set of , however, the two approaches are effectively equivalent. Variations of this model have also been used to fit spectra of EuPdSb Bonville et al. (2001) and Eu4PdMg. Ryan et al. (2015)
Adopting the incommensurate modulated model to analyze the spectra yields the fits shown in Fig. 6, and the temperature dependence of the derived modulation harmonics is shown in Fig. 7(b). Starting from the lowest temperature, we see that only Bk0 is present in the 4.8 K spectrum. This suggests that the ground state is a squared-up state without moment modulations. On warming above , the higher harmonics Bk5, Bk3, and Bk1 appears, indicating a modulated structure. On further warming, the higher harmonic contributions reduce, and only Bk1 survives, indicating that the order evolves towards a purely sinusoidally modulated state before the order disappears at K.
Thus, the Mössbauer results confirm that: at K is a transition to an incommensurate antiferromagnetic state. at K might be associated with the start of the process of higher harmonics developing in the modulated order, and at K marks the completion of the squaring up of the moment modulation leading to all of the europium moments being equal. Further insight into the microscopic details of the Eu ordering requires diffraction measurements.
III.4 X-ray Resonant Magnetic Scattering
We used XRMS to determine the magnetic propagation vectors associated with the multiple magnetic phases below 14 K. Data from the scans described below determined the existence of an antiferromagnetic propagation vector of . As explained earlier, all XRMS data discussed below are presented with temperature shifted by K, to account for the beam heating. This makes the features seen in XRMS coincide well with those from Mössbauer spectroscopy, magnetization and resistance measurements.
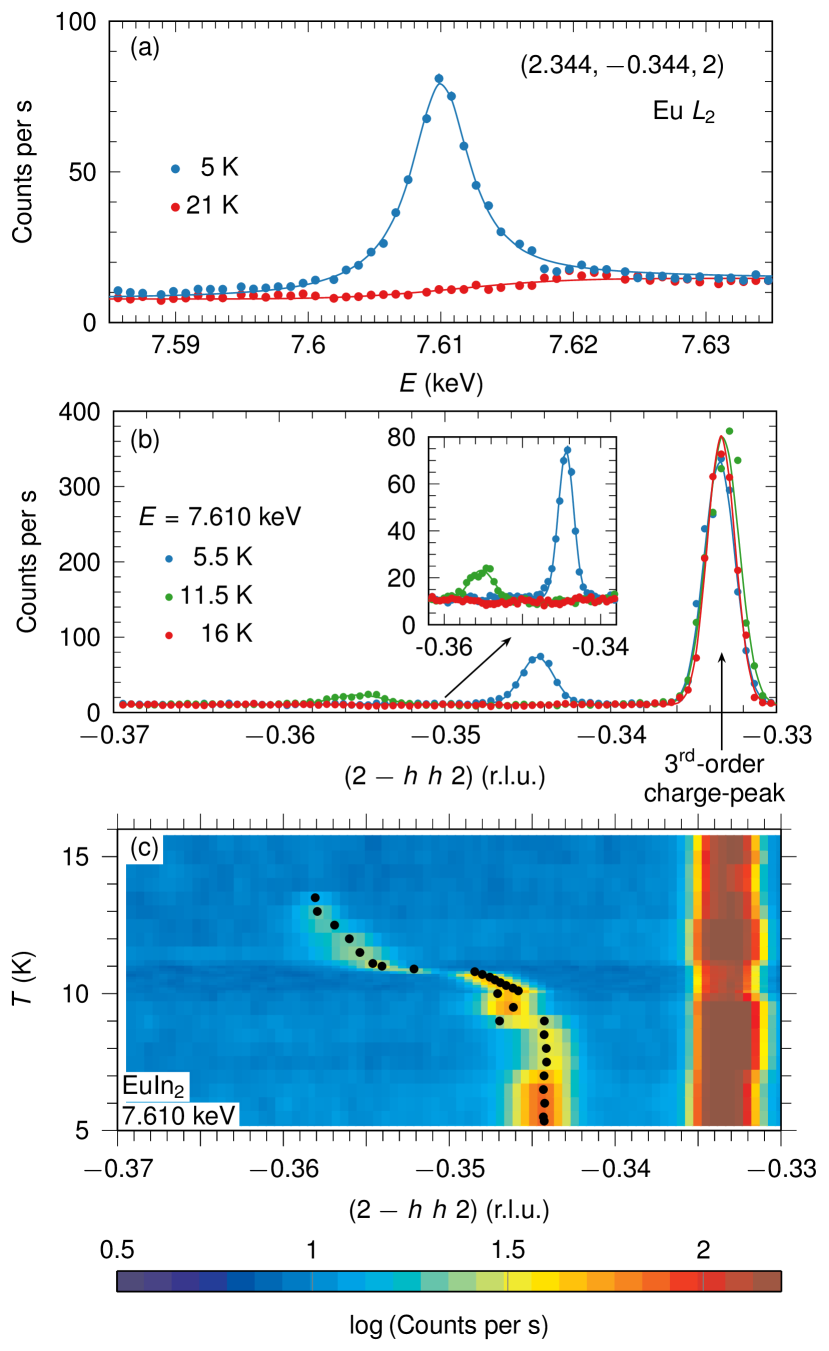
X-ray energy scans across the Eu edge were taken at K and K after aligning to the magnetic-Bragg peak of our single-crystal sample at K and are shown in Fig. 8(a). A large resonant enhancement is seen just below the absorption edge around keV for K but not for K. This is consistent with an enhancement of dipole transitions of core-level electrons to empty states due to the presence of magnetic order at K. Based on these data, we made a series of longitudinal, rocking, and other reciprocal-space scans using keV x-rays to characterize the temperature dependence of the magnetic-Bragg peaks. Figures 8(b) and (c) summarize the main results.
Figure 8(b) shows data from scans along at different temperatures. The magnetic-Bragg peak is visible for K and K, but is absent for K. Fits to gaussian lineshapes find that the magnetic-Bragg peaks are centered at r.l.u. and r.l.u. for and K, respectively. The much stronger peak appearing at r.l.u. in all three datasets is from the structural (charge) Bragg peak and arises from diffraction of x-rays with the wavelength of those corresponding to keV. This was verified by observing its negligble response to the insertion of x-ray attenuators which have a much greater effect on keV x-rays than on keV x-rays.
A more detailed temperature dependence of the magnetic-Bragg peak is given in Fig. 8(c). The sample was realigned at each temperature before making a scan. Fits using a gaussian lineshape find that the full-width at half maximum of the peak does not change with decreasing temperature but that the center moves towards . This is shown by the black dots in Fig. 8(c) and the plot in Fig. 9. The magnetic-Bragg peaks appear at K and there is a jump in at K, which is further evidence for the first order nature of the transition at , which was suggested by the derivatives of and data in Fig. 4. The temperature dependence of between K and K and its incommensurate value are consistent with the analysis of the Mössbauer data. The XRMS data indicate that locks into at low temperature which is not an obviously commensurate value. Data in Figs. 8(b) and (c) show that the center of the third-order charge-Bragg peak does not change between and K which gives an excellent reference for the precision and accuracy we claim for the XRMS data. Future neutron scattering experiments are needed to determine the details of the magnetic structure of EuIn2.
IV Conclusion
In summary, we have synthesized single crystals of EuIn2, which is a magnetic topological semimetal candidate according to DFT calculations. EuIn2 undergoes three magnetic transitions with decreasing temperatures, between K. Clear signatures of the transitions are observed both in magnetic susceptibility and electrical resistivity measurements. Furthermore, Mössbauer spectroscopy measurements suggest a squared-up, likely incommensurate ground state, evolving into a complicated modulated moment order on warming, which eventually turns into a sinusoidally modulated order before turning paramagnetic above . XRMS data indicates an antiferromagnetic ordering with an incommensurate propogation vector, which changes with decreasing temperatures below , before locking in at , through a first order transition-like jump. It will be interesting to further explore the field-temperature behavior of the various transitions and determine the magnetic structure in various phases. Exploring the effects of various magnetic transitions on electronic band topology for this compound could be promising.
Acknowledgements.
Work at the Ames National Laboratory was supported by the U.S. Department of Energy, Office of Science, Basic Energy Sciences, Materials Sciences and Engineering Division. The Ames National Laboratory is operated for the U.S. Department of Energy by Iowa State University under Contract No. DEAC0207CH11358. B.K., P.C.C., S.X.M.R., L.-L.W, B.G.U., and R.J.M. were supported by the Center for the Advancement of Topological Semimetals, an Energy Frontier Research Center funded by the U.S. DOE, Office of Basic Energy Sciences. A portion of this research used resources at the Advanced Photon Source, which is a U.S. DOE SC User Facility operated by Argonne National Laboratory under Contract No. DE-AC02-06CH11357. Financial support for this work was provided by Fonds Québécois de la Recherche sur la Nature et les Technologies, and the Natural Sciences and Engineering Research Council (NSERC) Canada. Some of this work was carried out, purely in English, while D.H.R. was on sabbatical at Iowa State University and their generous support during this visit is gratefully acknowledged.References
References
- Hsieh et al. (2008) D. Hsieh, D. Qian, L. Wray, Y. Xia, Y. S. Hor, R. J. Cava, and M. Z. Hasan, Nature 452, 970 (2008).
- Hasan and Kane (2010) M. Z. Hasan and C. L. Kane, Rev. Mod. Phys 82, 3045 (2010).
- Burkov and Balents (2011) A. A. Burkov and L. Balents, Phys. Rev. Lett. 107, 127205 (2011).
- Burkov (2016) A. Burkov, Nature Mater 15, 1145 (2016).
- Chiu et al. (2016) C.-K. Chiu, J. C. Y. Teo, A. P. Schnyder, and S. Ryu, Rev. Mod. Phys 88, 035005 (2016).
- Yan and Felser (2017) B. Yan and C. Felser, Annual Review of Condensed Matter Physics 8, 337 (2017).
- Armitage et al. (2018) N. P. Armitage, E. J. Mele, and A. Vishwanath, Rev. Mod. Phys 90, 015001 (2018).
- Tokura et al. (2019) Y. Tokura, K. Yasuda, and A. Tsukazaki, Nature Reviews Physics 1, 126 (2019).
- Wan et al. (2011) X. Wan, A. M. Turner, A. Vishwanath, and S. Y. Savrasov, Phys. Rev. B 83, 205101 (2011).
- Parameswaran et al. (2014) S. A. Parameswaran, T. Grover, D. A. Abanin, D. A. Pesin, and A. Vishwanath, Phys. Rev. X 4, 031035 (2014).
- Chan et al. (2016) C.-K. Chan, P. A. Lee, K. S. Burch, J. H. Han, and Y. Ran, Phys. Rev. Lett. 116, 026805 (2016).
- Jia et al. (2016) S. Jia, S.-Y. Xu, and M. Z. Hasan, Nature Materials 15 (2016).
- Chan et al. (2017) C.-K. Chan, N. H. Lindner, G. Refael, and P. A. Lee, Phys. Rev. B 95, 041104(R) (2017).
- Shekhar et al. (2018) C. Shekhar, N. Kumar, V. Grinenko, S. Singh, R. Sarkar, H. Luetkens, S.-C. Wu, Y. Zhang, A. C. Komarek, E. Kampert, et al., Proceedings of the National Academy of Sciences 115, 9140 (2018).
- Zhang et al. (2019) S.-L. Zhang, A. A. Burkov, I. Martin, and O. G. Heinonen, Phys. Rev. Lett. 123, 187201 (2019).
- May et al. (2014) A. F. May, M. A. McGuire, and B. C. Sales, Phys. Rev. B 90, 075109 (2014).
- Soh et al. (2019) J.-R. Soh, P. Manuel, N. M. B. Schröter, C. J. Yi, F. Orlandi, Y. G. Shi, D. Prabhakaran, and A. T. Boothroyd, Phys. Rev. B 100, 174406 (2019).
- Jo et al. (2020) N. H. Jo, B. Kuthanazhi, Y. Wu, E. Timmons, T.-H. Kim, L. Zhou, L.-L. Wang, B. G. Ueland, A. Palasyuk, D. H. Ryan, et al., Phys. Rev. B 101, 140402(R) (2020).
- Pakhira et al. (2020) S. Pakhira, M. A. Tanatar, and D. C. Johnston, Phys. Rev. B 101, 214407 (2020).
- Riberolles et al. (2021) S. X. M. Riberolles, T. V. Trevisan, B. Kuthanazhi, T. W. Heitmann, F. Ye, D. C. Johnston, S. L. Bud’ko, D. H. Ryan, P. C. Canfield, A. Kreyssig, et al., Nature Communications 12 (2021).
- Wang et al. (2021) L.-L. Wang, H. C. Po, R.-J. Slager, and A. Vishwanath, Phys. Rev. B 104, 165107 (2021).
- Gati et al. (2021) E. Gati, S. L. Bud’ko, L.-L. Wang, A. Valadkhani, R. Gupta, B. Kuthanazhi, L. Xiang, J. M. Wilde, A. Sapkota, Z. Guguchia, et al., Phys. Rev. B 104, 155124 (2021).
- Iandelli (1964) A. Iandelli, Zeitschrift für anorganische und allgemeine Chemie 330, 221 (1964).
- Yatsenko et al. (1983) S. P. Yatsenko, V. M. Zolotarev, and E. G. Fedorova, Russian Metallurgy 2, 168 (1983).
- Canfield and Fisk (1992) P. C. Canfield and Z. Fisk, Philosophical Magazine B 65, 1117 (1992).
- Canfield et al. (2016) P. C. Canfield, T. Kong, U. S. Kaluarachchi, and N. H. Jo, Philos. Mag. 96, 84 (2016).
- Canfield (2020) P. C. Canfield, Rep. Progr. Phys. 83, 016501 (2020).
- Okamoto (2016) H. Okamoto, Eu-In (Europium-indium), ASM Alloy Phase Diagrams Database (ASM International: Materials Park, OH, 2016), URL http://www.asminternational.org.
- Toby and Von Dreele (2013) B. H. Toby and R. B. Von Dreele, Journal of Applied Crystallography 46, 544 (2013).
- Voyer and Ryan (2006) C. J. Voyer and D. H. Ryan, Hyperfine Interact. 170, 91 (2006).
- Bonville et al. (2001) P. Bonville, J. A. Hodges, M. Shirakawa, M. Kasaya, and D. Schmitt, Eur. Phys. J. B 21, 349 (2001).
- Maurya et al. (2014) A. Maurya, P. Bonville, A. Thamizhavel, and S. K. Dhar, Journal of Physics: Condensed Matter 26, 216001 (2014).
- Solé et al. (2007) V. Solé, E. Papillon, M. Cotte, P. Walter, and J. Susini, Spectrochimica Acta Part B: Atomic Spectroscopy 62, 63 (2007).
- Hohenberg and Kohn (1964) P. Hohenberg and W. Kohn, Phys. Rev. 136, B864 (1964).
- Kohn and Sham (1965) W. Kohn and L. J. Sham, Phys. Rev. 140, A1133 (1965).
- Perdew et al. (1996) J. P. Perdew, K. Burke, and M. Ernzerhof, Phys. Rev. Lett. 77, 3865 (1996).
- Kresse and Furthmüller (1996) G. Kresse and J. Furthmüller, Phys. Rev. B 54, 11169 (1996).
- Kresse and Furthmüller (1996) G. Kresse and J. Furthmüller, Computational Materials Science 6, 15 (1996).
- Blöchl (1994) P. E. Blöchl, Phys. Rev. B 50, 17953 (1994).
- Monkhorst and Pack (1976) H. J. Monkhorst and J. D. Pack, Phys. Rev. B 13, 5188 (1976).
- Fisher (1962) M. E. Fisher, The Philosophical Magazine 7, 1731 (1962).
- Fisher and Langer (1968) M. E. Fisher and J. S. Langer, Phys. Rev. Lett. 20, 665 (1968).
- Shaw et al. (1960) R. W. Shaw, D. E. Mapother, and D. C. Hopkins, Phys. Rev. 120, 88 (1960).
- Long and Grandjean (1989) G. Long and F. Grandjean, eds., Mössbauer Spectroscopy Applied to Inorganic Chemistry, Modern Inorganic Chemistry 3 (Plenum Press NY, 1989).
- Ryan et al. (2015) D. H. Ryan, A. Legros, O. Niehaus, R. Pöttgen, J. M. Cadogan, and R. Flacau, J. Appl. Phys. 117, 17D108 (2015).