∎
e1e-mail: leedh@post.kek.jp \thankstexte2e-mail: jungsicpark@knu.ac.kr
Study on the accidental background of the JSNS2 experiment
Abstract
JSNS2 (J-PARC Sterile Neutrino Search at J-PARC Spallation Neutron Source) is an experiment which searches for sterile neutrinos via the observation of appearance oscillations using muon decay-at-rest neutrinos. The data taking of JSNS2 have been performed from 2021. In this manuscript, a study of the accidental background is presented. The rate of the accidental background is (9.29 / spill with 0.75 MW beam power and comparable to the number of searching signals.
1 Introduction
The existence of sterile neutrinos has been a crucial issue in the neutrino physics for over 20 years. The experimental results from cite:LSND ; cite:GALLEX ; cite:SAGE ; cite:RA ; cite:MiniBooNE2013 ; cite:MiniBooNE2018 could be interpreted as indications of the existence of sterile neutrinos with mass-squared differences of around 1 .
The JSNS2 experiment, proposed in 2013 cite:proposal , is designed to search for neutrino oscillations caused by such a sterile neutrino at the Material and Life science experimental Facility (MLF) in J-PARC. MLF provides an intense and high-quality neutrino beam with /year/cm2 from muon decay-at-rest (DAR) produced using a 1 MW proton beam with a 25 Hz repetition rate cite:TDR . The neutrino source is produced by injecting 3 GeV protons from a rapid cycling synchrotron on a mercury target in the MLF. The experiment uses a Gadolinium (Gd) loaded liquid scintillator (Gd-LS) detector with 0.1 w% Gd concentration placed at 24 m from the target.
The JSNS2 experiment aims to perform a direct test of the LSND observation cite:LSND with improvements of the experimental technique. Observing oscillation using a DAR neutrino source via inverse beta decay (IBD) reaction, , is the same experimental principle used by the LSND experiment cite:LSND . On the other hand, there are several improvements offered by the JSNS2 experiment. In order to identify IBD events, a delayed coincidence between the positron signal (prompt signal: up to 53 MeV) and neutron capture signal is used for selection. Gd is used to identify neutron captures. After capturing thermal neutrons, Gd generates gamma-rays with higher energies and shorter capture times (8 MeV, s) than hydrogen (2.2 MeV, s). Therefore, backgrounds accidentally coincident in the delayed signal region can be reduced by times compared to the hydrogen capture used in the LSND experiment, due to the shorter capture time. In addition, the short-pulsed beam, 100 ns width double pulses in 600 ns interval in each spill with a repetition of 25Hz, enables us to set a timing window for the IBD prompt signal as 2.0 to 10 from the proton beam collision so that the neutrinos from pion and kaon decay and fast neutrons generated at the target can be rejected efficiently. However, the efficiency for the DAR neutrinos can be kept at 48% because of the muon lifetime (). The cosmogenic background is also reduced by a factor of .
For JSNS2 , understanding the accidental background is essential since it is one of main backgrounds for the sterile neutrino searches. Another main important background is described in cite:EPJC_Hino . Detailed discussion about the signal detection principle and the background rejection technique can be found in cite:proposal ; cite:TDR .
2 Setup
The JSNS2 experiment performed data taking with a single detector from 2021. Except for the beam maintenance period, which corresponds to a few months in summer typically, the data have been accumulated. The proton beam power have been increased from 600 to 840 kW from 2021 to 2023. There have been a one-day beam-off period per one week due to facility maintenance even during the beam period, and thus we obtained beam-off data at that time. The integrated number of proton-on-target (POT) collected was , corresponding to less than 28.0% of the required POT of the JSNS2 experiment.
To understand the rate and properties of the accidental background, the dedicated calibration data were taken. The accelerator scheduled timing was used for the trigger cite:daq ; cite:detector , and the 125 s time window for FADC is opened with no energy bias. The total available number of spills is 2.46 , therefore the expected number of IBD signal events from this calibration run is estimated to be much less than 1 cite:TDR . Therefore, all observed events are likely background.
2.1 Experimental setup
The JSNS2 detector is a cylindrical liquid scintillator detector with 4.6 m diameter and 3.5 m height located at a distance of 24 m from the mercury target of the MLF. It consists of 17 tonnes of Gd-LS contained in an acrylic vessel, and 33 tonnes unloaded liquid scintillator (LS) in a layer between the acrylic vessel and a stainless steel tank. The LS and the Gd-LS consist of LAB (linear alkyl benzene) as the base solvent, 3 g/L PPO (2,5-diphenyloxazole) as the fluor, and 15 mg/L bis-MSB (1,4-bis(2-methylstyryl) benzene) as the wavelength shifter. The LS volume is separated into two independent layers by an optical separator that forms two detector volumes in the one detector. The region inside the optical separator, called the ”inner detector”, consists of the entire volume of the Gd-LS and 25 cm thick LS layer. Scintillation light from the inner detector is observed by 96 Hamamatsu R7081 photomultiplier tubes (PMTs) each with a 10-inch diameter. The outer layer, called the ”veto layer”, is used to detect cosmic-ray induced particles coming into the detector. A total of 24 of 10-inch PMTs are set in the veto layer whose inner surfaces are fully covered with reflection sheets in order to improve the collection efficiency of the scintillation light.
2.2 Data acquisition system and triggers
PMT signal waveforms from both the inner detector and the veto layer are digitized and recorded at a 500 MHz sampling rate by 8-bit flash analog-to-digital converters (FADCs). As a trigger, we utilize a 25 Hz periodic signal from the accelerator scheduled timing which directs the proton beam towards the MLF target, called the ”kicker trigger”. The width of the acquired waveform in this trigger scheme is set to 125 , which fully covers the prompt and delayed signal timing window of the IBD events. The rate limitation of the JSNS2 data acquisition system under this condition is 5 Hz, thus the factor of 5 of the pre-scale is necessary. We mainly used this trigger and data acquisition to obtain the beam-on data for an accidental background estimation within the sterile neutrino search.
Detailed description of the detector and the triggers are given in cite:detector ; cite:daq , respectively.
3 Event selection
The data set used for the background estimation was obtained using the kicker trigger. The total number of beam spills was 2460399, equivalent to 6 days of data taking with a pre-scale factor of five. Since the obtained waveforms, given the 125 width, contain multiple events, we therefore used an event definition based on the number of hit PMTs in order to extract each event. We constructed a hit time and charge series at each trigger by accumulating hit information along the FADC window with 60 ns coincidence width over all the PMTs. The coincidence width was determined by considering a typical PMT pulse shape and a safety factor from timing calibration. The event discrimination threshold is set to 10 hits and 50 p.e., which corresponds to an energy well below 1 MeV.
The event vertex position and energy reconstruction is performed simultaneously based on a maximum-likelihood algorithm using the charge response of each PMT. Both vertex position and energy were calibrated by deploying a 252Cf source and using the 8 MeV peak in the energy spectrum resulting from thermal neutron capture on Gd (nGd). The reconstruction performance can be found in cite:PAC31 for nGd events and cite:HJKPS2020 for events with up to 60 MeV using Michel electrons.
The selection criteria and estimated efficiency are given in Table 1 and a more detailed description is found in cite:TDR . The single rates of the prompt and the delayed candidates are separately estimated using the energy and the timing selections shown in Table 1. Note that a time difference from the beam collision timing, is used for the delayed single rate calculation instead of the selection in Table 1. These single rates with multiplying them are utilized to predict the number of the accidental background. The fiducial volume is defined with cm and 100 cm region to avoid the incoming particles to the target volume. Note that the origin of the x. y, z coordination is the center of the detector, and is defined as .
| Requirement | Efficiency /% |
|---|---|
| 48 | |
| MeV | 92 |
| MeV | 71 |
| 93 | |
| cm | 96 |
| cm | 98 |
| Pulse Shape Discrimination | 99 |
| Timing likelihood | 91 |
| Total | 25 |
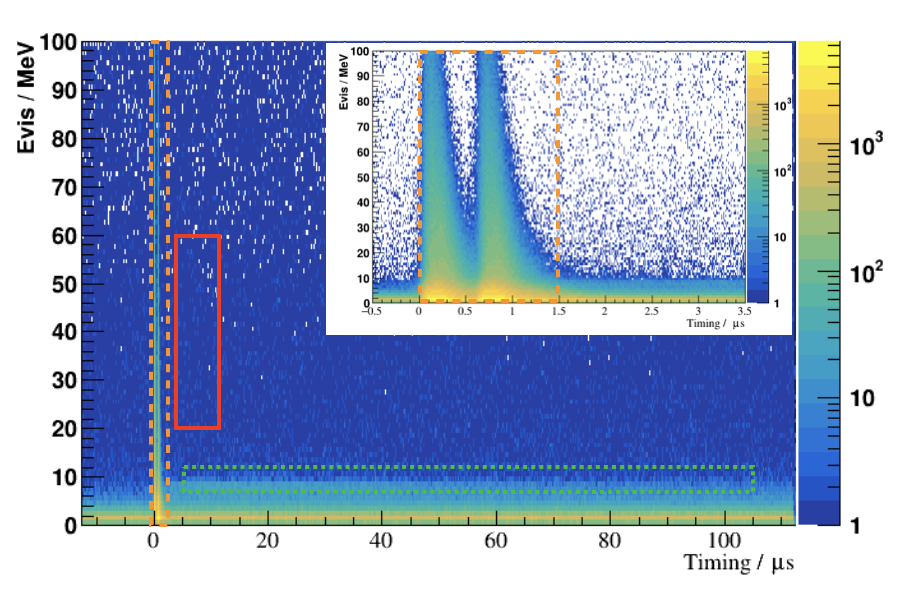
The prompt IBD candidates is selected using a time difference from the beam collision timing () and its energy (). We applied the following requirements; and MeV, in order to fully cover DAR neutrinos from the mercury target. The timing selection rejects beam-induced fast neutrons in the beam on-bunch timing () as well as neutrino backgrounds from kaon and pion decay whose lifetimes are 12 ns and 26 ns, respectively.
In order to identify neutron captures on Gd, the 8 MeV peak of the delayed signal energy () is selected using a requirement of MeV cite:SRBG . There are nGd events associated with fast neutrons induced by the beam contributing to the IBD delayed candidates as an accidental background cite:BG2014 . Because these nGd events spatially correlate with an activity made by beam-induced fast neutrons, we can reject them with the spatial correlation. In particular, we applied a requirement on the spatial difference between on-bunch event and delayed candidates, cm. The distribution of and the efficiency estimation can be found in cite:SRBG . The on-bunch event tagging condition is set to and MeV.
Figure 1 demonstrates the energy and timing selection windows in a two-dimensional distribution of energy and timing. The red and green boxes represent the prompt and delayed signal regions. The beam on-bunch event are also defined as an orange dashed box.
The events induced from muons or incoming particles from outside are rejected from both prompt and delayed candidates by the veto region of the detector. The events which have more than 30 photo-electron (p.e.) of a total charge of top-side 12 PMTs or 40 p.e. for the bottom-side 12 PMTs are rejected.
The decayed Michel electrons (ME) from muons are also crucial background. The IBD candidates are rejected if parent muons are found during 10 s before the candidate. The events which have more than 100 p.e. for the top 12 or bottom 12 PMTs are categorized as parent muons except for the beam timing. At the beam timing, there are a lot of incoming neutrons induced by beam, therefore the definition of parent muons are changed. The energy of neutrons induced by beam are less than 200 MeV, and the neutrons occasionally create the scintillation light both in the veto and target regions. The equation, , is used to define the parent muons of Michel electrons during the beam timing, where is the deposited energy in the target and catcher regions, and is the total charge of veto region with p.e. unit. ”” converts p.e. to MeV units in the equation. For example, = 9 p.e. corresponds to 1 MeV in the veto region.
The distributions of (a), (b) and from beam (c), from beam (d) after applying the IBD selection are shown in Fig. 2, respectively.
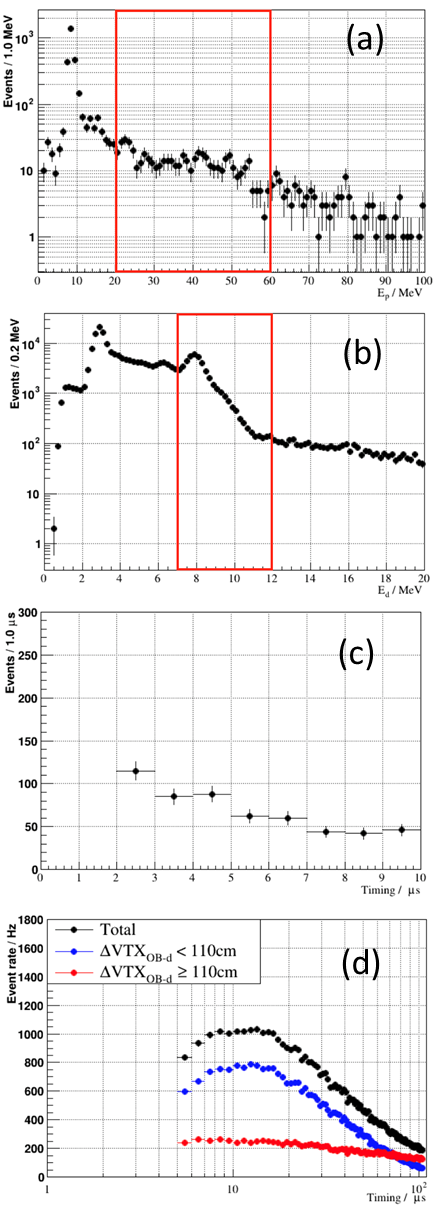
The single rates of the IBD prompt and the delayed candidates are (2.200.08) / spill and (1.800.01) / spill, respectively. Figure 2 (d) shows that the spatial correlation rejection between beam neutrons and delayed candidates () works well.
4 Beam on-off comparison of single rates
The comparison of single rates between during beam-on and beam-off are also performed. The beam-off data is also taken using the the kicker trigger with 125 , and the IBD event selection is identical to that in beam-on data. The total number of the beam-off spills is 466,348, which is equivalent to about 1 day of data taking. Table 2 shows the comparison of the IBD prompt and delayed candidates.
| Beam power | prompt Rate / spill | Delayed rate / spill |
|---|---|---|
| 0 (beam off) | (1.850.20) | (3.980.09) |
| 750 kW | (2.200.08) | (1.800.01) |
This result shows the rate of the IBD prompt background are independent from the beam power, which indicates that the cosmic ray induced particles are dominated in this region. On the other hand, that of the delayed background has large dependence of the beam.
5 Accidental background rates
The accidental background rate is evaluated with multiplying the single rates as follows:
| (1) |
where, is the accidental background rate (/spill), is the single rate of the IBD prompt candidates (/spill) and is that of delayed candidate. If the additional selections are applied, the selection efficiency to the accidental background () should be also multiplied. As shown in Table 1, the spatial correlation selection between the prompt and delayed candidates, , and timing likelihood should also be considered. In this manuscript, only the spatial correlation cut is described. The likelihood will be considered with different manuscript in future.
5.1 Spill shift method
In order to evaluate the efficiency of of the pure accidental uncorrelated background, the novel technique is invented, which we call ”spill shift method”. With the same beam spill, the correlated background is dominated as discussed in cite:EPJC_Hino , however only accidental background is caught if we use the different beam spill: Once the IBD prompt candidate in one spill is found, the different beam spills are analysed to find the paired delayed candidates. At first, the next beam spill of the spill which have the IBD prompt candidate are used. At second, the beam spill which is different by two spills from the spill with IBD prompt candidate is used. This process is repeated from 1 to 10,000 next spills to get higher statistics. Figure 3 shows the cartoon which shows the principle of the spill shift in the case of 1 spill shift.
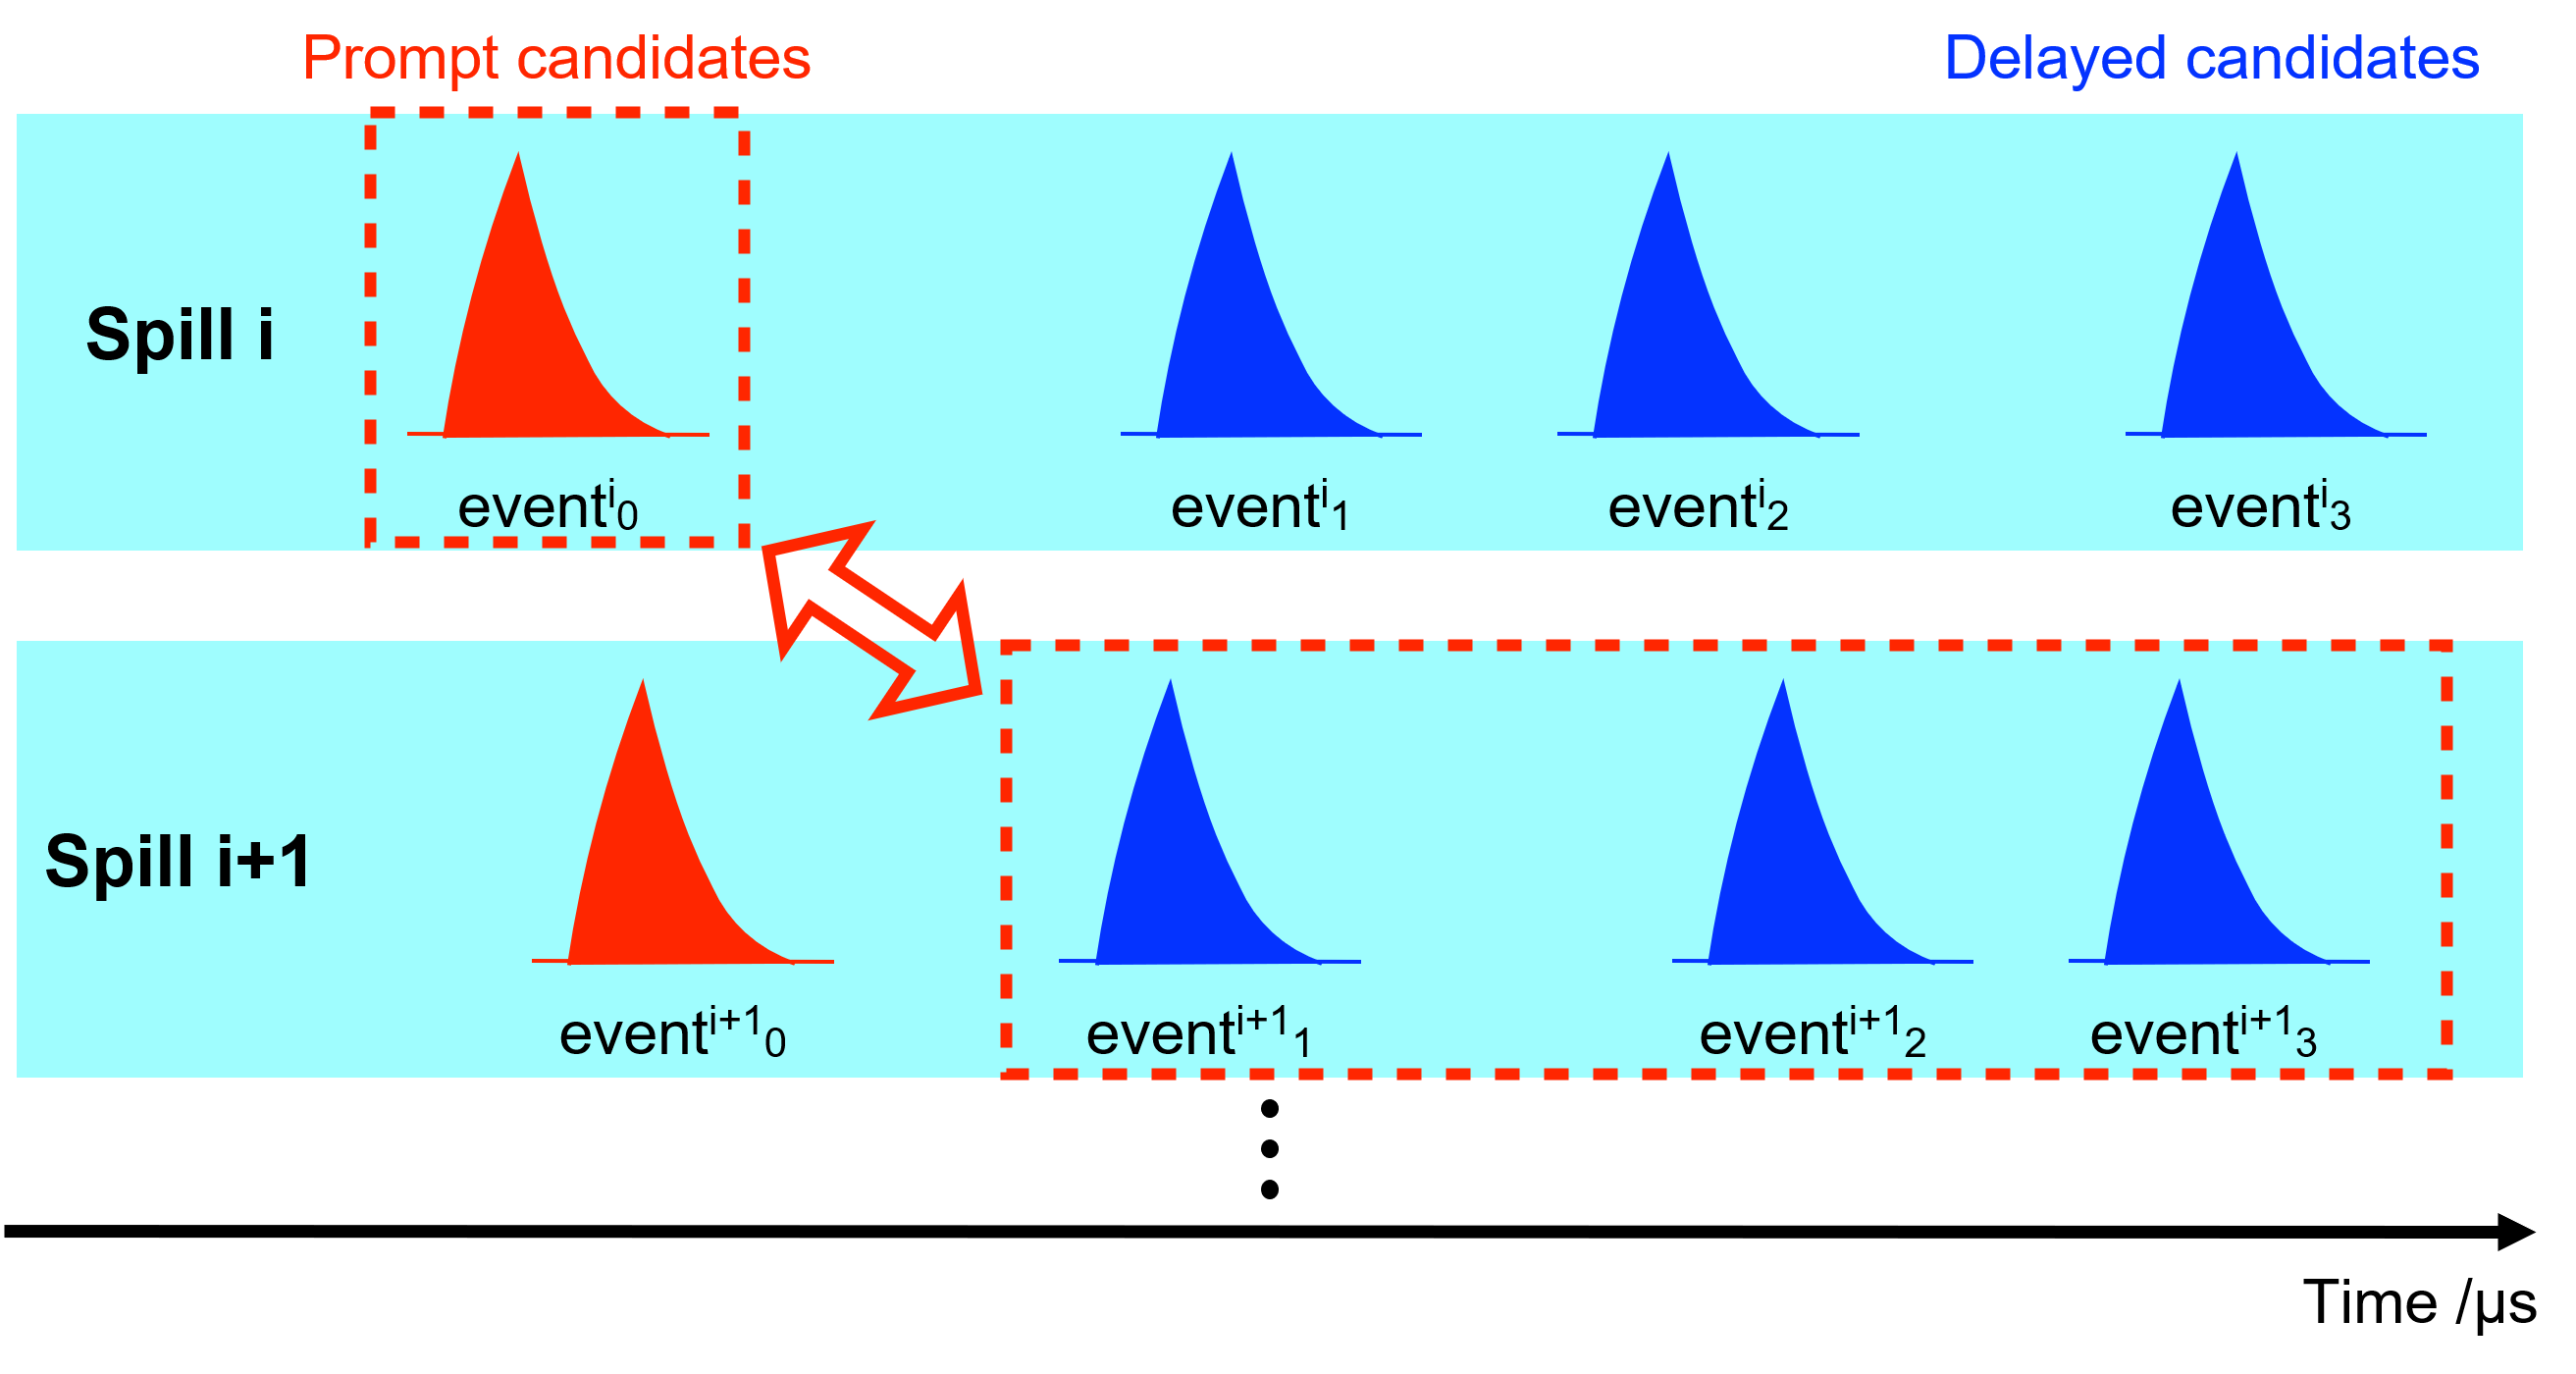
Figure 4 (a) shows the estimated distribution.
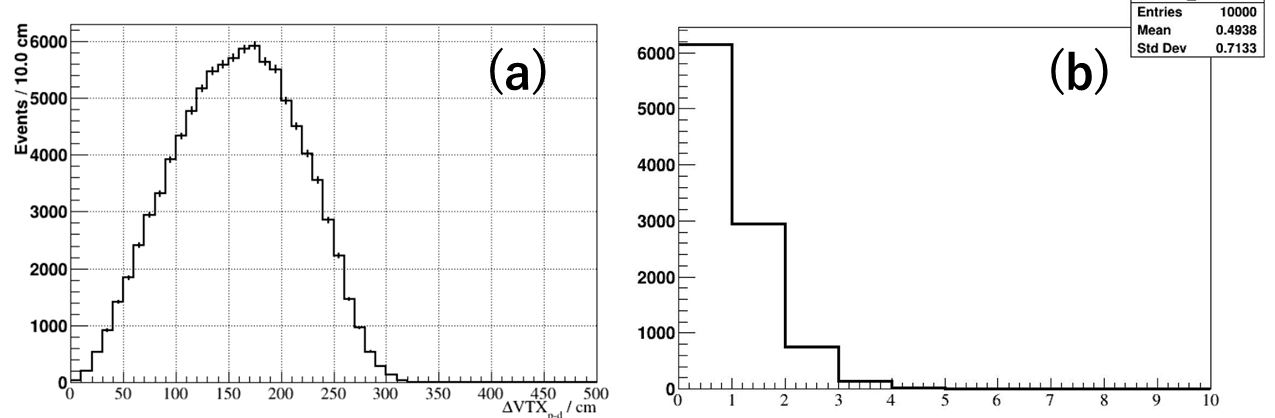
The estimated efficiency of the 60 cm cut is 5.1.
This spill shift method can also be utilized to estimate the rate of the accidental background independently from single rates method. Figure 4 (b) shows the number of accidentally paired background events in each spill shift cases (1,2, … 10,000 spills shift) during 2,460,399 spills after the cut. The mean of Poisson distribution is 0.494 events over 2,460,399 spills.
5.2 Rate comparisons
The expected accidental background rate is (9.29 / spill / 0.75MW using the equation 1. The single rates, the spatial correlation cut efficiency mentioned above and the efficiency of timing likelihood (46%) written in cite:TDR are used. The expected rate from the spill shift method (Fig. 4 (b)) is 9.24 / spill / 0.75MW, which is consistent with the single rate method. The expected oscillation IBD signal rate is 4.59 / spill / MW cite:TDR with the LSND best fit oscillation parameters. This signal rate is one of benchmark number to be compared. JSNS2 has a comparable accidental background rate as the neutrino oscillation signal if exists.
6 Summary
JSNS2 aims to perform direct test of the positive result of the LSND experiment using a decay-at-rest neutrino source at the MLF and a Gd-LS detector. We started data taking from 2021.
The calibration runs with the accelerator scheduled timing to study the accidental background have been performed. As a result, the single rates of the IBD prompt and delayed candidates at 0.75 MW of averaged beam power are (2.200.08) / spill and (1.800.01) / spill, respectively. The expected rate of the accidental background is (9.29 / spill, and this is comparable with that of IBD neutrino oscillation signal if exist.
Acknowledgements.
We thank the J-PARC staff for their support. We acknowledge the support of the Ministry of Education, Culture, Sports, Science, and Technology (MEXT) and the JSPS grants-in-aid: 16H06344, 16H03967 and 20H05624, Japan. This work is also supported by the National Research Foundation of Korea (NRF): 2016R1A5A1004684, 2017K1A3A7A09015973, 2017K1A3A7A09016426, 2019R1A2C3004955, 2016R1D1A3B02010606, 2017R1A2B4011200, 2018R1D1A1B07050425, 2020K1A3A7A09080133, 2020K1A3A7A09080114, 2020R1I1A3066835, 2021R1A2C1013661 and 2022R1A5A1030700. Our work has also been supported by a fund from the BK21 of the NRF. The University of Michigan gratefully acknowledges the support of the Heising-Simons Foundation. This work conducted at Brookhaven National Laboratory was supported by the U.S. Department of Energy under Contract DE-AC02- 98CH10886. The work of the University of Sussex is supported by the Royal Society grant no. IESnR3n170385. We also thank the Daya Bay Collaboration for providing the Gd-LS, the RENO collaboration for providing the LS and PMTs, CIEMAT for providing the splitters, Drexel University for providing the FEE circuits and Tokyo Inst. Tech for providing FADC boards.References
- (1) C. Athanassopoulos et al. (LSND Collaboration), Phys. Rev. Lett. 77 (1996) 3082.
- (2) W. Hampel et al. (GALLEX Collaboration), Phys. Lett. B 420 (1998) 114.
- (3) J. N. Abdurashitov et al. (SAGE Collaboration), Phys. Rev. C 80 (2009) 015807.
- (4) G. Mention, M. Fechner, T. Lasserre, T. A. Mueller, D. Lhuillier, M. Cribier and A. Letourneau, Phys. Rev. D 83 (2011) 073006.
- (5) A. A. Aguilar-Arevalo et al. (MiniBooNE Collaboration), Phys. Rev. Lett. 110 (2013) 161801.
- (6) A. A. Aguilar-Arevalo et al. (MiniBooNE Collaboration), Phys. Rev. Lett. 120 (2018) 141802.
- (7) M. Harada, et al, arXiv:1310.1437 [physics.ins-det]
- (8) S. Ajimura, et al, arXiv:1705.08629 [physics.ins-det]
- (9) Y. Hino et al. (JSNS2 Collaboration), Eur. Phys. Journal C 82 (2022) 331
- (10) S. Ajimura et al, Nucl. Inst. Meth. A 1014 (2021) 165742
- (11) J. S. Park, et al, 2020 JINST 15 T09002
- (12) T. Maruyama, in Presentation of 31st J-PARC PAC (2021).
- (13) H. Jeon, in Presentation of 2020 KPS Fall Meeting (2020).
- (14) M. Harada, et al, arXiv:1502.02255 [physics.ins-det]
- (15) S. Ajimura et al, PTEP 2015 6, 063C01 (2015).
- (16) NEOS Collaboration, B. R. Kim et al., J. Radioanal. Nucl. Chem. 310 (2016) 1, 311-316
- (17) J. Ashenfelter, et al., JINST 14 (2019) no.03, P03026
- (18) Y. Lecun, et al, in Proceedings of the IEEE, pages 2278–2324, 1998.
- (19) A. A. Saffar, et al, 2017 International Conference on Radar, Antenna, Microwave, Electronics, and Telecommunications (ICRAMET), 2017, pp. 26-31.
- (20) B. R. Kim et al., Phys. Scr. 90 (2015) 055302 (8pp)