Enhancing the hunt for new phenomena in dijet final-states using anomaly detection filter at High-Luminosity Large Hadron Collider
Abstract
In the realm of dijet searches in high-energy physics, a perplexing challenge has emerged: with experiments producing more and more data, our traditional ways of describing the dijet mass spectrum using analytic functions are struggling to keep up. To address this, we suggest the application of the anomaly detection approach to eliminate less interesting background events based on event final states. This method not only bypasses the limitations of conventional background models but also significantly enhances our ability to detect potential signals of new physics. Through simulations that mimic the conditions of the upcoming High-Luminosity Large Hadron Collider, we demonstrate the strength and efficiency of this approach in dealing with large data volumes. The integration of unsupervised machine learning into our experimental framework paves the way for a promising avenue to unveil hidden physics discoveries within the overwhelming influx of data.
keywords:
anomaly detection, unsupervised machine learning, dijet search, high energy physicsA search for resonances in dijet final-state is one of the primary analyses to be performed when a hadron collider reaches a new center-of-mass energy [1, 2, 3, 4, 5, 6, 7, 8, 9, 10, 11, 12]. Traditional dijet searches require establishing background hypotheses, which are typically empirical functions with a monotonically decreasing shape, to describe the dijet invariant masses from the Standard Model (SM) processes. The established background hypothesis is subsequently applied to data to search for localized deviations that may indicate potential signals of heavy resonances produced beyond the SM (BSM). However, as the luminosity increases, a breakdown of the background hypotheses becomes evident [13, 14, 15]. Commonly employed analytic functions for background description might be insufficient to describe the dijet invariant mass in high-statistics data. Typically, this inability leads to oscillations in fit residuals, thus preventing claims about new resonances. To address these limitations, various other techniques, such as peak finders [16], SWiFt [13] and functional decomposition [17] have been explored. However, the substantial flexibility introduced by these methods may hinder the sensitivity to identify localized deviations.
In this paper, we leverage unsupervised machine learning to address this challenge. Instead of seeking complex functions to describe high-statistics data, we utilize an unsupervised anomaly-detection (AD) filter to exclude less intriguing events which are likely related to the SM processes according to their final-state topology. Then the remaining low-statistics data can be effectively described using simple analytic functions. Moreover, as we show in this study, this approach enhances the sensitivity to detect new physics.
Anomaly-detection methods within the realm of high energy physics have undergone extensive investigation, illustrating promising performance across various applications, as evidenced in Refs. [18, 19, 20, 21, 22, 23, 24, 25, 26, 27, 28, 29, 30, 31, 32, 33, 34, 35, 36]. Dedicated endeavors have been invested in enhancing resonant bump hunting in CWoLa [37], ANODE [38], CATHODE [39], SALAD [40], FETA [41], CURTAINS [42], and many others [43, 44, 45], focusing on the resonant decay products. The utilization of unsupervised machine learning to identify “anomalous” events through an assessment of final-state multiplicity and kinematics has been increasingly spotlighted. Advantages of this approach for model-agnostic searches are demonstrated in Refs. [46, 47], and it has been recently adopted by an ATLAS analysis [48]. However, the emphasis on preserving the simplicity of background description in the dijet final state has not received commensurate attention.
To demonstrate the power of the AD filter in this aspect, we simulate 1 collision events (around 1.55 billion events) at TeV using the Pythia8 [49, 50] generator. This simulation aims to emulate the statistics expected to be achieved at the High-Luminosity Large Hadron Collider [51]. The events comprise contributions from inclusive SM processes, with Quantum Chromodynamics (QCD) processes predominantly governing multijet production, while top-quark, Higgs-boson, and vector-boson productions play minor roles in comparison. These processes are implemented in leading-order matrix elements, with parton showering followed by hadronization. The NNPDF 2.3 LO [52, 53] parton density function, interfaced with Pythia8 via the LHAPDF library [54], is used in the generation. For high efficient generation of events in the region of the interest, a minimum value of transverse momentum for the matrix elements for processes is set to 1000 GeV.
To assess the potential gain for new physics search achieved by using the AD filter, we adopt a benchmark model known as the Sequential Standard Model (SSM) [55]. The SSM is an extended gauge model, which predicts the existence of additional heavy gauge bosons, commonly denoted as and . In this study, we focus on the process of boson emission from the -channel production, specifically:
| (1) |
where 3 TeV and 2 TeV. The model serves as a suitable representation for a class of BSM processes that allows studies of a heavy dijet resonance () with additional final states from the SM boson decay.
Electrons, muons, photons and jets are reconstructed from the stable particles with a lifetime longer than seconds. The transverse momentum of the leptons and photons must be greater than 30 GeV. A cone energy is defined as sum of all energies in a core of the size in the azimuthal angle and pseudo-rapidity around the true direction of the lepton or photon. To ensure the leptons and photons are isolated, their energy must contribute more than of the cone energy. The jets are reconstructed using the anti- algorithm [56] with a distance parameter of , implemented in the FastJet package [57]. The transverse momenta of jets must be greater than GeV, and the pseudorapidity must satisfy . Jets are classified as -jets, if the jet momentum matches the momentum of a -quark and the -quark contributes more than 50% of the total jet energy. The -jet fake rate is also included assuming an increase from 1% to 6% at the highest [58].
To represent a collision event with arbitrary number of final-states objects, we utilize the rapidity-mass matrix proposed in Ref. [59]. This matrix effectively captures crucial details of an event, including the transverse mass and energy of each final object, as well as the invariant mass and rapidity differences between every pair of final states. In our representation, we allow for a maximum of ten non--jets and ten -jets, as well as up to five electrons, muons, and photons, along with missing transverse energy in each event. In case an event contains fewer objects than the maximum allowed, the remaining slots in the representation are filled with zero values in the matrix. To ensure minimal biases in the dijet mass spectrum, we exclude the dijet invariant mass variable from the leading two jets in the rapidity-mass matrix. In total, the representation results in variables for each event.
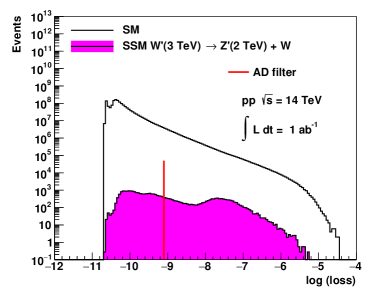
The AD filter utilizes an autoencoder implemented in TensorFlow [60]. The employment of autoencoders for the AD filter is fully general and more sophisticated architectures are expected to achieve similar or better performance. An autoencoder is a type of neural network that learns a compressed representation of its input data in an unsupervised manner. It consists of two key components: an encoder that reduces the input data into a lower-dimensional representation, and a decoder that reconstructs the original data from the compressed representation. The autoencoder is trained to accurately reconstruct 1 million of the simulated SM events with minimal reconstruction loss. The size of the training dataset is deemed sufficient for accurately capturing the intrinsic kinematics of the final states and their correlations in the SM events.
The trained AD filter is then applied to the remaining events. The reconstruction loss of the autoencoder is showed in Figure 1. Events with small reconstruction losses (), indicated with the vertical line in Figure 1, are excluded, rejecting 98% of the SM events while keeping 38% of the benchmark SSM events. This criterion is used in Ref. [48] although it can be further optimized for other analyses. Two distinct scenarios of different statistics are investigated: and . In addition to using the AD filter, we also investigate an alternative approach by applying a requirement on rapidity difference between the two leading jets, and , which is commonly used in traditional dijet searches (e.g. Refs. [11, 12]) to suppress the -channel QCD background. This selection removes 45% of the SM events in our study.
The dijet invariant mass, , is computed using the two leading jets with the highest transverse momenta, , in the event. In the following analysis, we apply Eq. 2 to fit the spectrum:
| (2) |
were and represent five free parameters. Similar expressions show excellent performance in previous dijet searches [3, 5, 6, 7, 8, 9, 10, 11, 12]. In this study, fit begins at 1200 GeV to allow focusing on the higher-mass region of interest.
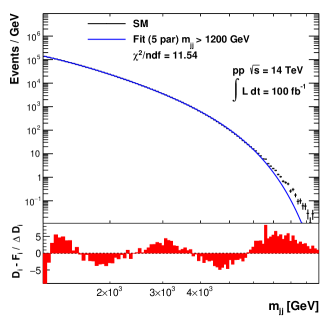
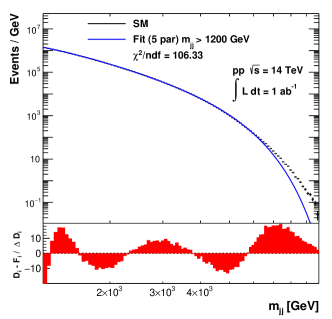
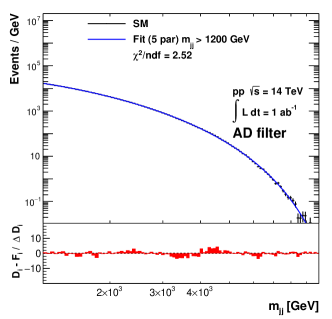
Figure 2 demonstrates that Eq. 2, after the minimization, fails to accurately describe the vanilla data prior to applying either the selection or the AD filter. The bottom panels show the deviations of the fit value () from the simulated data () in the -th bin, scaled by , where is the statistical uncertainty of the data in that bin. The observed “wave” pattern for the deviations is a distinctive trait of this class of functions when they are unable to accurately describe the data. As statistics increase, the failure becomes more pronounced, indicating the limitation of the function in representing the high-statistics data. Adding extra free parameters to this function does not solve this problem. Searching for new physics under this situation, assuming relatively small contributions from heavy resonances, becomes not possible.
To understand the discovery potential of the simulated data to new resonance phenomena, we inject simulated SSM events into the SM events. The injected amount is such that the following quantity, defined as a measure of the significance [61], is approximately 3:
| (3) |
Here is the injected number of the SSM events and is the number of SM events when GeV. This injection corresponds to approximately 12 thousand SSM events injected into approximately 17 million SM events in the region GeV after applying the selection.
We also define two significances as follows:
-
1.
The pre-fit significance:
(4) where and are the number of SSM events and the number of SM events in the -th bin before fit, respectively. The pre-fit significance is expected to exceed the “injected” significance calculated from the event yields since it is primarily influenced by the signal-over-background ratio around the peak position.
-
2.
The post-fit significance () is defined according to Eq. 3 with and . The summations run from the peak position, defined by the maximum value of , to the left and the right side of the peak, and stop when this quantity becomes negative, or the bin center is outside of the resonance width (). The fit values are obtained through the fitting process to the SM events and injected SSM events using Eq. 2, while represents the prediction from both sets of events.
The post-fit significance is usually smaller than the pre-fit significance because the fit with only the background function to data could “absorb” some injected signals. Nonetheless, it provides a reliable assessment of the observed deviations from the background hypothesis and helps identify potential new physics phenomena. The post-fit also exhibits a broad agreement with the local significance employed in BumpHunter [62], which is a widely adopted searching algorithm in hadron collider experiments.
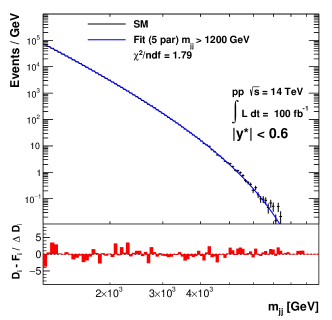
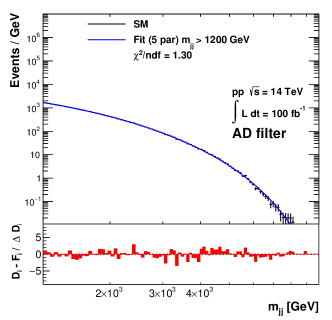
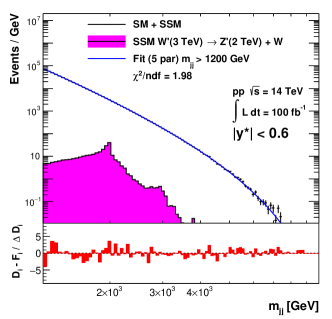
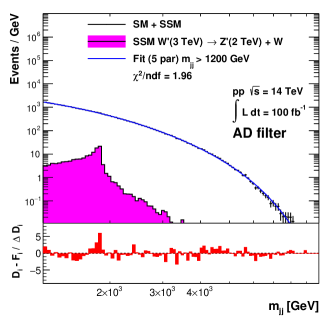
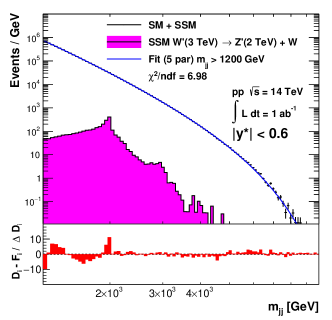
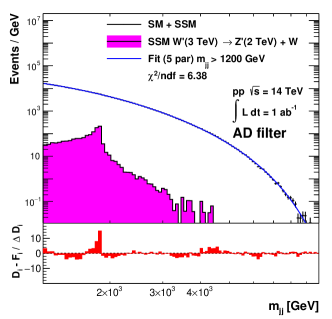
After applying either the selection on the rapidity difference or the AD filter, we observe a significant improvement in the fit quality. Figure 3 illustrates the fit to the distribution in the scenario, both with and without SSM events injection. Notably, both selections exhibit smaller /ndof (number of degrees of freedom) compared to the fit shown in Figure 2. However, it is evident that the fit quality achieved with the AD filter surpasses that of the selection. Moreover, the post-fit significance of the benchmark signal with the AD filter is measured as , marking a substantial improvement from the achieved with the selection.
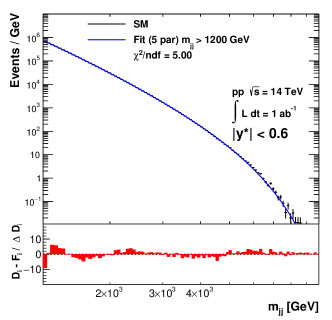
Figure 4 presents the fit results in the scenario, revealing a more pronounced enhancement with the AD filter compared to the selection. Evidently, the AD filter not only improves the fit quality but also yields an impressive increase in the post-fit significance, rising from to , further affirming the superior performance of the AD filter in this scenario. In both luminosity scenarios, the improvement in the pre-fit significance suggests that the AD filter outperforms the selection in terms of background rejection. Table 1 provides a summary of the pre- and post-fit significances for both selections under both scenarios, highlighting the clear advantage of the AD filter over the selection in terms of signal significance improvement.
| Integrated luminosity | Pre-fit significance | Post-fit significance | Fit /ndf SM events | |||
| AD filter | AD filter | AD filter | ||||
| 1.8 | 1.3 | |||||
| 5.0 | 2.5 | |||||
The acceptance of the AD filter is depicted for both SM events and the benchmark SSM events in Figure 5. The figure also presents a comparison of the acceptance achieved through the selection. The acceptances are determined by computing the ratio of the number of events within each bin after the selections, relative to the number of events before the selections. For the SM events, the AD filter exhibits a significantly lower acceptance for the low dijet mass region, gradually rising as increases. This pattern effectively retains high mass events, which are more intriguing, while concurrently suppressing low mass events that are more likely attributable to the SM process. This behavior aligns with our expectations, as a larger invariant mass corresponds to higher values of the inputs to the autoencoder, consequently resulting in a larger reconstruction loss.
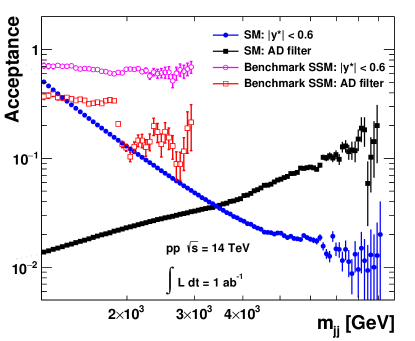
The acceptance pattern for the selection contrasts significantly with that of the AD filter. While the selection exhibits low acceptance for high mass events, its effectiveness is less pronounced for low mass events. This phenomenon arises from the increased contribution of the -channel QCD process. For the current and future focus on high-mass searches in BSM investigations, this criterion is increasingly likely to become ineffective.
The acceptance for the benchmark SSM events remains relatively flat when considering the criterion, whereas a distinct non-linear pattern emerges for the benchmark SSM events utilizing the AD filter. Within the AD filter scenario, a reduction beyond 2 TeV is observed, which is driven by underlying kinematics. When the combined energy of the two leading jets exceeds 2 TeV, the available phase-space for other final states coming from the SM -boson decay becomes constrained. Consequently, events exhibit a diminished final-state multiplicity, thereby contributing to a lower reconstruction loss. The acceptance experiences a gradual increase owing to the influence of the energy hardness of the two leading jets. Another dip in acceptance becomes evident around 3 TeV, aligning with the broader bump at the same mass in Figure 4c. This dip is likely a result of the decay products from the and bosons merging into two jets, and consequently, the suppression of final state multiplicity is further accentuated.
In scenarios where the decays are mandated or the mass is elevated to 5 TeV within the benchmark SSM, a distinct trend emerges. The signal acceptance displays a reduced dependence on in contrast to the observed pattern in the current benchmark model. Furthermore, it undergoes a notable increase by a factor of 2 to 3 in both scenarios, reaching an efficiency of 0.8. In these two BSM scenarios, the signal acceptance exceeds the acceptance of 0.7 achieved by the selection. This behavior stems from the fact that SM events are primarily dominated by hadronic final states, making leptonic decays relatively anomalous. Moreover, the introduction of a substantial boson mass provides greater phase-space for higher final state multiplicities, which leads to events that exhibit characteristics less aligned with the majority of the SM events. As a consequence, these two variations of the SSM model exhibit higher post-fit significance compared to the benchmark SSM results reported in Table 1, when employing the AD filter.
It is also essential to emphasize that the observed improvements in the discovery potential of heavy particles depends on the selection criterion applied to the loss value. In this study, we employed the requirement inspired by the ATLAS analysis [48]. However, certain BSM models yielding low missing transverse energy or lepton multiplicities, such as the excited-quark models [63] or the SSM with hadronic decay, may result in reduction of the reconstruction loss, making this requirement sub-optimal. Nevertheless, since the rapidity difference is an integral component of the rapidity-mass matrix, we anticipate the AD filter to maintain its superior performance over the selection following an appropriate adjustment of the loss cut.
In summary, with the continuous expansion of experimental data in terms of statistics, conventional techniques for characterizing dijet invariant mass distributions are encountering inherent challenges. In this context, the application of unsupervised methods, such as the anomaly-detection filter discussed in this paper, emerges as an appealing strategy. By selectively identifying and suppressing uninteresting background events based on their final-state signatures, this approach effectively tackles the shortcomings associated with empirical background models. As we have shown through the simulations, the use of the AD filter results in strong observations of signals in the scenarios where conventional techniques can only offer weak evidence or even fail to draw any conclusion in the absence of a cut. This potential extends beyond the benchmark model, as the topology of the BSM model used in the study is quite general. It is worth noting that the acceptance of the AD filter is influenced not only by the rapidity difference between the two leading jets but also by the overall configuration of the final states within BSM scenarios. Our findings suggest that, especially in the era of high statistics, the integration of unsupervised techniques offers a promising path to advancing the accuracy and power of anomaly searches in the dijet mass spectrum.
Acknowledgments
The submitted manuscript has been created by UChicago Argonne, LLC, Operator of Argonne National Laboratory (“Argonne”). Argonne, a U.S. Department of Energy Office of Science laboratory, is operated under Contract No. DE-AC02-06CH11357. The U.S. Government retains for itself, and others acting on its behalf, a paid-up nonexclusive, irrevocable worldwide license in said article to reproduce, prepare derivative works, distribute copies to the public, and perform publicly and display publicly, by or on behalf of the Government. The Department of Energy will provide public access to these results of federally sponsored research in accordance with the DOE Public Access Plan. http://energy.gov/downloads/doe-public-access-plan. Argonne National Laboratory’s work was funded by the U.S. Department of Energy, Office of High Energy Physics (DOE OHEP) under contract DE-AC02-06CH11357. The Askaryan Calorimeter Experiment was supported by the US DOE OHEP under Award Numbers DE-SC0009937, DE-SC0010504, and DE-AC02-76SF0051. RZ is supported by DE-SC0017647.
Data Availability
The data and machine learning model used to support the findings of this study can be accessed via zenodo.org [64].
References
References
- [1] CDF Collaboration, CDF Collaboration, The two-jet invariant mass distribution at TeV, Phys. Rev. D 41 (1990) 1722–1725. doi:10.1103/PhysRevD.41.1722.
- [2] D0 Collaboration, D0 Collaboration, Search for new particles in the two jet decay channel with the D0 detector, Phys. Rev. D 69 (2004) 111101. arXiv:hep-ex/0308033, doi:10.1103/PhysRevD.69.111101.
- [3] CDF Collaboration, Search for new particles decaying into dijets in proton-antiproton collisions at TeV, Phys. Rev. D 79 (2009) 112002. arXiv:0812.4036, doi:10.1103/PhysRevD.79.112002.
- [4] D0 Collaboration, Measurement of dijet angular distributions at TeV and searches for quark compositeness and extra spatial dimensions, Phys. Rev. Lett. 103 (2009) 191803. arXiv:0906.4819, doi:10.1103/PhysRevLett.103.191803.
- [5] ATLAS Collaboration, Search for New Particles in Two-Jet Final States in 7 TeV Proton-Proton Collisions with the ATLAS Detector at the LHC, Phys. Rev. Lett. 105 (2010) 161801. arXiv:1008.2461, doi:10.1103/PhysRevLett.105.161801.
- [6] CMS Collaboration, Search for Dijet Resonances in 7 TeV pp Collisions at CMS, Phys. Rev. Lett. 105 (2010) 211801. arXiv:1010.0203, doi:10.1103/PhysRevLett.105.211801.
- [7] ATLAS Collaboration, Search for New Physics in Dijet Mass and Angular Distributions in pp Collisions at TeV Measured with the ATLAS Detector, New J. Phys. 13 (2011) 053044. arXiv:1103.3864, doi:10.1088/1367-2630/13/5/053044.
- [8] CMS Collaboration, S. Chatrchyan, et al., Search for Resonances in the Dijet Mass Spectrum from 7 TeV pp Collisions at CMS, Phys. Lett. B 704 (2011) 123–142. arXiv:1107.4771, doi:10.1016/j.physletb.2011.09.015.
- [9] ATLAS Collaboration, Search for New Phenomena in Dijet Angular Distributions in Proton-Proton Collisions at TeV Measured with the ATLAS Detector, Phys. Rev. Lett. 114 (22) (2015) 221802. arXiv:1504.00357, doi:10.1103/PhysRevLett.114.221802.
- [10] CMS Collaboration, V. Khachatryan, et al., Search for narrow resonances in dijet final states at 8 TeV with the novel CMS technique of data scouting, Phys. Rev. Lett. 117 (3) (2016) 031802. arXiv:1604.08907, doi:10.1103/PhysRevLett.117.031802.
- [11] ATLAS Collaboration, ATLAS Collaboration, Search for new phenomena in dijet mass and angular distributions from collisions at 13 TeV with the ATLAS detector, Phys. Lett. B 754 (2016) 302–322. arXiv:1512.01530, doi:10.1016/j.physletb.2016.01.032.
- [12] CMS Collaboration, Search for narrow resonances decaying to dijets in proton-proton collisions at tev, Phys. Rev. Lett. 116 (7) (2016) 071801. arXiv:1512.01224, doi:10.1103/PhysRevLett.116.071801.
- [13] ATLAS Collaboration, Search for new phenomena in dijet events using of collision data collected at with the ATLAS detector, Phys. Rev. D 96 (2017) 052004. arXiv:1703.09127, doi:10.1103/PhysRevD.96.052004.
- [14] CMS Collaboration, Search for narrow and broad dijet resonances in proton–proton collisions at and constraints on dark matter mediators and other new particles, JHEP 08 (2018) 130. arXiv:1806.00843, doi:10.1007/JHEP08(2018)130.
- [15] S. V. Chekanov, J. T. Childers, J. Proudfoot, R. Wang, D. Frizzell, Precision searches in dijets at the HL-LHC and HE-LHC, Journal of Instrumentation 13 (05) (2018) P05022–P05022. doi:10.1088/1748-0221/13/05/p05022.
- [16] S. V. Chekanov, M. Erickson, A nonparametric peak finder algorithm and its application in searches for new physics, Adv. High Energy Phys. 2013 (2013) 162986. arXiv:1110.3772, doi:10.1155/2013/162986.
- [17] R. Edgar, D. Amidei, C. Grud, K. Sekhon, Functional Decomposition: A new method for search and limit settingarXiv:1805.04536.
- [18] M. Kuusela, T. Vatanen, E. Malmi, T. Raiko, T. Aaltonen, Y. Nagai, Semi-Supervised Anomaly Detection - Towards Model-Independent Searches of New Physics, J. Phys. Conf. Ser. 368 (2012) 012032. arXiv:1112.3329, doi:10.1088/1742-6596/368/1/012032.
- [19] R. T. D’Agnolo, A. Wulzer, Learning new physics from a machine, Phys. Rev. D 99 (1) (2019) 015014. arXiv:1806.02350, doi:10.1103/PhysRevD.99.015014.
- [20] M. Farina, Y. Nakai, D. Shih, Searching for New Physics with Deep Autoencoders, Phys. Rev. D 101 (7) (2020) 075021. arXiv:1808.08992, doi:10.1103/PhysRevD.101.075021.
- [21] T. Heimel, G. Kasieczka, T. Plehn, J. M. Thompson, QCD or What?, SciPost Phys. 6 (3) (2019) 030. arXiv:1808.08979, doi:10.21468/SciPostPhys.6.3.030.
- [22] J. H. Collins, K. Howe, B. Nachman, Extending the search for new resonances with machine learning, Phys. Rev. D 99 (2019) 014038. doi:10.1103/PhysRevD.99.014038.
- [23] R. T. D’Agnolo, A. Wulzer, Learning new physics from a machine, Phys. Rev. D 99 (2019) 015014. doi:10.1103/PhysRevD.99.015014.
- [24] A. De Simone, T. Jacques, Guiding new physics searches with unsupervised learning, Eur. Phys. J. C 79 (4) (2019) 289. arXiv:1807.06038, doi:10.1140/epjc/s10052-019-6787-3.
- [25] J. Hajer, Y.-Y. Li, T. Liu, H. Wang, Novelty Detection Meets Collider Physics, Phys. Rev. D 101 (7) (2020) 076015. arXiv:1807.10261, doi:10.1103/PhysRevD.101.076015.
- [26] T. S. Roy, A. H. Vijay, A robust anomaly finder based on autoencoders, arXiv:1903.02032.
- [27] O. Cerri, T. Q. Nguyen, M. Pierini, M. Spiropulu, J.-R. Vlimant, Variational autoencoders for new physics mining at the Large Hadron Collider, JHEP 05 (2019) 036. arXiv:1811.10276, doi:10.1007/JHEP05(2019)036.
- [28] A. Blance, M. Spannowsky, P. Waite, Adversarially-trained autoencoders for robust unsupervised new physics searches, JHEP 10 (2019) 047. arXiv:1905.10384, doi:10.1007/JHEP10(2019)047.
- [29] O. Amram, C. M. Suarez, Tag N’ Train: a technique to train improved classifiers on unlabeled data, Journal of High Energy Physics 2021 (1) (2021) 153. arXiv:2002.12376, doi:10.1007/JHEP01(2021)153.
- [30] B. M. Dillon, D. A. Faroughy, J. F. Kamenik, M. Szewc, Learning the latent structure of collider events, JHEP 10 (2020) 206. arXiv:2005.12319, doi:10.1007/JHEP10(2020)206.
- [31] S. Eon Park, D. Rankin, S.-M. Udrescu, M. Yunus, P. Harris, Quasi Anomalous Knowledge: Searching for new physics with embedded knowledge, arXiv:2011.03550.
- [32] B. Bortolato, A. Smolkovič, B. M. Dillon, J. F. Kamenik, Bump hunting in latent space, Phys. Rev. D 105 (11) (2022) 115009. arXiv:2103.06595, doi:10.1103/PhysRevD.105.115009.
- [33] V. Mikuni, B. Nachman, D. Shih, Online-compatible unsupervised nonresonant anomaly detection, Phys. Rev. D 105 (5) (2022) 055006. arXiv:2111.06417, doi:10.1103/PhysRevD.105.055006.
- [34] K. Benkendorfer, L. Le Pottier, B. Nachman, Simulation-assisted decorrelation for resonant anomaly detection, Phys. Rev. D 104 (3) (2021) 035003. arXiv:2009.02205, doi:10.1103/PhysRevD.104.035003.
- [35] B. M. Dillon, R. Mastandrea, B. Nachman, Self-supervised anomaly detection for new physics, Phys. Rev. D 106 (5) (2022) 056005. arXiv:2205.10380, doi:10.1103/PhysRevD.106.056005.
- [36] T. Cheng, J.-F. Arguin, J. Leissner-Martin, J. Pilette, T. Golling, Variational autoencoders for anomalous jet tagging, Phys. Rev. D 107 (2023) 016002. doi:10.1103/PhysRevD.107.016002.
- [37] J. H. Collins, K. Howe, B. Nachman, Anomaly detection for resonant new physics with machine learning, Phys. Rev. Lett. 121 (24) (2018) 241803. arXiv:1805.02664, doi:10.1103/PhysRevLett.121.241803.
- [38] B. Nachman, D. Shih, Anomaly detection with density estimation, Phys. Rev. D 101 (2020) 075042. doi:10.1103/PhysRevD.101.075042.
- [39] A. Hallin, J. Isaacson, G. Kasieczka, C. Krause, B. Nachman, T. Quadfasel, M. Schlaffer, D. Shih, M. Sommerhalder, Classifying anomalies through outer density estimation, Phys. Rev. D 106 (5) (2022) 055006. arXiv:2109.00546, doi:10.1103/PhysRevD.106.055006.
- [40] A. Andreassen, B. Nachman, D. Shih, Simulation assisted likelihood-free anomaly detection, Phys. Rev. D 101 (2020) 095004. doi:10.1103/PhysRevD.101.095004.
- [41] T. Golling, S. Klein, R. Mastandrea, B. Nachman, Flow-enhanced transportation for anomaly detection, Phys. Rev. D 107 (9) (2023) 096025. arXiv:2212.11285, doi:10.1103/PhysRevD.107.096025.
- [42] J. A. Raine, S. Klein, D. Sengupta, T. Golling, CURTAINs for your sliding window: Constructing unobserved regions by transforming adjacent intervals, Front. Big Data 6 (2023) 899345. arXiv:2203.09470, doi:10.3389/fdata.2023.899345.
- [43] T. Aarrestad, et al., The Dark Machines Anomaly Score Challenge: benchmark data and model independent event classification for the Large Hadron Collider, SciPost Phys. 12 (1) (2022) 043. arXiv:2105.14027, doi:10.21468/SciPostPhys.12.1.043.
- [44] G. Kasieczka, et al., The LHC Olympics 2020 a community challenge for anomaly detection in high energy physics, Rept. Prog. Phys. 84 (12) (2021) 124201. arXiv:2101.08320, doi:10.1088/1361-6633/ac36b9.
- [45] G. Karagiorgi, G. Kasieczka, S. Kravitz, B. Nachman, D. Shih, Machine learning in the search for new fundamental physics, Nature Rev. Phys. 4 (6) (2022) 399–412. doi:10.1038/s42254-022-00455-1.
- [46] S. V. Chekanov, Machine learning using rapidity-mass matrices for event classification problems in HEP, Universe 7 (1) (2021) 19. arXiv:1810.06669, doi:10.3390/universe7010019.
- [47] S. V. Chekanov, W. Hopkins, Event-Based Anomaly Detection for Searches for New Physics, Universe 8 (10) (2022) 494. arXiv:2111.12119, doi:10.3390/universe8100494.
- [48] ATLAS Collaboration, Search for new phenomena in two-body invariant mass distributions using unsupervised machine learning for anomaly detection at TeV with the ATLAS detector, arXiv:2307.01612.
- [49] T. Sjöstrand, S. Mrenna, P. Skands, PYTHIA 6.4 physics and manual, Journal of High Energy Physics 2006 (5) (2006) 026. arXiv:hep-ph/0603175, doi:10.1088/1126-6708/2006/05/026.
- [50] T. Sjostrand, S. Mrenna, P. Z. Skands, A Brief Introduction to PYTHIA 8.1, Comput. Phys. Commun. 178 (2008) 852–867. arXiv:0710.3820, doi:10.1016/j.cpc.2008.01.036.
- [51] O. Aberle, et al., High-Luminosity Large Hadron Collider (HL-LHC): Technical design report, CERN Yellow Reports: Monographs, CERN, Geneva, 2020. doi:10.23731/CYRM-2020-0010.
- [52] R. D. Ball, et al., Parton distributions with LHC data, Nucl. Phys. B867 (2013) 244–289. arXiv:1207.1303, doi:10.1016/j.nuclphysb.2012.10.003.
- [53] NNPDF Collaboration, R. D. Ball, et al., Parton distributions for the LHC Run II, JHEP 04 (2015) 040. arXiv:1410.8849, doi:10.1007/JHEP04(2015)040.
- [54] A. Buckley, J. Ferrando, S. Lloyd, K. Nordström, B. Page, M. Rüfenacht, M. Schönherr, G. Watt, LHAPDF6: parton density access in the LHC precision era, Eur. Phys. J. C 75 (2015) 132. arXiv:1412.7420, doi:10.1140/epjc/s10052-015-3318-8.
- [55] B. M. G. Altarelli, M. Ruiz-Altaba, Searching for new heavy vector bosons in colliders, Z. Phys. C 45 (1989) 109. doi:10.1007/BF01556677.
- [56] M. Cacciari, G. P. Salam, G. Soyez, The anti-kT jet clustering algorithm, JHEP 04 (2008) 063. arXiv:0802.1189, doi:10.1088/1126-6708/2008/04/063.
- [57] M. Cacciari, G. P. Salam, G. Soyez, FastJet User Manual, Eur. Phys. J. C 72 (2012) 1896, http://fastjet.fr/. arXiv:1111.6097, doi:10.1140/epjc/s10052-012-1896-2.
- [58] ATLAS Collaboration, Performance of -Jet Identification in the ATLAS Experiment, JINST 11 (04) (2016) P04008. arXiv:1512.01094, doi:10.1088/1748-0221/11/04/P04008.
- [59] S. V. Chekanov, Imaging particle collision data for event classification using machine learning, Nucl. Instrum. Meth. A 931 (2019) 92–99. arXiv:1805.11650, doi:10.1016/j.nima.2019.04.031.
- [60] M. Abadi, et al., TensorFlow: A system for large-scale machine learning, Proceedings of the 12th USENIX Conference on Operating Systems Design and Implementation (2016). arXiv:1605.08695, doi:10.48550/ARXIV.1605.08695.
-
[61]
G. Cowan,
Discovery
sensitivity for a counting experiment with with background uncertainty
(2012).
URL https://www.pp.rhul.ac.uk/~cowan/stat/notes/medsigNote.pdf - [62] G. Choudalakis, On hypothesis testing, trials factor, hypertests and the BumpHunter, Tech. rep. (2011). arXiv:1101.0390.
- [63] U. Baur, I. Hinchliffe, D. Zeppenfeld, Excited Quark Production at Hadron Colliders, Int. J. Mod. Phys. A 2 (1987) 1285. doi:10.1142/S0217751X87000661.
- [64] R. Zhang, S. Chekanov, Boosting sensitivity to new physics with unsupervised anomaly detection in dijet resonance search (Aug. 2023). doi:10.5281/zenodo.8219104.