Unmasking Parkinson’s Disease with Smile: An AI-enabled Screening Framework
Abstract
Parkinson’s disease (PD) diagnosis remains challenging due to lacking a reliable biomarker and limited access to clinical care. In this study, we present an analysis of the largest video dataset containing micro-expressions to screen for PD. We collected videos from unique participants, including self-reported PD patients. The recordings are from diverse sources encompassing participants’ homes across multiple countries, a clinic, and a PD care facility in the US. Leveraging facial landmarks and action units, we extracted features relevant to Hypomimia, a prominent symptom of PD characterized by reduced facial expressions. An ensemble of AI models trained on these features achieved an accuracy of and an Area Under the Receiver Operating Characteristic (AUROC) of while being free from detectable bias across population subgroups based on sex and ethnicity on held-out data. Further analysis reveals that features from the smiling videos alone lead to comparable performance, even on two external test sets the model has never seen during training, suggesting the potential for PD risk assessment from smiling selfie videos.
1 Introduction
There is no reliable biomarker for diagnosing Parkinson’s disease (Yang et al. 2022), the fastest-growing neurological disorder in the world (Dorsey et al. 2018). In 2017, Parkinson’s disease placed a significant economic burden of $52 billion in the United States (Yang et al. 2020). Given the projected doubling of PD patients by 2040, the scenario will worsen significantly, surpassing $79 billion even without accounting for inflation (Yang et al. 2020). The significance of timely diagnosis and regular checkups for PD cannot be overstated, as they can improve the quality of a patient’s life and reduce the burden of neurological care (Fujita et al. 2021). However, there are challenges, particularly for the elderly population who are more likely to be diagnosed with PD (Dorsey et al. 2018). Consider the scenario of an individual in their sixties or seventies experiencing impaired cognitive and physical ability, leading to immobility. Accessing timely clinical diagnosis becomes challenging if they reside in a remote area where the nearest clinic is not within reasonable driving distance. Furthermore, in many developing or underdeveloped countries, there is a significant scarcity of neurologists (e.g., in India, there were only 1200 neurologists available to serve over 1.3 billion people in 2013 (Khadilkar 2013).) This limited accessibility to clinical care results in many individuals remaining undiagnosed until the disease has progressed considerably, and the usefulness of medications available to manage involuntary tremors caused by PD becomes very limited.
At-home PD assessment has received significant attention from researchers in recent times (Bot et al. 2016; Morinan et al. 2023; Yang et al. 2022). One promising method involves analyzing nocturnal breathing signals obtained from radio waves reflected by the body. This approach has shown potential in detecting PD and could be a non-invasive and convenient way to monitor individuals at home for signs of the disease (Yang et al. 2022). Another characteristic often associated with PD is Hypomimia, which refers to a reduction in facial expressions. People with PD may experience Hypomimia due to a decrease in dopamine synthesis critical for facial expression, caused by the loss of certain neurons (Shimkin 2015; Mäkinen et al. 2019). While Hypomimia is not exclusive to PD, it is often considered an early and sensitive biomarker for the disease and can be utilized for early screening (Vinokurov et al. 2015; Rajnoha et al. 2018; Ricciardi et al. 2020; Abrami et al. 2021; Maycas-Cepeda et al. 2021). One notable advantage of assessing Hypomimia is that it can potentially be done with a computer or laptop that a participant may already have at home. Compared to measuring breathing signals which needs installation of sensors in people’s homes, checking for Hypomimia through facial expressions is easier, more accessible, and can be used anywhere in the world.
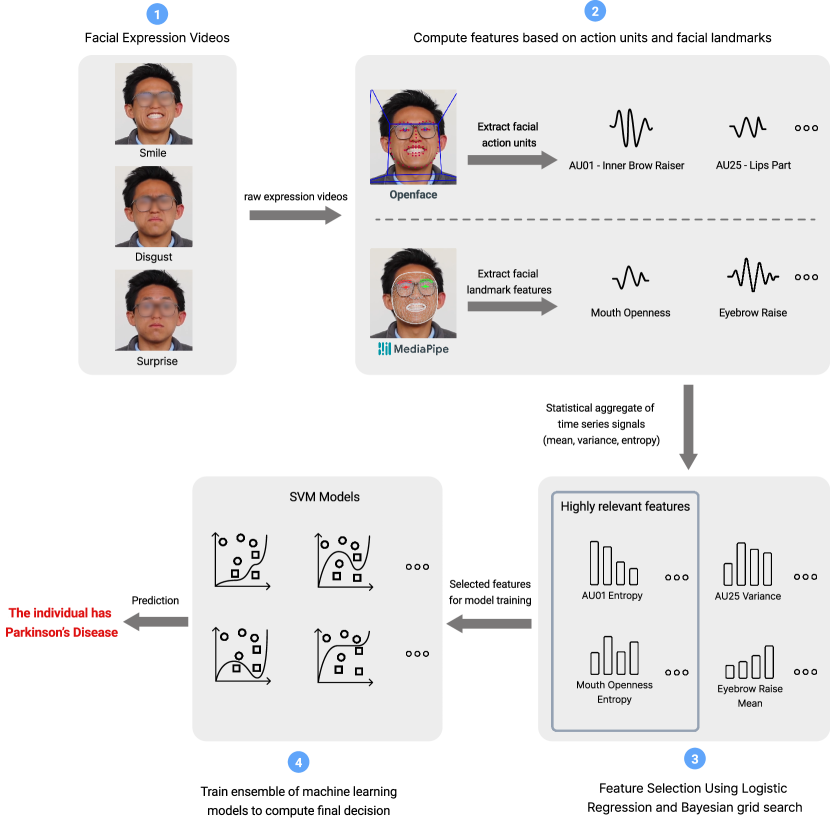
In this study, we present an AI-based system capable of objectively quantifying signs of Hypomimia, and screening individuals for Parkinson’s disease. We collected 3871 videos involving micro-expressions from 1059 global participants, where each participant was asked to mimic three different facial expressions: disgust, smile, and surprise on a web interface. Leveraging advanced computer vision tools like MediaPipe (Lugaresi et al. 2019) and OpenFace (Baltrušaitis, Robinson, and Morency 2016), we analyze the facial landmarks and action units (Ekman and Friesen 1978) to objectively quantify features of Hypomimia following the Movement Disorder Society‐Sponsored Revision of the Unified Parkinson’s disease Rating Scale (MDS-UPDRS). The large video dataset collected from a diverse study population aligns with our effort to make the benefits of the PD screening system available to everyone, irrespective of age, ethnicity, and sex. Testing the system on external cohorts in Bangladesh (representing South-East Asia, 8.5% of global population) and the United States (representing Northern America, 4.7% of global population) further validates its effectiveness across diverse demographics. The majority of our data are collected from participants’ homes encompassing a diverse range of environments and recording devices, thus eliminating the need for inconvenient travel and reducing the possibility of data shift when deployed to be used from participants’ homes. Using an ensemble of multiple AI models (i.e., support vector machine) that incorporate features from all three micro-expressions, our system aims to deliver a reliable, interpretable screening for Parkinson’s disease from the comfort of home and empower potential patients to seek clinical care and effectively manage their PD symptoms. Further analysis suggests that comparable performance is obtainable by merely using the smile videos. In Figure 1, we present an overview of our proposed framework.
2 Results
Data
In this research, we gathered video data from four distinct settings, comprising home-recorded videos from i) global participants (Home-Global)–primarily from North America; ii) a clinic at the University of Rochester Medical Center (Clinic); iii) a Parkinson’s disease care facility in Ohio (PD Care Facility); and iv) home-recorded videos from Bangladesh, a country in Southeast Asia (Home-BD). Our study involved participants, with identifying themselves as PD patients. Each participant was instructed to mimic three facial expressions (disgust, smile, and surprise) and return to a neutral face, repeating this process three times for each expression. Notably, some participants from the U.S. clinic contributed data on multiple occasions, resulting in videos from participants with PD and videos from participants without it. Table 1 provides details regarding the demographic characteristics of the entire participant set. Data collection was facilitated through a web-based platform named PARK (Langevin et al. 2019)111https://parktest.net/, allowing participants to conveniently record themselves using their personal laptop’s webcam. PARK was translated into the Bengali language to better instruct participants from Bangladesh. Data from Home-Global and PD Care Facility settings were used to train and evaluate the model on held-out data. Data collected in Clinic and Home-BD were solely used for external testing of the predictive model, and were never used during training. Supplementary information provides further specifics on the demographic properties of the data collected from each setting.
| Characteristics | With PD | Without PD | Total | |||||
|
256 (24.17%) | 803 (75.83%) | 1059 (100%) | |||||
| Sex, n (%) | ||||||||
| Male | 150 (58.59%) | 361 (44.96%) | 511 (48.25%) | |||||
| Female | 106 (41.41%) | 442 (55.04%) | 548 (51.75%) | |||||
| Age in years (range: 18 – 93.0, mean: 58.9), n (%) | ||||||||
| <20 | 0 (0.0%) | 43 (5.35%) | 43 (4.06%) | |||||
| 20-39 | 4 (1.56%) | 96 (11.96%) | 100 (9.44%) | |||||
| 40-59 | 39 (15.23%) | 216 (26.9%) | 255 (24.08%) | |||||
| 60-79 | 198 (77.34%) | 438 (54.55%) | 636 (60.06%) | |||||
| >=80 | 15 (5.86%) | 10 (1.25%) | 25 (2.36%) | |||||
| Race, n (%) | ||||||||
| White | 116 (45.31%) | 531 (66.13%) | 647 (61.1%) | |||||
| Asian | 15 (5.86%) | 187 (23.29%) | 202 (19.07%) | |||||
|
3 (1.17%) | 45 (5.6%) | 48 (4.53%) | |||||
|
1 (0.39%) | 4 (0.5%) | 5 (0.47%) | |||||
| Others | 3 (1.17%) | 12 (1.49%) | 15 (1.42%) | |||||
| Not Mentioned | 118 (46.09%) | 24 (2.99%) | 142 (13.41%) | |||||
| Recording Environment, n (%) | ||||||||
| Home-Global | 77 (30.08%) | 616 (76.71%) | 693 (65.44%) | |||||
| PD Care Facility | 118 (46.09%) | 24 (2.99%) | 142 (13.41%) | |||||
| Clinic | 47 (18.36%) | 28 (3.49%) | 75 (7.08%) | |||||
| Home-BD | 14 (5.47%) | 135 (16.81%) | 149 (14.07%) | |||||
| Expression | Feature | Statistic | p-value | Coefficient | Rank |
|---|---|---|---|---|---|
| Smile | lip corner puller | mean | 203.99 | 1 | |
| variance | 65.42 | 7 | |||
| mouth width | mean | 102.67 | 4 | ||
| cheek raiser | variance | 42.62 | 8 | ||
| Disgust | upper lip raiser | mean | 34.64 | 9 | |
| lid tightener | mean | 27.17 | 10 | ||
| lips part | variance | 114.01 | 2 | ||
| mean | 94.41 | 5 | |||
| Surprise | eye blink | variance | 108.80 | 3 | |
| mean | 85.13 | 6 |
Facial Features as Potential Digital Biomarkers
The loss of facial expressivity, abnormal eye blinking frequency, and lack of spontaneity in smiles are key indicators associated with Parkinson’s disease (PD) and are included in the MDS-UPDRS, a clinical guideline for PD assessment (Goetz et al. 2008). In this study, we aim to objectively and quantitatively capture these clinically relevant features using advanced facial landmark detection tools such as Mediapipe (Lugaresi et al. 2019) and OpenFace (Baltrusaitis et al. 2018). We extract the intensity of specific facial action units (Ekman and Friesen 1978) associated with each facial expression task (Velusamy et al. 2011). For instance, when someone smiles, various action units 222https://github.com/TadasBaltrusaitis/OpenFace/blob/master/imgs/au˙sample.png including inner brow raiser, cheek raiser, lip corner puller, dimpler, lips part, jaw drop, and eye blink may be activated. Moreover, certain action units like lips part, jaw drop, and eye blink can be activated by any of the three facial expressions used in this study. Additionally, we measure the degree of eye openness, raised eyebrow height for both the right and left eyes, mouth width and openness, and jaw openness using Mediapipe. These features have shown promise in previous literature for PD detection (Gomez et al. 2021). All of these features are computed for each frame of the recorded videos, and statistical aggregates (mean, variance, and entropy) are used to summarize the features across all frames. This allows us to train simple machine-learning models to assess PD. For each participant, we combine the task-specific statistical aggregates for all three tasks, resulting in comprehensive features. These features are then utilized as inputs for the machine learning models designed to differentiate between individuals with and without PD.
Out of the features, features were significantly different across participants with and without PD (at significance level, ). To find out the most powerful features for discriminating between participants with and without PD, we ran a logistic regression analysis on the entire dataset after normalizing the feature values and ranked the features based on the coefficient of logistic regression. Table 2 identifies the top- most significant features.
Predictive Performance on Held-out Data
With all three facial expressions:
Among the videos collected in four different settings, we utilized the datasets from Home-Global and PD Care Facility to train and validate the PD prediction model. To train the model, we combined features from all three facial expression tasks so that each unique participant corresponds to a single data point, ensuring that training and test subjects remain separated. Any participant who did not provide video recordings for all three facial expressions was excluded from the analysis, resulting in data points for training and testing. To assess model performance, we ran a -fold cross-validation () with stratified sampling (i.e., maintaining the same ratio of participants with and without PD across the train and test sets). This approach is also known as stratified -fold cross-validation and is preferred over traditional -fold cross-validation when the dataset is imbalanced (Kohavi et al. 1995).
Out of several model choices, the best-performing model was an ensemble of support vector machines (SVM). Note that these high-performing SVM models differ from each other by the hyper-parameters (including the set of features) they use and they were selected using a meticulous optimization via Bayesian hyper-parameter tuning (details in the Methods section). At each iteration of -fold cross-validation, the entire ensemble model was trained on () folds out of folds, while the remaining fold was held out for testing. different iterations selected different folds as the test set, ensuring that the model was evaluated on all the data samples. Given the imbalanced nature of the dataset, we used minority oversampling (Chawla et al. 2002) on the training sets, while the test sets remained unchanged.
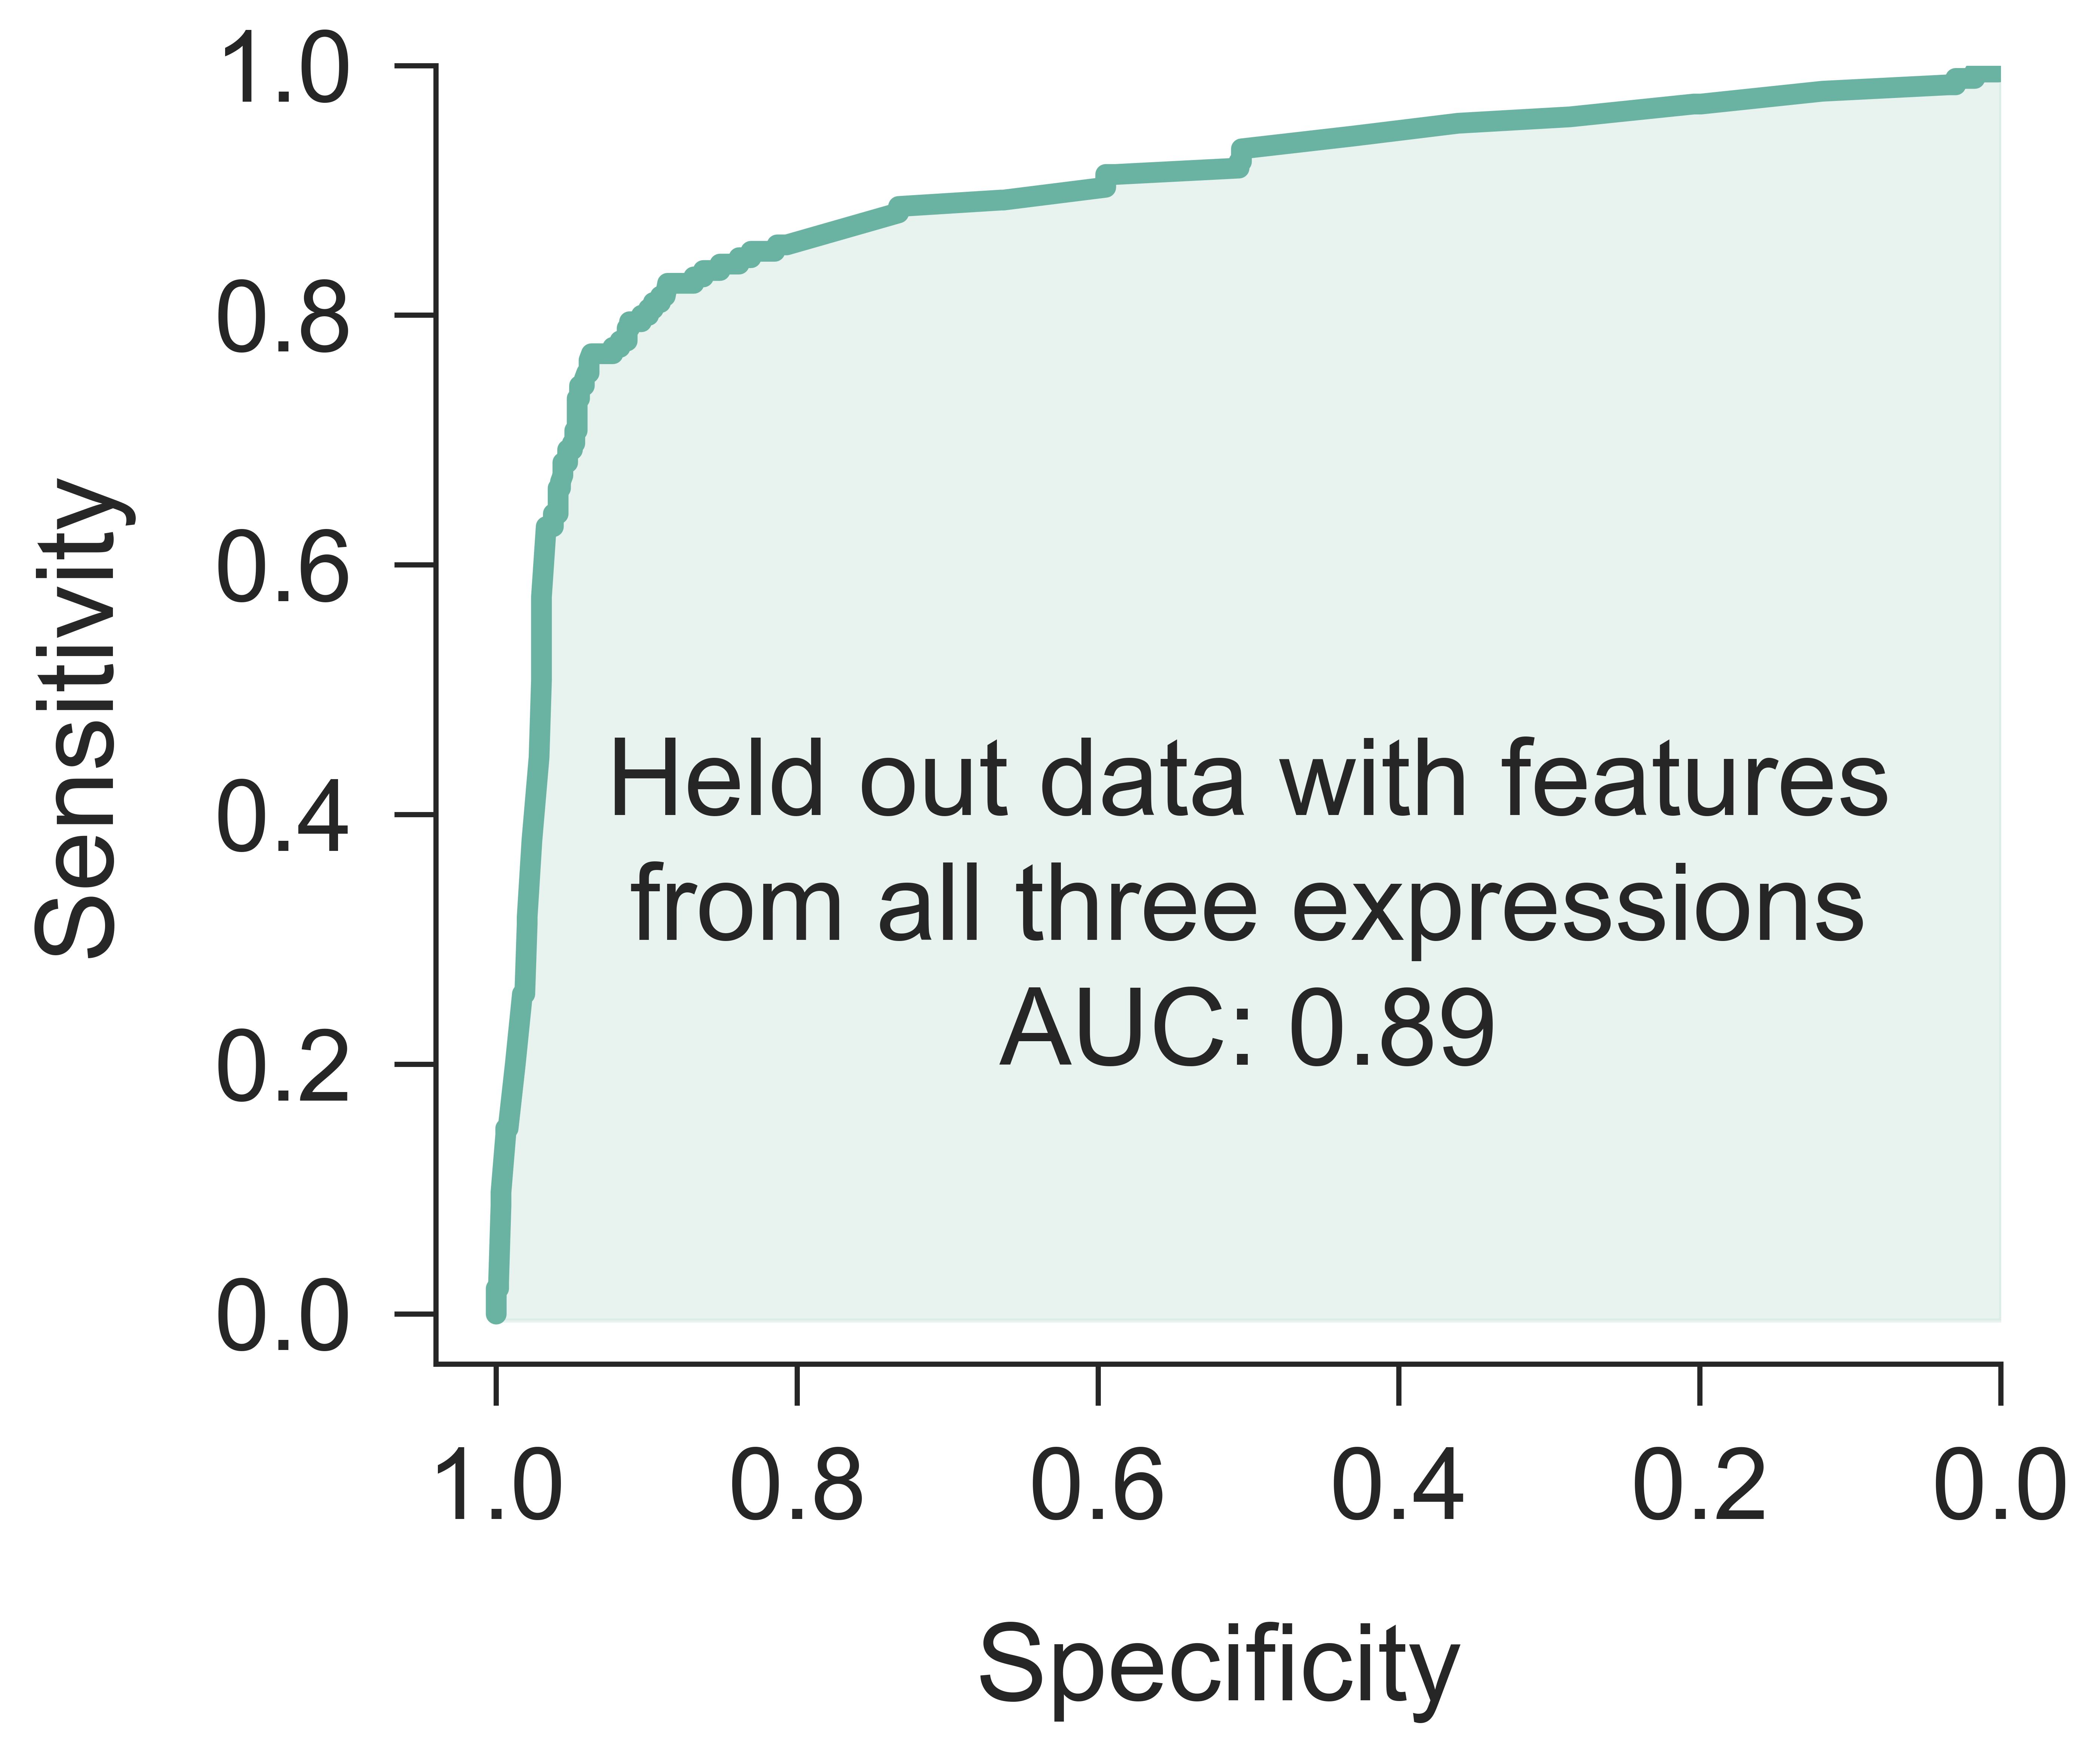
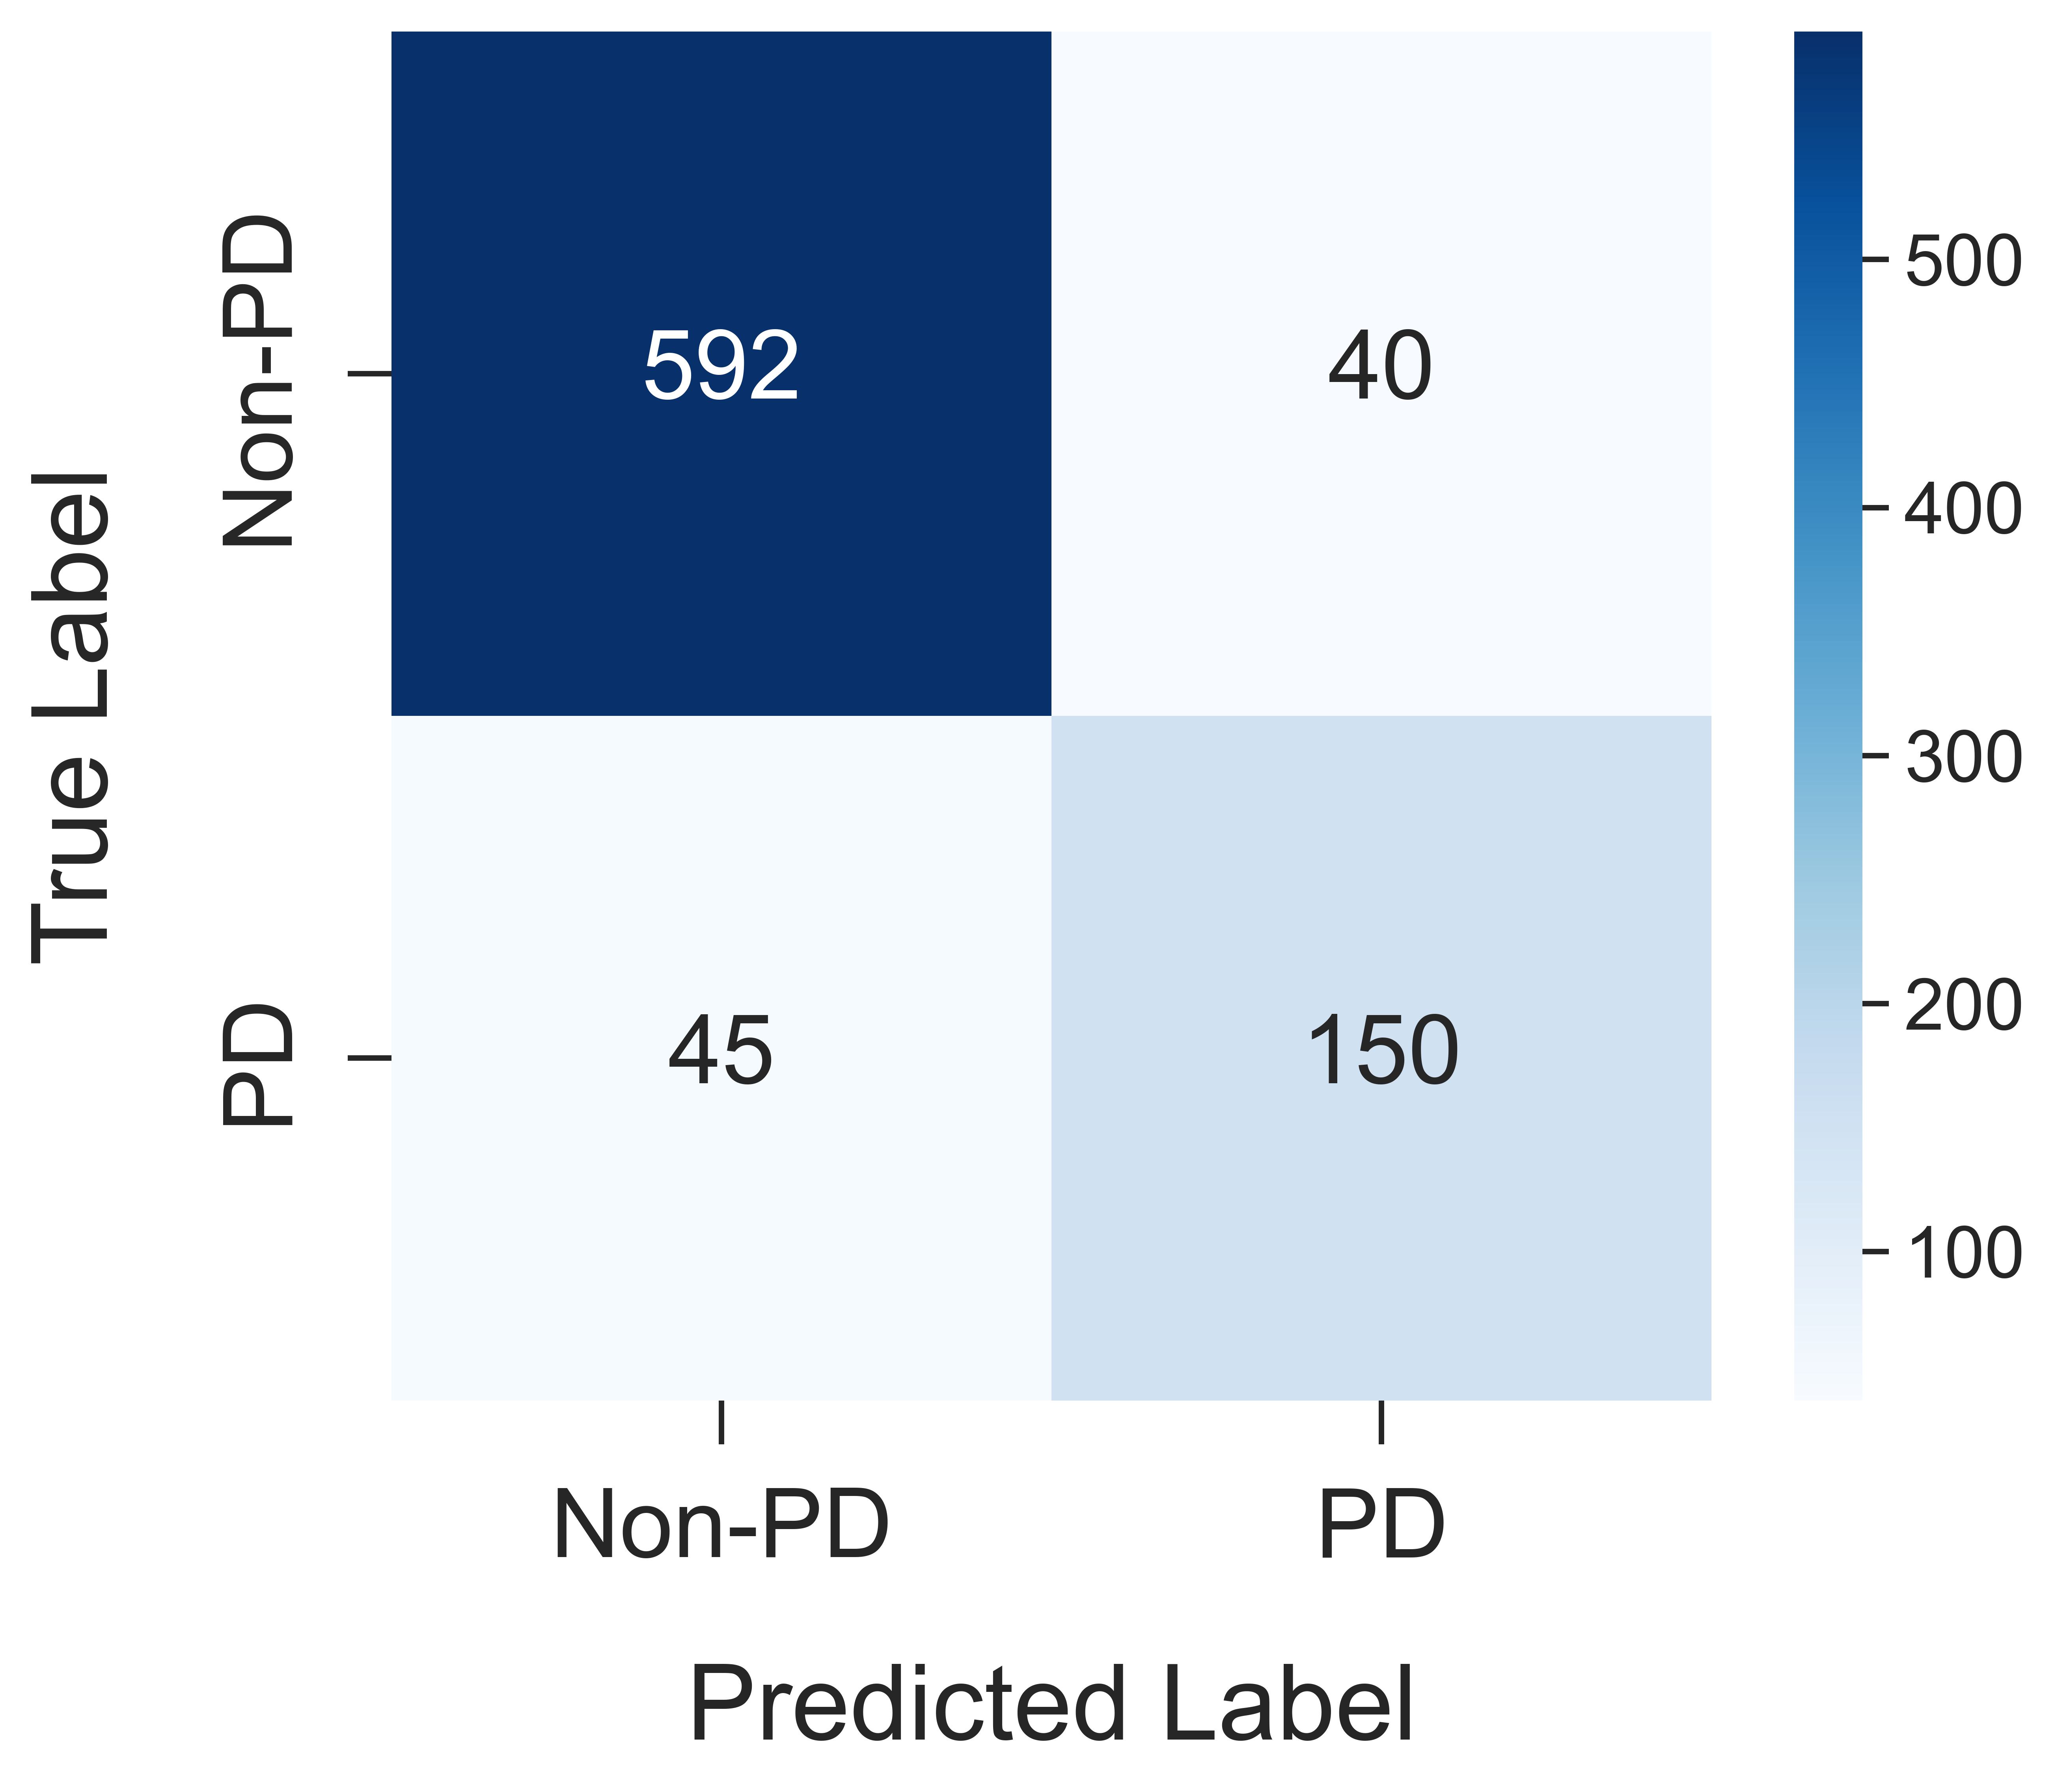
Our model exhibited robust performance based on numerous widely accepted metrics when tested on the held-out data (Figure 2). In differentiating between participants with and without Parkinson’s disease, our ensemble model achieved an accuracy of , with an Area Under the Receiver Operating Characteristic Curve (AUROC) of . The model displayed a specificity of and a sensitivity of . Additionally, the positive predictive value (PPV) of and the negative predictive value (NPV) of further reinforce the model’s reliability in predictive performance.
With only the smile expression
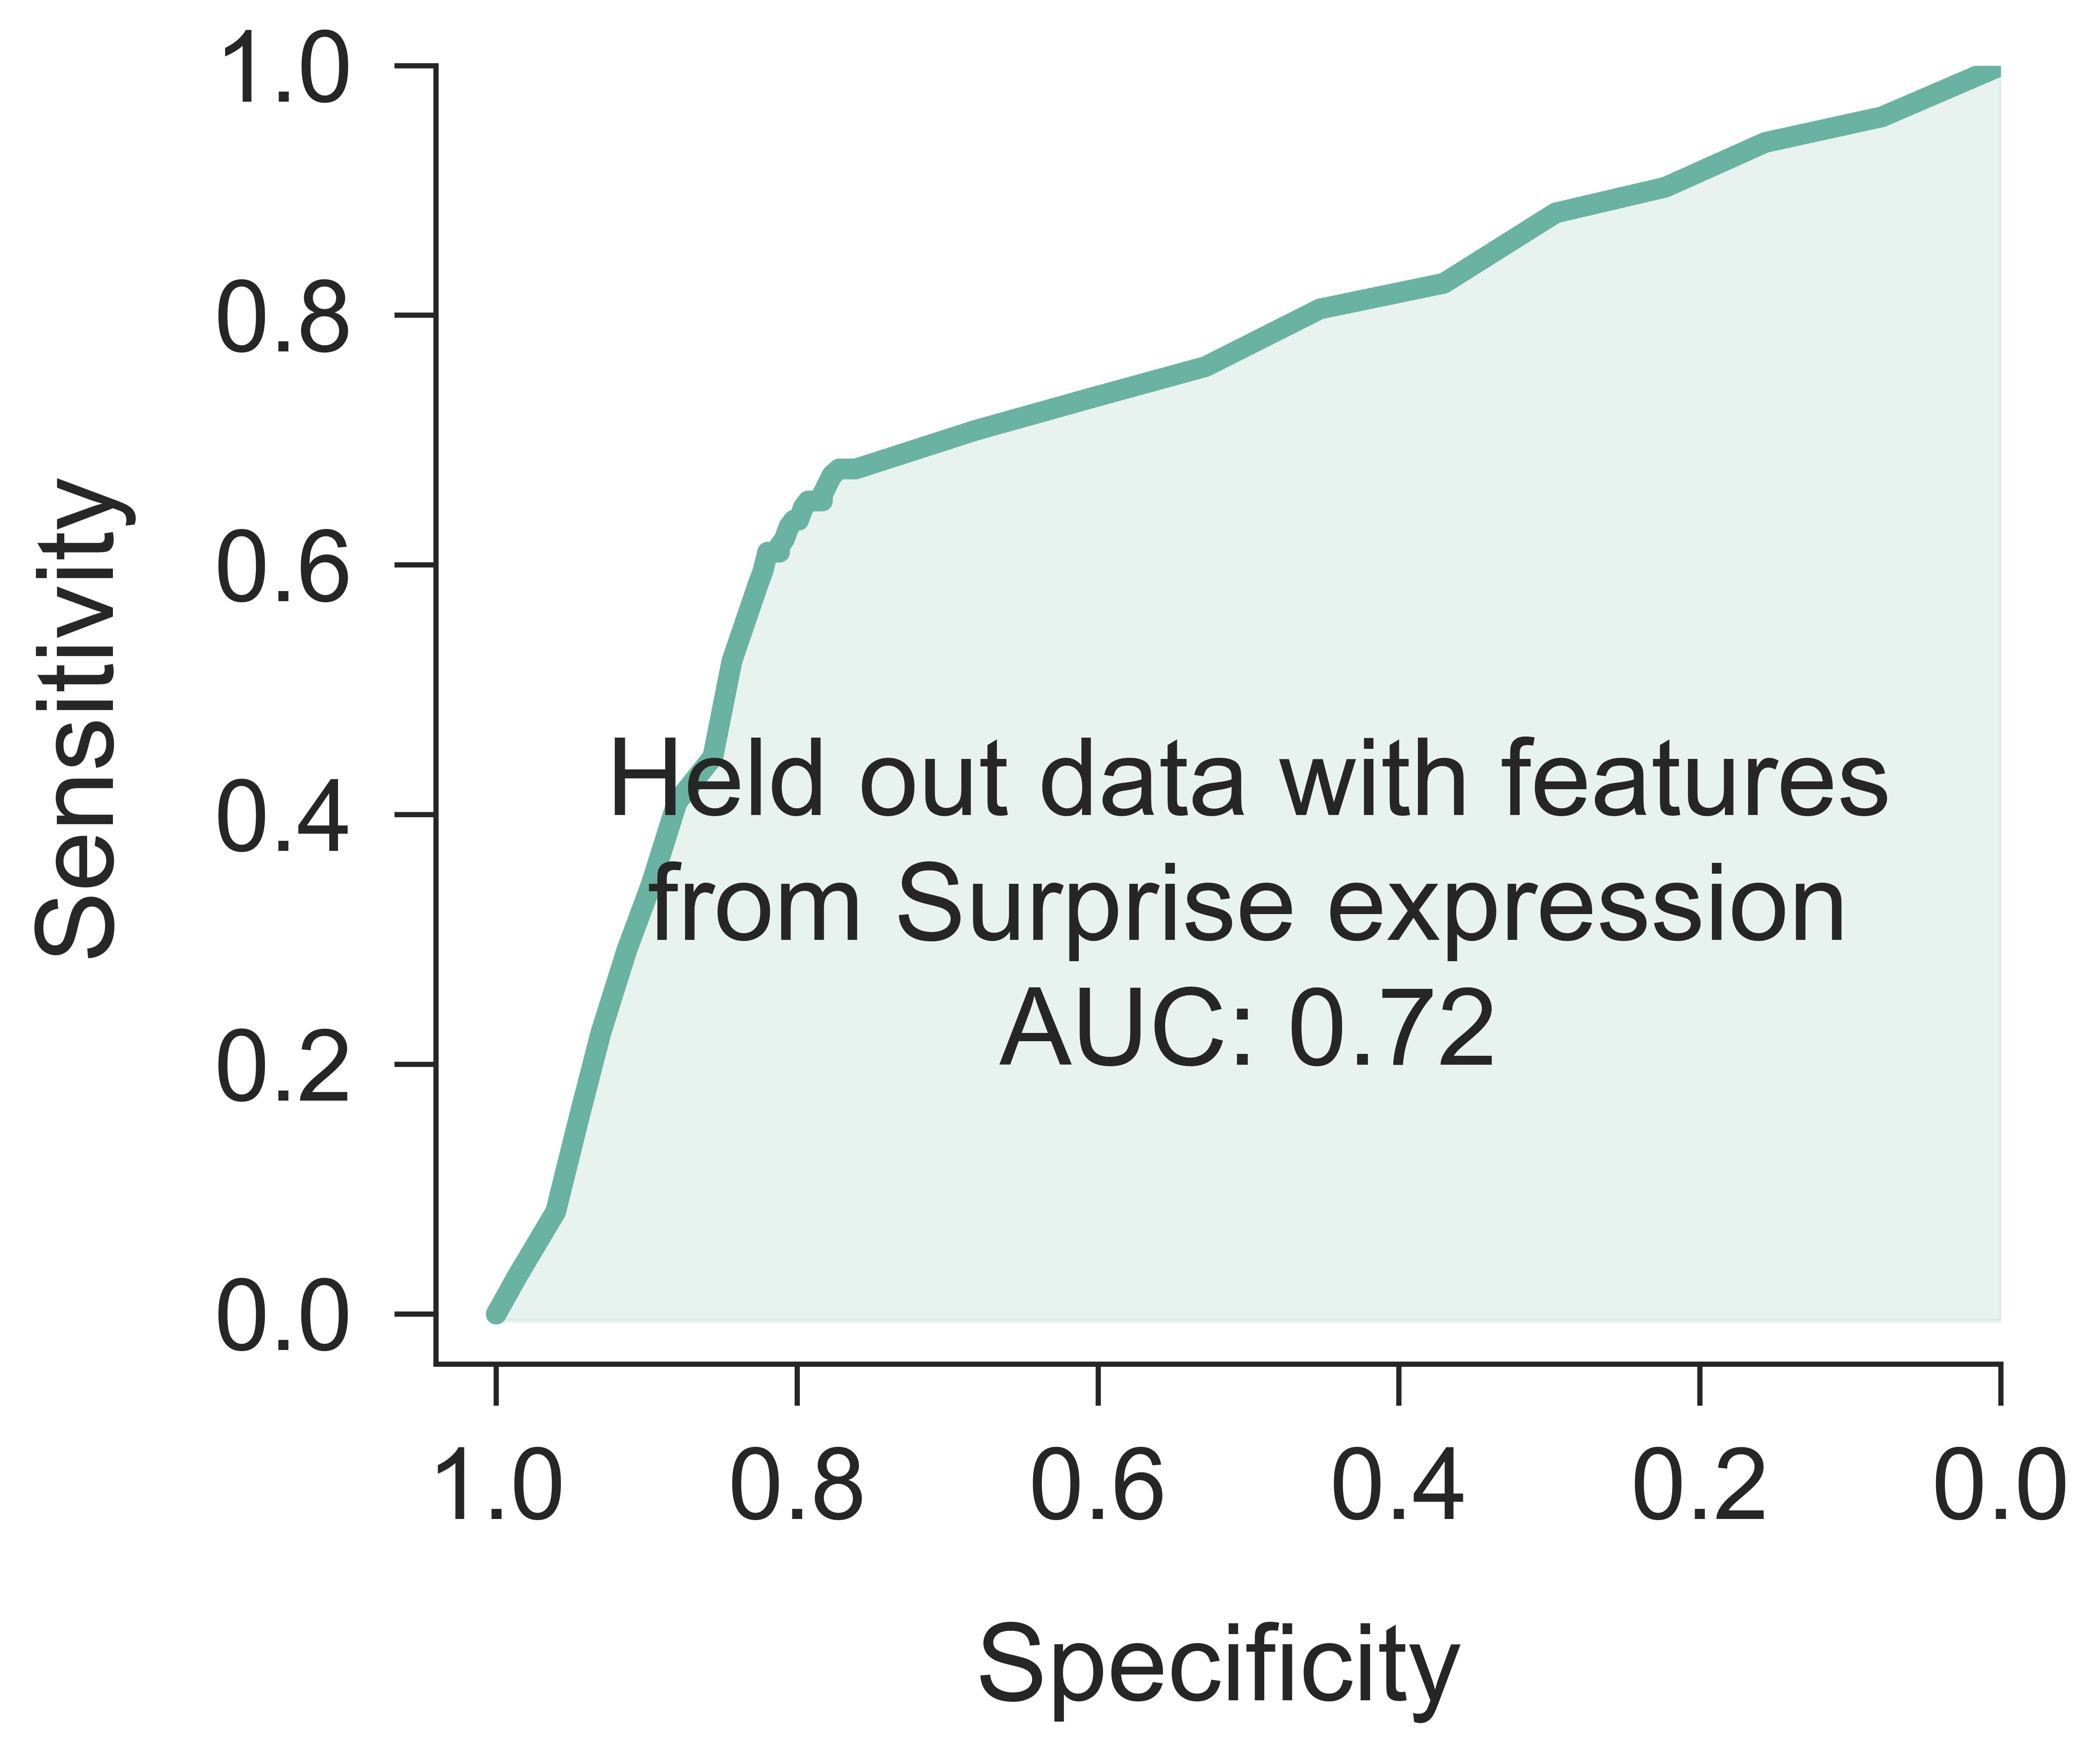
We also explored whether we can differentiate individuals with and without PD by looking at a single facial expression. Although the performance of the predictive model notably degraded while using only one of the three facial expressions, the performance remained competitive for the smile expression. We followed the same training and testing strategy as previously described but with a slight modification. Rather than utilizing features from all three facial expressions (disgust, smile, and surprise), we focused on using features from a specific facial expression in each experiment. For the smile expression, an ensemble of SVM models performed the best, achieving an accuracy of and an AUROC score of . In addition, the specificity, sensitivity, PPV, and NPV of the predictive model were , , , and , respectively. Unlike the smile expression, the performance of the predictive model was much worse when features from only disgust or surprise expressions were used. The accuracy and AUROC of the best predictive model were and respectively, when only disgust features were used. Similarly, the best model using only surprise features achieved an accuracy of and an AUROC of .
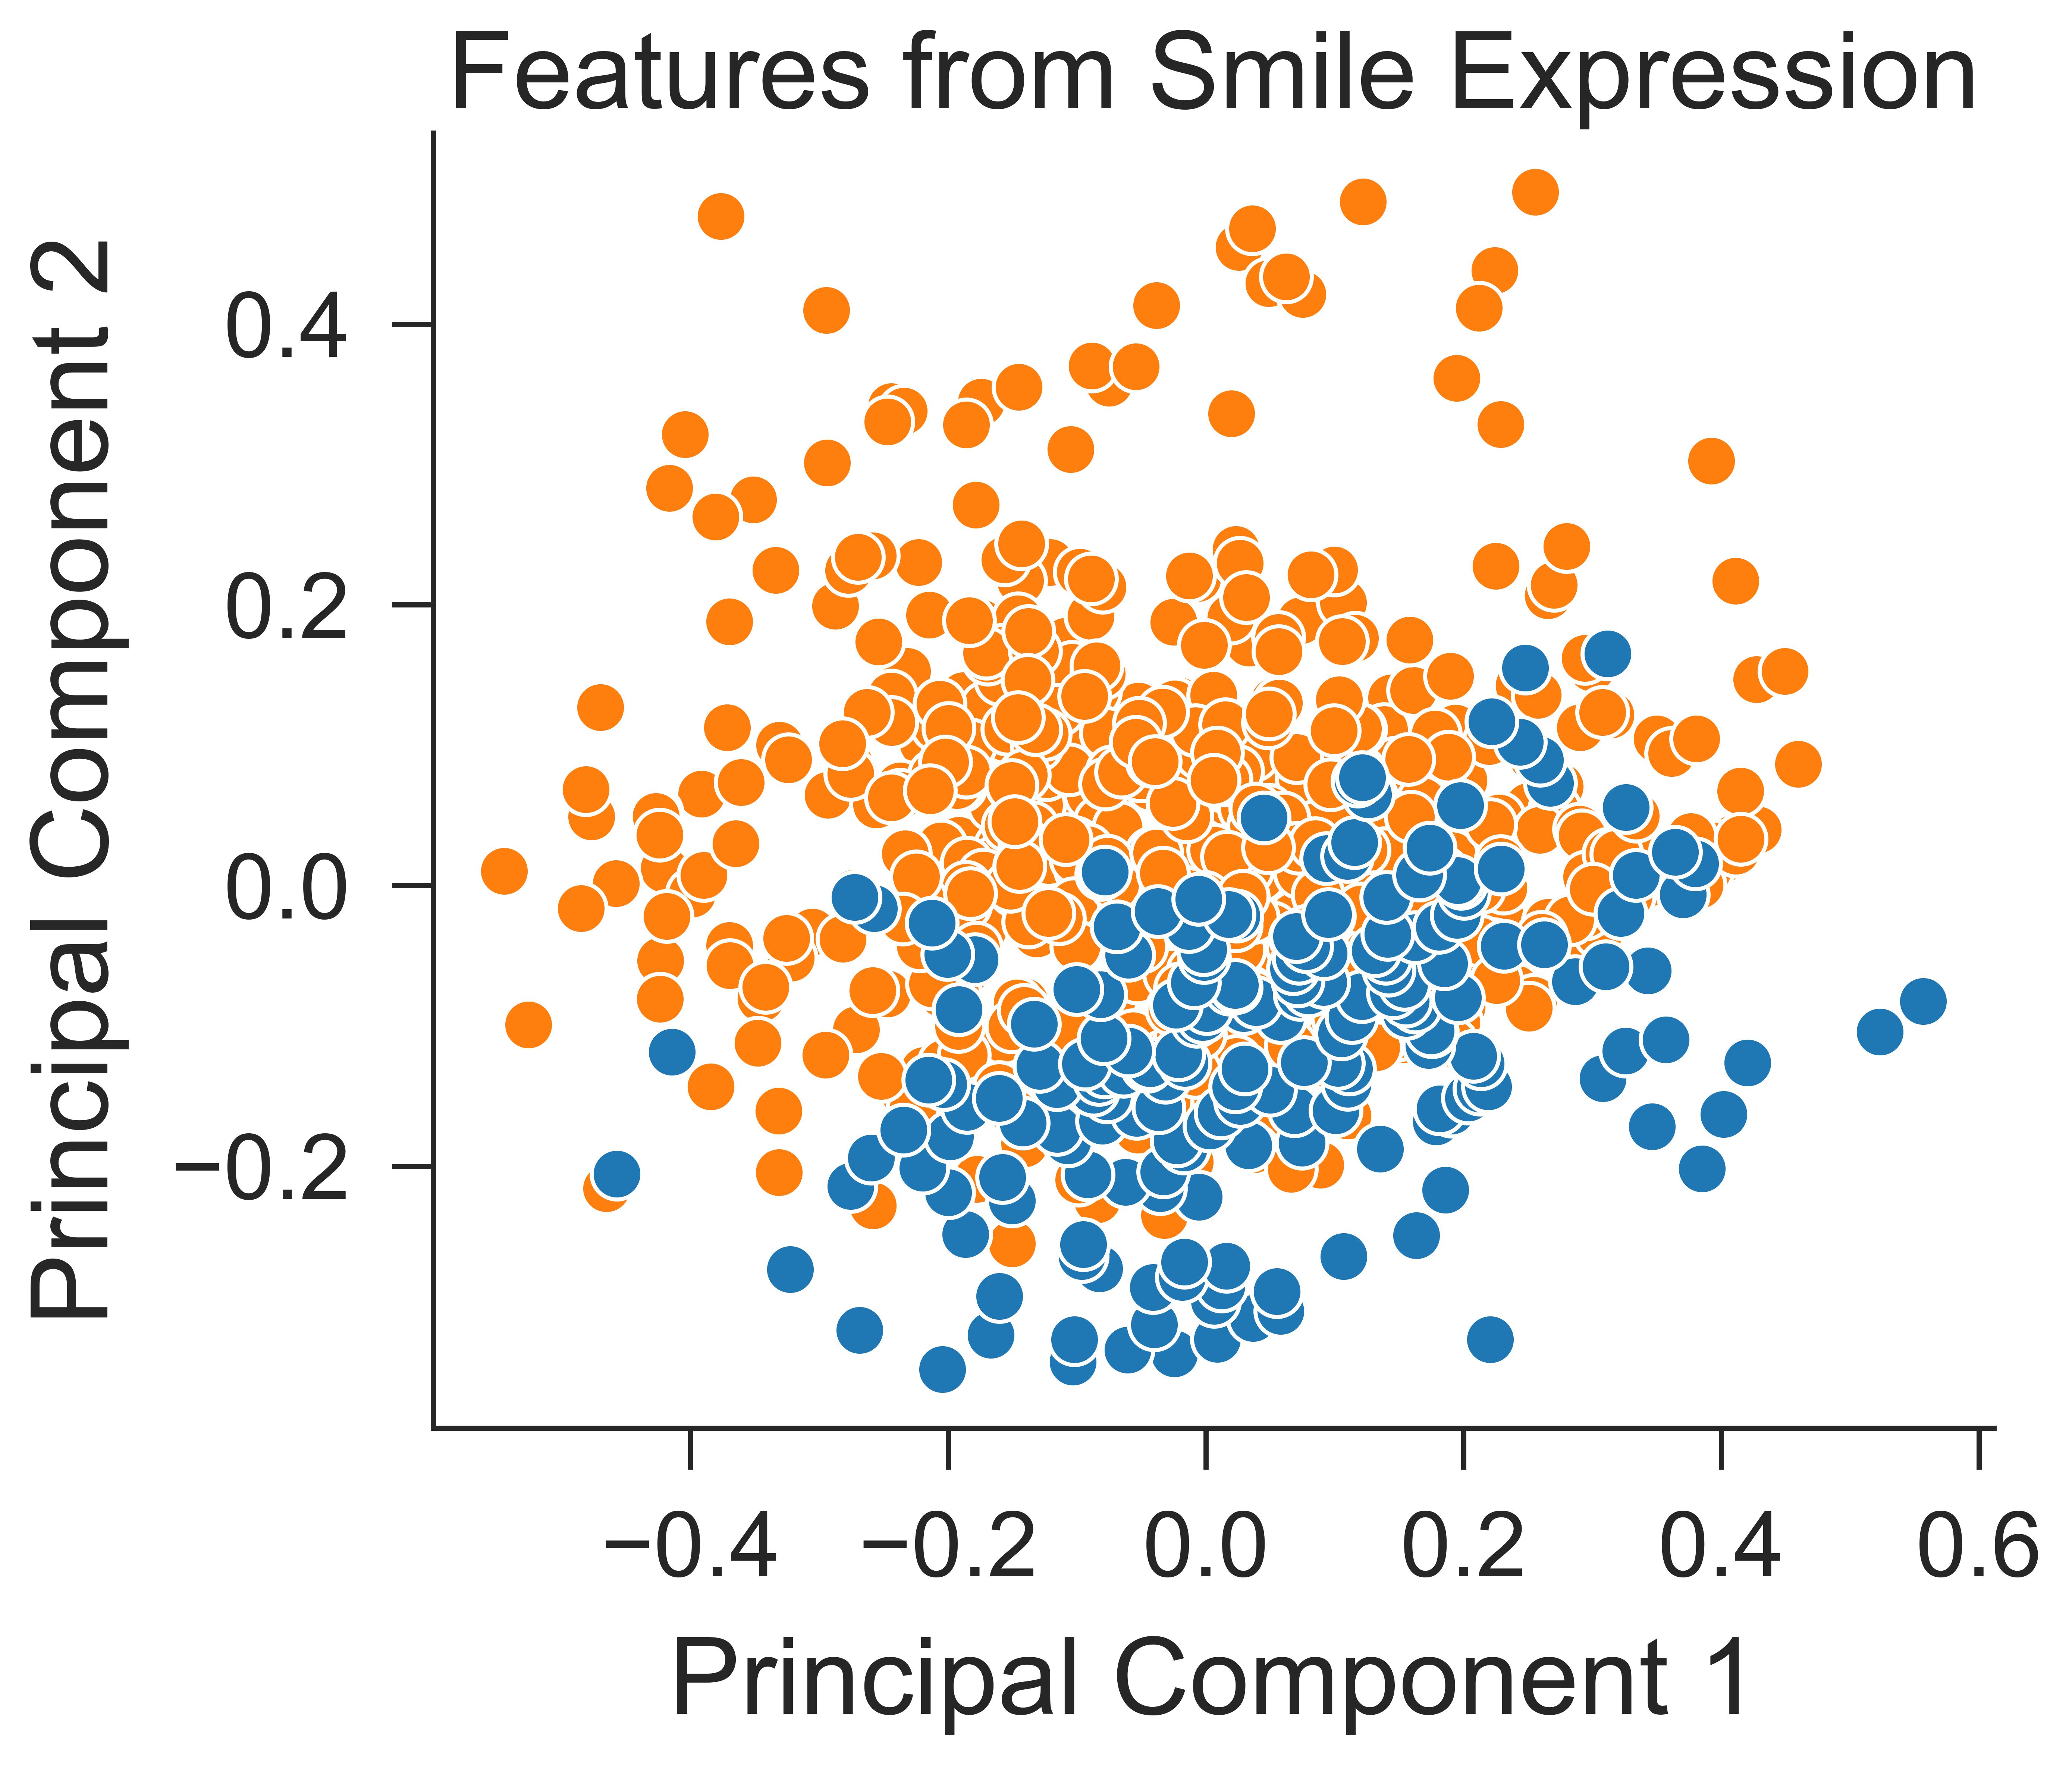
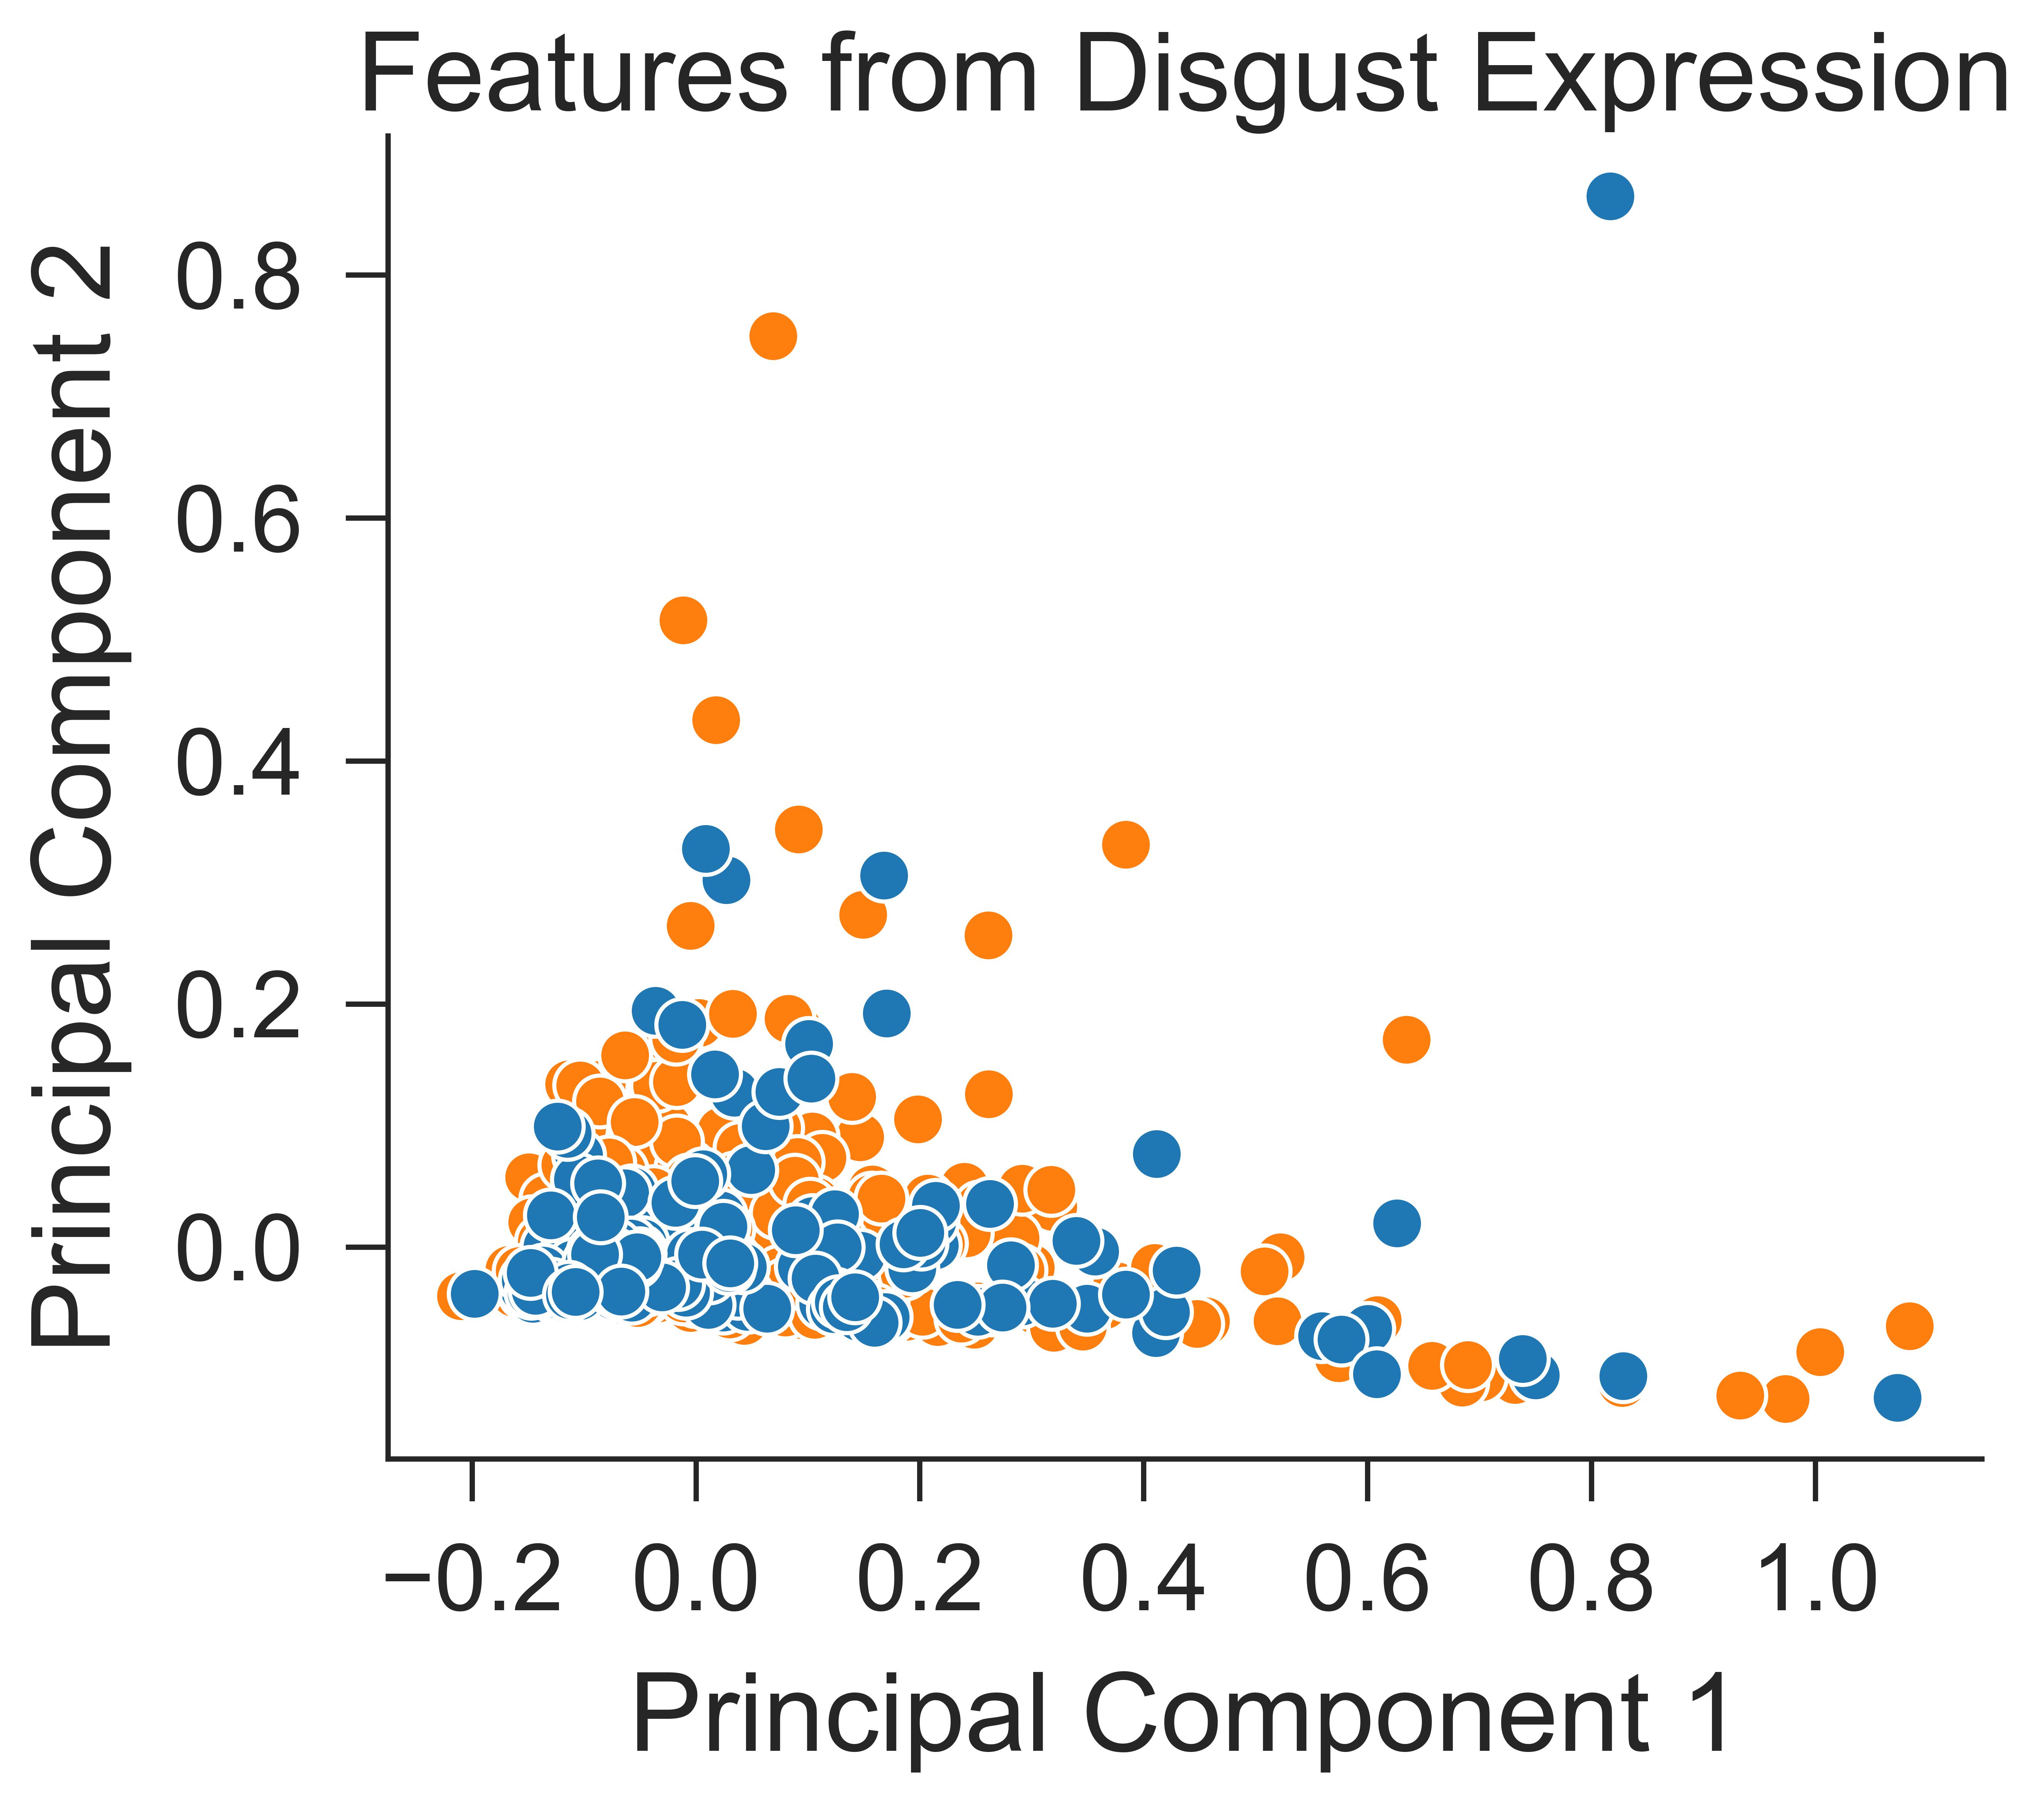
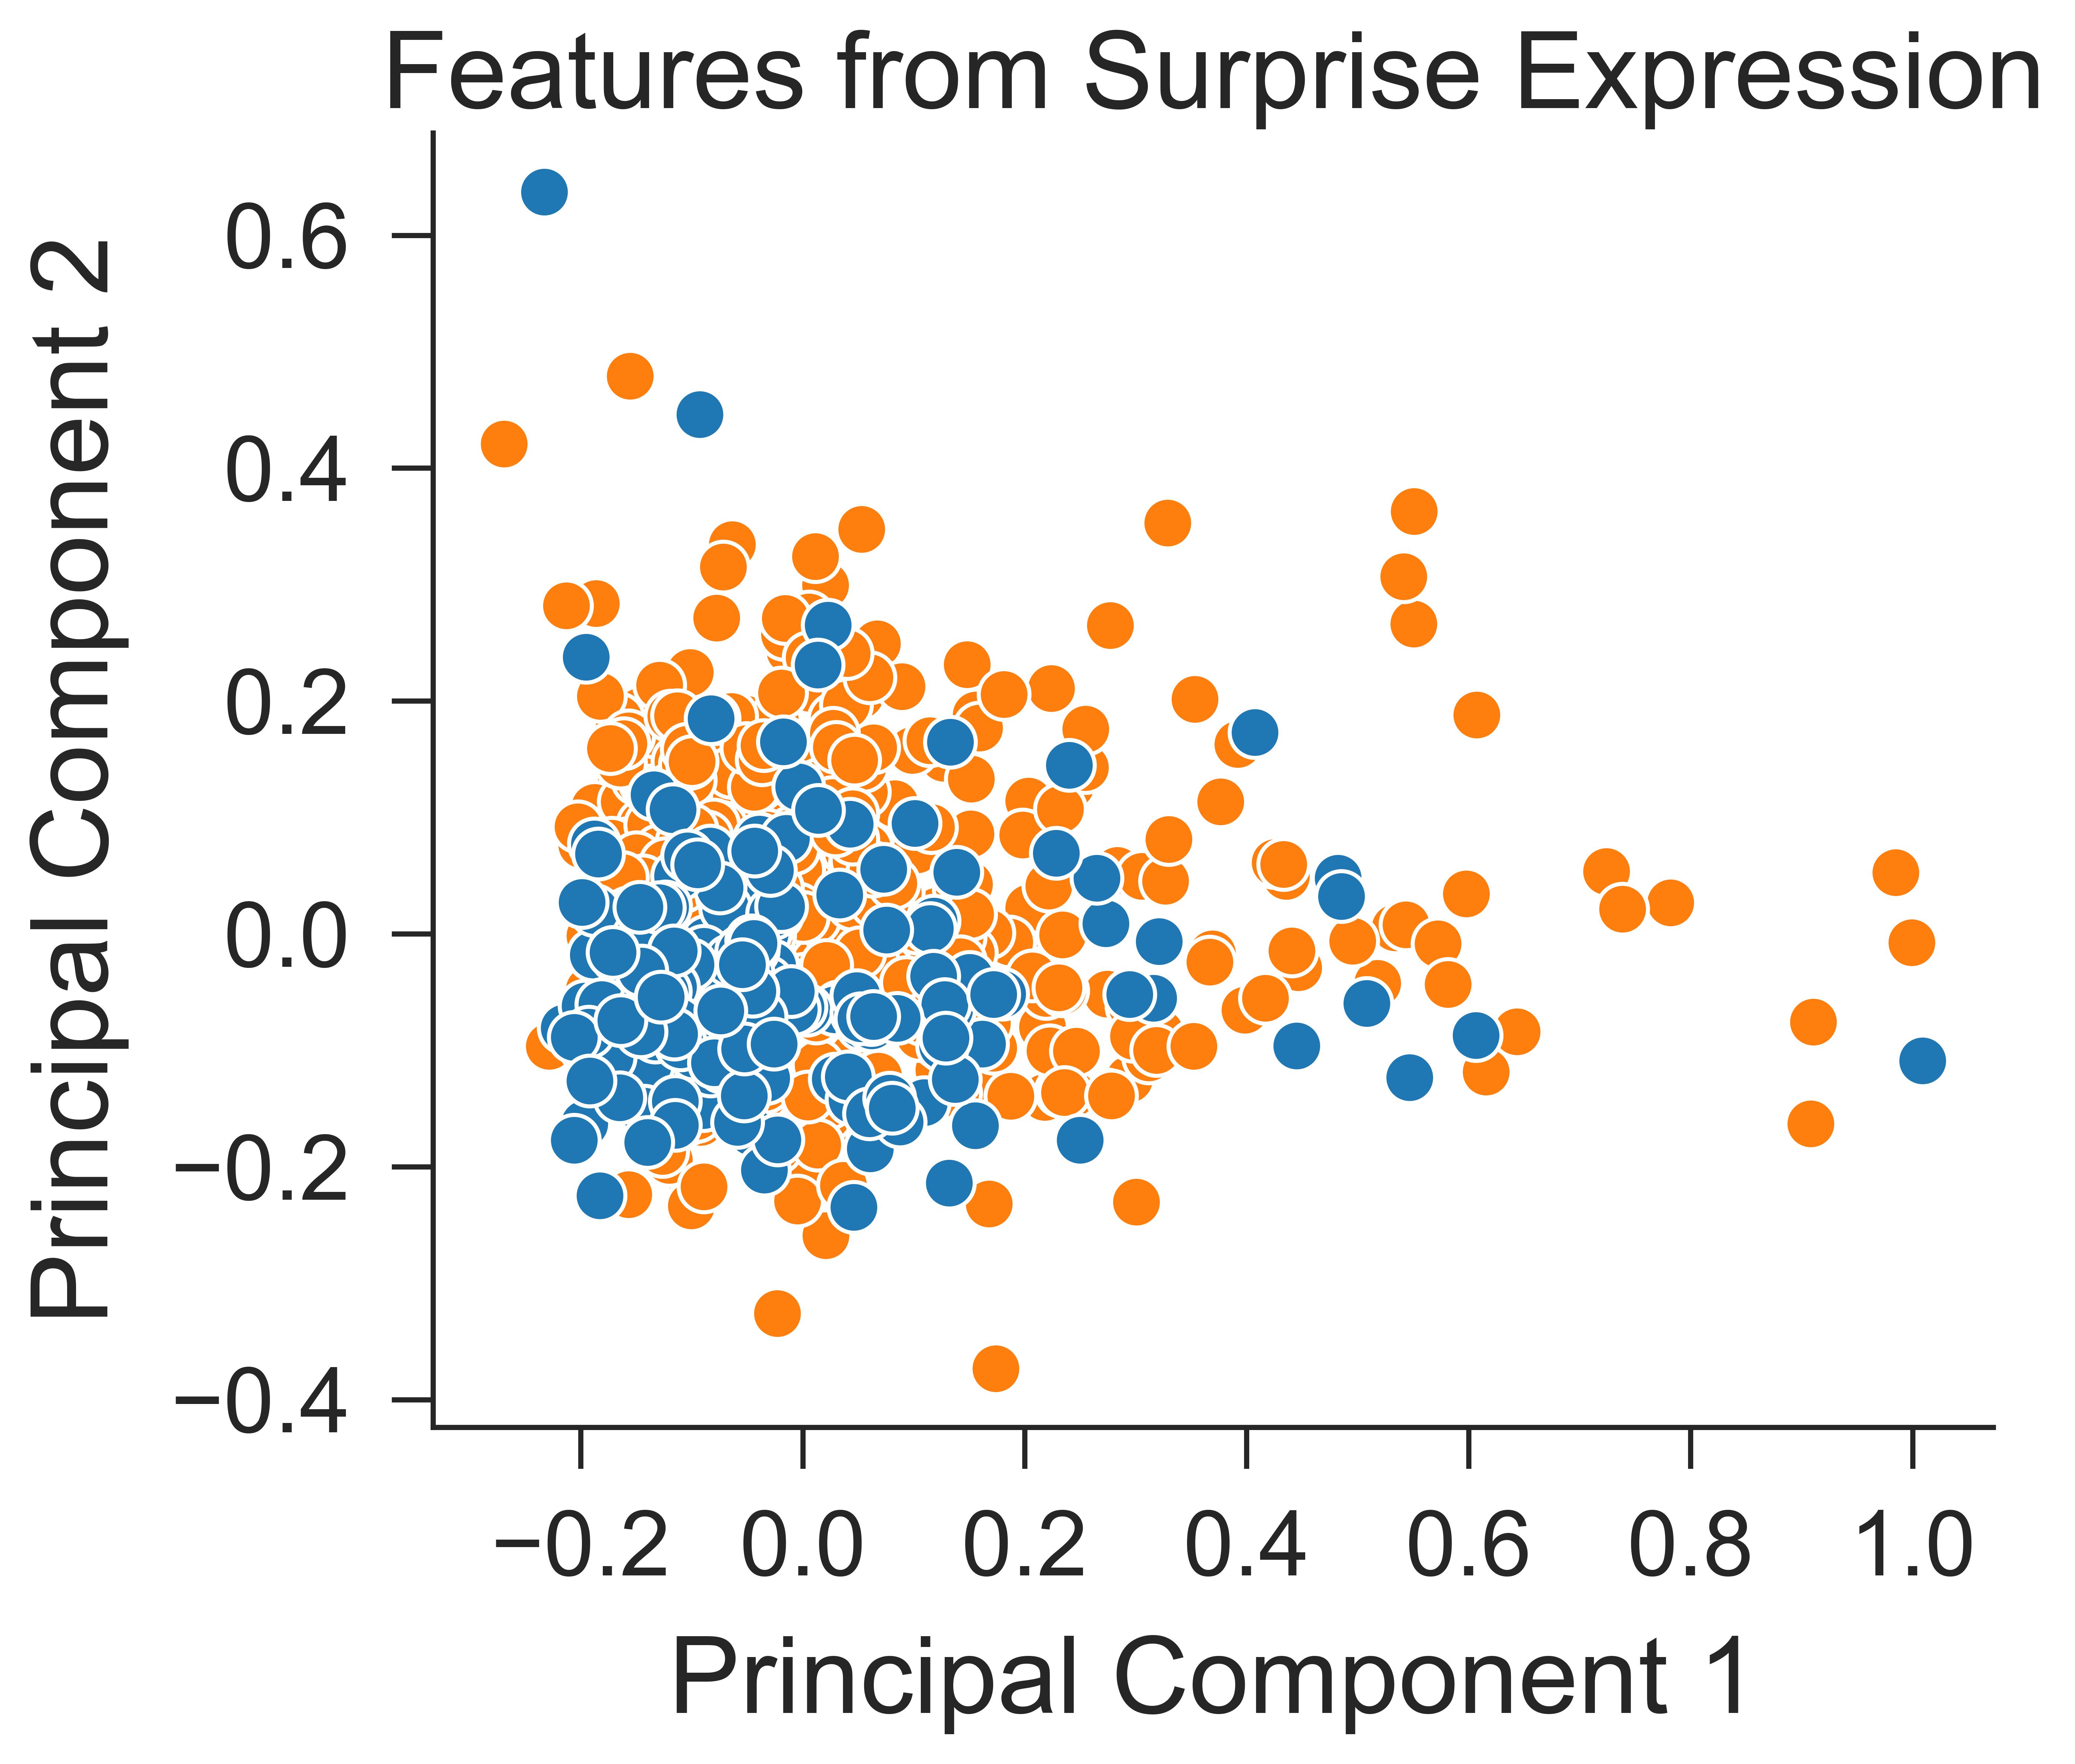
Using principal component analysis (Bro and Smilde 2014), we further observed that the features extracted from the smile task are relatively more separable (silhouette score (Rousseeuw 1987) = ) between subgroups of participants with and without PD compared to the disgust (silhouette score = ) and surprise tasks (silhouette score = ), as shown in Figure 4. This may potentially explain why the model trained on smile expression features performed better than the other expressions.
Generalization to External Test Data
We excluded data obtained from two settings, namely Clinic and Home-BD, from the training process of the model. Instead, we specifically reserved this data for external validation. Conducting external validation on data obtained from a clinic (located in New York, US) offers preliminary insights into the model’s performance when implemented in a clinical environment. Additionally, testing the model on data collected from a different country (Bangladesh) enables us to gain a further understanding of how the features and potential PD symptoms may differ among individuals from a distinct cultural backgrounds compared to the United States. In general, achieving robust performance on data collected from previously unseen settings and diverse geographical locations, ranging from New York to Ohio to Bangladesh, serves as evidence of the model’s reliability and suggests that it is less susceptible to data shift (Zhang et al. 2022).
While the combination of features from all three facial expressions resulted in the highest performance on the held-out data, we observed a significant decrease in performance when testing the model on external test sets. Specifically, when the ensemble model trained on features from all three facial expressions was evaluated on data collected in the Clinic setting, the accuracy dropped to (an absolute decrease of ) and the AUROC score dropped to (an absolute decrease of ). Similarly, when tested on data collected from Bangladesh in the Home-BD setting, the predictive model achieved an accuracy of and an AUROC of . These results highlight a similar decline in performance when the model was applied to external data from different settings, demonstrating the challenges of generalization beyond the training data.
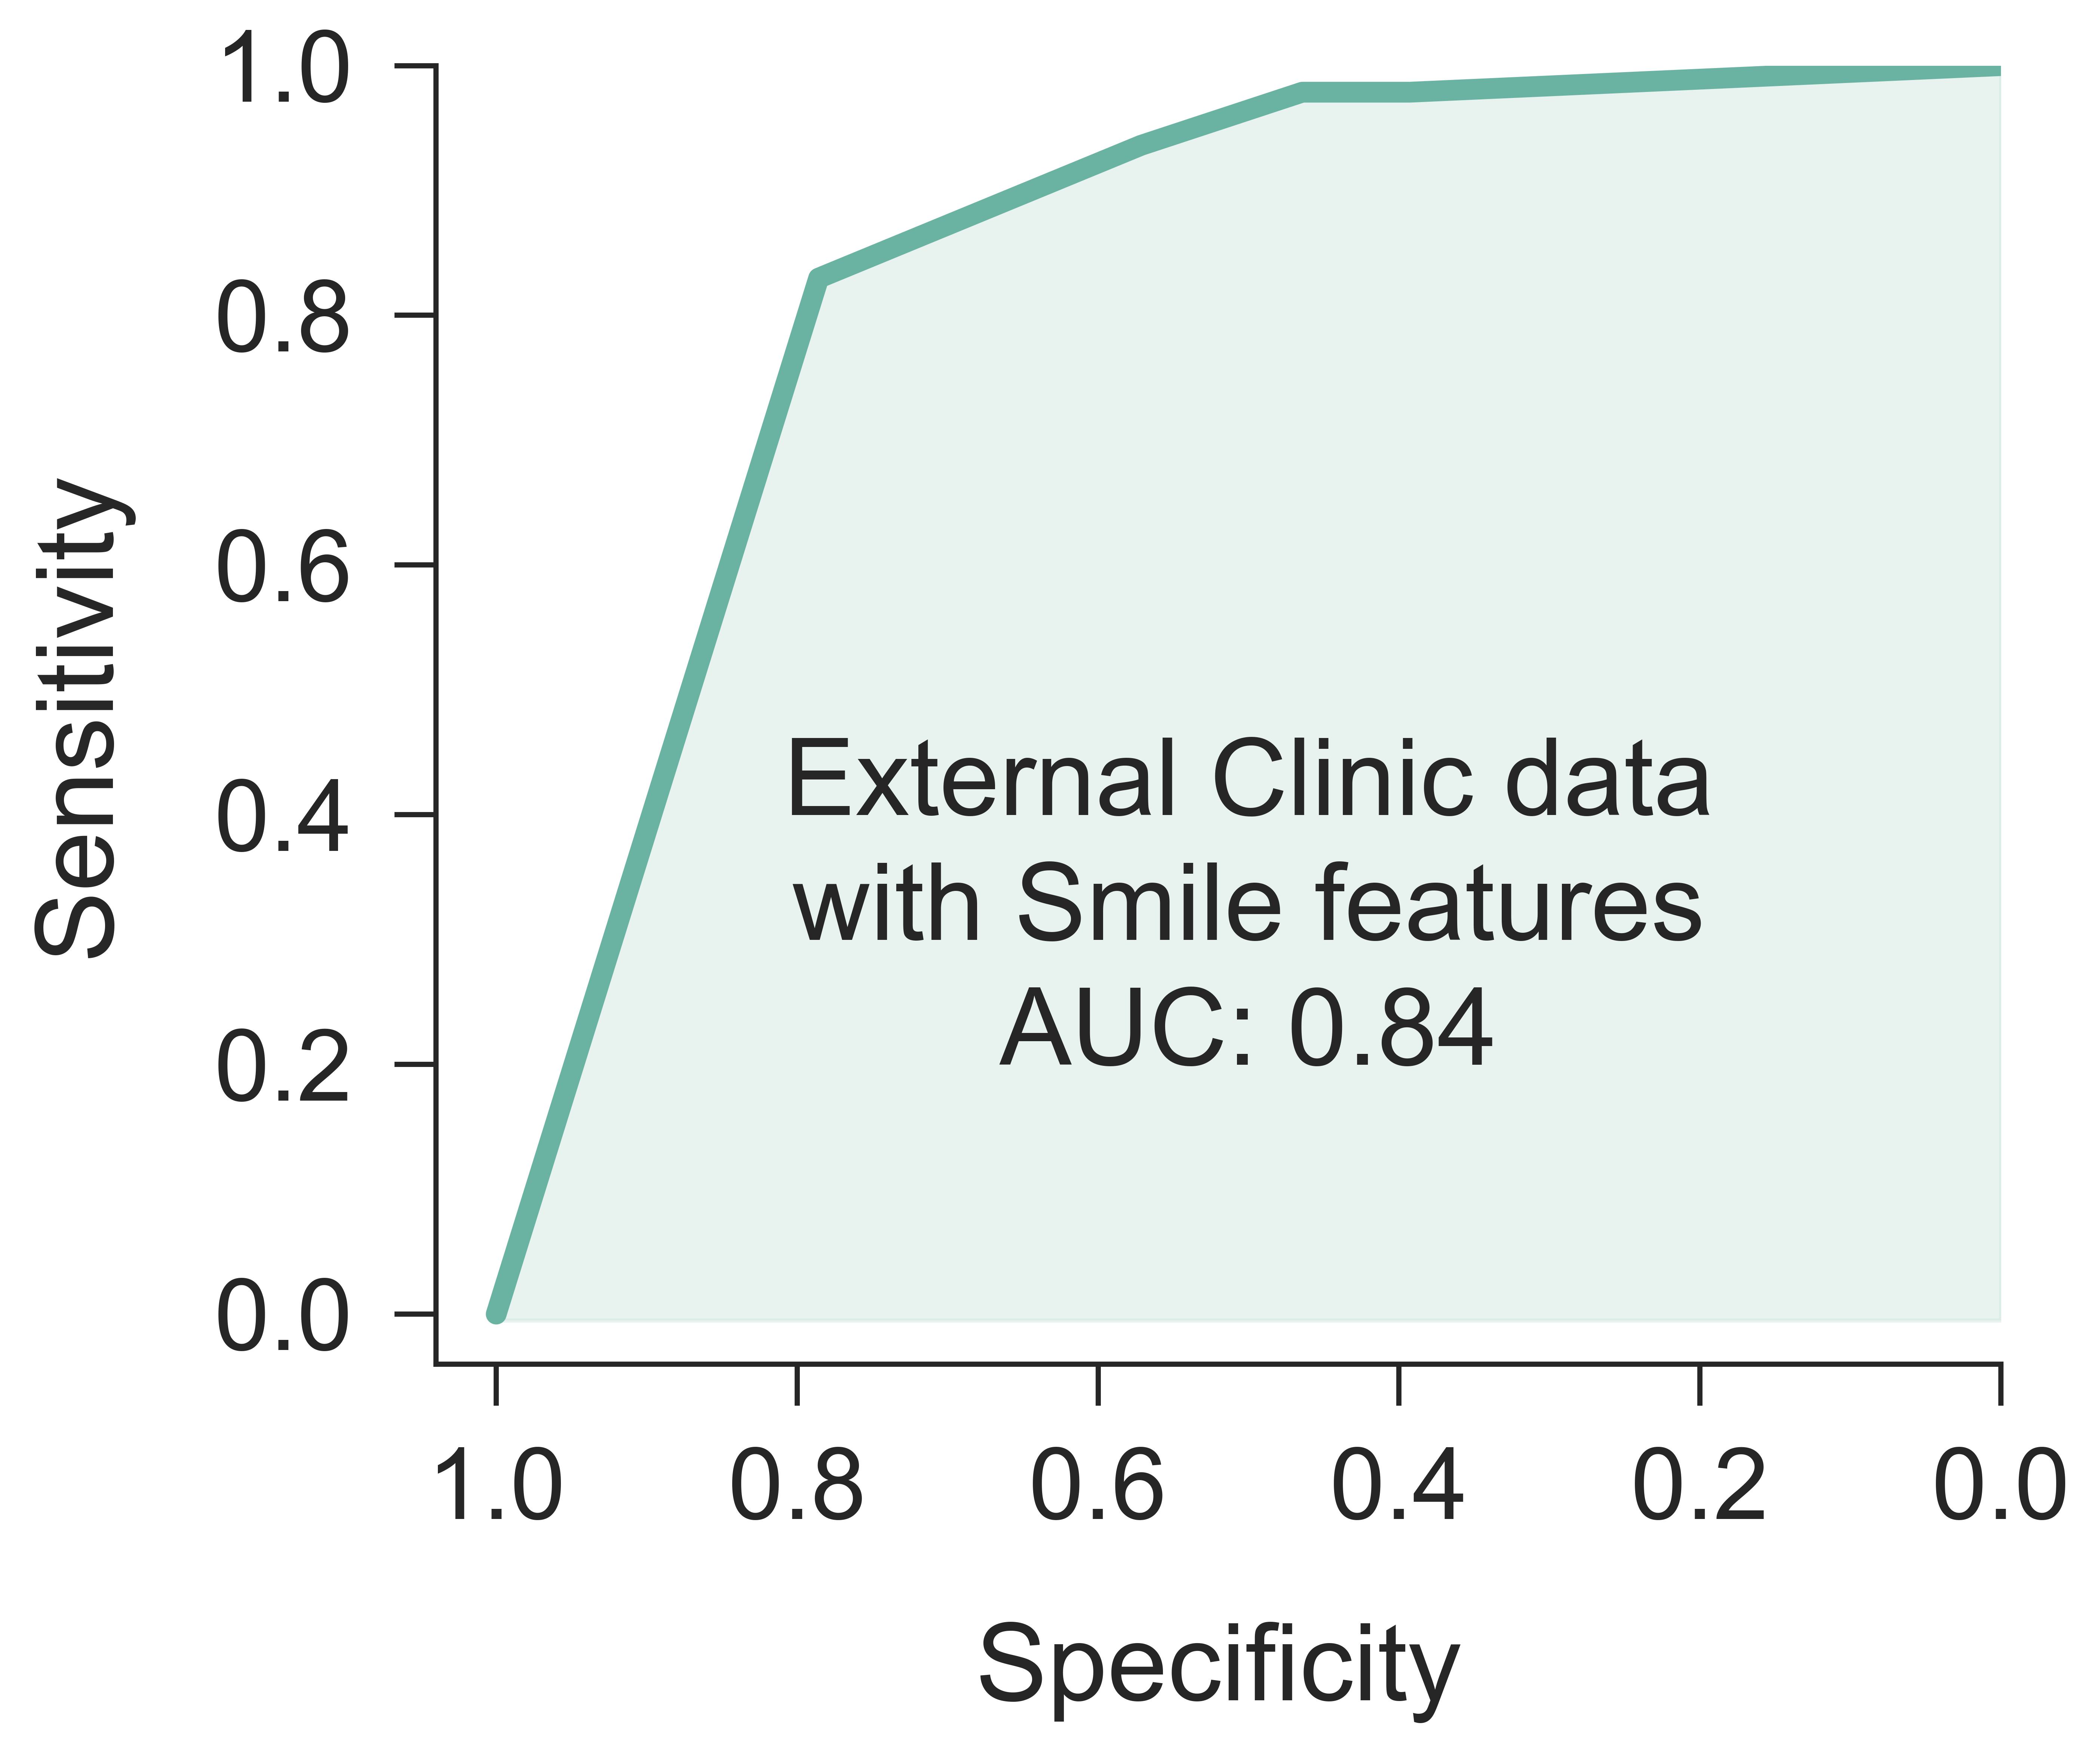
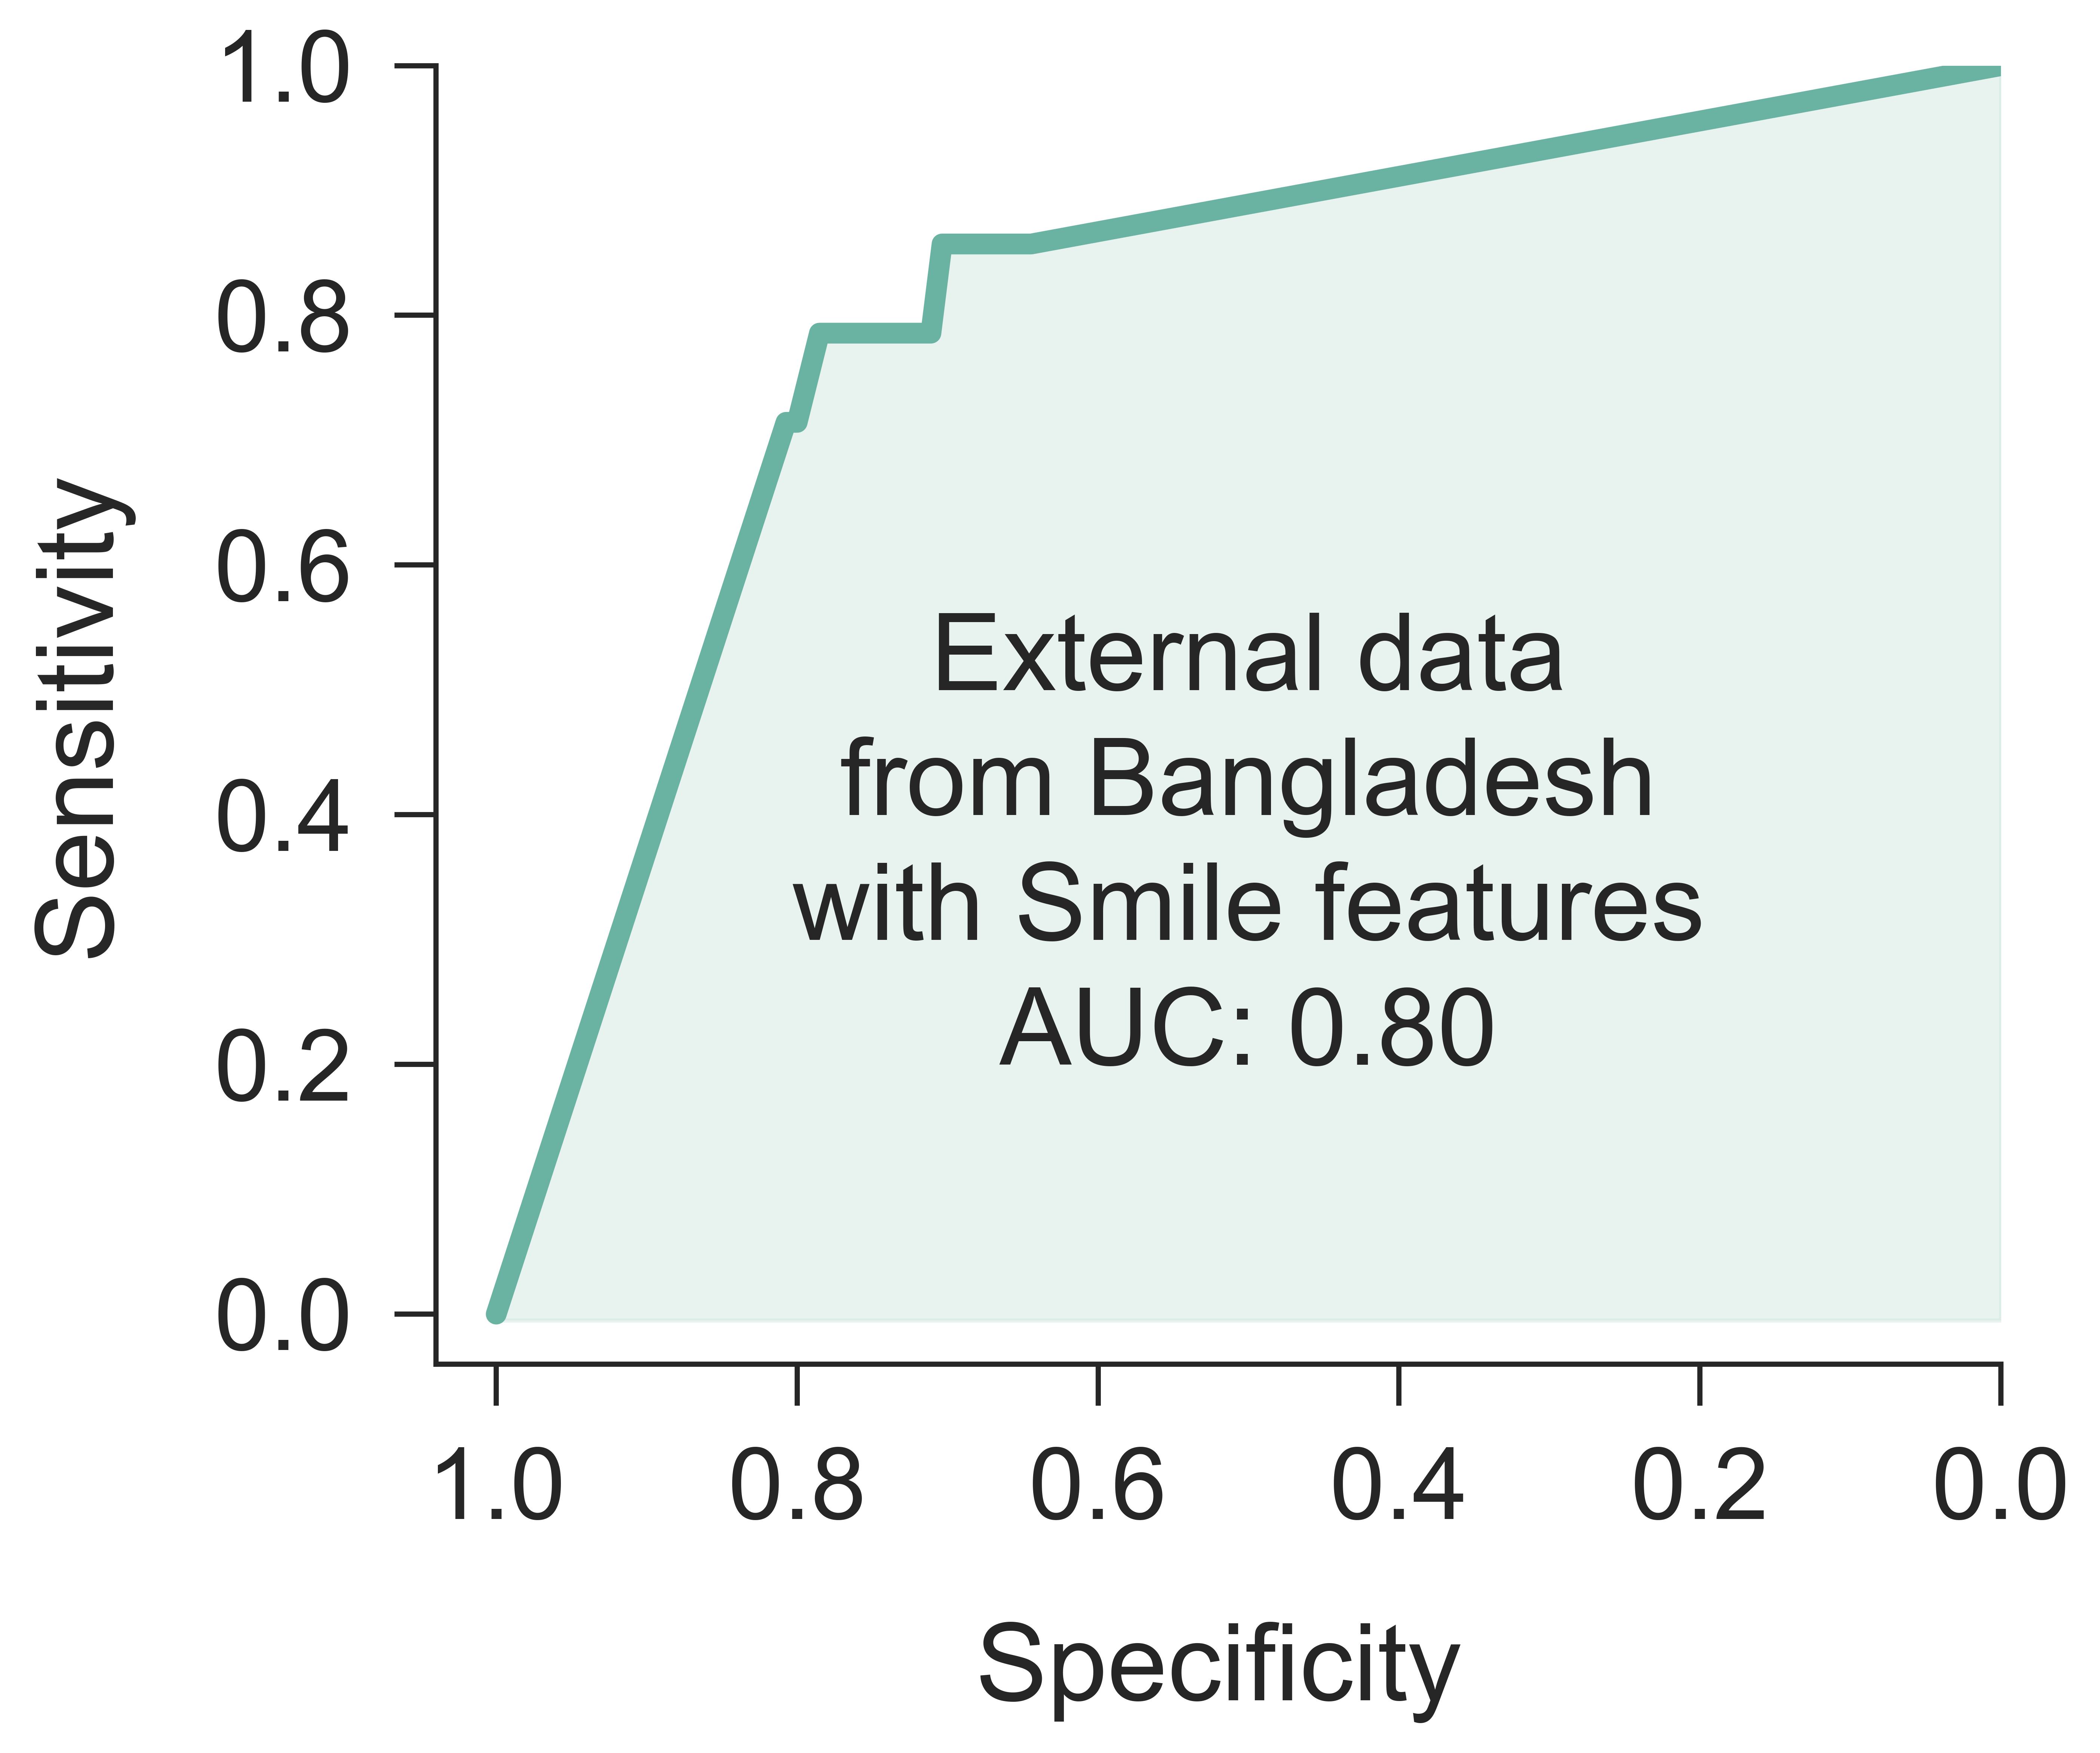
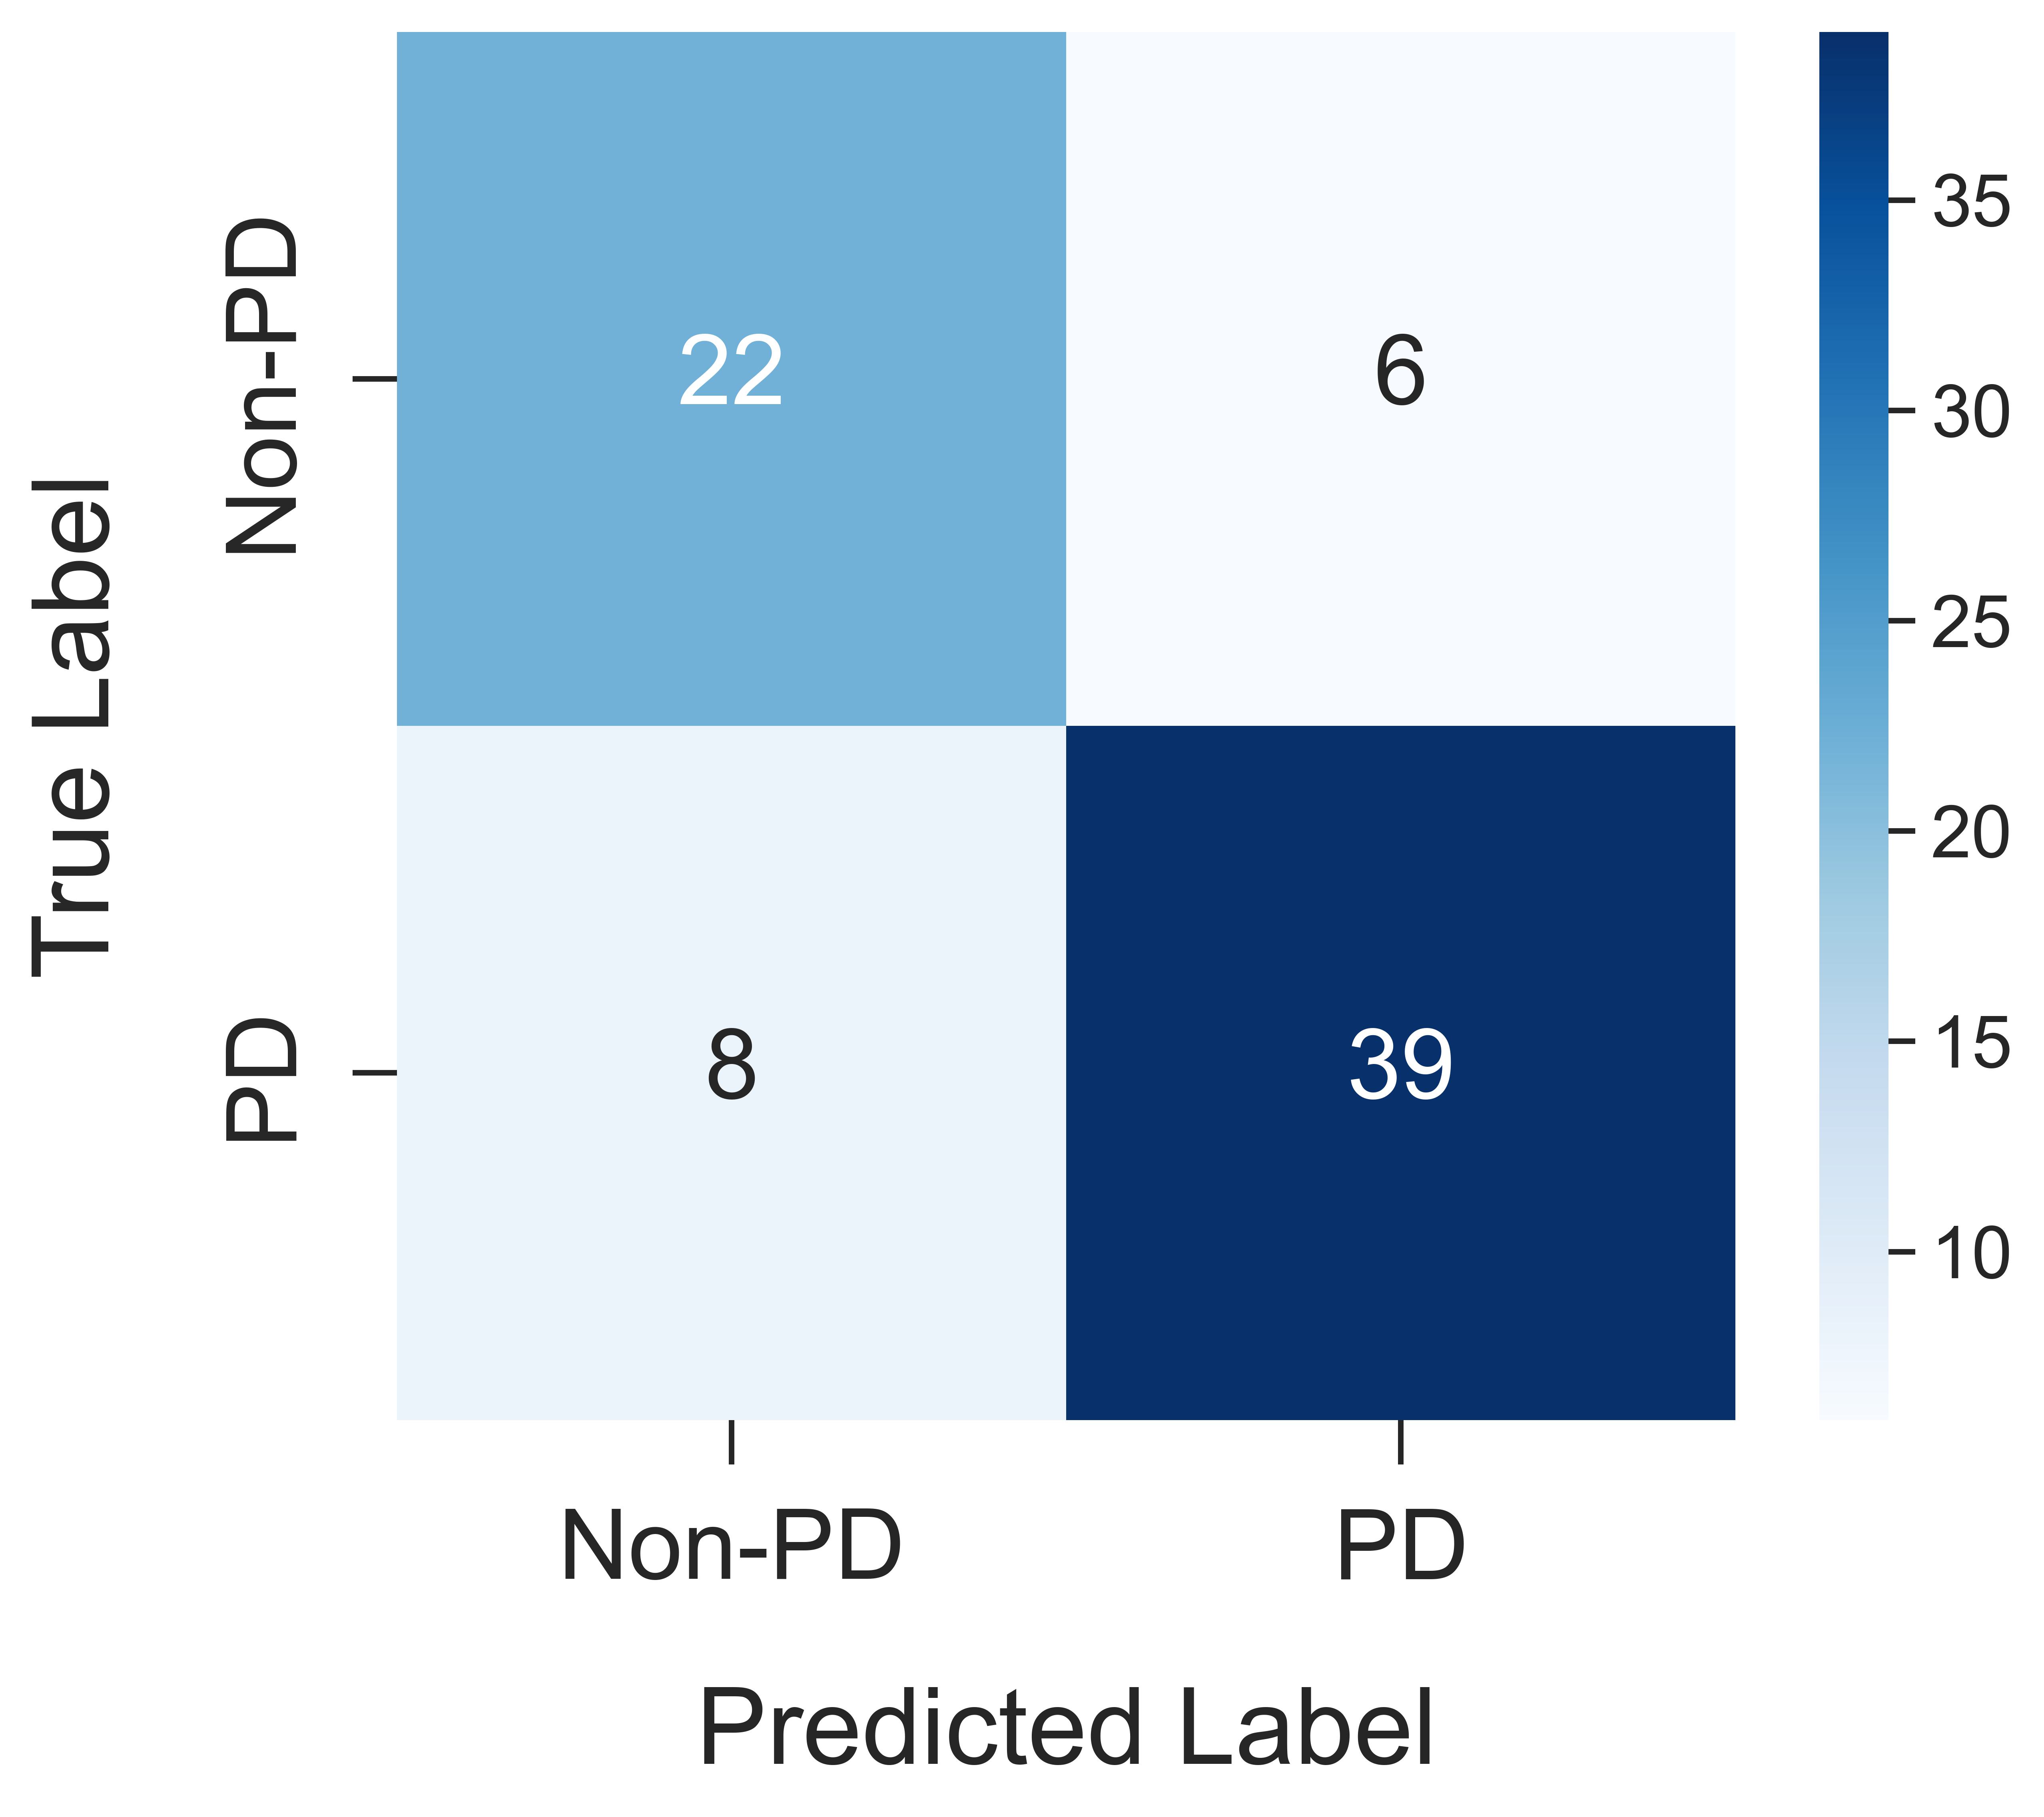
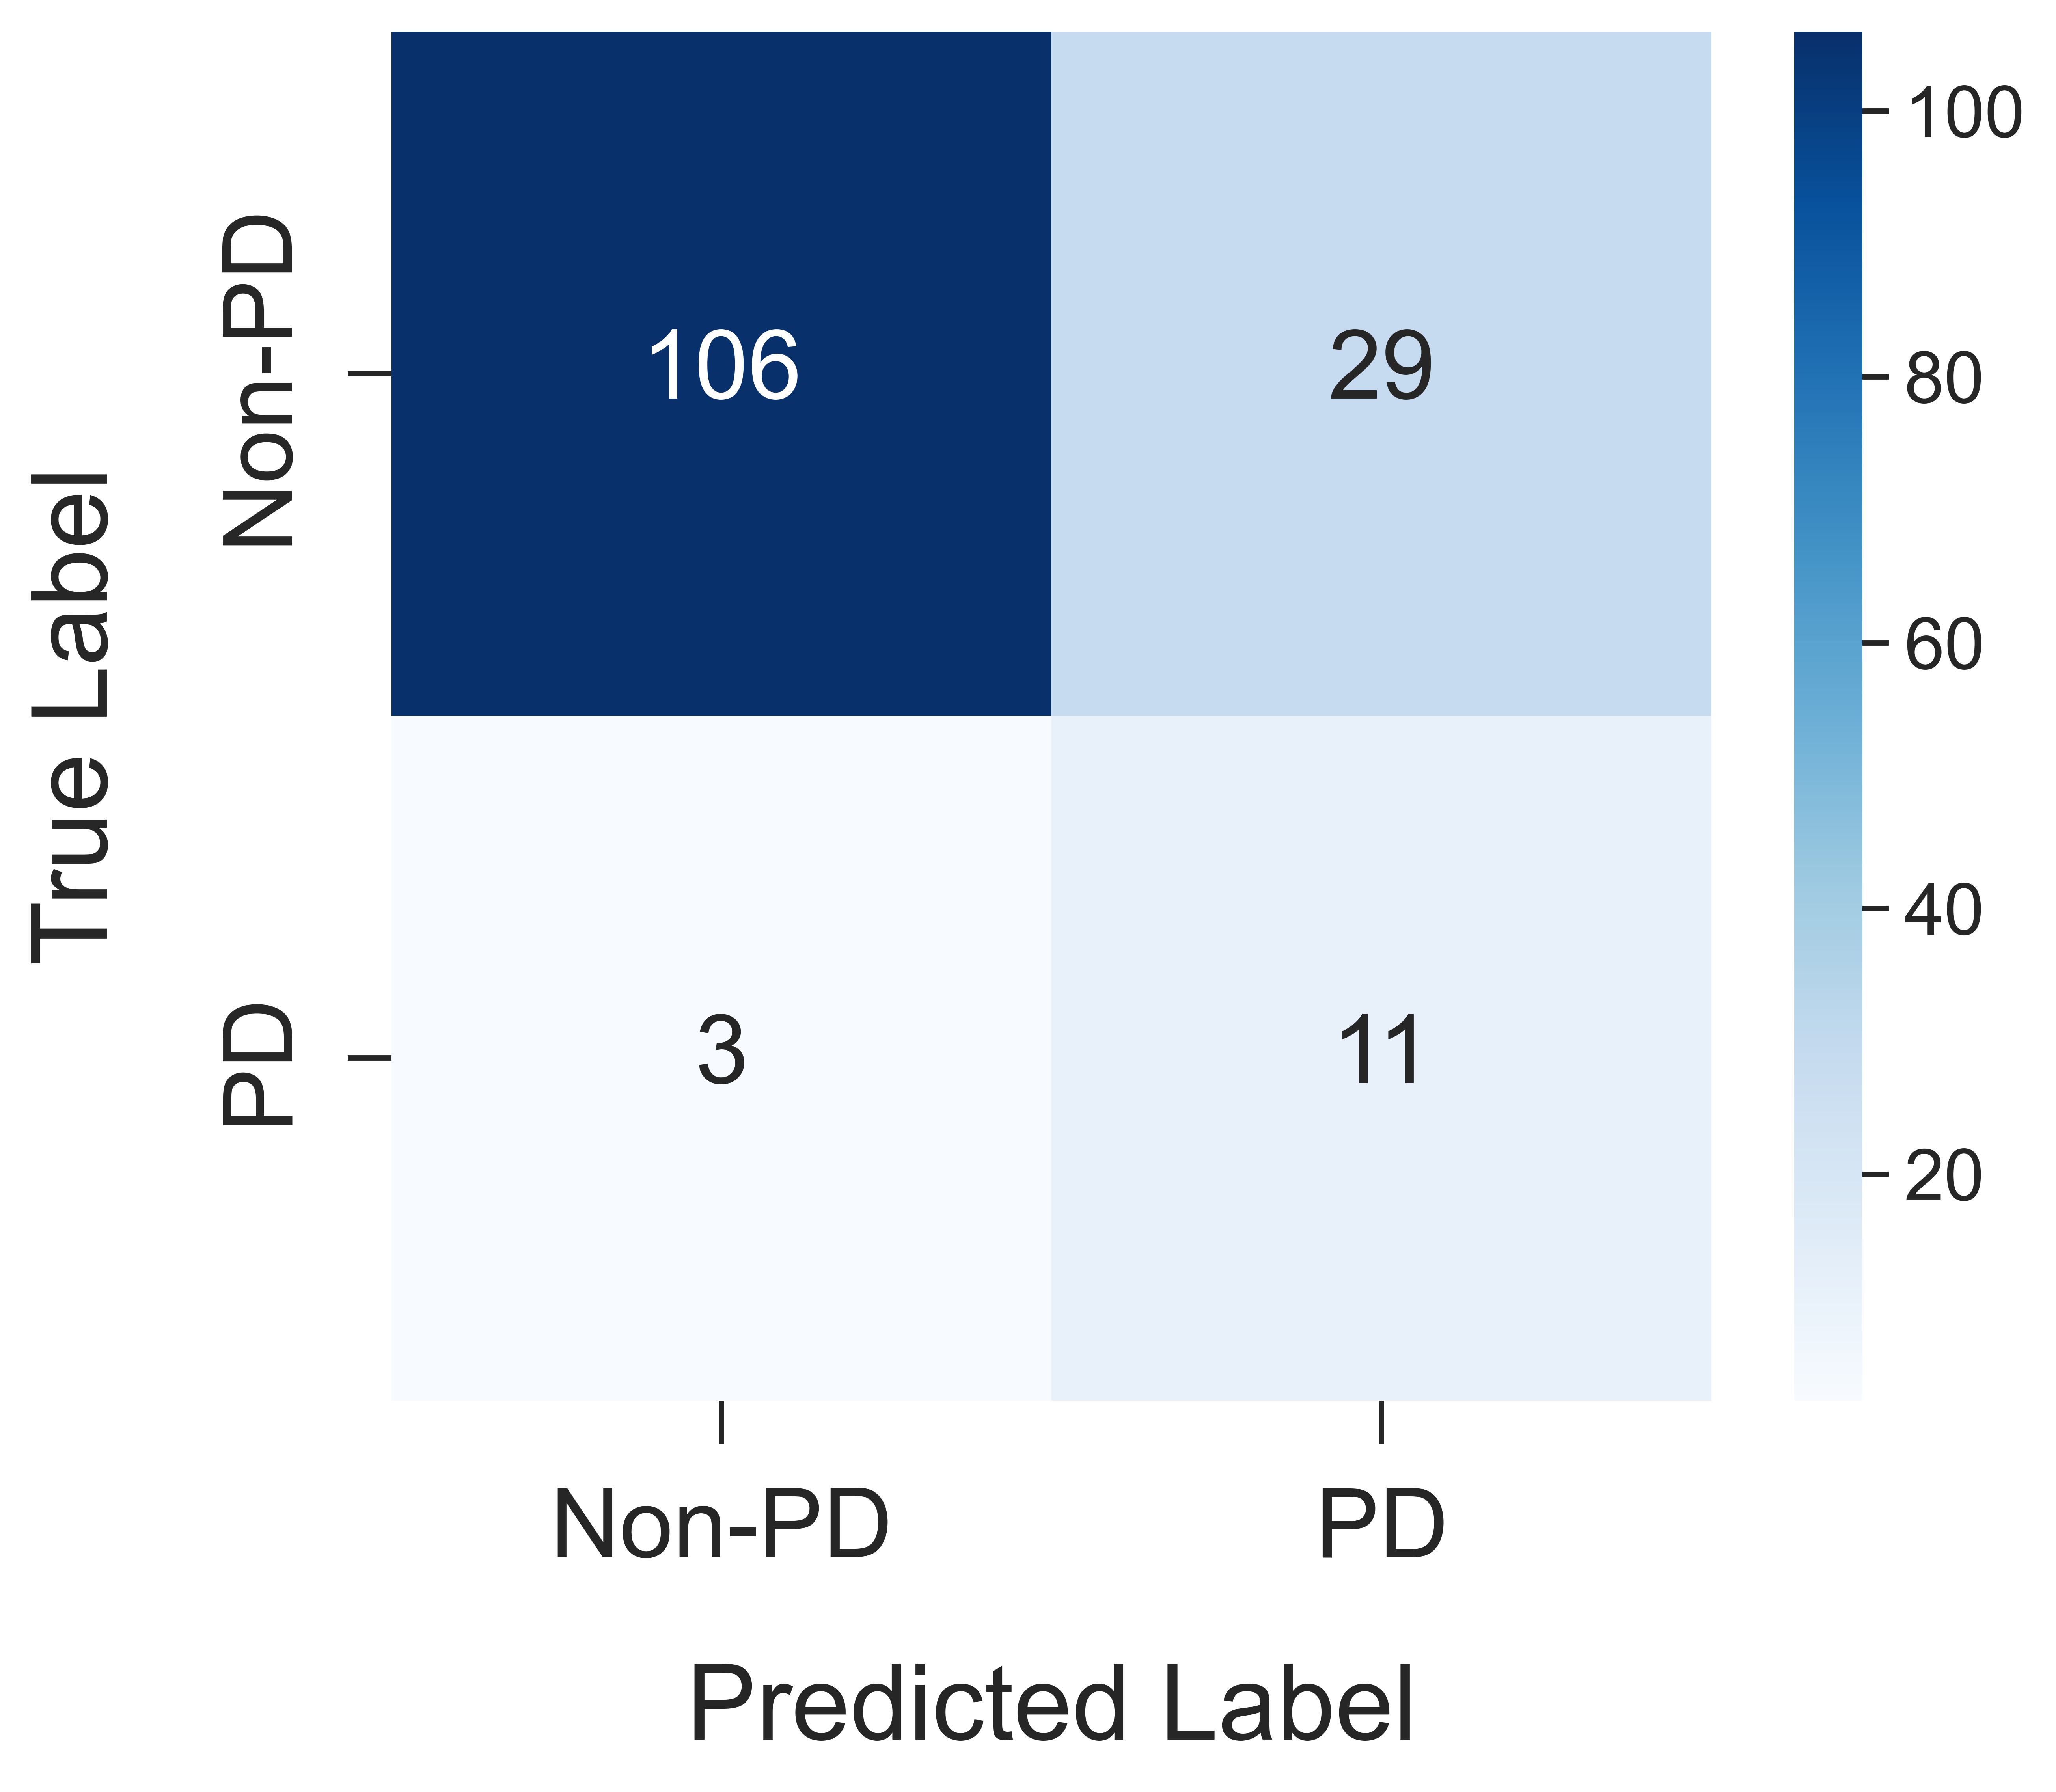
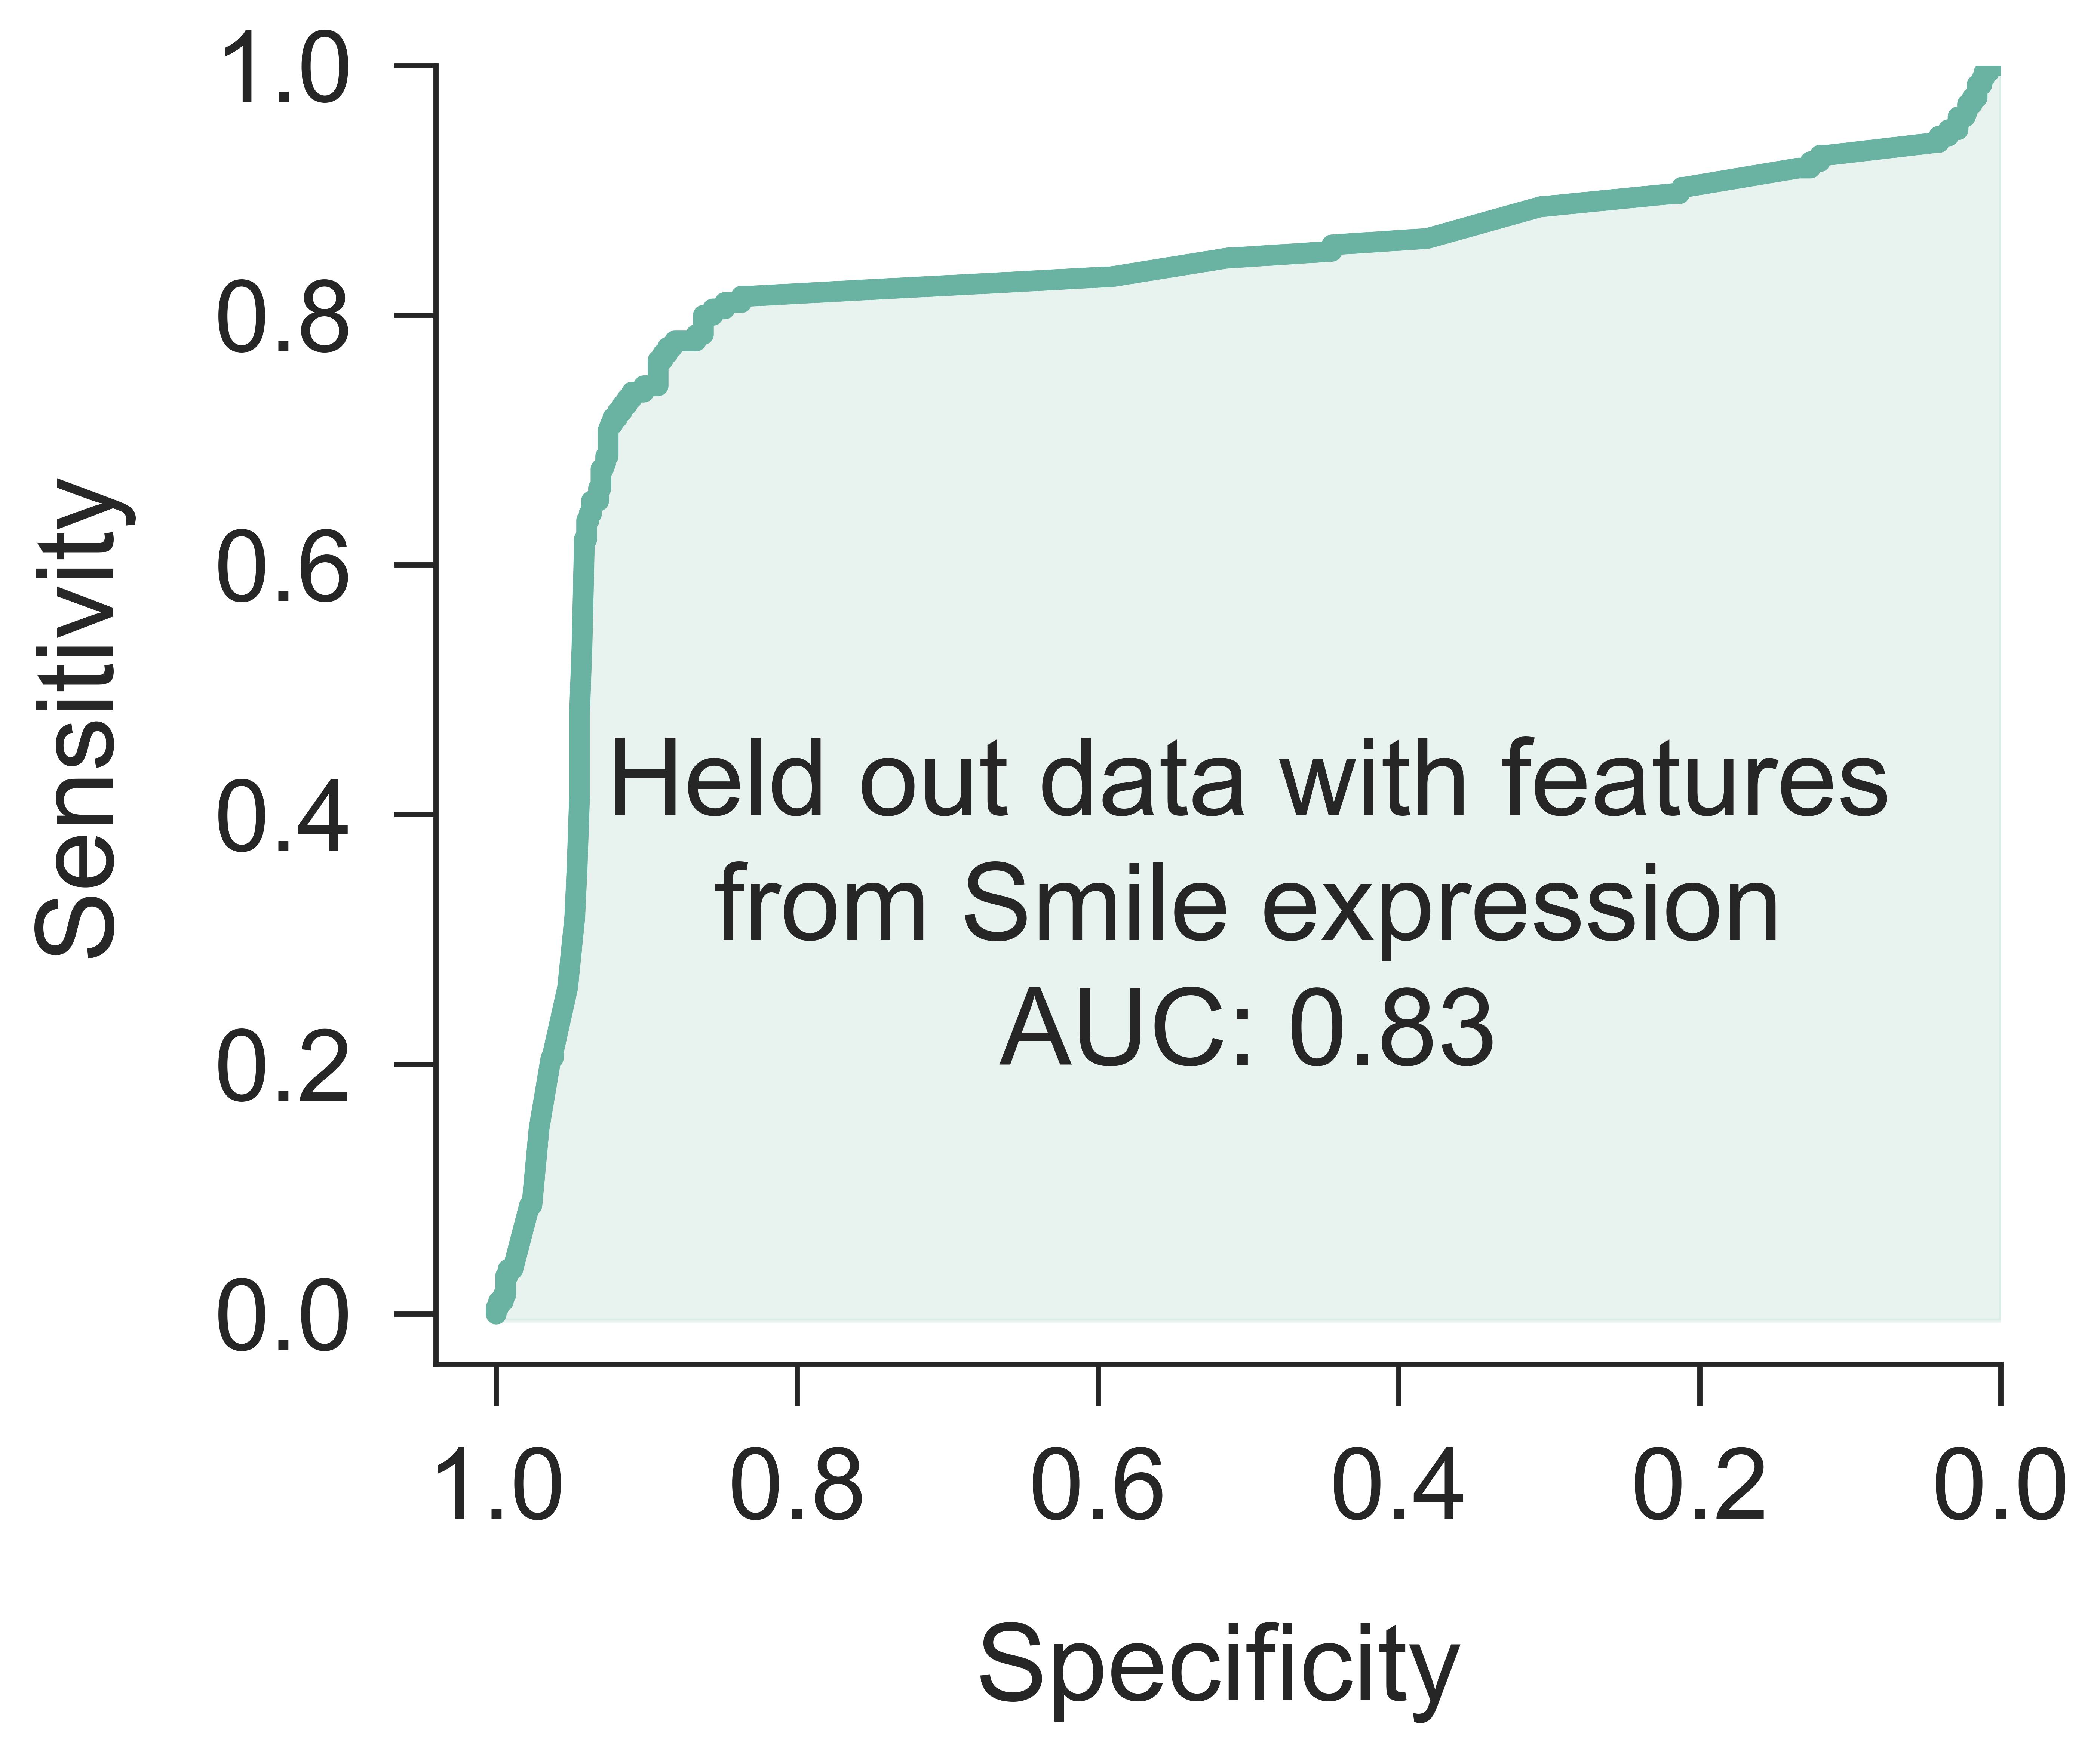
However, when the model was trained solely on smile expression features, the decline in performance was significantly less pronounced. The ensemble of support vector machine (SVM) models trained on smile expression features achieved an accuracy of and an AUROC score of when evaluated on the Clinic setting. Although we observed a decrease of in accuracy, the AUROC score even increased by a small margin of compared to the performance on held-out data. The sensitivity, specificity, positive predictive value (PPV), and negative predictive value (NPV) on this external test data were , , , and respectively. For the external Home-BD test set, the model performed similarly to the one trained on all three facial expressions, achieving an accuracy of and an AUROC score of . It is worth noting that while the specificity (), sensitivity (), and NPV () remained competitive, we observed a sharp decline in PPV ( on the Home-BD setting compared to on held-out data). This sharp drop in PPV ( compared to on held-out data) was also observed when all three facial expressions were used.
Bias Analysis on Held-out Data
In order to make the screening framework proposed in this study accessible to individuals worldwide, it is crucial to assess the model’s performance across different subgroups based on factors such as sex, ethnicity, and age. As mentioned earlier, we performed -fold cross-validation () to evaluate the model using the data samples from Home-Global and PD Care Facility settings. For each of the test data, we log the demographic information, the true label of PD diagnosis, and the model-predicted score. These logs are used to analyze whether the model demonstrated any systematic bias across subgroups. Participants were left out of a subgroup-specific analysis if the sub-grouping attribute (e.g., ethnicity) was missing. For all significance testing, we used a confidence level. Figure 3 provides a visual overview of the subgroup-based analyses.
Miss-classification.
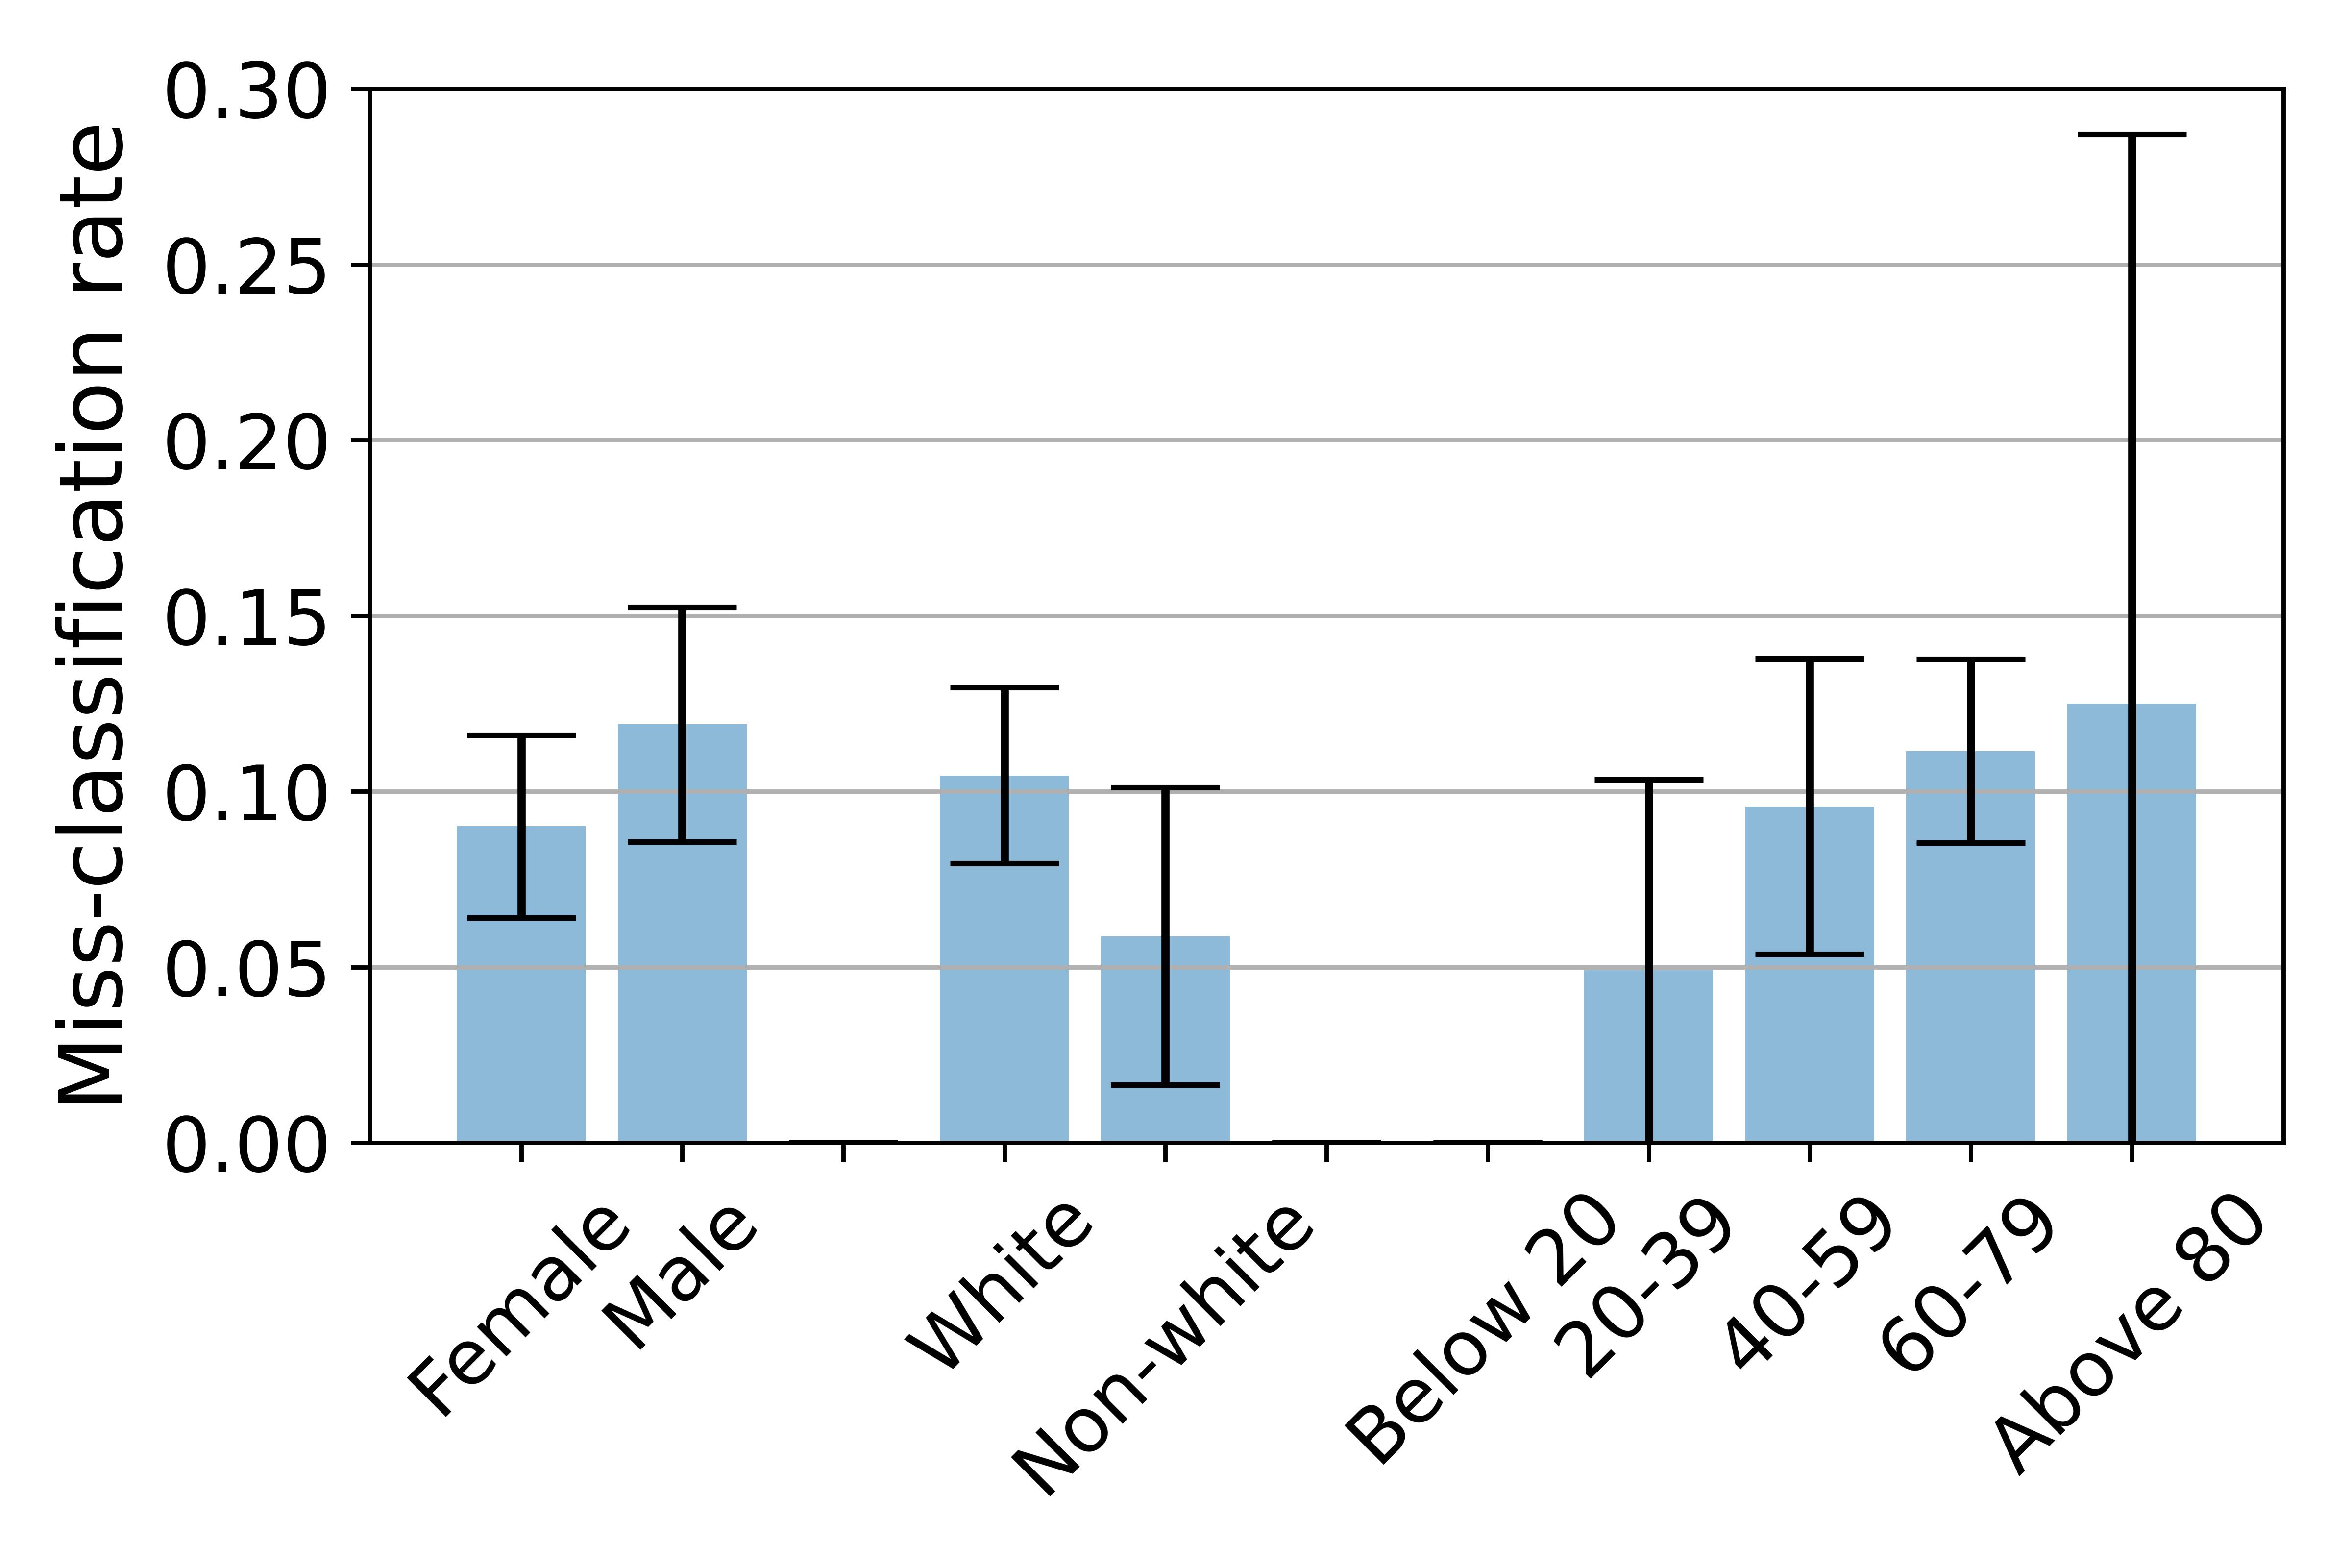
One criterion for bias assessment is whether the model has a higher miss-classification rate for a certain subgroup. To assess this, we performed a two-sampled -test (for proportions) across population subgroups based on sex and ethnicity. On average, the predictive model (ensemble of SVM) exhibited a miss-classification rate of for male subjects () and a rate of for female subjects (). However, the difference in miss-classification rates between the two groups was not statistically significant (test statistic, , ). Similarly, there was no detectable bias when comparing white subjects () with non-white subjects (), as the average miss-classification rates were and respectively (, ). As age is a continuous variable, we performed a Spearman’s correlation test to evaluate the relationship between age and the average miss-classification rate among subjects of that age. Age was found to be positively correlated with the miss-classification rate (Spearman’s rank correlation, , ) meaning the model demonstrated lower accuracy for older subjects.
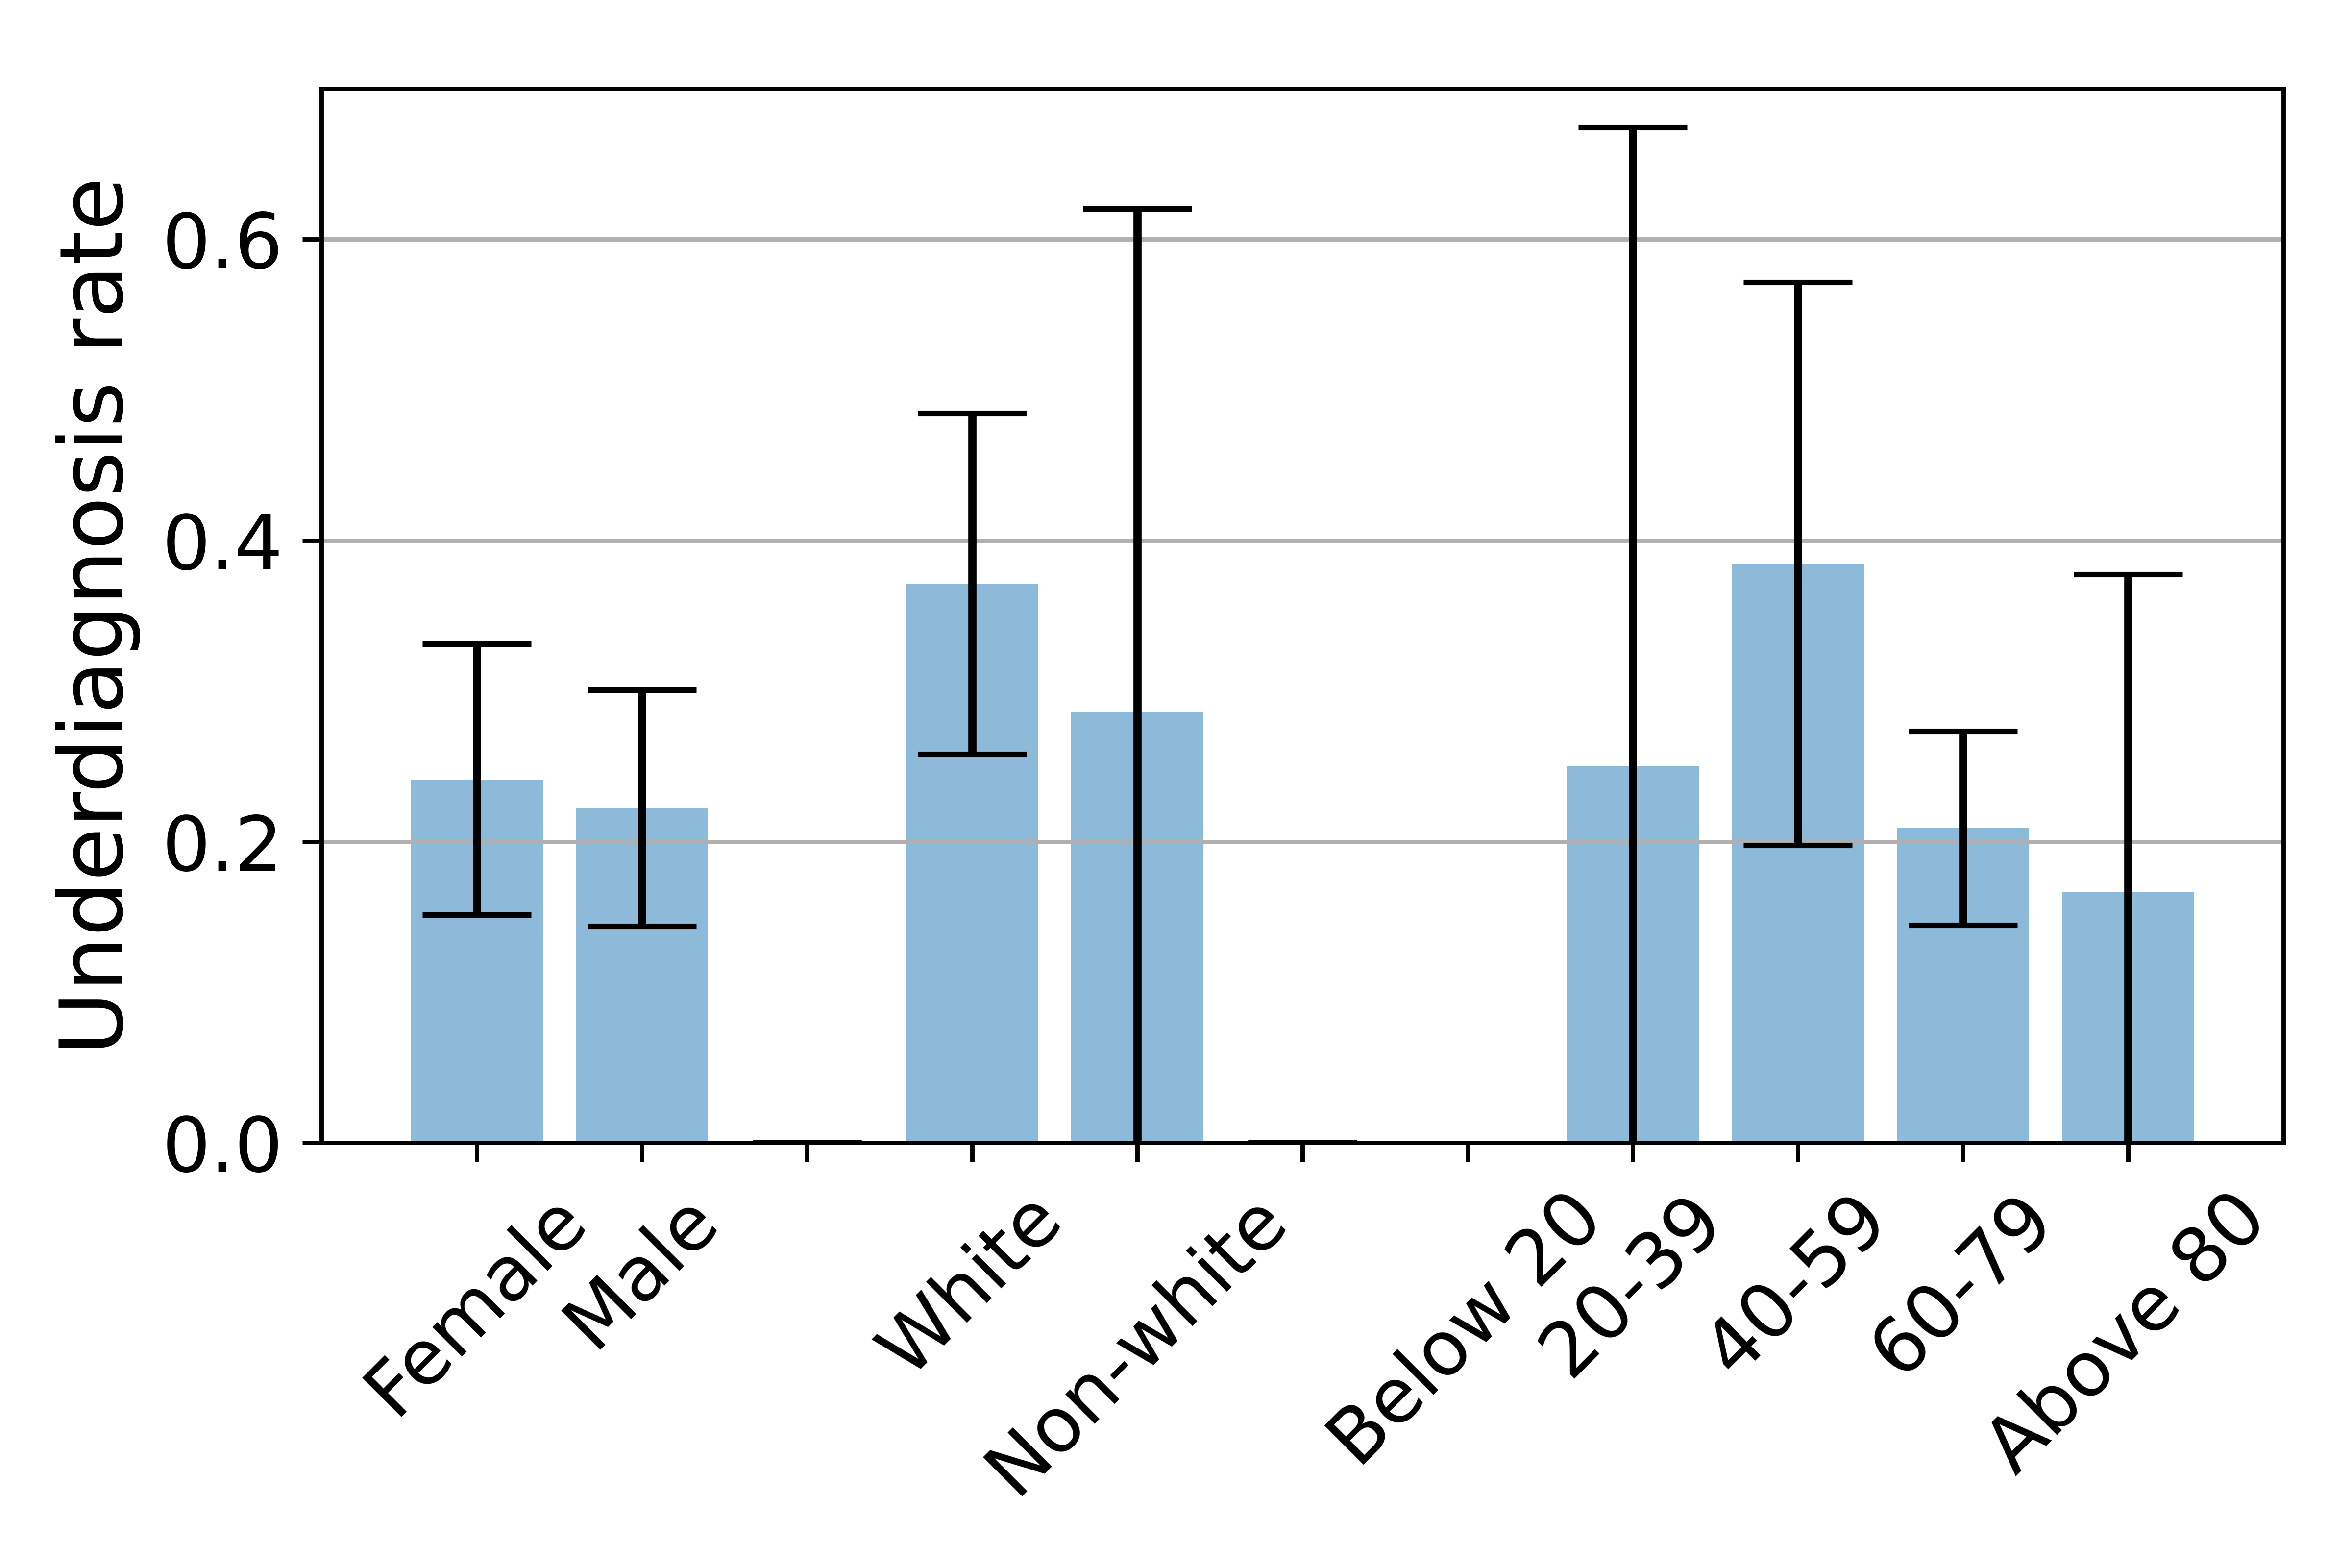
Underdiagnosis.
Many AI models tend to selectively underdiagnose under-served patient populations which can lead to unequal access to clinical care (Seyyed-Kalantari et al. 2021). To investigate whether our predictive model demonstrated similar bias, we ran the subgroup analysis of miss-classification only for the subjects who actually had PD. We used a two-sampled -test (for proportions) to assess underdiagnosis bias based on sex. However, we had a small number of samples () for non-white subjects with PD. Therefore, we used Fisher’s exact test to investigate underdiagnosis bias based on ethnicity. To assess whether age is correlated with the underdiagnosis rate, we used Spearman’s correlation test. We did not observe any underdiagnosis bias of the predictive model at a statistically significant level based on sex and gender. Specifically, the underdiagnosis rates for the male () and female () subjects were and respectively, showing no significant difference (, ). Again, () white subjects were underdiagnosed by the model, while the rate was () for non-white subjects. Based on Fisher’s exact test, this difference was also insignificant (Fisher’s odd ratio , ). Although there was a slight negative correlation () between age and underdiagnosis rate, the correlation was not statistically significant (). However, this means that younger subjects were slightly more underdiagnosed to have PD compared to the elderly.
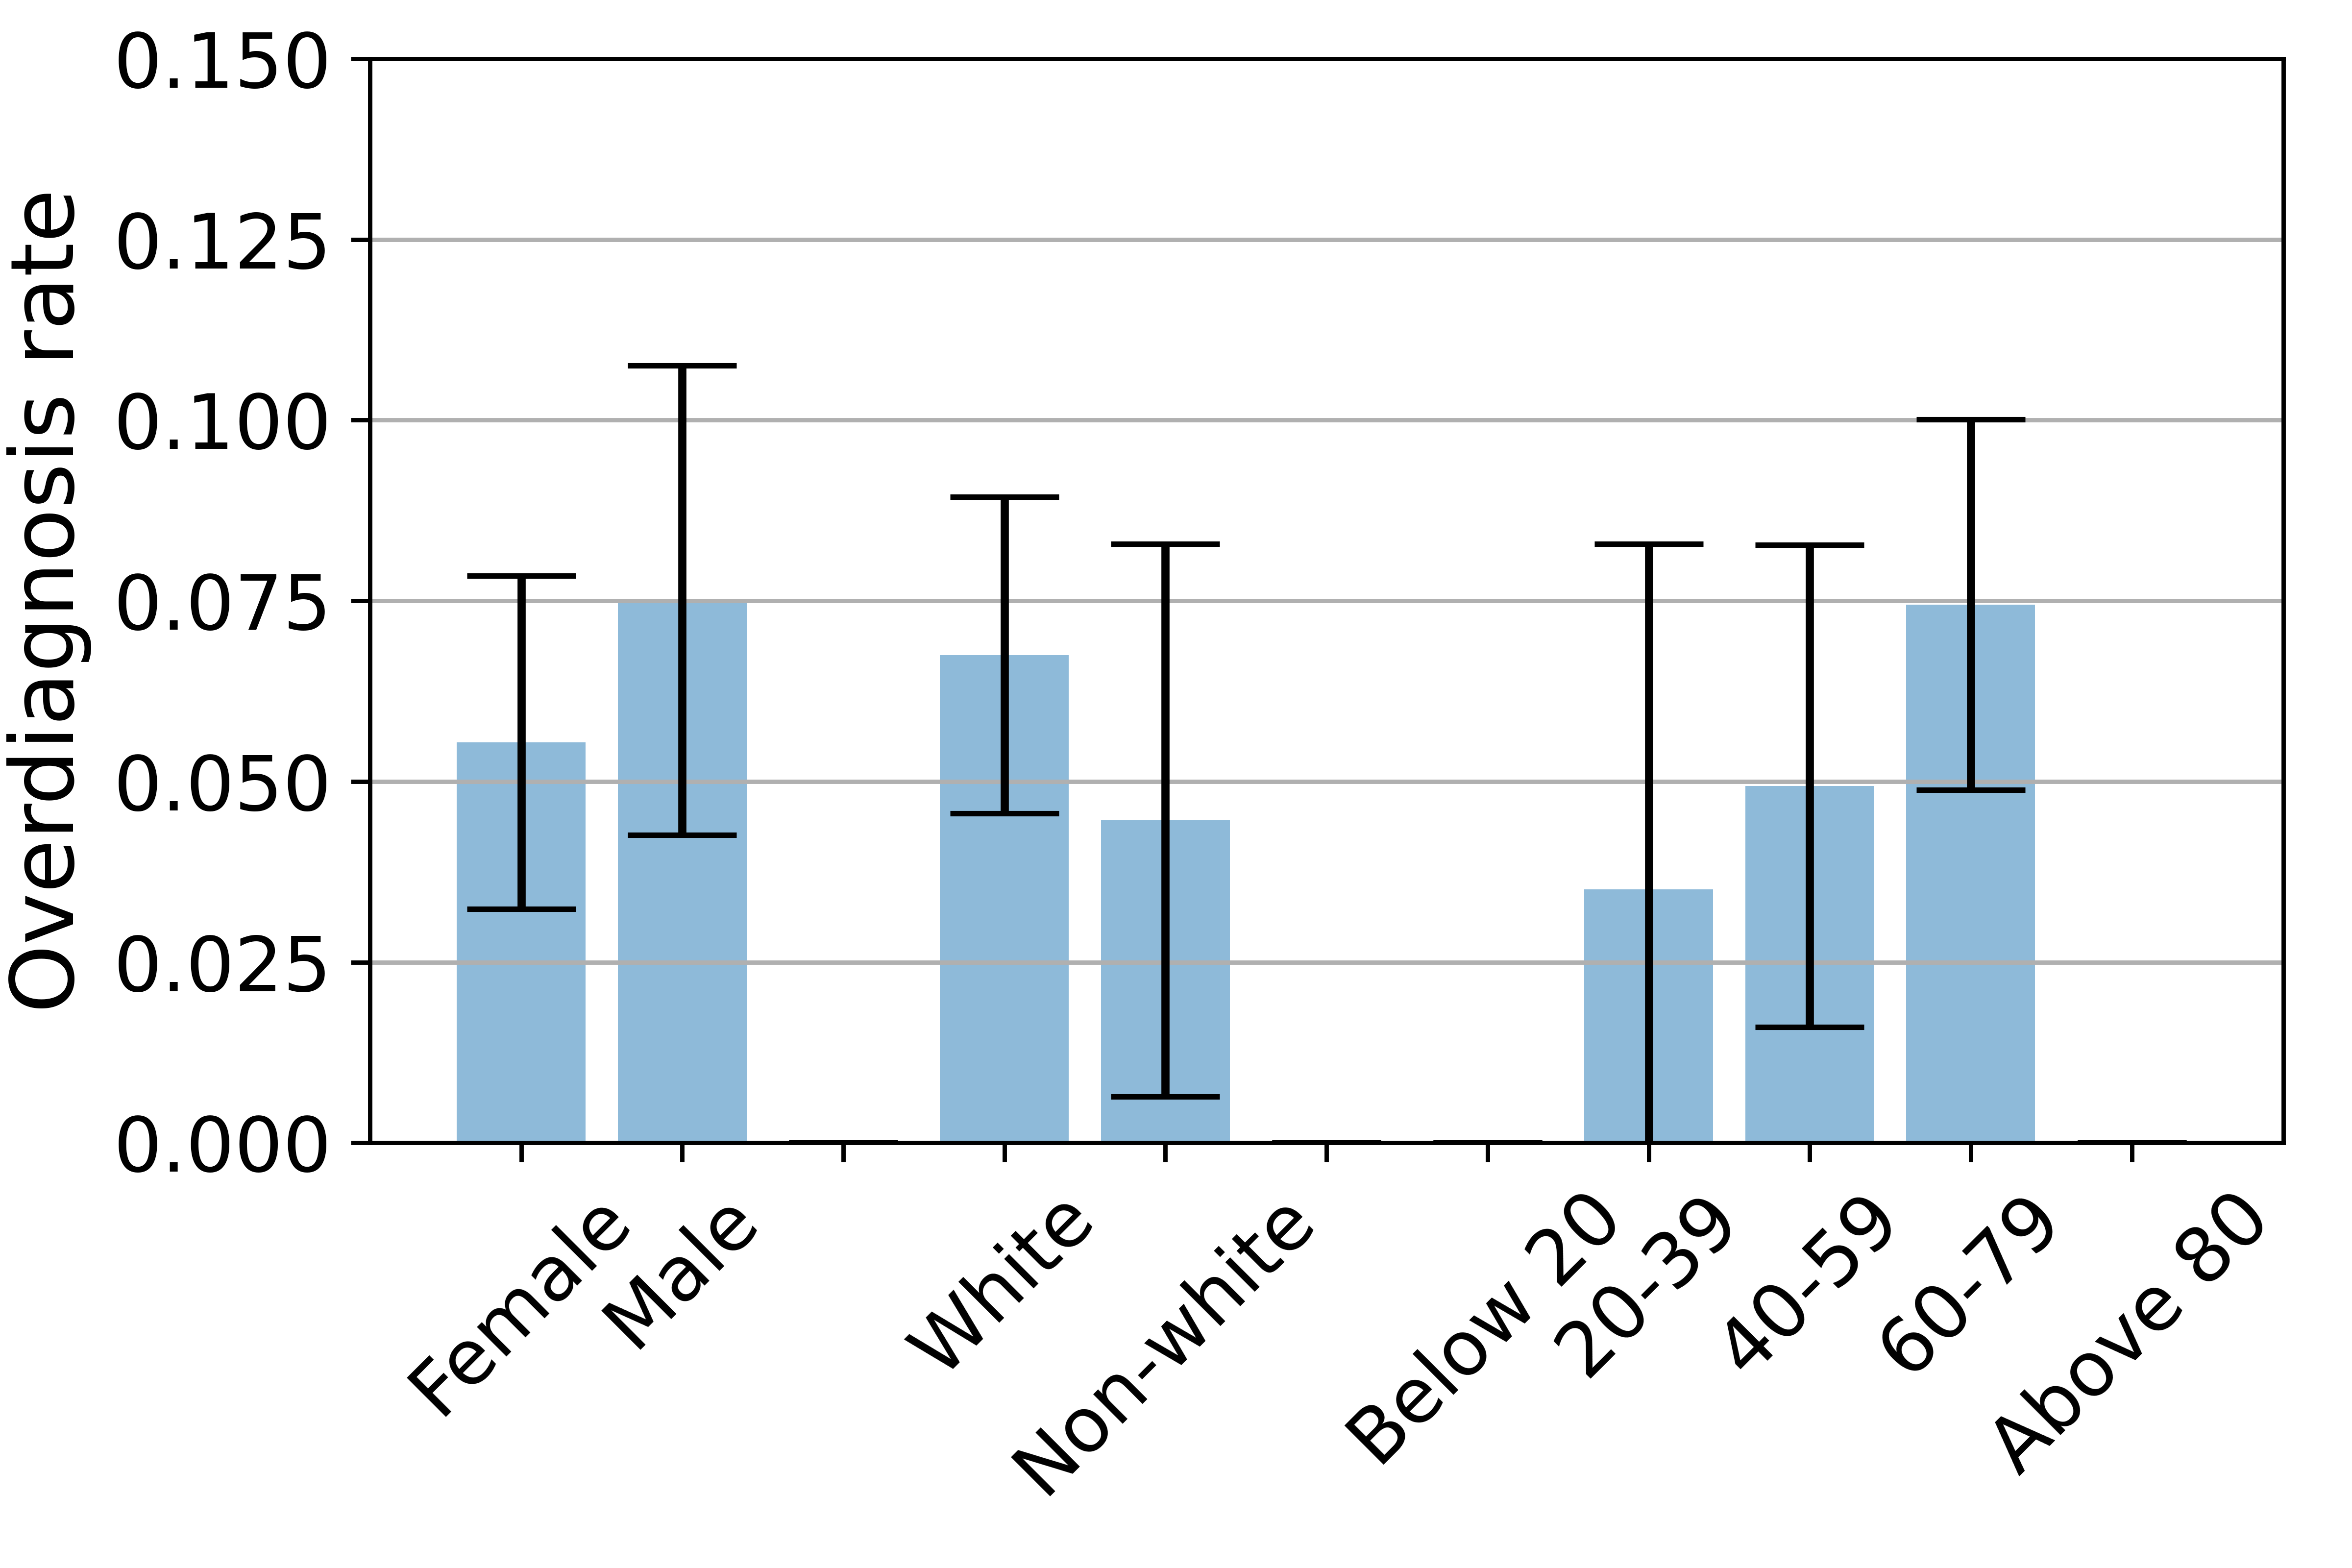
Overdiagnosis.
Overdiagnosis is when the model predicts someone to have a condition, although they do not actually have that condition. To test whether our predictive model overdiagnosed any of the subgroups, we used the same methods used for analyzing underdiagnosis bias. However, instead of analyzing the subjects who had PD, we analyzed the subjects who did not have PD. We did not detect any overdiagnosis bias based on sex ( male subjects, female subjects, , ) and ethnicity ( white subjects, non-white subjects, Fisher’s odd ratio , ). However, older participants were significantly more overdiagnosed by the predictive model, as we observed a positive correlation between age and overdiagnosis rate (, ).
Bias Analysis on External Data
We also conducted an evaluation of our predictive model using two external test datasets, namely Clinic and Home-BD. However, our bias analysis for these datasets was limited due to a lack of representative subgroups. For instance, in the Home-BD dataset, all participants self-identified themselves as Asian, while in the Clinic dataset, all but two participants identified themselves as white. Consequently, we were unable to assess bias based on ethnicity. Furthermore, conducting underdiagnosis or overdiagnosis analyses required subgrouping participants with and without Parkinson’s disease, respectively. Unfortunately, many of these subgroups contained fewer than five participants, rendering statistical inference highly unreliable. Therefore, we solely performed bias analysis based on miss-classification rates for these external test sets.
In the Clinic setting, the model exhibited a miss-classification rate of () for female participants, compared to only for male subjects (). However, this difference in performance between genders was not statistically significant according to a two-sample -test (for proportions) (, ). On the other hand, in the Home-BD setting, the situation was reversed. The model miss-classified male participants () times while the rate was only for the females (). Again, the two-sampled -test (for proportions) yielded a test statistic of and a p-value of , indicating no significant difference in the miss-classification rates. Additionally, for both settings, the miss-classification rate was not significantly correlated with age (Spearman’s rank correlation coefficients were and for the Clinic and Home-BD settings, respectively, with corresponding p-values of and ).
Ablation Studies
| Experimental Setup | AUROC | Accuracy | Sensitivity | Specificity | PPV | NPV |
|---|---|---|---|---|---|---|
| Machine Learning Baselines | ||||||
| XGBoost | 87.94 | 80.77 | 77.44 | 81.80 | 56.77 | 92.16 |
| LightGBM | 87.49 | 81.50 | 78.97 | 82.28 | 57.89 | 92.69 |
| Random Forest | 86.33 | 84.04 | 71.28 | 87.97 | 64.65 | 90.85 |
| AdaBoost | 88.17 | 86.58 | 74.36 | 90.35 | 70.39 | 91.95 |
| HistGradientBoosting | 90.27 | 87.42 | 72.82 | 91.93 | 73.58 | 91.64 |
| SVM | 90.11 | 87.30 | 77.44 | 90.35 | 71.23 | 92.85 |
| Ensemble of best models with SVM | 86.21 | 88.63 | 77.44 | 92.09 | 75.12 | 92.97 |
| Ensemble of best models with LR | 89.31 | 89.72 | 76.92 | 93.67 | 78.95 | 92.94 |
| Feature Scaling Methods | ||||||
| No Scaling | 87.23 | 88.15 | 71.28 | 93.35 | 76.80 | 91.33 |
| Standard Scaler | 86.93 | 87.06 | 69.23 | 92.56 | 74.18 | 90.70 |
| MinMax Scaler | 89.31 | 89.72 | 76.92 | 93.67 | 78.95 | 92.94 |
| Feature Selection Methods | ||||||
| No Feature Selection | 87.11 | 87.91 | 70.77 | 93.20 | 76.24 | 91.18 |
| BoostRFE | 86.78 | 89.36 | 71.28 | 94.94 | 81.29 | 91.46 |
| BoostRFA | 88.37 | 90.33 | 73.33 | 95.57 | 83.63 | 92.07 |
| Logistic Regression | 89.31 | 89.72 | 76.92 | 93.67 | 78.95 | 92.94 |
| Combination of Facial Expressions | ||||||
| Smile | 83.04 | 87.30 | 72.31 | 91.93 | 73.44 | 91.50 |
| Disgust | 76.24 | 77.51 | 69.74 | 79.91 | 51.71 | 89.54 |
| Surprise | 72.45 | 77.03 | 61.03 | 81.96 | 51.07 | 87.21 |
| Smile + Disgust | 87.60 | 86.34 | 77.95 | 88.92 | 68.47 | 92.89 |
| Smile + Surprise | 87.42 | 88.03 | 78.46 | 90.98 | 72.86 | 93.19 |
| Disgust + Surprise | 72.51 | 76.06 | 66.15 | 79.11 | 49.43 | 88.34 |
| Smile + Disgust + Surprise | 89.31 | 89.72 | 76.92 | 93.67 | 78.95 | 92.94 |
| Combination of AU and Landmark Features | ||||||
| AU Features | 84.59 | 86.22 | 73.85 | 90.03 | 69.57 | 91.77 |
| Landmark Features | 76.11 | 74.73 | 70.77 | 75.95 | 47.59 | 89.39 |
| AU + Landmark Features | 89.31 | 89.72 | 76.92 | 93.67 | 78.95 | 92.94 |
| Impact of Minority Oversampling | ||||||
| Not Used | 83.59 | 89.60 | 69.23 | 95.89 | 83.85 | 90.99 |
| Used | 89.31 | 89.72 | 76.92 | 93.67 | 78.95 | 92.94 |
We experimented with different setups, including several machine learning baselines to find the best predictive model (please see Table 3). As machine learning baselines, we tried XGBoost (Chen and Guestrin 2016), LightGBM (Ke et al. 2017), Random Forest, AdaBoost, Histogram-based Gradient Boosting (HistGradientBoosting) (Guryanov 2019), and Support Vector Machine (SVM) (Cortes and Vapnik 1995). Rather than relying on a single metric, we employed a holistic evaluation approach by considering all the reported metrics (i.e., AUROC, Accuracy, Sensitivity, Specificity, Positive Predictive Value (PPV), and Negative Predictive Value (NPV)). Overall, when evaluated holistically, SVM outperformed all other baselines in terms of predictive performance.
We observed that an ensemble approach, incorporating the highest-performing models, delivered improved performance compared to a single model. This method particularly boosted the specificity, PPV, and accuracy, with other evaluation metrics demonstrating comparable performance. In order to consolidate the decisions from the top-performing models, we employed a secondary model, which operated as the final classifier in our ensemble system. The top- models’ outputs served as input to this secondary model (with being a hyper-parameter), which then generated a single binary outcome, denoting the presence or absence of Parkinson’s disease (PD) in an individual. We experimented with both Support Vector Machine (SVM) and logistic regression as our final classifier. Between the two, logistic regression demonstrated superior performance, making it our choice for the final stage of decision-making in the ensemble model. In addition, selecting top- features ( is a hyper-parameter and the features are ranked based on the weights of a logistic regression model) and applying MinMax Scaler to ensure all the features are scaled into similar ranges helped boost the performance.
When features from a single expression were used, the smile performed better than the other two expressions. We also experimented with combining features from all possible mixing of three facial expressions. The competitive performances were achieved by adding features from other expressions with the smile features. Moreover, it is noteworthy that all the competitive models included features from the smile task, underscoring the importance of utilizing smile expression as a promising biomarker for PD detection.
We used both Openface and MediaPipe tools to extract facial keypoints. However, only using one of them yielded a relatively poor performance as shown in Table 3. Finally, since the dataset was imbalanced (i.e., the ratio of participants without and with PD was more than ), we applied a synthetic minority oversampling technique named SMOTE (Chawla et al. 2002) on the training data, leading to a better performance on the test data.
3 Discussion
This study presents an opportunity to revolutionize the future of technology in the diagnosis and treatment of facial muscle-related diseases. Similar to the advancements in home glucose monitoring devices that have greatly benefited individuals with diabetes, the utilization of AI models and home-recorded micro-expressions for screening Parkinson’s disease (PD) holds immense potential. The current methods for diagnosing PD rely on subjective clinical assessments and trained healthcare professionals’ observations, which can be time-consuming, costly, and prone to inter-observer variability. In contrast, our proposed non-invasive and scalable method offers a convenient approach for PD screening from the comfort of individuals’ homes. The remarkable progress of AI in healthcare demonstrated in areas such as skin cancer detection from images (Das et al. 2021) and predicting heart failure risk using electronic health records (Kogan et al. 2023), further emphasizes the transformative power of AI in disease diagnosis. Neurological disorders like Blepharospasm, Meige syndrome, and facial nerve disorders such as Bell’s palsy share similarities with Parkinson’s disease, as all of these diseases profoundly affect facial muscle function and expressions. Leveraging videos of smiling selfies for diagnosing uncomplicated Bell’s palsy could save a significant amount of resources currently spent on imaging (Kazemian et al. 2021). In addition, by allowing individuals to perform initial assessments at home, our proposed invention has the potential to expedite the evaluation of these disorders.

As we explore the potential integration of AI-driven predictive models into clinical care, it is imperative to evaluate the reliability of these models using data generated in environments different from those used for training. This step is crucial to ensure that the models can generalize effectively and maintain their performance when faced with real-world variations and diverse patient populations. To this end, we employed two distinct cohorts: a local clinical cohort consisting of subjects ( diagnosed with PD) from the United States, and a cohort from Bangladesh comprising subjects ( with PD). Bangladesh, being a developing country with a distinct culture compared to the United States, provides a valuable contrast in terms of environmental and socio-cultural factors.
On the clinical cohort, the predictive model achieved accuracy and AUROC score. The PPV of the model was , meaning for every participant classified by our model to have PD, on average, of them actually had PD. Such high PPV is crucial for a screening tool, as it helps minimize false positives and prevents unnecessary distress for the individuals or burden on the already strained clinical care system. By ensuring that individuals with positive screening results are more likely to have PD, we can mitigate the risk of overwhelming the healthcare system with unnecessary clinic visits. However, it is important to note that the sensitivity of the model currently stands at and requires further improvement. Currently, the model may miss about of participants with PD, and caution should be exercised when interpreting the model’s output. Individuals should be informed about the potential errors of the model, and it is recommended that those with access to neurological care and suspicion of having PD symptoms should schedule a clinical visit regardless of the model’s output. Nevertheless, our model remains particularly suitable for individuals with limited access to clinical care, offering a valuable screening tool for such populations.
The cohort from Bangladesh presents a unique dataset due to its participants belonging to a culture distinct from that of the United States. The predictive model achieved accuracy and AUROC score when evaluated on the external Bangladeshi cohort. While the specificity and sensitivity of the model aligned with those of the clinical cohort, a significant discrepancy emerged in the positive predictive value (PPV) at . This finding suggests the presence of cultural variances in the expression of smiles, warranting further investigation. It is essential to recognize that for every successful PD diagnosis prompted by our model, there may be approximately four instances in which individuals seek clinical diagnosis but are ultimately found not to have PD. While this may introduce inconvenience and potentially result in unnecessary clinical visits for some individuals, it is crucial to consider the potential impact of the model on improving the quality of life for those who do receive an accurate PD diagnosis. This consideration is particularly important in a resource-constrained country like Bangladesh, where the model can still hold utility within a clinical setting by improving access to care.
In our study, we have identified that features extracted from the smile expression demonstrated superior discrimination between participants with and without PD (see Figure 4). When tested on external data that the predictive models had never seen during training, models trained entirely on smile features displayed greater generalizability (see Figure 2). These models focusing solely on smile features were relatively simpler, requiring fewer parameters, yet outperformed models considering combinations of disgust, smile, and surprise features. This observation aligns with the philosophical principle of Occam’s razor (Blumer et al. 1987), suggesting that simpler theories are often better. Furthermore, during the analysis of facial expressions in this study, which included disgust, smile, and surprise, we observed that the smile expression exhibited the least inter-person variability and was easily replicated compared to the other expressions. While individuals may express disgust or surprise in various ways, smiles were more universally recognizable and required fewer instructions for participants, making them highly suitable for our home deployable ubiquitous tool. Furthermore, the predictive model demonstrated its utility across different geographical locations, including the east and midwest regions of the United States, as well as a South Asian country. This observation raises the possibility of investigating the model’s potential for screening individuals with PD in regions where access to neurologists is extremely limited (e.g., African countries). It is notable that we deployed a translated version of the PARK tool where the instructional videos were recorded by native speakers, which might be an important criterion to consider to investigate similar technology for countries with different languages and cultures.
It is imperative to enhance data diversity and representation within the training set before deploying the model in different socio-cultural settings to minimize potential risks and ensure its optimal performance. Although the web-based PARK tool we used for collecting training data is intended to be used from anywhere in the world, the participants were dominated by U.S. residents ( out of , ). This lack of representation from diverse geographic regions is a limitation that should be addressed to improve the generalizability of the model. Additionally, it is worth mentioning that our evaluation of the predictive model was conducted on a single external clinical cohort and one cohort from a developing country. To draw more robust and conclusive results regarding the effectiveness of the proposed model, it may have been advantageous to have test data from multiple clinics, PD care facilities, and countries. Targeted advertisement and cross-country collaboration could help us obtain data from other countries, which remains a future goal of this study.
Ensuring that the benefits of a predictive tool are accessible to individuals regardless of ethnicity, sex, and age requires a critical examination of potential biases within the model. To this end, we performed extensive bias analysis across held-out and external test data, although some analyses on the external test data were limited due to small subgroup sizes. On held-out data, our model did not demonstrate any detectable bias based on protected attributes such as ethnicity and sex. However, the model was less accurate for older participants, the underdiagnosis rate was slightly higher for the younger subjects, and the overdiagnosis rate was higher for the older subjects. Similar findings also apply to a clinical setting where young PD patients may have a longer journey to diagnosis because they do not fit the profile of a typical patient (Post et al. 2020). Propagation of existing bias in AI models is undesired and remains a limitation of this study.
To minimize the potential harm of mispredictions, it is indeed crucial to evaluate the reliability of model predictions. One approach to enhance the clinical utility of the model is to reframe the PD screening problem as a three-way classification instead of a binary (individuals with PD vs without it) classification. This revised approach would involve categorizing individuals into three groups: (i) likely to have PD, (ii) unlikely to have PD, and (iii) uncertain. An ideal screening framework should indeed demonstrate high performance in correctly classifying individuals into the likely and unlikely to have PD categories. These categories would encompass the majority of the data, where the model’s predictions are expected to be reliable and accurate. This high-performance level ensures that individuals who likely have PD are appropriately identified for further evaluation and necessary care, while those without PD are accurately classified, minimizing false positives. However, it is important to acknowledge that no screening model is perfect, and there will always be a portion of data where the model’s predictions are uncertain. This uncertainty category accounts for cases where the model’s confidence falls below a certain threshold or where the features extracted from the data are inconclusive. This small subset of uncertain predictions serves as a reminder that further clinical evaluation and assessment are necessary to determine the true status of these individuals. However, reliably assessing uncertainty in a predictive model that follows a frequentist approach is indeed challenging (King et al. 2019). In the future, we plan to explore Bayesian approaches which can provide more direct and intuitive measures of uncertainty to investigate screening as a three-way classification problem.
4 Methods
Data Collection
Data Collection Framework.
Our study employed a video dataset sourced from participants, comprising of them diagnosed with Parkinson’s disease (PD) and without the condition. We used PARK333https://parktest.net/ (Langevin et al. 2019), a web-based framework for data collection. PARK is a web-based tool designed to collect videos of participants performing a series of tasks. For each task, participants are presented with a brief instructional video illustrating how to accurately perform it. Among the recorded videos of more than tasks, we collected the videos corresponding to three facial expressions (disgust, smile, and surprise) for this study. In each of the facial expression tasks, participants were asked to portray that particular expression as expressively as possible, sustain the expression for a few seconds, and then revert to a neutral facial expression. This cycle was to be repeated three times in total for each of the facial expressions, resulting in videos that typically spanned seconds. In addition to the video recordings, PARK also collected demographic information about the participants such as their age, sex, ethnicity, and country of origin. Besides, participants self-reported whether they were diagnosed with Parkinson’s disease or not, which was used as ground truth for training and evaluating the models.
Dataset Details.
We collected data from four different settings:
-
•
Home recorded videos from global participants (Home-Global): We advertised the PARK tool using social media, emailed participants who expressed interest in PD research recorded in a clinical study registry, and verbally reached out to PD patients interested to contribute in PD research to collect home-recorded videos from global participants. This way, we collected data from global participants who recorded themselves using a computer webcam PARK website. However, this cohort was mostly dominated by the US residents ( out of ), and participants who did not have PD ( out of ).
-
•
Videos recorded at a PD care facility (PD Care Facility): We deployed the PARK tool at InMotion444https://beinmotion.org/, a PD care facility located in Ohio, United States. The facility provides comprehensive support to PD patients, offering activities from exercises to educational sessions and counseling on maintaining motivation and leading a fulfilling life. We were able to collect video data (recorded by a laptop webcam) from both their clients ( participants with PD) and their caregivers ( participants without PD). Note that, in many cases, during data collection, the participants were assisted by caregivers at the InMotion facility.
-
•
Videos recorded in a US Clinic (Clinic): As part of a clinical study conducted by the University of Rochester Medical Center (URMC) located in New York, United States, willing participants recorded themselves using the PARK tool. Some of the participants were supervised and/or assisted by clinical study team members during the recording process. We collected data from participants ( with PD) in this setting.
-
•
Home recorded videos from Bangladesh (Home-BD): In this setting, data collection took place in Bangladesh, a Southeast Asian country. This was specifically facilitated by the Bangladesh University of Engineering & Technology (BUET). In the previous three settings, the PARK tool was administered in English, which could present a language barrier for the elderly population whose native language is not English. To address this issue, we undertook the task of translating the entire PARK website into Bengali, the local language, and re-recording the instructional videos (in Bengali) with native speakers. A portion of data collection was conducted under the direct supervision of our study team members at BUET, and the rest of the participants recorded their videos at home. This setting contributed a valuable dataset from participants, including with Parkinson’s disease (PD), significantly enhancing the geographical and cultural diversity of our data.
Data Quality Assurance.
The performance of any machine learning model largely depends on the quality of the dataset. Therefore, to ensure the utmost quality of our data, we took extensive measures to facilitate clear and straightforward instruction videos for the participants. This was supplemented by guidelines encouraging participants to record themselves in well-lit environments, against distinguishable backgrounds, and to position their full faces within the video frame. Despite these guidelines, we recognized an inherent trade-off between the optimal quality of recorded videos and the home accessibility of our video recording framework. Notably, many of our participants were elderly individuals, and expressions of disgust and surprise could be nontrivial for them to mimic accurately. Additionally, in the case of Home-BD setting, some of the recordings took place under the direct supervision of our collaborative research group at BUET. While this offered greater control over the recording conditions, it occasionally made the participants feel uncomfortable or embarrassed, which may have influenced their ability to mimic the guided facial expressions authentically. Consequently, the data quality from Home-BD may not be as high as that from other settings.
Feature Extraction
In our study, we extracted two types of features from the facial expression videos collected from the participants – facial action units and facial landmarks. To extract these features, we used two very popular feature extraction tools OpenFace (Baltrusaitis et al. 2018) and MediaPipe (Lugaresi et al. 2019). Both OpenFace and MediaPipe are widely used due to their efficiency, accuracy, and the ability to process video streams in real-time. They also benefit from being open-source, allowing researchers and developers to use and extend their functionality to suit a wide range of applications.
Facial Action Unit Features.
We leveraged the Facial Action Coding System (FACS), developed by Ekman et al. (Ekman and Friesen 1978) to taxonomize human facial expressions. FACS describes facial expressions in terms of individual components of facial movement, or Facial Action Units (AUs). The AUs are associated with the muscle movements of the face and activation of a particular AU indicates the movement of a fixed set of facial muscles. In the literature, OpenFace has been proven to be very accurate in detecting the presence and intensity of these following AUs (Amos et al. 2016; Baltrusaitis et al. 2018).
These action units are contingent on the contraction or relaxation of one or more muscles. For instance, AU06 and AU12, provided by OpenFace, are crucial when examining facial expressions, particularly smiles. AU06, or “Cheek Raiser”, involves the raising of the cheeks due to the contraction of the orbicularis oculi, pars orbitalis muscle around the eye socket. This results in a tightening of the skin around the eyes, often leading to the formation of ‘crow’s feet’ wrinkles at the outer corners of the eyes. AU12, also known as “Lip Corner Puller”, represents the movement caused by the zygomaticus major muscle, which pulls the corners of the lips upwards and outwards, creating a smile. These two action units, when combined, are key indicators of what is referred to as a Duchenne smile (Ekman, Davidson, and Friesen 1990), a sincere and genuine smile associated with spontaneous joy and happiness.
Utilizing Openface, we extracted the AU values for each frame of the three distinct facial expression videos from each participant. OpenFace software gives a binary activation ( or ) and a raw magnitude (ranging to ) of each AU for each frame of a video that contains a human face. We evaluated three distinct statistical measures – mean, variance, and entropy – of the raw action unit when the corresponding action unit is active (i.e., the activation value is ). The variance signals the extent of facial muscle movement during a facial expression, while the mean indicates the average intensity of muscle engagement for each facial expression throughout the video frames. Conversely, entropy provides a measurement of unpredictability or randomness in the activation of facial muscles during expressions. Higher entropy corresponds to more complex or varied facial movements.
While assessing signs of Parkinson’s disease from a facial expression task, The Movement Disorder Society-Sponsored Revision of the Unified Parkinson’s Disease Rating Scale (MDS-UPDRS) instructs the clinician to observe the patient’s eye-blinking frequency, masked facies or loss of facial expression, spontaneous smiling, and the parting of lips. We engineered the facial features so that they reflect these four criteria of the MDS-UPDRS. The expressiveness (and spontaneity for smiles) of each of our three facial expressions is linked with four AUs. For example, AU01 (Inner Brow Raiser), AU06 (Cheek Raiser), AU12 (Lip Corner Puller), and AU14 (Dimpler) were observed to have three distinct peaks in smiling facial expression videos that ask participants to repeat the smile expression three times. Similarly, the expressiveness of a disgusted face is linked with AU04 (Brow Lowerer), AU07 (Eye Lid Tightener), AU09 (Nose Wrinkler), and AU10 (Upper Lip Raiser); and a surprised face is linked with AU01 (Inner Brow Raiser), AU02 (Outer Brow Raiser), AU04 (Brow Lowerer), and AU05 (Upper Lip Raiser). In addition, to objectively gauge a participant’s ability to keep their lips together while their mouths are at rest, we recorded the values of AU25 (Lips Part) and AU26 (Jaw Drop). These two action units are consistently selected across all three facial expressions. Finally, AU45 (Blink) offers an objective measurement for the frequency of eye blinking during all three facial expression videos. This way, we extracted frame-by-frame values of seven facial action units for each of the facial expression videos. We then summarized the frame-by-frame values to represent the entire video using three statistical aggregates – mean, variance, and entropy. Therefore, for each participant, the total number of digital features prepared from AUs using OpenFace is ( facial expressions AUs for each expression statistical aggregates for each AU).
Facial Landmark Features.
In addition to the action unit features, we extracted facial attributes that simulate clinical assessments typically carried out in person as suggested in prior literature (Gomez et al. 2021):
-
•
Opening of the left and right eye: Patients with PD may experience a decreased frequency of eye blinking. This can lead to more prolonged openings of the eyes, subtly altering the natural dynamics of facial expressions. By including the measurement of the degree of eye openings in our feature list, we aim to capture this nuanced change.
-
•
Rising of the left and right eyebrows: As a part of mimicking the surprise facial expression, the participants in our study were instructed to raise their eyebrows. However, in the case of Parkinson’s patients, who may exhibit reduced facial expressiveness due to hypomimia, this eyebrow movement can be less pronounced. By taking into account the extent of eyebrow-raising, our analysis considers these subtle variations.
-
•
Opening of the mouth: As we have discussed earlier, one of the visible manifestations of PD can be an inability to fully close the mouth when the face is at rest, especially noticeable in the moderate to severe stages of the disease. We thus selected the extent of mouth opening as one of our target features as it can provide valuable insights into the degree of facial muscle control loss, a critical indicator of PD progression.
-
•
Width of the mouth: The width of the mouth during a smile can serve as an important indicator of facial muscle coordination and control. Given that Parkinson’s patients often exhibit less expressive and smaller smiles – known as the “Parkinson’s mask” (Tickle-Degnen and Lyons 2004) – the width of the mouth during smiling can play a significant role in identifying the presence of the disease.
-
•
Opening of the jaw: The degree of jaw opening, often correlated with the symptom of masked faces, is another distinctive facial feature in Parkinson’s disease. Patients may have difficulties fully controlling their jaw movement due to muscular rigidity, one of the primary motor symptoms of Parkinson’s. Therefore, we chose to include the measurement of jaw opening in our feature set.
To compute these attributes, we used the face mesh solution of MediaPipe. MediaPipe, a product developed by Google, provides 3D facial landmarks from a video frame containing a face, using a lightweight machine learning model. It first detects a face in the image or video stream and then applies the face mesh model to estimate the facial landmarks. Although distinct Action Units (AUs) with some overlaps were extracted for different facial expression videos using the OpenFace tool, we consistently extracted the same seven facial attribute features for each of the facial expressions using Mediapipe. This systematic approach ensures that each facial expression contributes an equivalent amount of information to the final feature space. Following the extraction, we performed a statistical aggregate on these features extracted at the frame level, computing mean, variance, and entropy. This process results in another set of digital features ( facial expressions facial attributes per expression statistical aggregates per attribute), further enriching the feature space.
Model Training, Inference, and Evaluation
After combining the features derived from facial action units and landmarks extracted by MediaPipe, we had a -dimensional feature space ( from AU features and from facial landmark features) to represent all three facial expressions for each participant. When all three facial expressions were used to train predictive models, all of these 126 features were considered. However, we also investigated using only one facial expression or a different combination of two facial expressions. In those cases, we only used the corresponding features related to the facial expressions we are using. For example, only relevant features (i.e., one-third of all features) were considered when we trained the predictive model with merely the smile expression. The model training phase includes feature selection, feature scaling, creating synthetic samples for the minority class to account for class imbalance, and a training loop where the model gradually learned from data. During inference, we applied the same feature selection and scaling techniques and then used the learned model to make a prediction.
Feature Selection.
Feature selection is a widely adopted approach aimed at reducing the dimensionality of data. By selecting a subset of relevant features, this technique helps prevent overfitting and enables the training of simpler and more generalizable models. We tried three different feature selection techniques using (i) logistic regression coefficients, (ii) Boosted Recursive Feature Elimination (BoostRFE), and (iii) Boosted Recursive Feature Addition (BoostRFA). Each of these methods ranks the features based on their importance in constructing a predictive model that can effectively differentiate participants with PD from those without the condition. After the features are ranked, we select top- features as input to the predictive model. is considered a hyperparameter and tuned with other parameters in order to derive the best-performing model.
For the logistic regression-based feature ranking, we ran a logistic regression on the full dataset (after scaling the feature values), and use the absolute coefficient of each feature as a proxy of its importance. Both BoostRFE and BoostRFA approach build an estimator (i.e., gradient boosting) with all available features and rank them based on feature importance obtained by SHapley Additive exPlanations (SHAP) (Lundberg and Lee 2017). BoostRFE iteratively removes the least important feature one by one, as long as the model’s performance improves, until only the top-n features remained. On the other hand, BoostRFA starts with the most important feature and incrementally adds the next most important feature if it led to performance improvement. The process is continued until features are added to the model.
In our study, we found that feature selection, in general, led to performance improvement, and the logistic regression-based feature ranking outperformed the other two approaches (Table 3). Therefore, the logistic-regression-based feature selection was used as the default for other experiments.
Feature Scaling.
Feature scaling is a crucial pre-processing step in machine learning. It ensures that all features are on a similar scale or range, and often leads to performance improvement. We have tried two different feature scaling methods mentioned below:
-
•
MinMax Scaling scales the values of each feature between 0 and 1 using the following formula:
where is the original feature value, and are the minimum and the maximum value of the feature, respectively, in the entire dataset.
-
•
Standard Scaling ensures the values of the input features are scaled to have a mean of 0 and a standard deviation of 1. The formula for Standard Scaling is:
where is the original feature vector, and are the mean and standard deviation of the feature, respectively, in the entire dataset.
Based on ablation studies (Table 3), feature scaling helped boost the performance of the predictive model. Among the two methods, we select the MinMax Scaler as the default scaling method as it yielded the best performance.
Minority Oversampling.
The dataset we studied was imbalanced, as it contained participants without PD compared to with the condition. Such class imbalance poses a challenge for training machine learning models as it can lead to a biased model that might overfit the majority class and under-represent the minority class, resulting in poor generalization. To address this issue, we employed the Synthetic Minority Oversampling Technique (SMOTE) (Chawla et al. 2002). SMOTE is a widely-used approach to balance class distribution through the generation of synthetic instances of the minority class. As shown in Table 3, incorporating SMOTE in model training helped improve the performance of the predictive model. However, please note that the entire dataset was split into train and test sets first, and then SMOTE was applied only on the train set. This ensures that the test set only contained real data, and none of the synthetic data in the training set was derived from any test data.
Evaluation.
We used -fold cross-validation with stratified sampling to assess the performance of the predictive model on held-out data. This approach involves dividing the dataset into different folds, with each fold containing portion of the dataset. The key distinction of stratified sampling is that it ensures each fold maintains a proportional representation of samples from different classes, mirroring the distribution in the entire dataset. To illustrate, consider an example where the dataset consists of samples, with samples belonging to class 1 and samples belonging to class 2 ( ratio). In -fold stratified cross-validation, each fold would include samples from class 1 and samples from class 2, preserving the ratio of samples per class observed in the full dataset. This ensures that the model is trained and evaluated on diverse samples from all classes. The evaluation process encompasses iterations, with each iteration reserving one of the folds as the test set, while the model is trained on the remaining data. This procedure allows for a comprehensive assessment of the model’s performance across the entire dataset while addressing potential biases introduced by class imbalances.
In addition, we used two different external test sets collected in (i) Clinic and (ii) Home-BD settings. For evaluating our model on these test sets, the model was solely trained on all data collected in the other two settings (i.e., Home-Global and PD Care Facility). As a result, the model has never seen any data from either Clinic or Home-BD setting. For each of the external test sets, we selected and scaled the features according to the training process, and ran inference using the trained model.
We used a comprehensive set of evaluation metrics widely adopted by machine learning for the healthcare community: (i) Area Under the Receiver Operating Characteristic (AUROC), (ii) binary Accuracy, (iii) Sensitivity, (iv) Specificity, (v) Positive Predictive Value (PPV), (vi) Negative Predictive Value (NPV). Instead of relying on a single metric, we selected the best model based on a holistic evaluation of all of the above metrics.
Hyper Parameter Tuning.
Parameter tuning (Victoria and Maragatham 2021; Feurer and Hutter 2019) plays a crucial role in enhancing the performance of machine learning models. It involves adjusting the hyperparameters of these models to optimize their predictive performance. For this study, we employed a range of classifiers, including Support Vector Machine (SVM), AdaBoost, HistBoost, XGBoost, and Random Forest. The hyperparameters of these classifiers were tuned using Weights & Biases (WandB) (Biewald 2020), a machine learning tool designed for this specific purpose. WandB helped us identify the optimal combination of parameters that yielded the best model performance. The core principle underlying hyperparameter tuning is to traverse the search space of various parameter combinations with the goal of maximizing or minimizing a specific performance metric, for which, we used a Bayesian approach enabled by WandB.
For example, in our study, the parameters tuned for the SVM model included the number of top significant features (n), the penalty parameter of the error term (C), and the kernel coefficient for ‘rbf’, ‘poly’ and ‘sigmoid’ kernels (gamma). For AdaBoost, apart from n, the number of weak learners (n_estimators) and learning rate were tuned. Similarly, for the XGBoost and HistBoost models, we tuned parameters such as maximum depth of a tree (max_depth), minimum sum of instance weight needed in a child (min_child_weight), and boosting learning rate (eta), among others. In the Random Forest classifier, the number of trees in the forest (n_estimators) and the maximum depth of the tree (max_depth) were the key parameters tuned. These tuned models were then used in the subsequent steps of our experiment to achieve more robust and accurate results. The scripts for hyper-parameter tuning will be released alongside the code upon acceptance of the manuscript.
Use of Large Language Models
ChatGPT555https://chat.openai.com/chat, a sophisticated language model developed by OpenAI666https://openai.com/, was employed as an editorial aid during the preparation of this manuscript. It facilitated the refinement of the manuscript’s language, grammar, and stylistic elements through its intelligent suggestions. It’s noteworthy that all recommendations proposed by ChatGPT underwent thorough examination by an author prior to their final incorporation into the text. Importantly, the function of ChatGPT was strictly limited to proposing amendments to the existing content and it was not utilized to generate any new material for this manuscript.
Ethics
This study received the necessary approval from the Institutional Review Board (IRB) of the University of Rochester, and all the experimental procedures were conducted in compliance with the approved study protocol. For data collected from Bangladesh, we received IRB approval from the Bangladesh University of Engineering & Technology (BUET). Given the predominantly remote administration of this study, written consent from participants was not obtained. However, informed consent was duly collected electronically from the participants, authorizing the use of their data for analysis and the inclusion of their photos in the figures presented within this study.
Code and Data Availability
The recorded videos were collected using a web-based tool. The tool is publicly accessible at https://parktest.net. The codes for video processing, feature extraction, and model training will be made publicly available upon the acceptance of this paper. We will provide a link to the repository containing the codes.
Unfortunately, we are unable to share the raw videos due to the Health Insurance Portability and Accountability Act (HIPAA) compliance. However, we are committed to sharing the extracted features upon receiving an email request at rochesterhci@gmail.com. The features will be provided in a structured format that can be easily integrated with existing machine-learning workflows.
References
- Abrami et al. (2021) Abrami, A.; Gunzler, S.; Kilbane, C.; Ostrand, R.; Ho, B.; Cecchi, G.; et al. 2021. Automated computer vision assessment of hypomimia in Parkinson disease: proof-of-principle pilot study. Journal of Medical Internet Research, 23(2): e21037.
- Amos et al. (2016) Amos, B.; Ludwiczuk, B.; Satyanarayanan, M.; et al. 2016. Openface: A general-purpose face recognition library with mobile applications. CMU School of Computer Science, 6(2): 20.
- Baltrusaitis et al. (2018) Baltrusaitis, T.; Zadeh, A.; Lim, Y. C.; and Morency, L.-P. 2018. Openface 2.0: Facial behavior analysis toolkit. In 2018 13th IEEE international conference on automatic face & gesture recognition (FG 2018), 59–66. IEEE.
- Baltrušaitis, Robinson, and Morency (2016) Baltrušaitis, T.; Robinson, P.; and Morency, L.-P. 2016. OpenFace: An open source facial behavior analysis toolkit. In 2016 IEEE Winter Conference on Applications of Computer Vision (WACV), 1–10.
- Biewald (2020) Biewald, L. 2020. Experiment Tracking with Weights and Biases. Software available from wandb.com.
- Blumer et al. (1987) Blumer, A.; Ehrenfeucht, A.; Haussler, D.; and Warmuth, M. K. 1987. Occam’s razor. Information processing letters, 24(6): 377–380.
- Bot et al. (2016) Bot, B. M.; Suver, C.; Neto, E. C.; Kellen, M.; Klein, A.; Bare, C.; Doerr, M.; Pratap, A.; Wilbanks, J.; Dorsey, E.; et al. 2016. The mPower study, Parkinson disease mobile data collected using ResearchKit. Scientific data, 3(1): 1–9.
- Bro and Smilde (2014) Bro, R.; and Smilde, A. K. 2014. Principal component analysis. Analytical methods, 6(9): 2812–2831.
- Chawla et al. (2002) Chawla, N. V.; Bowyer, K. W.; Hall, L. O.; and Kegelmeyer, W. P. 2002. SMOTE: synthetic minority over-sampling technique. Journal of artificial intelligence research, 16: 321–357.
- Chen and Guestrin (2016) Chen, T.; and Guestrin, C. 2016. Xgboost: A scalable tree boosting system. In Proceedings of the 22nd acm sigkdd international conference on knowledge discovery and data mining, 785–794.
- Cortes and Vapnik (1995) Cortes, C.; and Vapnik, V. 1995. Support-vector networks. Machine learning, 20: 273–297.
- Das et al. (2021) Das, K.; Cockerell, C. J.; Patil, A.; Pietkiewicz, P.; Giulini, M.; Grabbe, S.; and Goldust, M. 2021. Machine learning and its application in skin cancer. International Journal of Environmental Research and Public Health, 18(24): 13409.
- Dorsey et al. (2018) Dorsey, E.; Sherer, T.; Okun, M. S.; and Bloem, B. R. 2018. The emerging evidence of the Parkinson pandemic. Journal of Parkinson’s disease, 8(s1): S3–S8.
- Ekman, Davidson, and Friesen (1990) Ekman, P.; Davidson, R. J.; and Friesen, W. V. 1990. The Duchenne smile: emotional expression and brain physiology: II. Journal of personality and social psychology, 58(2): 342.
- Ekman and Friesen (1978) Ekman, P.; and Friesen, W. V. 1978. Facial action coding system. Environmental Psychology & Nonverbal Behavior.
- Feurer and Hutter (2019) Feurer, M.; and Hutter, F. 2019. Hyperparameter optimization. Automated machine learning: Methods, systems, challenges, 3–33.
- Fujita et al. (2021) Fujita, T.; Babazono, A.; Kim, S.; Jamal, A.; and Li, Y. 2021. Effects of physician visit frequency for Parkinson’s disease treatment on mortality, hospitalization, and costs: a retrospective cohort study. BMC geriatrics, 21(1): 1–12.
- Goetz et al. (2008) Goetz, C. G.; Tilley, B. C.; Shaftman, S. R.; Stebbins, G. T.; Fahn, S.; Martinez-Martin, P.; Poewe, W.; Sampaio, C.; Stern, M. B.; Dodel, R.; et al. 2008. Movement Disorder Society-sponsored revision of the Unified Parkinson’s Disease Rating Scale (MDS-UPDRS): scale presentation and clinimetric testing results. Movement disorders, 23(15): 2129–2170.
- Gomez et al. (2021) Gomez, L. F.; Morales, A.; Orozco-Arroyave, J. R.; Daza, R.; and Fierrez, J. 2021. Improving parkinson detection using dynamic features from evoked expressions in video. In Proceedings of the IEEE/CVF Conference on Computer Vision and Pattern Recognition, 1562–1570.
- Guryanov (2019) Guryanov, A. 2019. Histogram-based algorithm for building gradient boosting ensembles of piecewise linear decision trees. In Analysis of Images, Social Networks and Texts: 8th International Conference, AIST 2019, Kazan, Russia, July 17–19, 2019, Revised Selected Papers 8, 39–50. Springer.
- Kazemian et al. (2021) Kazemian, E.; Schaffer, H. M.; Wozniak, A.; and Leonetti, J. P. 2021. Economic impact of diagnostic imaging in the workup of uncomplicated Bell’s palsy. Journal of Neurological Surgery Part B: Skull Base, 83(03): 323–327.
- Ke et al. (2017) Ke, G.; Meng, Q.; Finley, T.; Wang, T.; Chen, W.; Ma, W.; Ye, Q.; and Liu, T.-Y. 2017. Lightgbm: A highly efficient gradient boosting decision tree. Advances in neural information processing systems, 30.
- Khadilkar (2013) Khadilkar, S. 2013. Neurology in India. Annals of Indian Academy of Neurology, 16(4): 465.
- King et al. (2019) King, G.; Lovell, A.; Neufcourt, L.; and Nunes, F. 2019. Direct comparison between Bayesian and frequentist uncertainty quantification for nuclear reactions. Physical Review Letters, 122(23): 232502.
- Kogan et al. (2023) Kogan, E.; Didden, E.-M.; Lee, E.; Nnewihe, A.; Stamatiadis, D.; Mataraso, S.; Quinn, D.; Rosenberg, D.; Chehoud, C.; and Bridges, C. 2023. A machine learning approach to identifying patients with pulmonary hypertension using real-world electronic health records. International Journal of Cardiology, 374: 95–99.
- Kohavi et al. (1995) Kohavi, R.; et al. 1995. A study of cross-validation and bootstrap for accuracy estimation and model selection. In Ijcai, volume 14, 1137–1145. Montreal, Canada.
- Langevin et al. (2019) Langevin, R.; Ali, M. R.; Sen, T.; Snyder, C.; Myers, T.; Dorsey, E. R.; and Hoque, M. E. 2019. The PARK Framework for Automated Analysis of Parkinson’s Disease Characteristics. Proceedings of the ACM on Interactive, Mobile, Wearable and Ubiquitous Technologies, 3(2): 1–22.
- Lugaresi et al. (2019) Lugaresi, C.; Tang, J.; Nash, H.; McClanahan, C.; Uboweja, E.; Hays, M.; Zhang, F.; Chang, C.-L.; Yong, M.; Lee, J.; et al. 2019. Mediapipe: A framework for perceiving and processing reality. In Third Workshop on Computer Vision for AR/VR at IEEE Computer Vision and Pattern Recognition (CVPR), volume 2019.
- Lundberg and Lee (2017) Lundberg, S. M.; and Lee, S.-I. 2017. A Unified Approach to Interpreting Model Predictions. In Guyon, I.; Luxburg, U. V.; Bengio, S.; Wallach, H.; Fergus, R.; Vishwanathan, S.; and Garnett, R., eds., Advances in Neural Information Processing Systems 30, 4765–4774. Curran Associates, Inc.
- Mäkinen et al. (2019) Mäkinen, E.; Joutsa, J.; Jaakkola, E.; Noponen, T.; Johansson, J.; Pitkonen, M.; Levo, R.; Mertsalmi, T.; Scheperjans, F.; and Kaasinen, V. 2019. Individual parkinsonian motor signs and striatal dopamine transporter deficiency: a study with [I-123] FP-CIT SPECT. Journal of neurology, 266(4): 826–834.
- Maycas-Cepeda et al. (2021) Maycas-Cepeda, T.; López-Ruiz, P.; Feliz-Feliz, C.; Gómez-Vicente, L.; García-Cobos, R.; Arroyo, R.; and García-Ruiz, P. J. 2021. Hypomimia in Parkinson’s disease: what is it telling us? Frontiers in Neurology, 11: 1775.
- Morinan et al. (2023) Morinan, G.; Dushin, Y.; Sarapata, G.; Rupprechter, S.; Peng, Y.; Girges, C.; Salazar, M.; Milabo, C.; Sibley, K.; Foltynie, T.; et al. 2023. Computer vision quantification of whole-body Parkinsonian bradykinesia using a large multi-site population. npj Parkinson’s Disease, 9(1): 10.
- Post et al. (2020) Post, B.; Van Den Heuvel, L.; Van Prooije, T.; Van Ruissen, X.; Van De Warrenburg, B.; and Nonnekes, J. 2020. Young onset Parkinson’s disease: a modern and tailored approach. Journal of Parkinson’s disease, 10(s1): S29–S36.
- Rajnoha et al. (2018) Rajnoha, M.; Mekyska, J.; Burget, R.; Eliasova, I.; Kostalova, M.; and Rektorová, I. 2018. Towards identification of hypomimia in Parkinson’s disease based on face recognition methods. In 2018 10th International Congress on Ultra Modern Telecommunications and Control Systems and Workshops (ICUMT), 1–4. IEEE.
- Ricciardi et al. (2020) Ricciardi, L.; De Angelis, A.; Marsili, L.; Faiman, I.; Pradhan, P.; Pereira, E.; Edwards, M.; Morgante, F.; and Bologna, M. 2020. Hypomimia in Parkinson’s disease: an axial sign responsive to levodopa. European Journal of Neurology, 27(12): 2422–2429.
- Rousseeuw (1987) Rousseeuw, P. J. 1987. Silhouettes: A graphical aid to the interpretation and validation of cluster analysis. Journal of Computational and Applied Mathematics, 20: 53–65.
- Seyyed-Kalantari et al. (2021) Seyyed-Kalantari, L.; Zhang, H.; McDermott, M. B.; Chen, I. Y.; and Ghassemi, M. 2021. Underdiagnosis bias of artificial intelligence algorithms applied to chest radiographs in under-served patient populations. Nature medicine, 27(12): 2176–2182.
- Shimkin (2015) Shimkin, K. 2015. From MicrobeWiki, the student-edited microbiology resource This is a curated page. Report corrections to Microbewiki.
- Tickle-Degnen and Lyons (2004) Tickle-Degnen, L.; and Lyons, K. D. 2004. Practitioners’ impressions of patients with Parkinson’s disease: the social ecology of the expressive mask. Social Science & Medicine, 58(3): 603–614.
- Velusamy et al. (2011) Velusamy, S.; Kannan, H.; Anand, B.; Sharma, A.; and Navathe, B. 2011. A method to infer emotions from facial action units. In 2011 IEEE international conference on acoustics, speech and signal processing (ICASSP), 2028–2031. IEEE.
- Victoria and Maragatham (2021) Victoria, A. H.; and Maragatham, G. 2021. Automatic tuning of hyperparameters using Bayesian optimization. Evolving Systems, 12: 217–223.
- Vinokurov et al. (2015) Vinokurov, N.; Arkadir, D.; Linetsky, E.; Bergman, H.; and Weinshall, D. 2015. Quantifying hypomimia in parkinson patients using a depth camera. In International Symposium on Pervasive Computing Paradigms for Mental Health, 63–71. Springer.
- Yang et al. (2020) Yang, W.; Hamilton, J. L.; Kopil, C.; Beck, J. C.; Tanner, C. M.; Albin, R. L.; Ray Dorsey, E.; Dahodwala, N.; Cintina, I.; Hogan, P.; et al. 2020. Current and projected future economic burden of Parkinson’s disease in the US. npj Parkinson’s Disease, 6(1): 15.
- Yang et al. (2022) Yang, Y.; Yuan, Y.; Zhang, G.; Wang, H.; Chen, Y.-C.; Liu, Y.; Tarolli, C. G.; Crepeau, D.; Bukartyk, J.; Junna, M. R.; et al. 2022. Artificial intelligence-enabled detection and assessment of Parkinson’s disease using nocturnal breathing signals. Nature medicine, 28(10): 2207–2215.
- Zhang et al. (2022) Zhang, A.; Xing, L.; Zou, J.; and Wu, J. C. 2022. Shifting machine learning for healthcare from development to deployment and from models to data. Nature Biomedical Engineering, 6(12): 1330–1345.
Acknowledgement
This work was supported by the U.S. Defense Advanced Research Projects Agency (DARPA) under grant W911NF19-1-0029, National Science Foundation Award IIS-1750380, National Institute of Neurological Disorders and Stroke of the National Institutes of Health under award number P50NS108676 and Moore Foundation.
We express our sincere gratitude to Cathe Schwartz, Karen Jaffe, and the dedicated members of the InMotion PD care facility for their invaluable assistance in collecting a diverse dataset from the residents in Ohio, United States. Their support was crucial in ensuring the success of our data collection efforts.
We would also like to extend our appreciation to Dr. Ray Dorsey, Dr. Ruth Schneider, Meghan Pawlik, Phillip Yang, and the esteemed team at the University of Rochester’s Center for Health and Technology (CHeT). Their collaboration and support played a pivotal role in facilitating the data collection process from the clinical cohort. We are particularly grateful for their expertise and insights into Hypomimia and other symptoms associated with Parkinson’s disease. Their contributions have significantly enriched our study and deepened our understanding of the condition.
Finally, we would like to acknowledge the significant contributions of Dr. M Rafayet Ali, Dr. Raiyan Abdul Baten, and Abdelrahman Abdelkader from the University of Rochester. Their diligent efforts in data collection and preliminary analysis laid the foundations for this work.
Author Contributions
M.S.I., T.A., W.R., M.S.R., and E.H. conceptualized and designed the experiments. T.A. developed the feature extraction process. S.D.T., K.N., and I.S. lead the data collection efforts from Bangladesh, and performed preliminary data analysis. T.A. and S.L. developed machine learning models. M.S.I. and T.A. designed the evaluation framework and worked on data analysis and visualization. M.S.I., T.A., and E.H. wrote the manuscript. All the authors read the manuscript and provided valuable suggestions for revising it. All authors accept the responsibility to submit it for publication.
Competing Interests
The authors declare that there are no competing interests.
Supplementary Note 1 – Feature Extraction
A comprehensive list of the extracted features for each facial expression task is provided in Table 4. While the set of action unit features may vary depending on expressions, the MediaPipe attributes are the same for all expressions.
| Category | Facial Featues | |
| Facial Expression | Action Units | Description |
| Smile | 1 | Inner Brow Raiser |
| 6 | Cheek Raiser | |
| 12 | Lip Corner Puller | |
| 14 | Dimpler | |
| 25 | Lips Part | |
| 26 | Jaw Drop | |
| 45 | Blink | |
| Disgust | 4 | Brow Lowerer |
| 7 | Lid Tightener | |
| 9 | Nose Wrinkler | |
| 10 | Upper Lip Raiser | |
| 25 | Lips Part | |
| 26 | Jaw Drop | |
| 45 | Blink | |
| Surprise | 1 | Inner Brow Raiser |
| 2 | Outer Brow Raiser | |
| 4 | Brow Lowerer | |
| 5 | Upper Lid Raiser | |
| 25 | Lips Part | |
| 26 | Jaw Drop | |
| 45 | Blink | |
| Mediapipe Attributes | Right Eye Open | |
| Left Eye Open | ||
| Right Eye Raised | ||
| Left Eye Raised | ||
| Mouth Open | ||
| Mouth Width | ||
| Jaw Open | ||
Supplementart Note 2 – Demographic Characteristics of Data Collected in Each Different Setting
In this section, we provide detailed demographic information for data collected in four different settings mentioned in the manuscript. Table 5, 6, 7, and 8 describe the details for Home-Global, PD Care Facility, Home-BD, and Clinic settings, respectively.
| Characteristics | With PD | Without PD | Total | |||||
|
77 (11.11%) | 616 (88.89%) | 693 (100%) | |||||
| Sex, n (%) | ||||||||
| Male | 48 (62.34%) | 245 (39.77%) | 293 (42.28%) | |||||
| Female | 29 (37.66%) | 371 (60.23%) | 400 (57.72%) | |||||
| Age in years (range: 18 – 89, mean: 60.28), n (%) | ||||||||
| <20 | 0 (0.0%) | 6 (0.97%) | 6 (0.87%) | |||||
| 20-39 | 3 (3.9%) | 51 (8.28%) | 54 (7.79%) | |||||
| 40-59 | 15 (19.48%) | 159 (25.81%) | 174 (25.11%) | |||||
| 60-79 | 58 (75.32%) | 397 (64.45%) | 455 (65.66%) | |||||
| >=80 | 1 (1.3%) | 3 (0.49%) | 4 (0.58%) | |||||
| Race, n (%) | ||||||||
| White | 70 (90.91%) | 504 (81.82%) | 574 (82.83%) | |||||
| Asian | 1 (1.3%) | 52 (8.44%) | 53 (7.65%) | |||||
|
3 (3.9%) | 44 (7.14%) | 47 (6.78%) | |||||
|
0 (0.0%) | 4 (0.65%) | 4 (0.58%) | |||||
| Others | 3 (3.9%) | 12 (1.95%) | 15 (2.16%) | |||||
| Not Mentioned | 0 (0.0%) | 0 (0.0%) | 0 (0.0%) | |||||
| Characteristics | With PD | Without PD | Total | ||||
|
118 (83.1%) | 24 (16.9%) | 142 (100%) | ||||
| Sex, n (%) | |||||||
| Male | 60 (50.85%) | 12 (50.0%) | 72 (50.7%) | ||||
| Female | 58 (49.15%) | 12 (50.0%) | 70 (49.3%) | ||||
| Age in years (range: 18 – 93, mean: 67.27), n (%) | |||||||
| <20 | 0 (0.0%) | 0 (0.0%) | 0 (0.0%) | ||||
| 20-39 | 1 (0.85%) | 8 (33.33%) | 9 (6.34%) | ||||
| 40-59 | 11 (9.32%) | 3 (12.5%) | 14 (9.86%) | ||||
| 60-79 | 95 (80.51%) | 11 (45.83%) | 106 (74.65%) | ||||
| >=80 | 11 (9.32%) | 2 (8.33%) | 13 (9.15%) | ||||
| Characteristics | With PD | Without PD | Total | |||||
|
47 (62.67%) | 28 (37.33%) | 75 (100%) | |||||
| Sex, n (%) | ||||||||
| Male | 31 (65.96%) | 12 (42.86%) | 43 (57.33%) | |||||
| Female | 16 (34.04%) | 16 (57.14%) | 32 (42.67%) | |||||
| Age in years (range: 18 – 86, mean: 65.43), n (%) | ||||||||
| <20 | 0 (0.0%) | 0 (0.0%) | 0 (0.0%) | |||||
| 20-39 | 0 (0.0%) | 3 (10.71%) | 3 (4.0%) | |||||
| 40-59 | 7 (14.89%) | 6 (21.43%) | 13 (17.33%) | |||||
| 60-79 | 38 (80.85%) | 18 (64.29%) | 56 (74.67%) | |||||
| >=80 | 2 (4.26%) | 1 (3.57%) | 3 (4.0%) | |||||
| Race, n (%) | ||||||||
| White | 46 (97.87%) | 27 (96.43%) | 73 (97.33%) | |||||
| Asian | 0 (0.0%) | 0 (0.0%) | 0 (0.0%) | |||||
|
0 (0.0%) | 1 (3.57%) | 1 (1.33%) | |||||
|
1 (2.13%) | 0 (0.0%) | 1 (1.33%) | |||||
| Others | 0 (0.0%) | 0 (0.0%) | 0 (0.0%) | |||||
| Not Mentioned | 0 (0.0%) | 0 (0.0%) | 0 (0.0%) | |||||
| Characteristics | With PD | Without PD | Total | ||||
|
14 (9.4%) | 135 (90.6%) | 149 (100%) | ||||
| Sex, n (%) | |||||||
| Male | 11 (78.57%) | 92 (68.15%) | 103 (69.13%) | ||||
| Female | 3 (21.43%) | 43 (31.85%) | 46 (30.87%) | ||||
| Age in years (range: 18 – 80, mean: 41.18), n (%) | |||||||
| <20 | 0 (0.0%) | 37 (27.41%) | 37 (24.83%) | ||||
| 20-39 | 0 (0.0%) | 34 (25.19%) | 34 (22.82%) | ||||
| 40-59 | 6 (42.86%) | 48 (35.56%) | 54 (36.24%) | ||||
| 60-79 | 7 (50.0%) | 12 (8.89%) | 19 (12.75%) | ||||
| >=80 | 1 (7.14%) | 4 (2.96%) | 5 (3.36%) | ||||