20cm(0.6cm,0.4cm) IEEE-EMBS International Conference on Biomedical and Health Informatics (BHI’23), Oct. 15–18, 2023, Pittsburgh, Pennsylvania, USA
Hypertension Detection From High-Dimensional Representation of Photoplethysmogram Signals
Abstract
Hypertension is commonly referred to as the “silent killer”, since it can lead to severe health complications without any visible symptoms. Early detection of hypertension is crucial in preventing significant health issues. Although some studies suggest a relationship between blood pressure and certain vital signals, such as Photoplethysmogram (PPG), reliable generalization of the proposed blood pressure estimation methods is not yet guaranteed. This lack of certainty has resulted in some studies doubting the existence of such relationships, or considering them weak and limited to heart rate and blood pressure. In this paper, a high-dimensional representation technique based on random convolution kernels is proposed for hypertension detection using PPG signals. The results show that this relationship extends beyond heart rate and blood pressure, demonstrating the feasibility of hypertension detection with generalization. Additionally, the utilized transform using convolution kernels, as an end-to-end time-series feature extractor, outperforms the methods proposed in the previous studies and state-of-the-art deep learning models.
Clinical relevance— The findings of this study highlights the feasibility of hypertension detection using PPG signals. This could be useful for the early detection of high blood pressure and reducing the risk of hypertension going unnoticed, particularly using wearable devices such as smartwatches equipped with PPG sensors.
I Introduction
Hypertension, or high blood pressure (BP), is a common and dangerous condition that can lead to serious health problems, including heart failure and brain stroke [1]. It is estimated that 1.28 billion adults aged 30–79 years may have hypertension worldwide [2]. According to the Centers for Disease Control and Prevention, nearly half of adults in the United States may have hypertension [3].
People with hypertension are not often aware of it for years. Early detection of hypertension is critical to prevent serious health issues for people at risk. Regular BP checks are recommended for everyone, especially for those at risk, including people with a family history of hypertension, diabetes, or obesity. Early detection allows for early intervention, such as lifestyle changes and medication, which can help to manage hypertension and prevent further complications. However, cuff-based or wrist BP monitoring devices are not available for everyone. These devices are not convenient to use for many people, particularly the elderly. Manual regular BP monitoring is generally inconvenient and requires commitment. These challenges have prompted researchers to seek alternative methods in measuring BP and detecting hypertension [4].
Photoplethysmogram (PPG) is a signal collected from an optical sensor which shows fluctuations of the blood volume per heartbeat [5]. PPG has recently been investigated as an alternative for continuous BP monitoring without using a cuff. This is particularly of interest as the pattern of an invasive arterial blood pressure (ABP) signal is very similar to the PPG. Previous studies have shown that the properties of a PPG signal can indicate various characteristics of the cardiovascular system [6, 7], such as large artery stiffness index (LASI), systemic vascular resistance (SVR), arterial tone, total peripheral resistance, and pulse wave velocity (PWV). Therefore, by extracting PPG key points and relevant cardiovascular features and applying various machine learning algorithms, BP estimation may be possible [8, 9].
The performance of most PPG-based BP estimation methods has been reported as either very high or very low. Many studies reporting high performance used the UCI cuff-less BP estimation dataset [8], which comprises PPG and arterial BP signal segments recorded from approximately patients. However, this dataset does not provide any subject identifier (ID) for each PPG signal sample, and the preprocessing steps are not discussed in detail. As a subject may have more than one PPG sample in the dataset, this could lead to data and domain overlap in the training and validation phases. Hence, for methods developed based on this dataset, generalization to a completely unseen subject cannot be guaranteed.
Other PPG datasets typically have a small number of samples [10], which limits proper generalization evaluation of machine learning methods for real-world scenarios. This is particularly important in training deep learning models such as recurrent neural networks [11], where generally a very large number of training samples are required. The difference in reported results and the lack of proven generalization on unseen subjects have caused some studies to cast doubt on the existence of any relationship between BP and PPG features [12, 13]. These studies suggest that the only feature relevant to BP might be the heart rate [14].
This paper addresses the problem of PPG-based BP estimation as a binary hypertension detection task. To this end, the MIMIC-III PPG-BP dataset is used where the train, validation, and test sets are completely separated based on patient IDs [15]. In order to have an end-to-end feature extraction and classification solution, an input PPG signal is projected to a high dimensional space using random convolutional kernels transform (ROCKET) [16]. The transform maps a time series with any length to a set of temporally-independent features. The extracted features from all the PPG signals are then used to train a classifier. Results show a better performance of the proposed method in comparison with manual feature extraction and state-of-the-art deep learning models. The results further support the relationship between PPG properties and hypertension111Our codes are available online: https://github.com/navidhasanzadeh/Hypertension_PPG.
II Method
Feature extraction and classification with random convolution kernels, without training the kernels, is a novel method for time-series representation [16, 17]. This approach has demonstrated a promising performance in many time-series classification tasks such as in electroencephalogram (EEG) [18] and human activity recognition [19, 20]. It also has the potential to outperform deep neural networks in many scenarios such as where limited-imbalanced data is available.
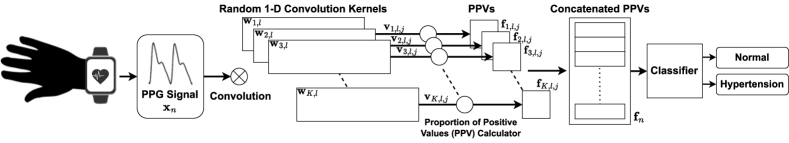
Figure 1 shows different steps of the proposed method for feature extraction from PPG signals and hypertension detection. Let represents a set of PPG signals where is the data class, with represents normal and representing hypertension.
A set of 1-dimensional random convolution kernels are generated where the length of each kernel is and the weights are selected randomly from in such a way that each kernel contains three weights with a value of , and the total sum of the weights in each kernel is zero. Then, a set of dilation factors controls the spread of each kernel over an input PPG signal with length selected from where is a constant, and is the number of constructed dilations, [16, 20]. This provides different combinations of kernels and dilations as . Each kernel is then convolved with a PPG signal as
| (1) |
for , and . Based on the quantiles of the convolution output and for each pair of kernel and dilation , a set of bias terms is computed. Each bias term shifts the convolution output to generate a new representation as
| (2) |
where and , , and . The total number of extracted features is a multiple of the number of output features. The output features, called proportion of positive values (PPV), are extracted as
| (3) |
for , , and where is the number of bias terms and is the indicator function. Finally, the extracted features can be represented as where is the number of output features. The generated features for along with the corresponding labels are then used to separately train Ridge regression (RR) and Random Forest (RF) classifiers.
III Experiments
III-A Data
In this study, the PPG signals and corresponding BPs derived from the MIMIC-III dataset [15] are used. The BP values are categorized into normal and hypertension classes based on ESC/ESH guidelines [21]. This dataset comprises subjects for training and subjects for testing. The training and test datasets are standardized and divided at subject level to avoid any overlap. There are PPG signals for training, samples for validation, and samples for testing. Each PPG sample has a duration of seconds, and the sampling rate is Hz.
Method Classifier Sensitivity Weighted Average Normal Hypertension Precision Sensitivity F1-score Heart-rate-based Ridge Regression 49.6% 53.1% 67.0% 50.3% 54.6% PPG Morphological Features Ridge Regression 53.2% 61.4% 71.0% 54.9% 58.9% Random Forest 66.7% 60.1% 74.5% 65.3% 68.1% Deep Neural Networks ResNet-18 67.8% 67.5% 77.1% 67.7% 70.4% ResNet-34 66.5% 68.4% 77.0% 66.9% 69.7% MiniROCKET Ridge Regression 66.2% 69.1% 77.6% 66.8% 69.4% Random Forest 69.3% 68.5% 77.9% 69.1% 71.6%
III-B Baseline Models
The performance of the proposed method is compared with the following baseline models for the detection of hypertension using PPG signals.
III-B1 Heart-rate-based Classifier
Based on the quasi-periodic nature of the PPG signals, the automatic multiscale-based peak detection (AMPD) algorithm [22] is used to detect the maximum points. Subsequently, for each PPG signal the average heart rate is calculated. Then, a simple RR classifier is trained for hypertension detection.
III-B2 Classification using PPG Morphological Features
To extract PPG morphological features, the PPG signals are first segmented using a multi-observation hidden semi-Markov model (HSMM) [5]. Next, the key points of each PPG pulse, including PPG onset, maximum slope point, systolic peak, dicrotic notch, and diastolic peak, are extracted. Then, BP-related features including heart rate, pulse width, crest time, reflection index, large artery stiffness index (LASI), ratio of PPG pulse areas, and modified normalized pulse volume (mNPV) are derived [8, 23, 24]. An RR classifier and an RF classifier are individually trained and evaluated using the extracted features.
III-B3 Deep Neural Networks
Two -D variants of the ResNet- and ResNet- deep learning models are trained using the raw PPG signals in an end-to-end manner [25]. In these architectures, the -D filters are replaced by -D ones222https://pypi.org/project/keras-resnet/.
III-C Training and Validation Setup
Since the dataset is imbalanced and only a small proportion, around , of the training set is labelled as hypertension, all the classifiers were trained using balanced class weights that consider the class frequencies in the input data. For RF classifiers, the model randomly under-samples each bootstrap sample to balance it333https://pypi.org/project/imbalanced-learn/. For deep neural networks, a weighted loss function is used. Hyperparameters of the models were set using grid-search with respect to the F-score. Adam optimizer was used to train the deep learning models with an initial learning rate of , weight decay of , and batch size of for a maximum of epochs with early-stopping. For the MiniROCKET model, the number of kernels is and the number of output features is .
III-D Results
In this section, the models implemented in this work are evaluated in terms of sensitivity, precision, and F1-score.
III-D1 Classification Performance Analysis
The performance results in Table I show that using only the heart-rate feature for hypertension detection leads to a very low sensitivity of . Although this sensitivity is slightly better than chance level, it is not sufficient on its own for detecting hypertension.
The extraction of morphological features from PPG signals improves the sensitivity and F1-score for hypertension detection. These features provide more BP-related information than the heart-rate feature alone. Besides, using an RF classifier can discriminate hypertension from normal with significantly better accuracy than RR. The features LASI and reflection index (RI) have the highest Gini indices and importance levels among all the attributes for making the decision trees. These features are related to large artery stiffness and pulse reflection in arteries, respectively.
Both ResNet models performed better than the models trained on manually-extracted PPG features. This indicates that end-to-end BP-related features extraction from PPG is more robust against PPG signals variations. ResNet-18 obtained a sensitivity of for the normal class and for detecting hypertension. On average, it performed slightly better than ResNet-34 with an average F1-score of .
Among all the methods, end-to-end MiniROCKET feature extractor with a balanced RF classifier has achieved the best performance. This method can detect hypertension with an average F1-score of . The RR classifier with MiniROCKET obtained slightly less average performance but with a sensitivity of .
The higher performance of the ResNet models and MiniROCKET indicates that there are BP-related features that are not visually observable on PPG pulses and cannot be extracted using manually designed algorithms. Moreover, PPG signals have different shapes among individuals, which makes it difficult to develop a robust manual algorithm for accurate extraction of all the BP-related features.
III-D2 Relationship Between PPG and Hypertension Detection
The results show that the relationship between high BP and extracted features from a PPG signal is not only limited to heart-rate. By evaluating a range of both manual-based and end-to-end methods on a dataset—where training and testing sets are entirely seperated at the subject level—the findings indicate that PPG signals can be effectively utilized for hypertension detection with a high generalization capability.
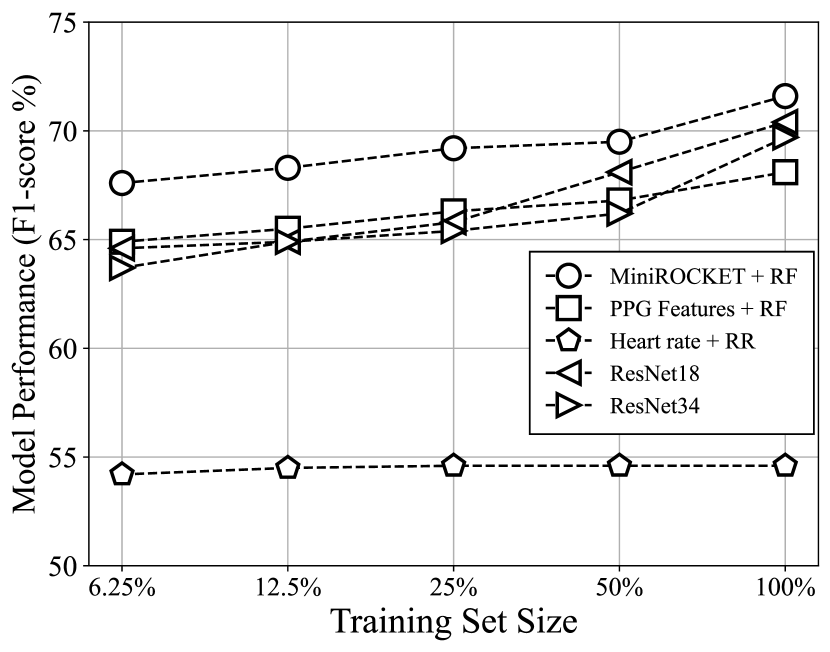
III-D3 Impact of the Number of Training Samples
In order to study the effect of the size of training set on the models’ performance, the models were trained with , , , and of the training samples. Figure 2 illustrates the performance for different models as the training set size increases. By using only of the training data, the best F1-score among the models dropped from to . Similarly, using of the training samples resulted in a drop to . In all scenarios, MiniROCKET still outperforms all other methods. The trends in this plot indicate that a higher classification accuracy is anticipated by increasing the size of the training dataset, particularly the hypertension data class.
IV Conclusion
In this study, the feasibility of hypertension detection using PPG signals is assessed. Utilizing a dataset divided into training, validation, and test sets on a subject basis, the results suggest that the proposed end-to-end method with an RF classifier can achieve an F1-score of on the test set. This demonstrates that hypertension detection from PPG signals is capable of generalizing to completely unseen samples. In addition to heart rate, PPG can provide many BP-related informative attributes that can enhance classification performance. The proposed method facilitates the early detection of hypertension using wearable technology.
References
- [1] Jonathan P Kalehoff and Suzanne Oparil, “The story of the silent killer: a history of hypertension: its discovery, diagnosis, treatment, and debates,” Current Hypertension Reports, vol. 22, pp. 1–14, 2020.
- [2] World Health Organization et al., “World health statistics 2022,” 2022.
- [3] Centers for Disease Control and Prevention, “Hypertension cascade: Hypertension prevalence, treatment and control estimates among u.s. adults aged 18 years and older applying the criteria from the american college of cardiology and american heart association’s 2017 hypertension guideline—nhanes 2015–2018,” U.S. Department of Health and Human Services, 2021.
- [4] Lei Zhao, Cunman Liang, Yan Huang, Guodong Zhou, Yiqun Xiao, Nan Ji, Yuan-Ting Zhang, and Ni Zhao, “Emerging sensing and modeling technologies for wearable and cuffless blood pressure monitoring,” npj Digital Medicine, vol. 6, no. 1, pp. 93, 2023.
- [5] Navid Hasanzadeh, Shahrokh Valaee, and Hojjat Salehinejad, “Multi-observation hidden semi-markov model for photoplethysmogram signal semantic segmentation,” in ICASSP 2023-2023 IEEE International Conference on Acoustics, Speech and Signal Processing (ICASSP). IEEE, 2023, pp. 1–5.
- [6] JM Padilla, EJ Berjano, J Saiz, L Facila, P Diaz, and S Merce, “Assessment of relationships between blood pressure, pulse wave velocity and digital volume pulse,” in 2006 Computers in Cardiology. IEEE, 2006, pp. 893–896.
- [7] L Wang, Emma Pickwell-MacPherson, YP Liang, and Yuan Ting Zhang, “Noninvasive cardiac output estimation using a novel photoplethysmogram index,” in 2009 annual international conference of the IEEE engineering in medicine and biology society. IEEE, 2009, pp. 1746–1749.
- [8] Mohammad Kachuee, Mohammad Mahdi Kiani, Hoda Mohammadzade, and Mahdi Shabany, “Cuffless blood pressure estimation algorithms for continuous health-care monitoring,” IEEE Transactions on Biomedical Engineering, vol. 64, no. 4, pp. 859–869, 2016.
- [9] Clémentine Aguet, João Jorge, Jérôme Van Zaen, Martin Proença, Guillaume Bonnier, Pascal Frossard, and Mathieu Lemay, “Blood pressure monitoring during anesthesia induction using ppg morphology features and machine learning,” Plos one, vol. 18, no. 2, pp. e0279419, 2023.
- [10] Yongbo Liang, Zhencheng Chen, Guiyong Liu, and Mohamed Elgendi, “A new, short-recorded photoplethysmogram dataset for blood pressure monitoring in china,” Scientific data, vol. 5, no. 1, pp. 1–7, 2018.
- [11] Hojjat Salehinejad, Sharan Sankar, Joseph Barfett, Errol Colak, and Shahrokh Valaee, “Recent advances in recurrent neural networks,” arXiv preprint arXiv:1801.01078, 2017.
- [12] Guillaume Weber-Boisvert, Benoit Gosselin, and Frida Sandberg, “Intensive care photoplethysmogram datasets and machine-learning for blood pressure estimation: Generalization not guarantied,” Frontiers in Physiology, vol. 14, pp. 317, 2023.
- [13] Thiago Bulhoes da Silva Costa, Felipe Meneguitti Dias, Diego Armando Cardona Cardenas, Marcelo Arruda Fiuza de Toledo, Daniel Mario de Lima, Jose Eduardo Krieger, and Marco Antonio Gutierrez, “Blood pressure estimation from photoplethysmography by considering intra-and inter-subject variabilities: guidelines for a fair assessment,” 2022.
- [14] Suril Mehta, Nipun Kwatra, Mohit Jain, and Daniel McDuff, “” can’t take the pressure?”: Examining the challenges of blood pressure estimation via pulse wave analysis,” arXiv preprint arXiv:2304.14916, 2023.
- [15] Fabian Schrumpf, Patrick Frenzel, Christoph Aust, Georg Osterhoff, and Mirco Fuchs, “Assessment of deep learning based blood pressure prediction from ppg and rppg signals,” in Proceedings of the IEEE/CVF Conference on Computer Vision and Pattern Recognition, 2021, pp. 3820–3830.
- [16] Angus Dempster, Daniel F Schmidt, and Geoffrey I Webb, “Minirocket: A very fast (almost) deterministic transform for time series classification,” in Proceedings of the 27th ACM SIGKDD conference on knowledge discovery & data mining, 2021, pp. 248–257.
- [17] Hojjat Salehinejad, Yang Wang, Yuanhao Yu, Tang Jin, and Shahrokh Valaee, “S-rocket: Selective random convolution kernels for time series classification,” arXiv preprint arXiv:2203.03445, 2022.
- [18] Christopher Lundy and John M O’Toole, “Random convolution kernels with multi-scale decomposition for preterm eeg inter-burst detection,” in 2021 29th European Signal Processing Conference (EUSIPCO). IEEE, 2021, pp. 1182–1186.
- [19] Hojjat Salehinejad and Shahrokh Valaee, “Litehar: lightweight human activity recognition from wifi signals with random convolution kernels,” in ICASSP 2022-2022 IEEE International Conference on Acoustics, Speech and Signal Processing (ICASSP). IEEE, 2022, pp. 4068–4072.
- [20] Hojjat Salehinejad, Navid Hasanzadeh, Radomir Djogo, and Shahrokh Valaee, “Joint human orientation-activity recognition using wifi signals for human-machine interaction,” in ICASSP 2023-2023 IEEE International Conference on Acoustics, Speech and Signal Processing (ICASSP). IEEE, 2023, pp. 1–5.
- [21] Giuseppe Mancia, Robert Fagard, Krzysztof Narkiewicz, Josep Redon, Alberto Zanchetti, Michael Böhm, Thierry Christiaens, Renata Cifkova, Guy De Backer, Anna Dominiczak, et al., “2013 esh/esc practice guidelines for the management of arterial hypertension: Esh-esc the task force for the management of arterial hypertension of the european society of hypertension (esh) and of the european society of cardiology (esc),” Blood pressure, vol. 23, no. 1, pp. 3–16, 2014.
- [22] Felix Scholkmann, Jens Boss, and Martin Wolf, “An efficient algorithm for automatic peak detection in noisy periodic and quasi-periodic signals,” Algorithms, vol. 5, no. 4, pp. 588–603, 2012.
- [23] Navid Hasanzadeh, Mohammad Mahdi Ahmadi, and Hoda Mohammadzade, “Blood pressure estimation using photoplethysmogram signal and its morphological features,” IEEE Sensors Journal, vol. 20, no. 8, pp. 4300–4310, 2019.
- [24] Liang-Hung Wang, Kun-Kun Sun, Chao-Xin Xie, Ming-Hui Fan, Patricia Angela R Abu, and Pao-Cheng Huang, “Cuffless blood pressure estimation using dual physiological signal and its morphological features,” IEEE Sensors Journal, 2023.
- [25] Kaiming He, Xiangyu Zhang, Shaoqing Ren, and Jian Sun, “Deep residual learning for image recognition,” in Proceedings of the IEEE conference on computer vision and pattern recognition, 2016, pp. 770–778.