Ultracool Dwarfs Observed with the Spitzer Infrared Spectrograph: Equatorial Latitudes in L Dwarf Atmospheres are Cloudier
Abstract
We report direct observational evidence for a latitudinal dependence of dust cloud opacity in ultracool dwarfs, indicating that equatorial latitudes are cloudier than polar latitudes. These results are based on a strong positive correlation between the viewing geometry and the mid-infrared silicate absorption strength in mid-L dwarfs using mid-infrared spectra from the Spitzer Space Telescope and spin axis inclination measurements from available information in the literature. We confirmed that the infrared color anomalies of L dwarfs positively correlate with dust cloud opacity and viewing geometry, where redder objects are inclined equator-on and exhibit more opaque dust clouds while dwarfs viewed at higher latitudes and with more transparent clouds are bluer. These results show the relevance of viewing geometry to explain the appearance of brown dwarfs and provide insight into the spectral diversity observed in substellar and planetary atmospheres. We also find a hint that dust clouds at similar latitudes may have higher opacity in low-surface gravity dwarfs than in higher-gravity objects.
1 Introduction
At temperatures K the atmospheres of substellar objects are sufficiently cool to form clouds made of refractory oxides, silicates, and iron (Lunine et al., 1986; Fegley & Lodders, 1996; Tsuji et al., 1996). Silicate clouds are among the most prominent in the 2000–1000 K temperature range (e.g.; Burrows et al., 1997; Ackerman & Marley, 2001), roughly corresponding to effective temperatures of early-L to early-T dwarfs (Filippazzo et al., 2015). Dust clouds play a critical role in shaping the emergent spectra of substellar atmospheres and, thus, understanding their effects is crucial to learn about the physics and chemistry of these atmospheres (e.g.; Knapp et al., 2004; Burgasser et al., 2008; Faherty et al., 2016).
The most easily observable spectroscopic feature that directly probes silicate clouds in ultracool (spectral types later than M7) atmospheres is a mid-infrared absorption between 9 and 13 m (e.g.; Cushing et al., 2006; Suárez & Metchev, 2022). Prior to the James Webb Space Telescope (JWST), mid-infrared spectra of ultra-cool dwarfs were available only from the Infrared Spectrograph (IRS; Houck et al., 2004) on the Spitzer Space Telescope (Werner et al., 2004). This allowed the first detection of the 10 m silicate absorption in an L dwarf atmosphere (Roellig et al., 2004) followed by five more candidate or bonafide detections (Cushing et al., 2006; Looper et al., 2008). Recently, Suárez & Metchev (2022) reprocessed all Spitzer IRS spectra of ultracool dwarfs (late-M to T dwarfs) and presented dozens of spectroscopic silicate absorption detections in L dwarfs. Later and cooler objects could also exhibit silicate absorption. Vos et al. (2023) inferred silicate clouds in two early-T dwarfs, similar to the clouds inferred by Burningham et al. (2021) for an L dwarf with a strong silicate absorption.
Analyses of the mid-infrared silicate absorption have revealed that dust clouds in L-type atmospheres: comprise a combination of 1 m-sized amorphous silicate (enstatite, forsterite, pyroxene, and/or quartz) and iron grains (Cushing et al., 2008; Burningham et al., 2021; Luna & Morley, 2021; Suárez & Metchev, 2023; Vos et al., 2023), form, then thicken, and sediment out of the visible atmospheres in the 2000 K K range (Suárez & Metchev, 2022), are responsible for the color scatter (Cushing et al., 2006, 2008; Looper et al., 2008; Suárez & Metchev, 2022) and, most likely, for the observed variability due to cloud inhomogeneities (Burgasser et al., 2008; Suárez & Metchev, 2022), and exhibit gravity-dependent sedimentation properties, with dust clouds in low-gravity atmospheres dominated by heavier grains (Suárez & Metchev, 2023). For simplicity, we will refer to dust clouds in ultracool atmospheres as silicate clouds; however, as mentioned above, they could also include deeper iron layers (Burningham et al., 2021; Vos et al., 2023).
Dust cloud properties such as grain size, thickness, and patchiness—and effects attributed to these properties (e.g. variability amplitudes)—have been suggested to vary with latitude (e.g. Kirkpatrick et al., 2010). Vos et al. (2017, 2018, 2020) observationally found that the near-infrared color anomaly and the variability amplitude of ultracool dwarfs positively correlate with their viewing inclination, where objects inclined equator-on appear redder and display higher variability amplitudes than near pole-on dwarfs. These relations are predicted by the atmospheric circulation models of brown dwarf and planetary atmospheres in Tan & Showman (2021a, b). The results are consistent with a picture in which cloud opacity is higher near the equator and lower close to the poles. Here we confirm this scenario by directly analyzing the spectral signature of dust clouds.
Clouds are also an important component in the atmospheres of planets. They are common in the atmospheres of solar system’s planets (e.g. Atreya & Wong, 2005; Gao et al., 2021) and likely ubiquitous in extra-solar planet atmospheres (e.g.; Sing et al., 2016; Crossfield & Kreidberg, 2017; Lothringer et al., 2022). Similar to clouds in substellar atmospheres, clouds in the Jovian planets’ atmospheres appear to be more opaque close to the equator and more transparent near the poles (West et al., 2009; Zhang et al., 2013; Tollefson et al., 2019). These clouds influence most aspects of planetary atmospheres (e.g. radiation transport and atmospheric chemistry and dynamics) and, therefore, determine their emergent spectra (e.g.; Currie et al., 2011; Marley et al., 2013; Barstow et al., 2017). A better understanding of the distribution of clouds in planetary and substellar atmospheres and their effects will allow us to explain the spectral diversity observed in brown dwarf and giant (extra-solar) planet atmospheres (e.g.; Looper et al., 2008; Burgasser et al., 2008; Faherty et al., 2016; Liu et al., 2016).
We present in this study a strong and significant correlation between the opacity of dust clouds and their latitude in substellar atmospheres. In Section 2 we describe the mid-infrared Spitzer spectra and the inclination measurements used in this work. Section 3 presents the relations between silicate cloud opacity, viewing inclination, and infrared color anomaly. We discuss these results in Section 4 and conclude in Section 5.
2 Data
To investigate how the opacity of silicate clouds may vary with latitude in a substellar atmosphere, we require information about viewing inclination angle and silicate cloud opacity. This information can inform how the spectral properties of brown dwarfs such as near-infrared colors relate to dust cloud properties or viewing geometry.
2.1 Mid-infrared Spectroscopic Silicate Absorption
In order to evaluate the silicate absorption feature, we use the Spitzer IRS mid-infrared spectroscopic sample of ultracool dwarfs in Suárez & Metchev (2022). We selected dwarfs with optical spectral types between L3 and L7 as they show a large diversity in silicate absorption strengths (see Figure 2a in Suárez & Metchev 2023). We exclude L8 and later dwarfs since they may exhibit 7–9 m methane absorption that affects the silicate absorption (Suárez & Metchev, 2022).
We measured the strength of the silicate absorption following the silicate index definition implemented in Suárez & Metchev (2022) and improved in Suárez & Metchev (2023, see Figure 1 in that paper). Briefly, the index corresponds to the ratio of an interpolated continuum (using the 7.2–7.7 m and 13.0–14.0 m-wide windows) to the average flux at the center of the absorption (9.0–9.6 m region).
The sample of L3–L7 dwarfs with Spitzer IRS spectra includes 39 objects with silicate index values roughly homogeneously distributed between 0.8 and 1.5. Silicate index values can be smaller than unity because the 7.2–7.7 m continuum region contains residual water absorption in all L dwarfs, and methane absorption in late-L dwarfs, either of which leads to an underestimation of the actual continuum. Regardless, a small (1.0) silicate index value means a weak or absent silicate absorption while a large (1.2) index value indicates a strong absorption.
2.2 Viewing Geometry
The viewing inclination angle (i) of an object can be determined from a combination of the following three parameters: the projected rotational velocity (, where is the equatorial rotation velocity), obtained from the rotational broadening of spectral lines, the rotation period (), calculated from photometric variability, and the radius (), commonly obtained from spectral energy distribution (SED) fits combined with evolutionary models. Thus, the inclination angle is given by the ratio between the projected rotational velocity and the equatorial rotation velocity, as follows:
| (1) |
We reviewed the literature for inclination measurements provided for dwarfs in our sample. As a starting point, we considered the viewing inclination angles in Table 3 by Vos et al. (2020), who combined their own spectroscopy-based determinations with data from the literature. The Vos et al. compilation includes all brown dwarfs with measured variability at the time of publication. Twenty-three out of the 79 variable objects have inclination measurements in the compilation, most (20) of which are L dwarfs.
Nine of the 39 L3–L7 dwarfs with Spitzer IRS spectra have viewing angle measurements in Vos et al. (2020). In addition, we computed an inclination of deg for 0355+1133 using Equation 1 and the Monte Carlo analysis outlined in Vos et al. (2017, 2020), considering a rotation period of hr (Vos et al., 2022), km s-1 (Blake et al., 2010), and radius of (Vos et al., 2022).
Since variability is a necessary property for inclination measurements, it is possible that variability in the SED may have an effect of the estimated radius used in the inclination calculation. However, Suárez et al. (2021) investigate this possibility for the variable object HN Peg B, finding that this effect is negligible for the observed amplitudes, so we do not consider this effect in this work.
In Table 1 we list our final sample of 10 mid-L dwarfs with their optical and near-infrared spectral types, silicate indices, and inclination angles. An inclination of 90 deg means that the object is viewed equator-on and a value of 0 deg corresponds to a pole-on dwarf.
2.3 Infrared Colors
To explore how infrared colors of brown dwarfs may depend on the opacity of silicate clouds and their latitude in an atmosphere, we use near-infrared magnitudes from 2MASS (Cutri et al., 2003) and mid-infrared photometry from WISE (Cutri et al., 2013). All ten mid-L dwarfs in our sample have 2MASS and WISE W1 and W2 magnitudes, listed in Table 2.
Before comparing the observed infrared colors of our sample to typical colors, we note that four (0355+1133, 05010010, 14253650, and 2244+2043) of the 10 selected mid-L dwarfs have spectroscopic classification (Table 1) indicative of low surface gravity and therefore youth (Cruz et al., 2009; Gagné et al., 2015; Faherty et al., 2016; Manjavacas et al., 2019; Bardalez Gagliuffi et al., 2019). Three (0355+1133, 14253650, and 2244+2043) of these low-gravity dwarfs are bonafide members of the 110–150 Myr-old (Luhman et al., 2005; Barenfeld et al., 2013) AB Doradus moving group (Liu et al., 2013; Gagné et al., 2015; Vos et al., 2018) and 05010010 is a probable member of the Columba or Carina moving groups (Gagné et al., 2015), which are coeval at 20–40 Myr (Torres et al., 2008). Conversely, the remaining six dwarfs with no spectroscopic signature of youth have 96% probability of being field objects, according to the BANYAN algorithm (Gagné et al., 2018).
We defined the color anomaly for each selected dwarf as the difference between its observed infrared color and the average color (Table 2) for its spectral type and surface gravity. For the four dwarfs with spectral and kinematic signatures of youth, we used the average colors of low-surface gravity L dwarfs in Faherty et al. (2016). Otherwise, we used average colors of field (non-low surface gravity, subdwarf, or young) L dwarfs from Faherty et al. (2016). Negative color anomaly values correspond to bluer than expected objects and positive values to redder than the average dwarfs.
3 RESULTS: Positive correlations between silicate absorption strength, viewing inclination, and infrared color anomaly
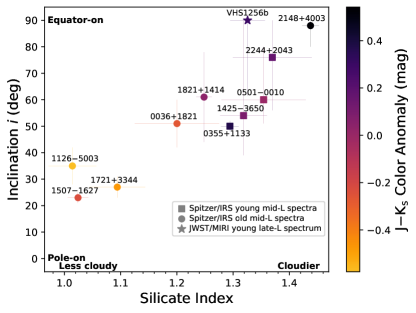
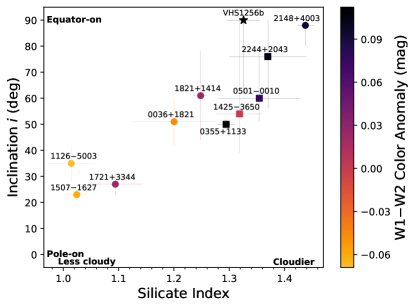
We compare the viewing inclination angles, the silicate absorption strengths, and the color anomalies for the 10 L3–L7 dwarfs with Spitzer IRS spectra in Figure 1. The auxiliary color axis represents the color anomaly of each object based on 2MASS (left panel) or WISE (right panel) photometry.
We observe a clear correlation between inclination and silicate index. Mid-L dwarfs with larger inclinations (viewed at lower latitudes) exhibit stronger silicate absorption, while mid-L dwarfs with lower inclinations (viewed at higher latitudes) have weaker or absent silicate absorption. The Pearson correlation coefficient is 0.9 with a -value of 0.02%, which is indicative of a strong, highly significant correlation (e.g.; Cohen, 1988).
Figure 1 also shows that both the 2MASS and WISE color anomalies positively correlate with inclination and silicate index: redder mid-L dwarfs have larger inclinations (more equator-on) and larger silicate indices than bluer objects. The Pearson correlation coefficients and -values indicate that the relations between the silicate index and the or W1W2 color anomalies are strong and significant ( and -value0.4%). Similarly, the Pearson statistic is indicative of a strong and significant ( and -value3%) correlation between the viewing inclination and the or W1W2 color anomalies. These correlations between the color anomaly and the inclination or the silicate index are in agreement with the relations in Vos et al. (2017) and Suárez & Metchev (2022), respectively.
4 Discussion
4.1 Latitudinal Dependence of Dust Cloud Opacity
Literature studies have investigated the dependence of the infrared color anomaly of brown dwarfs with both viewing geometry and dust cloud opacity. Vos et al. (2017) presented a positive correlation between the color anomaly and inclination of ultracool dwarfs. Suárez & Metchev (2022) found that color anomaly is positively correlated with the opacity of silicate clouds in L dwarf atmospheres. This study connects both correlations. We report here for the first time direct observational evidence for a latitudinal dependence of dust cloud opacity in ultracool atmospheres. The observed positive correlation between viewing inclination and silicate absorption strength (Figure 1) indicates that the integrated optical depth of silicate clouds in L dwarf atmospheres changes with latitude, such that clouds are more opaque near the equator and more transparent closer to the poles. This is likely due to thicker clouds or denser cloud coverage at low latitudes and thinner clouds or sparser cloud coverage at higher latitudes.
Our observed equator-to-pole cloud opacity dependence in brown dwarf atmospheres agrees with observations of cloudier equatorial latitudes compared to pole regions in the atmospheres of the solar system gas giant planets (West et al., 2009; Zhang et al., 2013; Tollefson et al., 2019). This is also consistent with the theoretical modeling for brown dwarf and planetary atmospheres by Tan & Showman (2021b), who predict that the vertical extent of dust clouds decreases from equator to pole due to the stronger effect of rotation at higher latitudes.
4.2 The Appearance of Ultracool Atmospheres is Influenced by Viewing Geometry
The positive correlations between color anomaly and both inclination and silicate index (Figure 1) show that L dwarfs viewed equator-on appear cloudier and redder than similar spectral type dwarfs viewed pole-on. The color differences are more pronounced in the 2MASS near-infrared colors compared to the WISE W1W2 mid-infrared colors. Figure 1 shows that equator-on dwarfs can be redder than near pole-on dwarfs by more than a magnitude in and only about a fifth of magnitude in W1W2. Such a significantly stronger color difference may be due to the fact that this color probes a larger (by a factor of three to four) pressure range than the W1W2 color (Burningham et al., 2021). These color differences are comparable to the color scatter observed in L dwarfs with the same subtype (e.g.; Cushing et al., 2008; Faherty et al., 2016).
Considering reported evidence that dust cloud properties are potentially responsible for various photometric phenomena in L-type atmospheres, such as a large color scatter (e.g.; Knapp et al., 2004; Cushing et al., 2008; Faherty et al., 2016; Suárez & Metchev, 2022), ubiquitous variability (e.g.; Burgasser et al., 2002; Marley et al., 2012; Radigan et al., 2014; Metchev et al., 2015; Suárez & Metchev, 2022; Vos et al., 2022), and a range of variability amplitudes (Vos et al., 2020), the correlation presented here between viewing inclination and silicate cloud opacity suggests that the appearance of brown dwarfs is strongly influenced by their viewing geometry. This provides new insight into the diversity of observed properties in brown dwarf and planetary atmospheres (e.g.; Faherty et al., 2009, 2016; Liu et al., 2016; Schneider et al., 2023).
The latitudinal dependence of dust cloud optical depth should also produce an equator-to-pole brightness temperature gradation of the photosphere. Lower cloud opacity at the poles would reveal deeper, hotter atmospheric layers, while greater cloud opacity at the equator would reveal cooler, lower-density upper layers. Such latitudinal temperature differences have been reported from observations of the Jovian planets (Ingersoll, 1990; Tollefson et al., 2019) and predicted with atmospheric dynamics models of brown dwarfs and giant planets by Showman & Kaspi (2013) and Tan & Showman (2021b).
The higher dust cloud opacity near equatorial regions might also explain the higher near-infrared variability amplitudes observed in red and near equator-on dwarfs by Vos et al. (2017, 2020). The atmospheric circulation models of Tan & Showman (2021b) predict that large-scale cloud structures increase in size towards the equator. The combination of greater cloud opacity, as inferred here, and larger cloud structures toward the equator could explain the larger-amplitude variability of objects seen at higher inclinations.
4.3 Extension of the Spitzer Results to the L/T Transition with JWST
Miles et al. (2023) presented the first JWST MIRI () spectrum of a substellar mass object showing the 10 m silicate absorption for the L-to-T transition planetary-mass companion VHS J125060.192125723.9b (VHS1256b). VHS1256b is a young object (14020 Myr; Dupuy et al., 2023) seen equator-on ( deg; Zhou et al., 2020), and is substantially redder than expected ( and W1W2 color anomalies of 0.294 mag and 0.196 mag, respectively). Based on the correlations in Figure 1, this object should exhibit strong silicate absorption. We confirmed this by measuring a high silicate index (1.330.03) after convolving its MIRI spectrum to the IRS resolution. Hence, VHS1256b is in good agreement with the inferred latitudinal dependence of dust cloud opacity in mid-L dwarfs, and extends the result to later-type objects (see star symbol in Figure 1).
We note, however, that for late-L objects such as VHS1256b (L8/L7 optical/near-infrared types; Gauza et al., 2015) the silicate index definition in Suárez & Metchev (2022, 2023) may no longer adequately represent the strength of silicate absorption. This is because the short-wavelength continuum window could be underestimated due to the onset of the 7.65 m methane absorption (Suárez & Metchev, 2022), causing an underestimation of the silicate index. We observed in Figure 11 of Miles et al. (2023) that it might be the case for the VHS1256b MIRI spectrum, where the 7.2–7.7 m silicate absorption continuum window appears depressed compared to the IRS spectrum of an earlier dwarf (L4.5; 2224-0158) with no evidence of methane. Although we show the position of VHS1256b in Figure 1, this object was not considered to evaluate the significance of the trends between inclination, silicate index, and near-infrared color anomaly in Section 3.
4.4 Similar Latitudes May Be Cloudier in Young Atmospheres
A closer inspection of Figure 1 suggests that dust cloud opacity may also depend on surface gravity. Three (0355+1133, 05010010, and 14253650) of the five dwarfs with inclinations 50–60 deg have both a systematically larger silicate index and low-surface gravity (Section 2.3; in Gagné et al. 2015 and Filippazzo et al. 2015), although the silicate indices for the five dwarfs are consistent within the uncertainties. The other two dwarfs (0036+1821 and 1821+1414) in this inclination range and with lower silicate indices have evidence of high-surface gravity (field gravity classification in Martin et al. 2017 and in Filippazzo et al. 2015) and are 99.9% probable field dwarfs (Section 2.3). This may suggest that dust clouds at similar latitudes are thicker or denser in low-surface gravity L dwarfs than in higher gravity objects with similar spectral types.
There is a low-surface gravity object (VHS1256b) and a high-gravity (2148+4003) dwarf both viewed close to equator-on which could also inform on the cloud opacity-surface gravity trend at equatorial latitudes. These objects apparently follow an opposite trend to the one discussed above, with the young object having a lower silicate index. Nevertheless, as we discussed in Section 4.3, the silicate index of VHS1256b may be underestimated due to the appearance of methane absorption at the short-wavelength continuum region as a consequence of its later (L8) spectral type. Additionally, being at the L/T spectral type transition, VHS1256b may be experiencing the sedimentation of silicate clouds and, therefore, exhibit less clouds in its mid-infrared photosphere compared to earlier type dwarfs viewed equator-on. Consequently, the VHS1256b silicate index is not directly comparable to the indices of L3–L7 dwarfs and likely is not representative of the surface gravity dependence of their cloudiness.
A higher cloud optical depth in younger L-type atmospheres, as suggested by the subsample of dwarfs with 50–60 deg inclinations, may be due to lower sedimentation efficiencies of dust clouds compared to the cloud settling in higher gravity atmospheres (e.g.; Ackerman & Marley, 2001; Stephens et al., 2009; Faherty et al., 2012, 2016; Suárez & Metchev, 2023). Such dustier atmospheres, if patchy, could explain the higher variability amplitudes observed in low-surface gravity dwarfs (Metchev et al., 2015; Vos et al., 2022) due to a higher contrast between cloudy and less cloudy regions, and the higher variability occurrence (Metchev et al., 2015; Vos et al., 2019, 2022) compared to those in higher gravity objects. Thus, variability amplitudes might be enhanced in cloudy young dwarf atmospheres, which is a similar effect to the maximized variability amplitudes in closer to equator-on dwarfs discussed in Section 4.2.
This tentative result about a cloud opacity difference between low and high-surface gravity dwarfs with a similar viewing geometry is encouraging for future JWST mid-infrared spectroscopic observations of young and old L dwarfs. Higher SNR and resolution mid-infrared L-type spectra will also enable robust modeling of the silicate absorption to further evaluate how cloud properties such as grain size, chemistry, and vertical extent may change with latitude.
5 Conclusions
We present a strong and significant positive correlation between the optical depth of silicate clouds in L dwarf atmospheres and their viewing inclinations using mid-infrared spectra from Spitzer IRS and spin axis inclination measurements. This represents the first direct observational evidence of a latitudinal dependence of integrated dust cloud opacity, with the equatorial regions appearing cloudier than the polar regions. This is consistent with what has been observed in the atmospheres of the Jovian planets (e.g.; Tollefson et al., 2019).
We also show that dust cloud opacity and viewing inclination are correlated with infrared color anomalies of L dwarfs. That is, objects viewed closer to equator-on and exhibiting stronger silicate absorption are redder than dwarfs viewed closer to pole-on and exhibiting lower cloud opacity, as reported before (Vos et al., 2017; Suárez & Metchev, 2022).
The results suggest that the observed spectral diversity in brown dwarfs is at least partially explained by their viewing geometry.
There is also a hint that dust clouds at similar latitudes may be more opaque in young atmospheres than in old atmospheres. This is encouraging for JWST mid-infrared spectroscopic observations of low- and high-gravity dwarfs.
Acknowledgements
G. S. and J. K. F. acknowledge support from NSF award #2009177. J. M. V. acknowledges support from a Royal Society - Science Foundation Ireland University Research Fellowship (URF1221932). S. M. acknowledges support from the Canadian Space Agency under the Flights and Fieldwork for the Advancement of Science and Technology program (21FAUWOB12).
Spitzer
| 2MASS Name | Short Name | SpT | Ref. | SpT | Ref. | Silicate Indexa | Inclination | Ref. |
|---|---|---|---|---|---|---|---|---|
| (deg) | ||||||||
| J003616171821104 | 00361821 | L3.5 | Kirk00 | L4 | Knap04 | 1.200.08 | 519 | Vos17 |
| J035523371133437b | 03551133 | L5 | Cruz09 | L4 | Bard19 | 1.290.02 | 502 | This study |
| J050124060010452b | 05010010 | L4 | Cruz09 | L4 | Gagn15 | 1.350.08 | 60 | Vos20 |
| J112639915003550 | 11265003 | L4.5 | Burg08 | L6.5p | Burg08 | 1.010.04 | 357 | Vos20 |
| J142527983650229b | 14253650 | L3 | Reid08 | L4 | Gagn15 | 1.320.04 | 54 | Vos20 |
| J150747691627386 | 15071627 | L5 | Kirk00 | L5.5 | Knap04 | 1.020.02 | 232 | Vos17 |
| J172103903344160 | 17213344 | L3 | Cruz03 | L5 | Burg08 | 1.090.05 | 274 | Vos17 |
| J182128151414010 | 18211414 | L4.5 | Loop08 | L5p | Kirk10 | 1.250.01 | 6117 | Vos17 |
| J214816334003594 | 21484003 | L6 | Loop08 | L6.5p | Kirk10 | 1.440.01 | 88 | Vos17 |
| J224431672043433b | 22442043 | L6.5 | Kirk08 | L6–L8 | Gagn15 | 1.370.07 | 76 | Vos18 |
aSilicate index measurements using Spitzer/IRS spectra (Suárez & Metchev, 2022).
bObjects with spectral signatures of low-surface gravity ( classification; Cruz et al., 2009) and kinematic memberships to known young moving groups (Section 2.3).
References. Bard19: Bardalez Gagliuffi et al. (2019), Burg08: Burgasser et al. (2008), Cruz09: Cruz et al. (2009), Cruz03: Cruz et al. (2003), Gagn15: Gagné et al. (2015), Gauz15: Gauza et al. (2015), Kirk00: Kirkpatrick et al. (2000), Kirk08: Kirkpatrick et al. (2008), Kirk10: Kirkpatrick et al. (2010), Knap04: Knapp et al. (2004), Loop08: Looper et al. (2008), Reid08: Reid et al. (2008), Vos17: Vos et al. (2017), Vos18: Vos et al. (2018), Vos20: Vos et al. (2020), Zhou20: Zhou et al. (2020).
| Short Name | W1 | W2 | (W1W2) | ||||
|---|---|---|---|---|---|---|---|
| (mag) | (mag) | (mag) | (mag) | (mag) | (mag) | (mag) | |
| 00361821 | 12.4660.027 | 11.5880.030 | 11.0580.021 | 10.5160.024 | 10.2370.020 | 1.675 | 0.325 |
| 03551133 | 14.0500.024 | 12.5300.031 | 11.5260.021 | 10.5280.023 | 9.9430.021 | 2.153 | 0.473 |
| 05010010 | 14.9820.038 | 13.7130.034 | 12.9630.035 | 12.0500.024 | 11.5180.022 | 2.020 | 0.455 |
| 11265003 | 13.9970.032 | 13.2840.036 | 12.8290.029 | 12.2180.024 | 11.9420.022 | 1.745 | 0.345 |
| 14253650 | 13.7470.028 | 12.5750.022 | 11.8050.027 | 10.9980.022 | 10.5760.020 | 1.850 | 0.421 |
| 15071627 | 12.8300.027 | 11.8950.024 | 11.3120.026 | 10.6670.023 | 10.3780.022 | 1.750 | 0.350 |
| 17213344 | 13.6250.023 | 12.9520.026 | 12.4890.020 | 11.9330.024 | 11.6010.022 | 1.610 | 0.310 |
| 18211414 | 13.4310.024 | 12.3960.019 | 11.6500.021 | 10.8450.029 | 10.4780.021 | 1.745 | 0.345 |
| 21484003 | 14.1470.029 | 12.7830.030 | 11.7650.023 | 10.7390.023 | 10.2350.021 | 1.840 | 0.410 |
| 22442043 | 16.4760.140 | 14.9990.066 | 14.0220.073 | 12.7770.024 | 12.1080.024 | 2.290 | 0.564 |
aAverage colors for the spectral type and (low or high) surface gravity of each object according to Faherty et al. (2016).
References
- Ackerman & Marley (2001) Ackerman, A. S., & Marley, M. S. 2001, ApJ, 556, 872, doi: 10.1086/321540
- Atreya & Wong (2005) Atreya, S. K., & Wong, A.-S. 2005, Space Sci. Rev., 116, 121, doi: 10.1007/s11214-005-1951-5
- Bardalez Gagliuffi et al. (2019) Bardalez Gagliuffi, D. C., Burgasser, A. J., Schmidt, S. J., et al. 2019, ApJ, 883, 205, doi: 10.3847/1538-4357/ab253d
- Barenfeld et al. (2013) Barenfeld, S. A., Bubar, E. J., Mamajek, E. E., & Young, P. A. 2013, ApJ, 766, 6, doi: 10.1088/0004-637X/766/1/6
- Barstow et al. (2017) Barstow, J. K., Aigrain, S., Irwin, P. G. J., & Sing, D. K. 2017, ApJ, 834, 50, doi: 10.3847/1538-4357/834/1/50
- Blake et al. (2010) Blake, C. H., Charbonneau, D., & White, R. J. 2010, ApJ, 723, 684, doi: 10.1088/0004-637X/723/1/684
- Burgasser et al. (2008) Burgasser, A. J., Looper, D. L., Kirkpatrick, J. D., Cruz, K. L., & Swift, B. J. 2008, ApJ, 674, 451, doi: 10.1086/524726
- Burgasser et al. (2002) Burgasser, A. J., Kirkpatrick, J. D., Brown, M. E., et al. 2002, ApJ, 564, 421, doi: 10.1086/324033
- Burningham et al. (2021) Burningham, B., Faherty, J. K., Gonzales, E. C., et al. 2021, MNRAS, 506, 1944, doi: 10.1093/mnras/stab1361
- Burrows et al. (1997) Burrows, A., Marley, M., Hubbard, W. B., et al. 1997, ApJ, 491, 856, doi: 10.1086/305002
- Cohen (1988) Cohen, J. 1988, Statistical Power Analysis for the Behavioral Sciences (Hillsdale, NJ: L. Erlbaum Associates)
- Crossfield & Kreidberg (2017) Crossfield, I. J. M., & Kreidberg, L. 2017, AJ, 154, 261, doi: 10.3847/1538-3881/aa9279
- Cruz et al. (2009) Cruz, K. L., Kirkpatrick, J. D., & Burgasser, A. J. 2009, AJ, 137, 3345, doi: 10.1088/0004-6256/137/2/3345
- Cruz et al. (2003) Cruz, K. L., Reid, I. N., Liebert, J., Kirkpatrick, J. D., & Lowrance, P. J. 2003, AJ, 126, 2421, doi: 10.1086/378607
- Currie et al. (2011) Currie, T., Burrows, A., Itoh, Y., et al. 2011, ApJ, 729, 128, doi: 10.1088/0004-637X/729/2/128
- Cushing et al. (2006) Cushing, M. C., Roellig, T. L., Marley, M. S., et al. 2006, ApJ, 648, 614, doi: 10.1086/505637
- Cushing et al. (2008) Cushing, M. C., Marley, M. S., Saumon, D., et al. 2008, ApJ, 678, 1372, doi: 10.1086/526489
- Cutri et al. (2003) Cutri, R. M., Skrutskie, M. F., van Dyk, S., et al. 2003, 2MASS All Sky Catalog of point sources.
- Cutri et al. (2013) Cutri, R. M., Wright, E. L., Conrow, T., et al. 2013, yCat, 2328, 0
- Dupuy et al. (2023) Dupuy, T. J., Liu, M. C., Evans, E. L., et al. 2023, MNRAS, 519, 1688, doi: 10.1093/mnras/stac3557
- Faherty et al. (2009) Faherty, J. K., Burgasser, A. J., Cruz, K. L., et al. 2009, AJ, 137, 1, doi: 10.1088/0004-6256/137/1/1
- Faherty et al. (2012) Faherty, J. K., Burgasser, A. J., Walter, F. M., et al. 2012, ApJ, 752, 56, doi: 10.1088/0004-637X/752/1/56
- Faherty et al. (2016) Faherty, J. K., Riedel, A. R., Cruz, K. L., et al. 2016, ApJS, 225, 10, doi: 10.3847/0067-0049/225/1/10
- Fegley & Lodders (1996) Fegley, Bruce, J., & Lodders, K. 1996, ApJ, 472, L37, doi: 10.1086/310356
- Filippazzo et al. (2015) Filippazzo, J. C., Rice, E. L., Faherty, J., et al. 2015, ApJ, 810, 158, doi: 10.1088/0004-637X/810/2/158
- Gagné et al. (2015) Gagné, J., Faherty, J. K., Cruz, K. L., et al. 2015, ApJS, 219, 33, doi: 10.1088/0067-0049/219/2/33
- Gagné et al. (2018) Gagné, J., Mamajek, E. E., Malo, L., et al. 2018, ApJ, 856, 23, doi: 10.3847/1538-4357/aaae09
- Gao et al. (2021) Gao, P., Wakeford, H. R., Moran, S. E., & Parmentier, V. 2021, Journal of Geophysical Research (Planets), 126, e06655, doi: 10.1029/2020JE006655
- Gauza et al. (2015) Gauza, B., Béjar, V. J. S., Pérez-Garrido, A., et al. 2015, ApJ, 804, 96, doi: 10.1088/0004-637X/804/2/96
- Houck et al. (2004) Houck, J. R., Roellig, T. L., van Cleve, J., et al. 2004, ApJS, 154, 18, doi: 10.1086/423134
- Ingersoll (1990) Ingersoll, A. P. 1990, Science, 248, 308, doi: 10.1126/science.248.4953.308
- Kirkpatrick et al. (2000) Kirkpatrick, J. D., Reid, I. N., Liebert, J., et al. 2000, AJ, 120, 447, doi: 10.1086/301427
- Kirkpatrick et al. (2008) Kirkpatrick, J. D., Cruz, K. L., Barman, T. S., et al. 2008, ApJ, 689, 1295, doi: 10.1086/592768
- Kirkpatrick et al. (2010) Kirkpatrick, J. D., Looper, D. L., Burgasser, A. J., et al. 2010, ApJS, 190, 100, doi: 10.1088/0067-0049/190/1/100
- Knapp et al. (2004) Knapp, G. R., Leggett, S. K., Fan, X., et al. 2004, AJ, 127, 3553, doi: 10.1086/420707
- Liu et al. (2013) Liu, M. C., Dupuy, T. J., & Allers, K. N. 2013, Astronomische Nachrichten, 334, 85, doi: 10.1002/asna.201211783
- Liu et al. (2016) —. 2016, ApJ, 833, 96, doi: 10.3847/1538-4357/833/1/96
- Looper et al. (2008) Looper, D. L., Kirkpatrick, J. D., Cutri, R. M., et al. 2008, ApJ, 686, 528, doi: 10.1086/591025
- Lothringer et al. (2022) Lothringer, J. D., Sing, D. K., Rustamkulov, Z., et al. 2022, Nature Astronomy, 604, 49, doi: 10.1038/s41586-022-04453-2
- Luhman et al. (2005) Luhman, K. L., Stauffer, J. R., & Mamajek, E. E. 2005, ApJ, 628, L69, doi: 10.1086/432617
- Luna & Morley (2021) Luna, J. L., & Morley, C. V. 2021, ApJ, 920, 146, doi: 10.3847/1538-4357/ac1865
- Lunine et al. (1986) Lunine, J. I., Hubbard, W. B., & Marley, M. S. 1986, ApJ, 310, 238, doi: 10.1086/164678
- Manjavacas et al. (2019) Manjavacas, E., Apai, D., Zhou, Y., et al. 2019, AJ, 157, 101, doi: 10.3847/1538-3881/aaf88f
- Marley et al. (2013) Marley, M. S., Ackerman, A. S., Cuzzi, J. N., & Kitzmann, D. 2013, in Comparative Climatology of Terrestrial Planets, ed. S. J. Mackwell, A. A. Simon-Miller, J. W. Harder, & M. A. Bullock, 367–392, doi: 10.2458/azu_uapress_9780816530595-ch015
- Marley et al. (2012) Marley, M. S., Saumon, D., Cushing, M., et al. 2012, ApJ, 754, 135, doi: 10.1088/0004-637X/754/2/135
- Martin et al. (2017) Martin, E. C., Mace, G. N., McLean, I. S., et al. 2017, ApJ, 838, 73, doi: 10.3847/1538-4357/aa6338
- Metchev et al. (2015) Metchev, S. A., Heinze, A., Apai, D., et al. 2015, ApJ, 799, 154, doi: 10.1088/0004-637X/799/2/154
- Miles et al. (2023) Miles, B. E., Biller, B. A., Patapis, P., et al. 2023, ApJ, 946, L6, doi: 10.3847/2041-8213/acb04a
- Radigan et al. (2014) Radigan, J., Lafrenière, D., Jayawardhana, R., & Artigau, E. 2014, ApJ, 793, 75, doi: 10.1088/0004-637X/793/2/75
- Reid et al. (2008) Reid, I. N., Cruz, K. L., Kirkpatrick, J. D., et al. 2008, AJ, 136, 1290, doi: 10.1088/0004-6256/136/3/1290
- Roellig et al. (2004) Roellig, T. L., Van Cleve, J. E., Sloan, G. C., et al. 2004, ApJS, 154, 418
- Schneider et al. (2023) Schneider, A. C., Burgasser, A. J., Bruursema, J., et al. 2023, ApJ, 943, L16, doi: 10.3847/2041-8213/acb0cd
- Showman & Kaspi (2013) Showman, A. P., & Kaspi, Y. 2013, ApJ, 776, 85, doi: 10.1088/0004-637X/776/2/85
- Sing et al. (2016) Sing, D. K., Fortney, J. J., Nikolov, N., et al. 2016, Nature, 529, 59, doi: 10.1038/nature16068
- Stephens et al. (2009) Stephens, D. C., Leggett, S. K., Cushing, M. C., et al. 2009, ApJ, 702, 154, doi: 10.1088/0004-637X/702/1/154
- Suárez & Metchev (2022) Suárez, G., & Metchev, S. 2022, MNRAS, 513, 5701, doi: 10.1093/mnras/stac1205
- Suárez & Metchev (2023) —. 2023, arXiv e-prints, arXiv:2306.01119, doi: 10.48550/arXiv.2306.01119
- Suárez et al. (2021) Suárez, G., Metchev, S., Leggett, S. K., Saumon, D., & Marley, M. S. 2021, ApJ, 920, 99, doi: 10.3847/1538-4357/ac1418
- Tan & Showman (2021a) Tan, X., & Showman, A. P. 2021a, MNRAS, 502, 678, doi: 10.1093/mnras/stab060
- Tan & Showman (2021b) —. 2021b, MNRAS, 502, 2198, doi: 10.1093/mnras/stab097
- Tollefson et al. (2019) Tollefson, J., de Pater, I., Luszcz-Cook, S., & DeBoer, D. 2019, AJ, 157, 251, doi: 10.3847/1538-3881/ab1fdf
- Torres et al. (2008) Torres, C. A. O., Quast, G. R., Melo, C. H. F., & Sterzik, M. F. 2008, in Handbook of Star Forming Regions, Volume II, ed. B. Reipurth, Vol. 5, 757
- Tsuji et al. (1996) Tsuji, T., Ohnaka, K., & Aoki, W. 1996, A&A, 305, L1
- Vos et al. (2017) Vos, J. M., Allers, K. N., & Biller, B. A. 2017, ApJ, 842, 78, doi: 10.3847/1538-4357/aa73cf
- Vos et al. (2018) Vos, J. M., Allers, K. N., Biller, B. A., et al. 2018, MNRAS, 474, 1041, doi: 10.1093/mnras/stx2752
- Vos et al. (2022) Vos, J. M., Faherty, J. K., Gagné, J., et al. 2022, ApJ, 924, 68, doi: 10.3847/1538-4357/ac4502
- Vos et al. (2019) Vos, J. M., Biller, B. A., Bonavita, M., et al. 2019, MNRAS, 483, 480, doi: 10.1093/mnras/sty3123
- Vos et al. (2020) Vos, J. M., Biller, B. A., Allers, K. N., et al. 2020, AJ, 160, 38, doi: 10.3847/1538-3881/ab9642
- Vos et al. (2023) Vos, J. M., Burningham, B., Faherty, J. K., et al. 2023, ApJ, 944, 138, doi: 10.3847/1538-4357/acab58
- Werner et al. (2004) Werner, M. W., Roellig, T. L., Low, F. J., et al. 2004, ApJS, 154, 1, doi: 10.1086/422992
- West et al. (2009) West, R. A., Baines, K. H., Karkoschka, E., & Sánchez-Lavega, A. 2009, in Saturn from Cassini-Huygens, ed. M. K. Dougherty, L. W. Esposito, & S. M. Krimigis, 161, doi: 10.1007/978-1-4020-9217-6_7
- Zhang et al. (2013) Zhang, X., West, R. A., Banfield, D., & Yung, Y. L. 2013, Icarus, 226, 159, doi: 10.1016/j.icarus.2013.05.020
- Zhou et al. (2020) Zhou, Y., Bowler, B. P., Morley, C. V., et al. 2020, AJ, 160, 77, doi: 10.3847/1538-3881/ab9e04