11email: {jilin.wang, michael.krumdick, hamima.halim, maxim.sokolov,
vadym, chris.tanner}@kensho.com 22institutetext: Meta, Cambridge, MA, 02140, USA
22email: tongbaojia@gmail.com 33institutetext: Google, Los Angeles, CA, 90291, USA
33email: delphine.vendryes@gmail.com
A Graphical Approach to Document Layout Analysis
Abstract
Document layout analysis (DLA) is the task of detecting the distinct, semantic content within a document and correctly classifying these items into an appropriate category (e.g., text, title, figure). DLA pipelines enable users to convert documents into structured machine-readable formats that can then be used for many useful downstream tasks. Most existing state-of-the-art (SOTA) DLA models represent documents as images, discarding the rich metadata available in electronically generated PDFs. Directly leveraging this metadata, we represent each PDF page as a structured graph and frame the DLA problem as a graph segmentation and classification problem. We introduce the Graph-based Layout Analysis Model (GLAM), a lightweight graph neural network competitive with SOTA models on two challenging DLA datasets - while being an order of magnitude smaller than existing models. In particular, the 4-million parameter GLAM model outperforms the leading 140M+ parameter computer vision-based model on 5 of the 11 classes on the DocLayNet dataset. A simple ensemble of these two models achieves a new state-of-the-art on DocLayNet, increasing mAP from 76.8 to 80.8. Overall, GLAM is over 5 times more efficient than SOTA models, making GLAM a favorable engineering choice for DLA tasks.
1 Introduction
Much of the world’s information is stored in PDF (Portable Document Format) documents; according to data collected by the Common Crawl***https://commoncrawl.github.io/cc-crawl-statistics/plots/mimetypes, PDF documents are the most-popular media type on the web other than HTML.
A standard PDF file contains a complete specification of the rendering of the document. All objects (e.g., texts, lines, figures) in the PDF file include their associated visual information, such as font information and location on the page. However, a PDF file does not always contain information about the relationships between those objects, which is critical for understanding the structure of the document. For example, all text is stored at the individual character level. Sentences from the characters and consequently paragraphs or titles formed by the sentences are not included in the metadata. Therefore, despite PDF files containing explicit, structured representations of their content, correctly structuring this content into human-interpretable categories remains a challenging problem and is the crux of Document Layout Analysis (DLA).
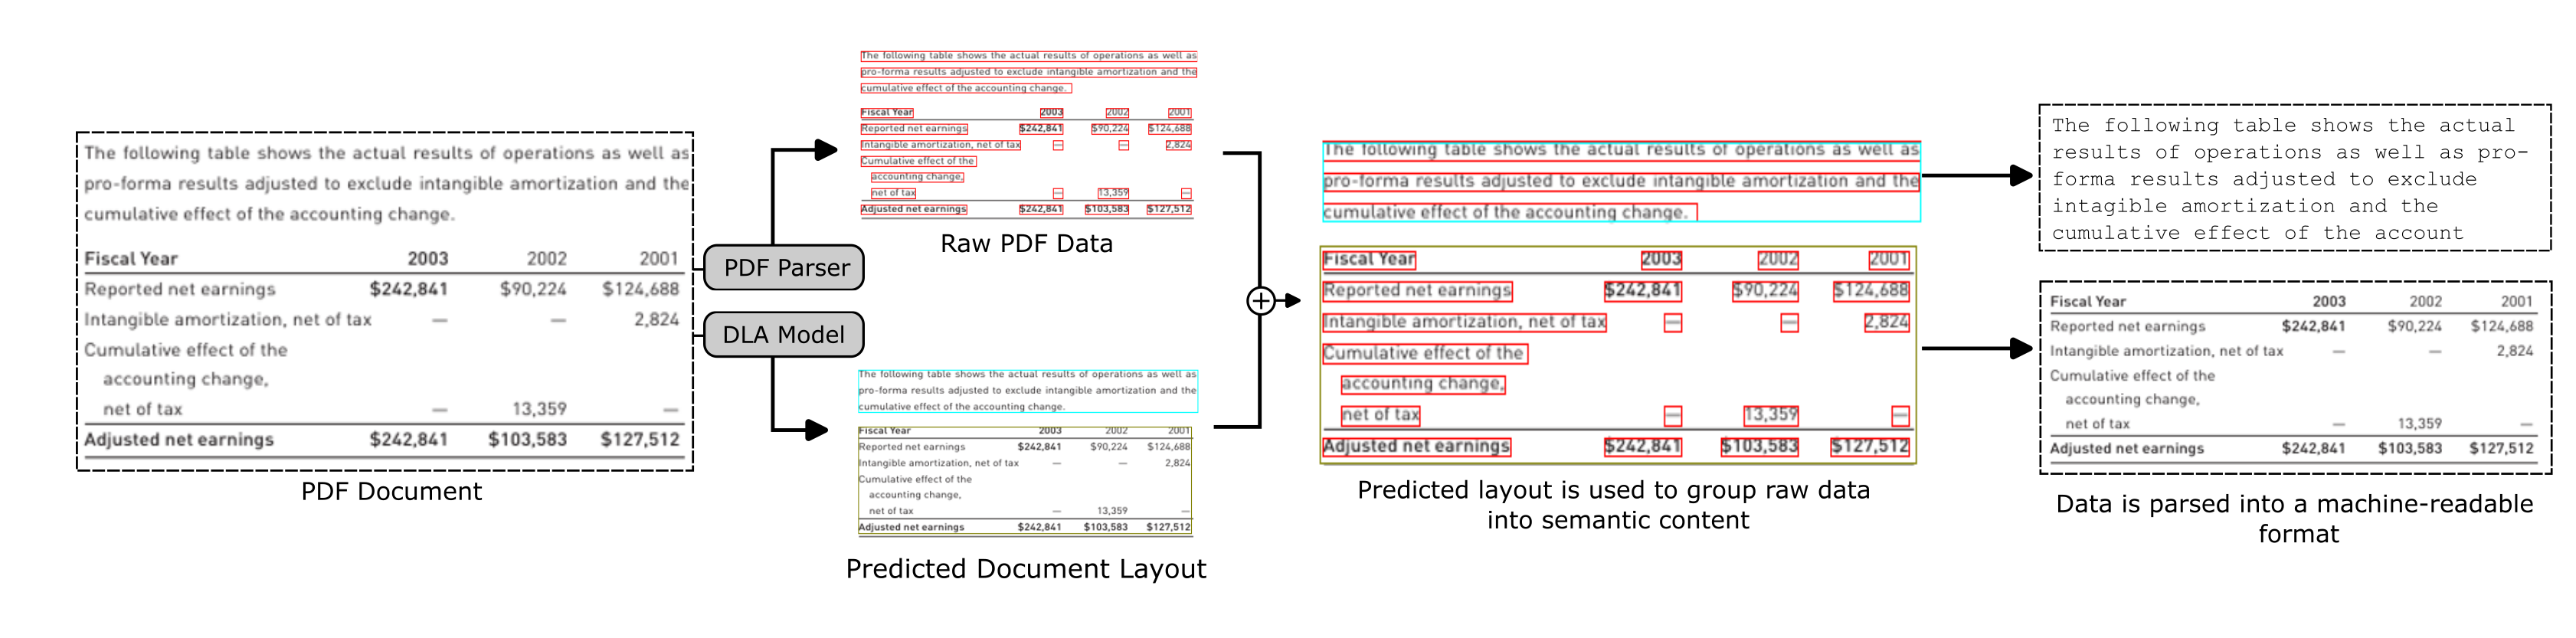
Existing approaches to PDF extraction typically consist of two main components — a PDF parser and DLA model — as depicted in Fig. 1 [32, 6]:
-
1.
PDF parser (e.g., PDF Miner): extracts the document’s underlying raw data, often doing so by producing fine-grained, pertinent contiguous blocks of information referred to as “objects” (e.g., a line of text). For a standard (non-scanned) PDF document, the PDF parser is able to generate information about each “object”: its location on the page, the raw content contained within it, and some metadata like font and color about how the object is displayed.
-
2.
DLA model: aims to group together objects that concern semantically similar content (e.g., a table, figure, paragraph of text), essentially turning an unordered collection of data into a coherent, structured document. The output is a collection of bounding boxes, each representing one of the semantic objects (e.g., a paragraph).
DLA models frequently take a computer vision-based approach [15, 21, 30]. These approaches rely on treating documents as images and ignoring much of the rich, underlying metadata.
Generally, PDF extraction can be evaluated by the quality of the DLA model’s segmentation predictions. The standard approach to evaluating the segmentation performance is to use the mean average precision (mAP) metric to assess the overlap between the predicted and ground-truth bounding boxes. Although this is standard practice, mAP is sensitive to the bounding boxes’ exact pixel values. Therefore, bounding box-level metrics are only proxies for measuring segmentation performance, and ultimately a user wishes to measure the performance of clustering objects to semantic segments. In this work, we approach the problem by modeling the document not as a collection of pixels but as a structured graphical representation of the output from a PDF parser.
Specifically, we frame the DLA task as a joint graph segmentation and node classification problem. Using this formulation, we develop and evaluate a graph neural network (GNN) based model – the Graph-based Layout Analysis Model (GLAM). Our model is able to achieve performance that is comparable in mAP to the current SOTA methods while being lightweight, easier to train, and faster at inference time.
Our primary contributions are :
-
1.
Propose a novel formulation of DLA, whereby we create a structured graphical representation of the parsed PDF data and treat it as a joint node classification problem and graph segmentation problem.
-
2.
Develop a novel Graph-based Layout Analysis Model (GLAM) for this problem formulation and evaluate it on two challenging DLA tasks: PubLayNet and DocLayNet.
-
3.
Demonstrate that by ensembling our model with an object detection model, we are able to set a new state-of-the-art (SOTA) on DocLayNet, increasing the mAP on this task from 76.8 to 80.8.
-
4.
Validate that GLAM is compact in size and fast at speed with a comparison against SOTA models, making it efficient and applicable in industrial use cases.
2 Related Work
2.1 Document Layout Analysis
As a field, document layout analysis (DLA) is mainly aimed toward enterprise use cases [3]. Businesses often need to process massive streams of documents to complete complex downstream tasks, such as information retrieval, table extraction, key-value extraction, etc. Early literature in this space focused on parsing-based solutions that would attempt to understand the document layout from bounding boxes and textual data parsed from born-digital files, leveraging features from the native file type [6].
2.2 Object Detection-Based Methods in VRDU
Recent work has focused on Visually Rich Document Understanding (VRDU), which models documents as images. Image-based object detection formulations of this problem have been particularly favorable and popular because of their generality; effectively any type of human-readable document can be converted into an image. Further, using a traditional, simple convolutional neural network (CNN) for feature extraction works well in generating representations of documents. Early iterations of LayoutLM and others [31, 11] all adopt this method.
Optionally, textual information can be captured by an optical character recognition (OCR) engine, avoiding the need to integrate text parsing engines for multiple document media types [8]. This OCR step, whose accuracy is critical for any model that uses textual information [20], could be fine-tuned on specific formats but will also introduce an upper bound of OCR accuracy.
Recently, there has been an emphasis on using large pre-trained document understanding models that leverage vast, unlabeled corpora, such as the IIT-CDIP test collection [19]. The Document Image Transformer (DiT) [21] model adopts a BERT-like pre-training step to train a visual backbone, which is further adapted to downstream tasks, including DLA. There have been additional efforts in creating pre-trained multi-modal models that leverage both the underlying document data and the visual representation. The LayoutLM series of models [30, 16] have been particularly successful. LayoutLMv3 [15] is pre-trained with Masked Language Modeling (MLM), Masked Image Modeling (MIM), and Word-Patch Alignment (WPA) training objectives. The LayoutLMv3 is integrated as a feature backbone in a Cascade R-CNN detector [5] with FPN [23] for downstream DLA tasks.
2.3 Graph Neural Networks in Document Understanding
Graphs and graphical representations have been used extensively in document understanding (DU) [4], especially toward the problem of table understanding. [17] extracted saliency maps using a CNN and then used a Conditional Random Field (CRF) model to reason about the relationships of the identified salient regions for table and chart detection. Holeček et al. [14] used the parsed data from a PDF to create a graphical representation of a document and then a GNN for table detection and extraction. Qasim et al. [26] uses a computer-vision feature augmented graph and a GNN for segmentation in order to perform table structure recognition.
Graphs have been used in DLA as well. Zhang et al. [33] use data from a PDF parser and a module based on graph neural networks to model the relationship of potential candidate layout outputs as part of their larger, multi-modal fusion architecture. A key component of any graph-based method is the formulation of the graphs. While the edges have diverse interpretations, the nodes will typically represent some logically contiguous region of the document. In image-based methods, this can be obtained by computer vision, as in [22], or by a more modular OCR task as leveraged by [24]. In contrast, Wei et al. [29] and this work parse the ground truth text boxes if focusing on digital-generated documents.
Typically, two nodes are connected by an edge if they satisfy certain spatial criteria (e.g., based on their vertical or horizontal locations). Riba et al. [27] notes that the resulting graph structures are similar to visibility graphs, which represent nodes as geometric blocks of space that are connected only if they have some vertical or horizontal overlap with no other nodes in between.
Most similar to our work are [22] and [10]. Li et al. [22] also frames DLA as a graph segmentation and node classification problem but uses computer vision in order to build its “primitive” nodes rather than using PDF parsing. Gemelli et al. [10] uses a GNN on a representation of the document similar to this work. However, they focus only on node classification for table extraction. Our model is able to perform the entire DLA task in an end-to-end fashion by modeling both node-level classifications and graph segmentation.
3 Methodology
3.1 Graph Generation
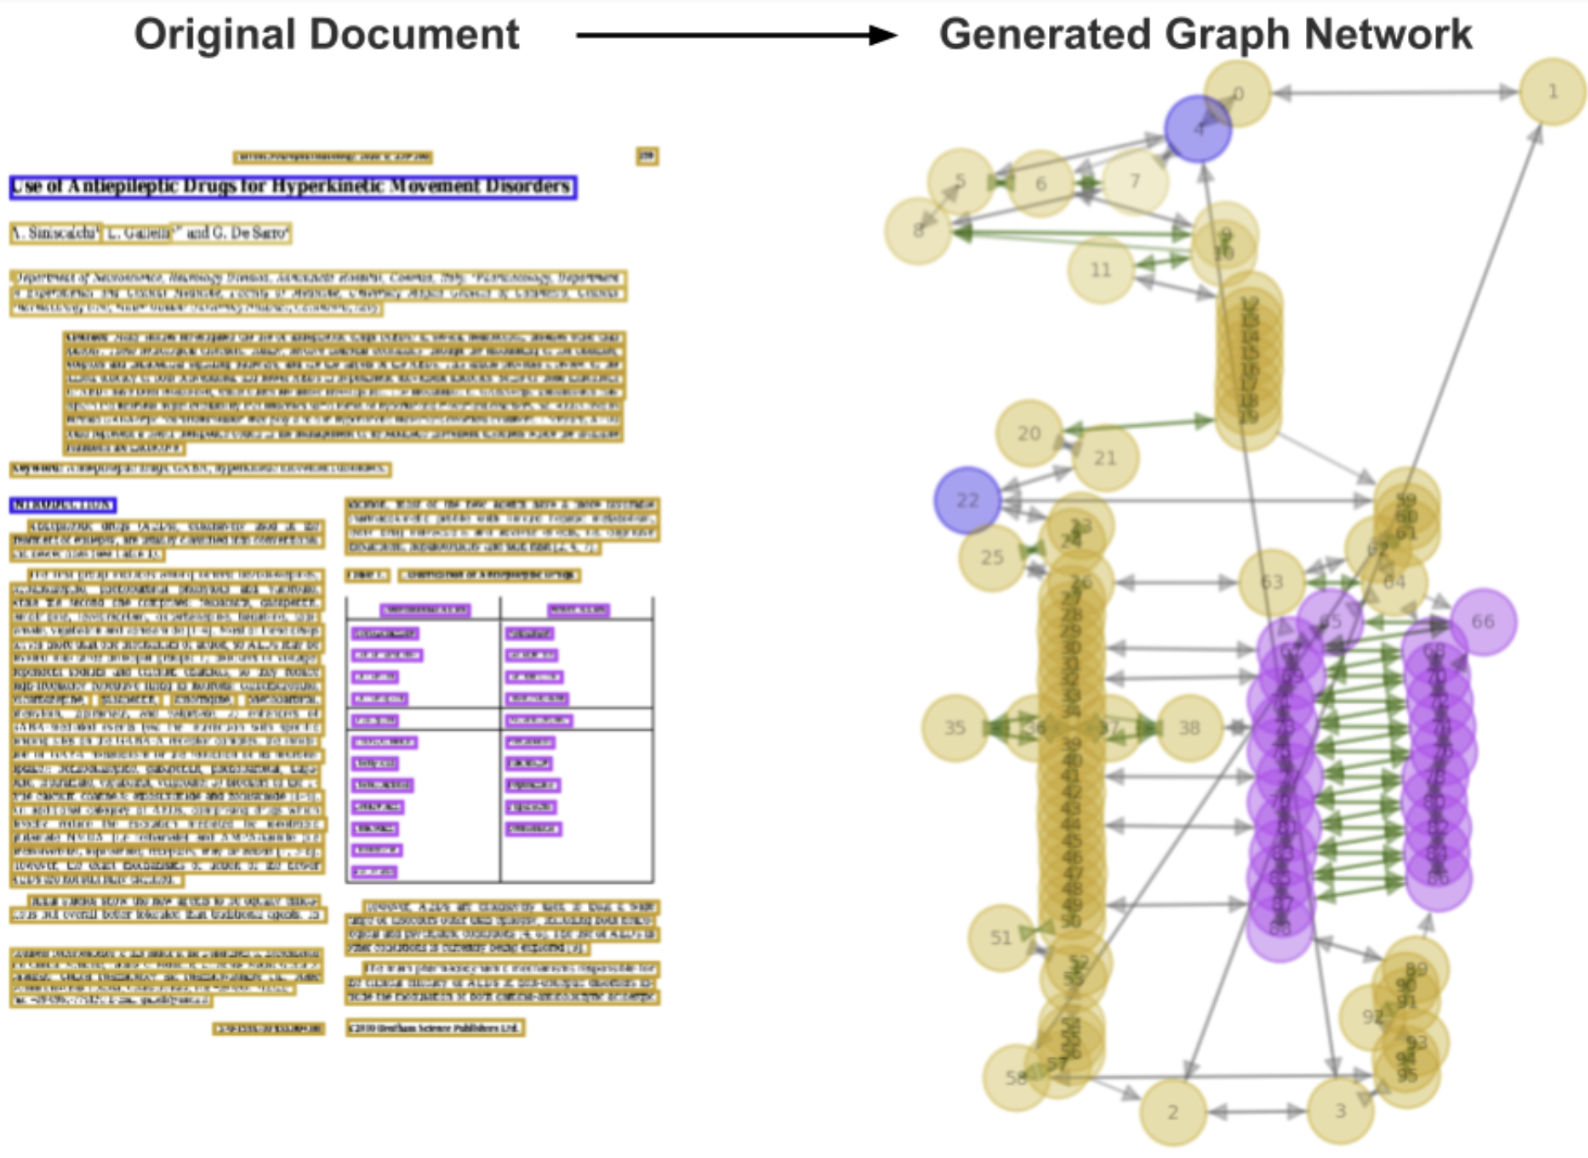
We use a PDF parser to extract all text boxes, each of which also includes 79 associated features, such as bounding box location, text length, the fraction of numerical characters, font type, font size, and other simple heuristics. Using this parsed metadata, we construct a vector representation for each individual box, which constitutes a node in our graph.
Bidirectional edges are established between nodes by finding each node’s nearest neighbor in each possible direction (up, down, left, and right). Additional edges are added to approximate the potential reading order of the underlying text boxes in the document (i.e. the heuristic order parsed from PDF documents – up to down, left to right). Each edge also has its own vector representation, which includes the edge direction and the distance between the two nodes that it connects. A visualization of the resulting graph can be seen in Fig. 2.
3.2 Graph-based Layout Analysis Model
There are two key parts to the Graph-based Layout Analysis Model (GLAM): a graph network and a computer vision feature extractor.
3.2.1 Graph Network
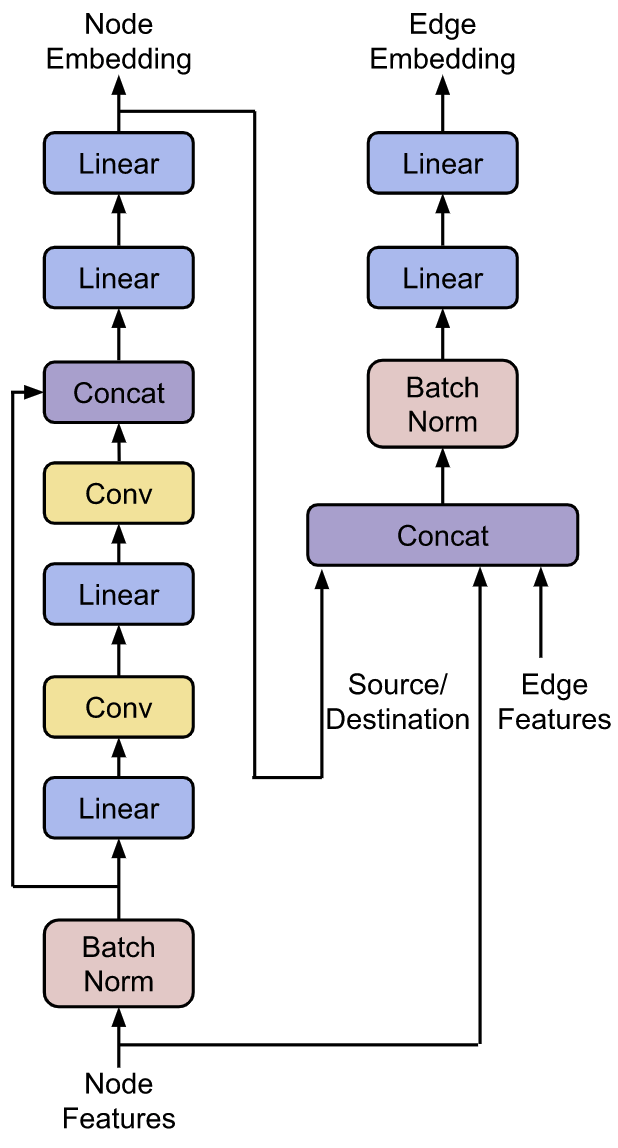
Our graph network model consists of a graph convolutional network (GCN) [18] and two classification heads – one for node classification and one for edge classification. The model structure is shown in Fig. 3. We apply batch normalization to the node features before inputting them into a series of linear and topology adaptive graph (TAG) convolutional [9] layers. We set the TAG’s first hidden layer to have 512 dimensions when training on PubLayNet, and we increase this to 1024 dimensions for the more complex DocLayNet dataset. As the GCN network gets deeper, we scale down the number of parameters in both linear and TAG convolutional layers by a factor of 2. We concatenate this output with the original normalized features and then apply a series of linear layers to create our node embeddings. A classification head then projects this into a distribution over the possible segment classes (e.g., title, figure, text). This model is very lightweight, totaling just over one million parameters.
To create the edge embeddings, we extract the relevant node embeddings and concatenate them with the original edge features. We batch-normalize this representation and then apply another two linear layers to generate the final edge embeddings.
The model is trained with a weighted, joint loss function Eq. 1 from the two classification tasks.
| (1) |
where and are a cross-entropy loss for node and edge classification, and the edge loss scale is applied to improve edge classification results for better segmentation.
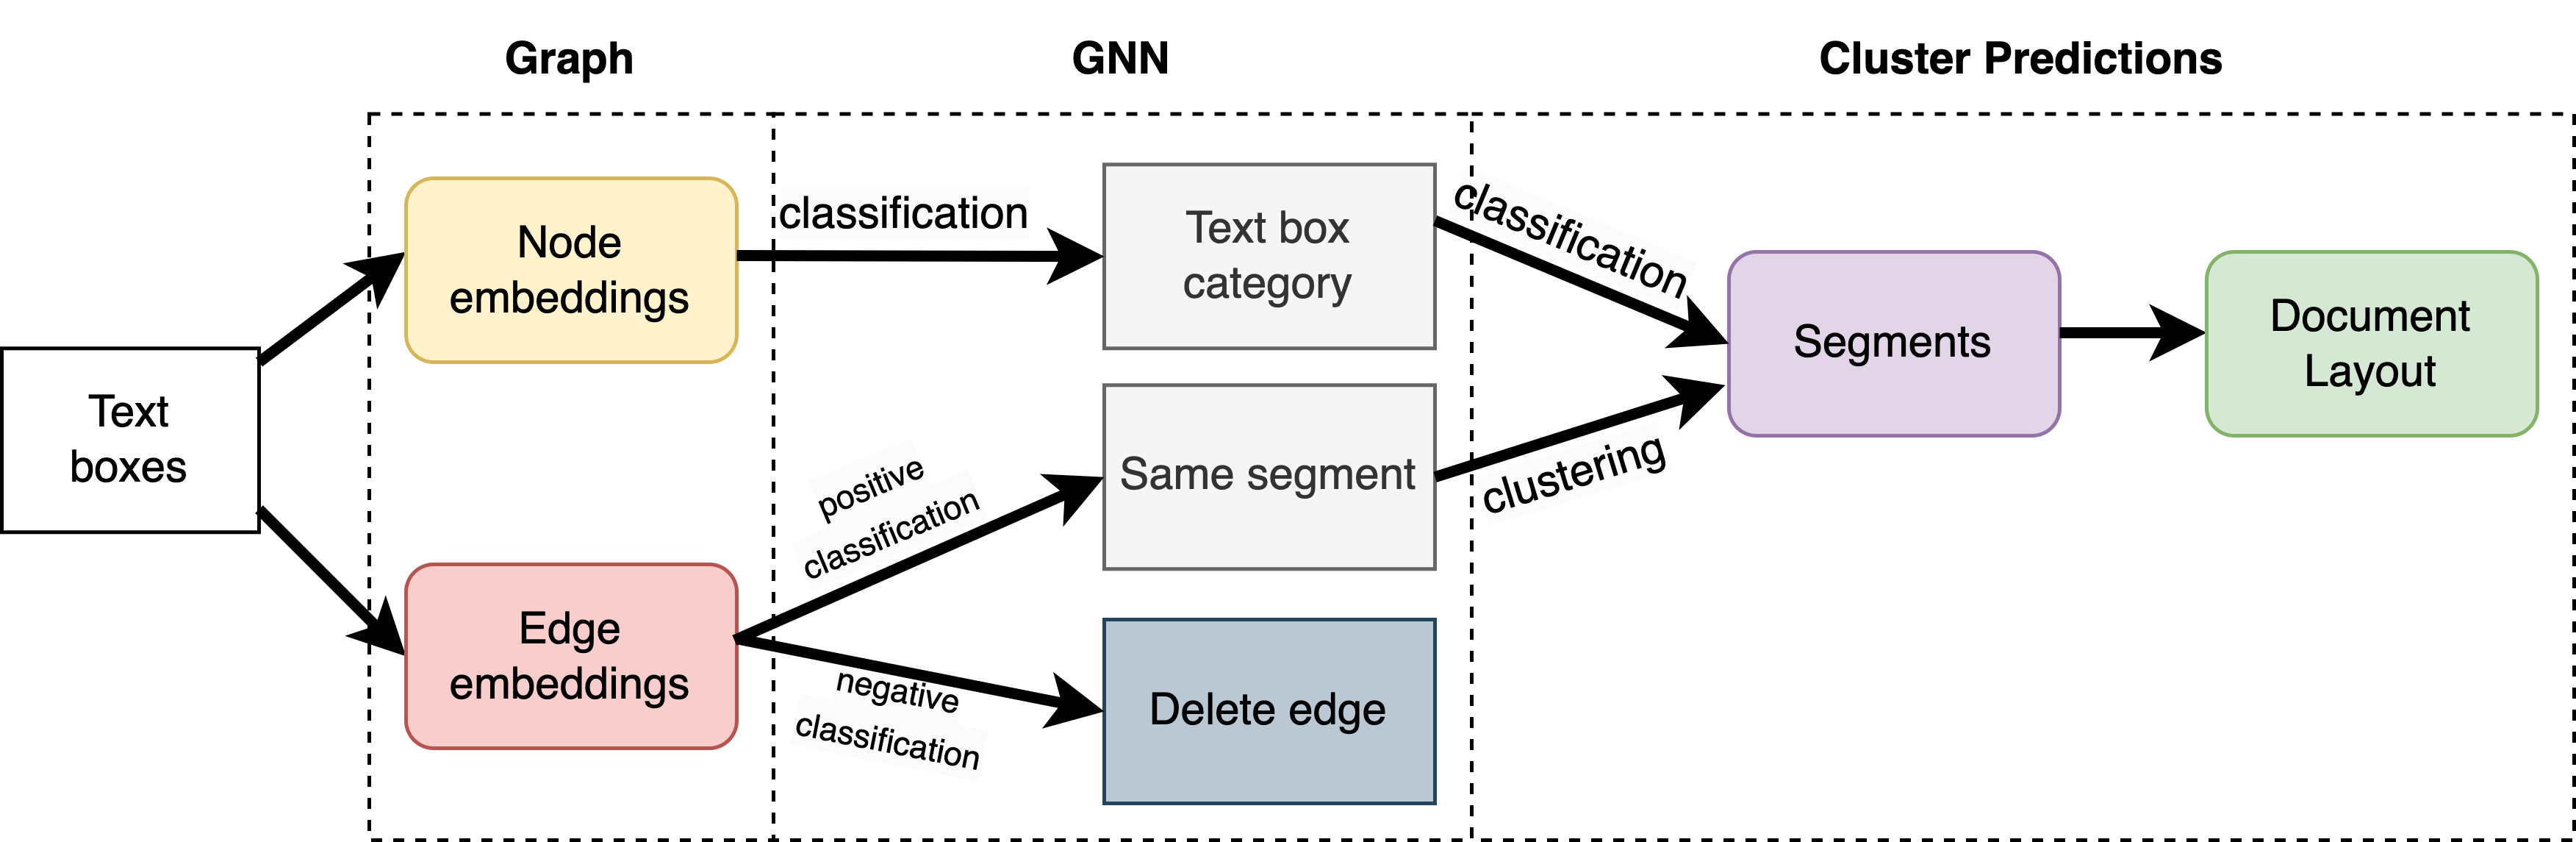
At inference time, segment clustering follows the steps shown in Fig. 4. For a given input graph, the model will classify each node into one of the given segment categories and predict whether each edge is positive or negative. The negative edges are removed from the graph. The segments are then defined by the remaining connected components in the graph. Each segment is classified by the majority vote of the classification of all of its component nodes. This is finally converted back into a COCO-style annotation by using the minimum spanning box of the nodes within the segment as the bounding box, the selected class label as the label, and the mean probability of that label over all of the nodes as the score.
3.2.2 Computer Vision Feature Extraction
One of the main limitations of PDF-parser-based data pre-processing is that it is unable to capture all of the visual information encoded in the PDF. All of the text boxes are only represented by their metadata, which does not account for many of the semantic visual cues within a layout. These cues include background colors, lines, dots, and other non-textual document elements. To include this visual information, we extend our node-level features with a set of visual features. We render the PDF as an image and extract a visual feature map using ResNet-18 [12]. Specifically, to extract the image features corresponding to each input node’s bounding box, we use Region of Interest (ROI) extraction with average pooling [13].
We concatenate these image features with our metadata-based feature vectors, then apply a simple three-layer attention-based encoder model [28] to these features to give them global context before concatenating them with the features associated with the nodes in our graph. This maintains the overall graphical structure while adding the ability to leverage additional visual cues. The network is also relatively small, totaling only slightly over three million parameters. This feature extraction process does not create any additional nodes. Thus, while the model may be able to include some information from image-rich regions of the document — such as figures and pictures — the model is still limited in its ability to account for them.
4 Experiments
4.1 Datasets
PubLayNet [34] is a dataset consisting of 358,353 biomedical research articles in PDF format (approximately 335k for training, 11k for development, and 11k for testing). Each document is annotated with bounding boxes and labels for every distinct semantic segment of content (i.e., text, title, list, figure, and table). These bounding boxes are automatically generated by matching the PDF format and the XML format of the articles. In practice, this leads to bounding boxes that are often not perfectly aligned with the underlying document. [22] finds that this process severely degrades the performance of any method that generates boxes using data directly from the underlying document. For an equal comparison across baselines, we maintain these boxes without adjustment and report our raw mAP (mean average precision) score.
In this work, we primarily focused on using the DocLayNet [25] dataset, due to it having a diverse set of unique layouts. While PubLayNet only contains consistently formatted journal articles, DocLayNet spans six distinct genres (i.e., financial reports, manuals, scientific articles, laws & regulations, patents, and government tenders). It provides layout annotation bounding boxes for 11 different categories (caption, footnote, formula, list-item, page footer, page header, picture, section header, table, text, and title) on 80,863 unique document pages. The documents are divided into a training set (69,375 documents), a development set (6,489 documents), and a testing set (4,999 documents).
Unlike PubLayNet, DocLayNet is a human-annotated dataset; the ground truth bounding boxes are generated by human annotators hand-drawing boxes on top of the documents. These human-drawn boxes then are adjusted to match the underlying extracted text boxes, removing any additional whitespace or annotator errors in the process. This ensures a perfect correlation between the bounding boxes defined by the extracted data and the ground truth labels. For classes that are not well aligned with the underlying text boxes (e.g., picture and table), the boxes are left unmodified. The current state-of-the-art DLA model for this dataset is an off-the-shelf YOLO v5x6 [2] model.
4.2 Data Pre-processing
In conventional VRDU-based methods, PDFs are first converted into images before inference. However, many ground truth features — not only the raw text but text and artifact formatting — can be lost in the image conversion step if the original file information is discarded. Thus, we parse text boxes directly from the PDF documents, which allows us to acquire precise text content, position, and font information.
When using the DocLayNet dataset, we directly use the provided parsed text boxes, which include the bounding box location, the text within the box, and information about its font. These boxes are only provided for textual content, as opposed to figures, tables, etc.
When using the PubLayNet dataset, text boxes are parsed directly from original PDF pages using an in-house PDF parser based on pdfminer.six [1]. To better match DocLayNet, we ignore image-based objects in the document entirely. We apply a series of data cleaning steps (e.g. ignore random symbols in some documents by removing very small bounding boxes smaller than 10 pixels in width and height along with extra white space) on the parsed boxes. To reduce the number of unnecessary edge classifications between adjacent nodes, we use simple distance-based heuristics to merge adjacent boxes. This simplifies the graph structure and reduces the overall memory requirements during training and inference.
Both DocLayNet and PubLayNet contain ground truth data in the COCO format. In order to convert this format to labels on our graph, we take the bounding box for each annotation and find all of the text boxes in the document that have some overlap. We compute the minimum spanning box of this set of text boxes and compare it with the original ground truth. For DocLayNet, if the IoU of the ground truth box and the box formed by all the overlapping text boxes is less than 0.95, we remove text boxes in order of their total area outside the annotation box and select the configuration that achieves the highest IoU.
Once we have associated every annotation with its set of text boxes and their corresponding nodes on the graph, we label each node on the graph with the class of the annotation. Every edge that connects two nodes within the same annotation is labeled a positive edge, while every edge connecting nodes from different annotations is labeled as a negative edge. An example of the labeled graph is presented in Fig. 2.
| MRCNN R50 | MRCNN R101 | FRCNN R101 | YOLO v5x6 | GLAM | GLAM + YOLO v5x6 | |
|---|---|---|---|---|---|---|
| caption | 68.4 | 71.5 | 70.1 | 77.7 | 74.3 | 77.7 |
| footnote | 70.9 | 71.8 | 73.7 | 77.2 | 72.0 | 77.2 |
| formula | 60.1 | 63.4 | 63.5 | 66.2 | 66.6 | 66.6 |
| list item | 81.2 | 80.8 | 81.0 | 86.2 | 76.7 | 86.2 |
| page footer | 61.6 | 59.3 | 58.9 | 61.1 | 86.2 | 86.2 |
| page header | 71.9 | 70.0 | 72.0 | 67.9 | 78.0 | 78.0 |
| picture | 71.7 | 72.7 | 72.0 | 77.1 | 5.7 | 77.1 |
| section header | 67.6 | 69.3 | 68.4 | 74.6 | 79.8 | 79.8 |
| table | 82.2 | 82.9 | 82.2 | 86.3 | 56.3 | 86.3 |
| text | 84.6 | 85.8 | 85.4 | 88.1 | 74.3 | 88.1 |
| title | 76.6 | 80.4 | 79.9 | 82.7 | 85.1 | 85.1 |
| overall | 72.4 | 73.5 | 73.4 | 76.8 | 68.6 | 80.8 |
4.3 Results
4.3.1 DocLayNet
As shown in Table 1, GLAM achieves competitive performance while being over 10 smaller than the smallest comparable model — and over 35 smaller than the current state-of-the-art. Our model outperforms all of the object detection models on five of the 11 total classes, yielding an overall mAP of 68.6. The SOTA model achieves a 76.8.
| LayoutLM v3 [15] | MBC [22] | VSR [33] | YOLO v5x6 | GLAM | |
|---|---|---|---|---|---|
| text | 94.5 | 88.8 | 96.7 | 91.7 | 87.8 |
| title | 90.6 | 52.8 | 93.1 | 79.1 | 80.0 |
| list item | 95.5 | 88.1 | 94.7 | 86.9 | 86.2 |
| table | 97.9 | 97.7 | 97.4 | 96.5 | 86.8 |
| figure | 97.0 | 84.0 | 96.4 | 94.7 | 20.6 |
| overall | 95.1 | 82.3 | 95.7 | 89.8 | 72.2 |
Nine of the 11 classes have annotations that involve text box snapping; the tables and pictures classes do not. When considering only these nine classes, our model achieves an mAP score of 77.0, compared to 75.7 for the next-best model. As expected, our model does not perform as well for tables, and it is particularly low-performing for pictures. When only considering the parsed text of tables (and thus disregarding visual markers such as table borders), our model yields a low mAP for the table class. In fact, GLAM performs well in extracting the compact regions of text from table contents (Fig. 6). If we consider all 10 text-based classes (including tables but excluding pictures), GLAM achieves an mAP score of 74.9, compared to 76.8 from the SOTA model. By creating a simple ensemble with GLAM and YOLO v5x6, we are able to increase the state of the art from 76.8 to 80.8.
4.3.2 PubLayNet
The results on PubLayNet are shown in Table 2. On this dataset, our model is significantly handicapped by the misalignment between the text boxes and the ground truth boxes as shown in Figure 7. Since it cannot improve the alignment of the original text boxes, this enacts a hard upper bound on performance. The model can only achieve an IoU as high as the overlap between the ground-truth label and the underlying PDF data. Although our method may correctly identify and label all of the underlying nodes, it may still not achieve an IoU high enough to register as a correct classification at most of the thresholds.
We can get a more accurate picture of performance by looking at the lower IoU thresholds. At a threshold of 0.5, GLAM achieves an mAP higher than 90 for all of the text classes. For the “title” class, the gap between mAP at this threshold and the final value averaged over the full threshold range is over 17%. As a comparison, this gap on DocLayNet is less than 7% for every class. Even with this misalignment, the GLAM model still is able to achieve 88% of the performance of the SOTA model on the text-based categories.
4.3.3 Analysis
In general, our model performs strongest on small, text-box-based classes, such as titles and headers. We hypothesize that this is mostly due to its ability to perfectly match its bounding box to the ground truth label. Since GLAM has access to the exact text boxes in question, it can output pixel-perfect annotations by simply segmenting the relevant boxes. Object detection models on the other hand are known to struggle with smaller objects [7].
Conversely, our model performs worst on classes that are not well captured by the underlying text boxes in the document. This is a fundamental limitation of our structural representation of the document. This discussion is continued in Section 5.
4.4 CV Feature Ablation
| GLAM | GLAM-CV | ||
|---|---|---|---|
| caption | 74.3 | 60.6 | 13.7 |
| footnote | 72.0 | 61.1 | 10.9 |
| formula | 66.6 | 43.8 | 22.8 |
| list item | 76.7 | 61.5 | 15.2 |
| page footer | 86.2 | 87.3 | -1.1 |
| page header | 78.0 | 78.1 | -0.1 |
| picture | 5.7 | 4.3 | 1.4 |
| section header | 79.8 | 70.1 | 9.7 |
| table | 56.3 | 50.2 | 6.1 |
| text | 74.3 | 68.4 | 5.9 |
| title | 85.1 | 72.9 | 12.2 |
| overall | 68.6 | 59.9 | 8.79 |
| GLAM | GLAM - CV | ||
|---|---|---|---|
| text | 87.8 | 85.9 | 1.9 |
| title | 80.0 | 79.8 | 0.2 |
| list item | 86.2 | 84.8 | 1.4 |
| table | 86.8 | 86.1 | 0.7 |
| figure | 20.6 | 18.3 | 2.3 |
| overall | 72.2 | 71.0 | 1.2 |
We include an ablation study of the computer vision feature extractor in Tables 3 and 4. For these models, we only train the graph network component of GLAM, without the CV features. The GNN component represents only one-fourth of the total parameters of the GLAM. Removing the vision feature extraction leads to a consistent decrease in performance across both tasks, albeit only slightly on PubLayNet. This is likely the result of two factors: (1) our model nearing the performance limit imposed by the misaligned boxes in PubLayNet; and (2) the visual complexity of the DocLayNet data. DocLayNet layouts contain many visual cues that are not captured by the underlying text boxes (e.g., bullet points, lines, and colored backgrounds). Results on the PubLayNet dataset (Table 4) indicate that the GNN component in GLAM already performs well on the visual-simple type of documents like research articles.
4.5 Model Size and Efficiency
| Model Size | Inference Time (ms) | Pages/sec | |||
|---|---|---|---|---|---|
| (M) | GPU | CPU | GPU | CPU | |
| LayoutLMv3 | 133 | 687 | 6100 | 1.5 | 0.2 |
| YOLO v5 | 140.7 | 56 | 179 | 17.8 | 5.6 |
| GLAM | 4 | 10 | 16 | 98.0 | 63.7 |
| GLAM - CV | 1 | 4 | 9 | 243.9 | 109.9 |
Although large, pre-trained models often lead to high performance when adapted to downstream tasks, they tend to be relatively large and slow in training and inference. Both the state-of-the-art object detection models on PubLayNet and DocLayNet have over 130 million parameters. To highlight the efficiency of our graph-based model, in Table 5 we include additional benchmarks regarding inference speed and throughput. We baseline our model against the two highest-performing, open-source models on each task.
In general, GLAM is much more efficient than the baseline models. The full GLAM model, which achieves competitive performance to the baseline models, is able to process a document page in 10 ms on a single GPU†††We use an NVIDIA Tesla T4 as GPU in our experiments., compared to 56 ms and 687 ms for YOLO v5x6 and LayoutLMv3, respectively. Removing the CV feature extraction drops the inference time to 4 ms, allowing the model to process over 243 document pages per second on a single GPU. Such efficient DLA models significantly reduce the engineering complexity in real-world use cases and enable the possibility of on-device model deployments.
5 Limitations
The main limitation of GLAM is that it is highly dependent on the parsing quality of the document. The benefit of using off-the-shelf object detection models is that their performance is much less sensitive to the structure of the underlying document. That is, they can account for the misaligned ground-truth boxes, such as the ones in PubLayNet. Importantly, they can also properly work with scanned documents and other documents with little or no structure – alleviating the need to address pre-processing decisions. For the same reason, GLAM is unable to capture many regions of vision-rich segments (e.g., figures and pictures) in PDF documents. GLAM also does not take into account any of the available document semantic information. To address this limitation, we could use an additional text feature extractor (text embedding) for the text boxes.
6 Conclusion
In this work, we introduce GLAM, a lightweight graph-network-based method for performing document layout analysis on PDF documents. We build upon a novel, structured representation of the document created from directly parsing the PDF data. We frame the document layout analysis task as performing node and edge classification on document graphs. With these insights, GLAM performs comparably to competitive baseline models while being orders of magnitude smaller. The model works particularly well for text-based layout elements such as headers and titles. By ensembling this model with an off-the-shelf object detection model, we are able to set state-of-the-art performance in DocLayNet. We demonstrate that GLAM is a highly-efficient and effective approach to extracting and classifying text from PDF documents, which makes it competitive, especially in real-world applications with limited computational resources.
References
- pdf [2022] pdfminer.six. https://github.com/pdfminer/pdfminer.six, 2022.
- yol [2022] Yolov5 sota realtime instance segmentation. https://github.com/ultralytics/yolov5, 2022.
- Binmakhashen and Mahmoud [2019] Galal M Binmakhashen and Sabri A Mahmoud. Document layout analysis: a comprehensive survey. ACM Computing Surveys (CSUR), 52(6):1–36, 2019.
- Bunke and Riesen [2011] Horst Bunke and Kaspar Riesen. Recent advances in graph-based pattern recognition with applications in document analysis. Pattern Recogn., 44(5):1057–1067, may 2011. ISSN 0031-3203. doi: 10.1016/j.patcog.2010.11.015. URL https://doi.org/10.1016/j.patcog.2010.11.015.
- Cai and Vasconcelos [2018] Zhaowei Cai and Nuno Vasconcelos. Cascade r-cnn: Delving into high quality object detection. In Proceedings of the IEEE conference on computer vision and pattern recognition, pages 6154–6162, 2018.
- Chao and Fan [2004] Hui Chao and Jian Fan. Layout and content extraction for pdf documents. In Simone Marinai and Andreas R. Dengel, editors, Document Analysis Systems VI, pages 213–224, Berlin, Heidelberg, 2004. Springer Berlin Heidelberg. ISBN 978-3-540-28640-0.
- Chen et al. [2020] Guang Chen, Haitao Wang, Kai Chen, Zhijun Li, Zida Song, Yinlong Liu, Wenkai Chen, and Alois Knoll. A survey of the four pillars for small object detection: Multiscale representation, contextual information, super-resolution, and region proposal. IEEE Transactions on Systems, Man, and Cybernetics: Systems, PP:1–18, 07 2020. doi: 10.1109/TSMC.2020.3005231.
- Cui et al. [2021] Lei Cui, Yiheng Xu, Tengchao Lv, and Furu Wei. Document ai: Benchmarks, models and applications. arXiv preprint arXiv:2111.08609, 2021.
- Du et al. [2017] Jian Du, Shanghang Zhang, Guanhang Wu, José MF Moura, and Soummya Kar. Topology adaptive graph convolutional networks. arXiv preprint arXiv:1710.10370, 2017.
- Gemelli et al. [2022] Andrea Gemelli, Emanuele Vivoli, and Simone Marinai. Graph neural networks and representation embedding for table extraction in pdf documents. In 2022 26th International Conference on Pattern Recognition (ICPR), pages 1719–1726, 2022. doi: 10.1109/ICPR56361.2022.9956590.
- Gu et al. [2022] Jiuxiang Gu, Jason Kuen, Vlad I Morariu, Handong Zhao, Nikolaos Barmpalios, Rajiv Jain, Ani Nenkova, and Tong Sun. Unified pretraining framework for document understanding. arXiv e-prints, pages arXiv–2204, 2022.
- He et al. [2016] Kaiming He, Xiangyu Zhang, Shaoqing Ren, and Jian Sun. Deep residual learning for image recognition. In 2016 IEEE Conference on Computer Vision and Pattern Recognition (CVPR), pages 770–778, 2016. doi: 10.1109/CVPR.2016.90.
- He et al. [2017] Kaiming He, Georgia Gkioxari, Piotr Dollár, and Ross Girshick. Mask r-cnn. In 2017 IEEE International Conference on Computer Vision (ICCV), pages 2980–2988, 2017. doi: 10.1109/ICCV.2017.322.
- Holeček et al. [2019] Martin Holeček, Antonín Hoskovec, Petr Baudiš, and Pavel Klinger. Table understanding in structured documents. In 2019 International Conference on Document Analysis and Recognition Workshops (ICDARW), volume 5, pages 158–164, 2019. doi: 10.1109/ICDARW.2019.40098.
- Huang et al. [2022a] Yupan Huang, Tengchao Lv, Lei Cui, Yutong Lu, and Furu Wei. Layoutlmv3: Pre-training for document ai with unified text and image masking. arXiv preprint arXiv:2204.08387, 2022a.
- Huang et al. [2022b] Yupang Huang, Tengchao Lv, Lei Cui, Yutong Lu, and Furu Wei. Layoutlmv3: Pre-training for document ai with unified text and image masking. In ACM Multimedia 2022, October 2022b. URL https://www.microsoft.com/en-us/research/publication/layoutlmv3-pre-training-for-document-ai-with-unified-text-and-image-masking/.
- Kavasidis et al. [2019] I. Kavasidis, C. Pino, S. Palazzo, F. Rundo, D. Giordano, P. Messina, and C. Spampinato. A saliency-based convolutional neural network for table and chart detection in digitized documents. In Elisa Ricci, Samuel Rota Bulò, Cees Snoek, Oswald Lanz, Stefano Messelodi, and Nicu Sebe, editors, Image Analysis and Processing – ICIAP 2019, pages 292–302, Cham, 2019. Springer International Publishing. ISBN 978-3-030-30645-8.
- Kipf and Welling [2017] Thomas N. Kipf and Max Welling. Semi-supervised classification with graph convolutional networks. In 5th International Conference on Learning Representations, ICLR 2017, Toulon, France, April 24-26, 2017, Conference Track Proceedings. OpenReview.net, 2017. URL https://openreview.net/forum?id=SJU4ayYgl.
- Lewis et al. [2006] D. Lewis, G. Agam, S. Argamon, O. Frieder, D. Grossman, and J. Heard. Building a test collection for complex document information processing. In Proceedings of the 29th Annual International ACM SIGIR Conference on Research and Development in Information Retrieval, SIGIR ’06, page 665–666, New York, NY, USA, 2006. Association for Computing Machinery. ISBN 1595933697. doi: 10.1145/1148170.1148307. URL https://doi.org/10.1145/1148170.1148307.
- Li et al. [2021] Chenliang Li, Bin Bi, Ming Yan, Wei Wang, Songfang Huang, Fei Huang, and Luo Si. StructuralLM: Structural pre-training for form understanding. In Proceedings of the 59th Annual Meeting of the Association for Computational Linguistics and the 11th International Joint Conference on Natural Language Processing (Volume 1: Long Papers), pages 6309–6318, Online, August 2021. Association for Computational Linguistics. doi: 10.18653/v1/2021.acl-long.493. URL https://aclanthology.org/2021.acl-long.493.
- Li et al. [2022] Junlong Li, Yiheng Xu, Tengchao Lv, Lei Cui, Cha Zhang, and Furu Wei. Dit: Self-supervised pre-training for document image transformer. arXiv preprint arXiv:2203.02378, 2022.
- Li et al. [2020] Xiao-Hui Li, Fei Yin, and Cheng-Lin Liu. Page segmentation using convolutional neural network and graphical model. In Xiang Bai, Dimosthenis Karatzas, and Daniel Lopresti, editors, Document Analysis Systems, pages 231–245, Cham, 2020. Springer International Publishing. ISBN 978-3-030-57058-3.
- Lin et al. [2017] Tsung-Yi Lin, Piotr Dollár, Ross Girshick, Kaiming He, Bharath Hariharan, and Serge Belongie. Feature pyramid networks for object detection. In Proceedings of the IEEE conference on computer vision and pattern recognition, pages 2117–2125, 2017.
- Liu et al. [2019] Xiaojing Liu, Feiyu Gao, Qiong Zhang, and Huasha Zhao. Graph convolution for multimodal information extraction from visually rich documents. In NAACL, 2019.
- Pfitzmann et al. [2022] Birgit Pfitzmann, Christoph Auer, Michele Dolfi, Ahmed S Nassar, and Peter WJ Staar. Doclaynet: A large human-annotated dataset for document-layout analysis. arXiv preprint arXiv:2206.01062, 2022.
- Qasim et al. [2019] S. Qasim, H. Mahmood, and F. Shafait. Rethinking table recognition using graph neural networks. In 2019 International Conference on Document Analysis and Recognition (ICDAR), pages 142–147, Los Alamitos, CA, USA, sep 2019. IEEE Computer Society. doi: 10.1109/ICDAR.2019.00031. URL https://doi.ieeecomputersociety.org/10.1109/ICDAR.2019.00031.
- Riba et al. [2019] Pau Riba, Anjan Dutta, Lutz Goldmann, Alicia Fornés, Oriol Ramos, and Josep Lladós. Table detection in invoice documents by graph neural networks. In 2019 International Conference on Document Analysis and Recognition (ICDAR), pages 122–127, 2019. doi: 10.1109/ICDAR.2019.00028.
- Vaswani et al. [2017] Ashish Vaswani, Noam Shazeer, Niki Parmar, Jakob Uszkoreit, Llion Jones, Aidan N Gomez, Ł ukasz Kaiser, and Illia Polosukhin. Attention is all you need. In I. Guyon, U. Von Luxburg, S. Bengio, H. Wallach, R. Fergus, S. Vishwanathan, and R. Garnett, editors, Advances in Neural Information Processing Systems, volume 30. Curran Associates, Inc., 2017. URL https://proceedings.neurips.cc/paper/2017/file/3f5ee243547dee91fbd053c1c4a845aa-Paper.pdf.
- Wei et al. [2020] Mengxi Wei, Yifan He, and Qiong Zhang. Robust layout-aware ie for visually rich documents with pre-trained language models, 2020.
- Xu et al. [2021] Yang Xu, Yiheng Xu, Tengchao Lv, Lei Cui, Furu Wei, Guoxin Wang, Yijuan Lu, Dinei Florencio, Cha Zhang, Wanxiang Che, Min Zhang, and Lidong Zhou. LayoutLMv2: Multi-modal pre-training for visually-rich document understanding. In Proceedings of the 59th Annual Meeting of the Association for Computational Linguistics and the 11th International Joint Conference on Natural Language Processing (Volume 1: Long Papers), pages 2579–2591, Online, August 2021. Association for Computational Linguistics. doi: 10.18653/v1/2021.acl-long.201. URL https://aclanthology.org/2021.acl-long.201.
- Xu et al. [2020] Yiheng Xu, Minghao Li, Lei Cui, Shaohan Huang, Furu Wei, and Ming Zhou. Layoutlm: Pre-training of text and layout for document image understanding. In Proceedings of the 26th ACM SIGKDD International Conference on Knowledge Discovery & Data Mining, pages 1192–1200, 2020.
- Yang et al. [2019] Huichen Yang, Carlos A. Aguirre, Maria F. De La Torre, Derek Christensen, Luis Bobadilla, Emily Davich, Jordan Roth, Lei Luo, Yihong Theis, Alice Lam, T. Yong-Jin Han, David Buttler, and William H. Hsu. Pipelines for procedural information extraction from scientific literature: Towards recipes using machine learning and data science. In 2019 International Conference on Document Analysis and Recognition Workshops (ICDARW), volume 2, pages 41–46, 2019. doi: 10.1109/ICDARW.2019.10037.
- Zhang et al. [2021] Peng Zhang, Can Li, Liang Qiao, Zhanzhan Cheng, Shiliang Pu, Yi Niu, and Fei Wu. Vsr: A unified framework for document layout analysis combining vision, semantics and relations. In Josep Lladós, Daniel Lopresti, and Seiichi Uchida, editors, Document Analysis and Recognition – ICDAR 2021, pages 115–130, Cham, 2021. Springer International Publishing. ISBN 978-3-030-86549-8.
- Zhong et al. [2019] Xu Zhong, Jianbin Tang, and Antonio Jimeno Yepes. Publaynet: largest dataset ever for document layout analysis. In 2019 International Conference on Document Analysis and Recognition (ICDAR), pages 1015–1022. IEEE, 2019.