[2,3,1]\fnmFabio \surSaracco
1]\orgnameIMT Scuola Alti Studi Lucca, \orgaddress\streetPiazza San Francesco 19, \cityLucca, \postcode55100, \countryItaly
2]\orgname“Enrico Fermi” Research Center, \orgaddress\streetVia Panisperna 89A, \cityRome, \postcode00184, \countryItaly
3]\orgnameInstitute for Applied Computing “Mauro Picone”, CNR, \orgaddress\streetVia dei Taurini 19, \cityRome, \postcode00185, \countryItaly
4]\orgnameIstituto di Informatica e Telematica, CNR, \orgaddress\streetvia G. Moruzzi 1, \cityPisa, \postcode56124, \countryItaly
Entropy-based detection of Twitter echo chambers
Abstract
The presence of echo chambers, i.e. clusters of users exposed to news or opinions in line with their previous beliefs, was observed in many online debates on social platforms. Users form an echo chamber when two different phenomena appear at the same time: 1. users interact with ones sharing similar opinions; 2. users with similar opinions refer to the same pieces of news.
We propose a completely unbiased entropy-based procedure to spot echo chambers. Remarkably, the method is completely agnostic about the nature of the data. In the Italian Twitter debate about Covid-19 vaccination, we find a limited presence of users in echo chambers (around 0.35% of all users), due to the limited number of validated users who are exposed to the same news. Nevertheless, their impact on the formation of a common discourse is strong, since echo chambers are responsible for nearly one-third of retweets of their discursive communities.
keywords:
Echo chambers; Twitter; Complex networks; Maximum-entropy null-models1 Introduction
In the virtual world, an echo chamber is formed when people are exposed only to online information and opinions that align with their existing beliefs and values. Otherwise stated, the propensity for information confirming previous opinions and the interactions with other users showing similar positions result in the formation of ‘a bounded, enclosed media space that has the potential to both magnify the messages delivered within it and insulate them from rebuttal’ [1, 2, 3].
While the creation of echo chambers is worrisome on its own for the radicalization of online –and, therefore, also offline– debates, their effects are also more dangerous when they are affected by misinformation.
With the advent of the internet and Online Social Networks, the production and fruition of information feature less mediated procedures, where content and quality do not always go through a rigorous editorial process [4, 5, 6]. Moreover, the fast processing of data reduces the capability to objectively judge the information provided [7], possibly accelerating the diffusion of low-quality posts.
Intuitively enough, the presence of unreliable pieces of information can increase the formation of echo chambers in which prejudicial, biased, misleading, if not outright fake news is exalted. A deeper literature review about echo chambers in online social networks can be found in Section A in the appendix.
This paper analyses the effective presence of echo chambers on Twitter using an entropy-based technique.
Previous studies have highlighted how echo chambers are homogeneous communities of accounts, polarised on the same opinions [3, 8]. Thus, we have an echo chamber when these two events occur:
1. users are exposed to the content created by others with similar opinions; 2. similar users engage with the same pieces of news. When the two events appear at the same time, users are entrapped into an echo chamber. Recently, entropy-based null-models were introduced in Complex Networks studies as an unbiased benchmark able to uncover non-trivial structures of real systems [9] and therefore they represent the proper framework for our analysis. Fig. 1 shows how we intend to assess the occurrence of the two events, and, consequently, the occurrence of the echo chamber.
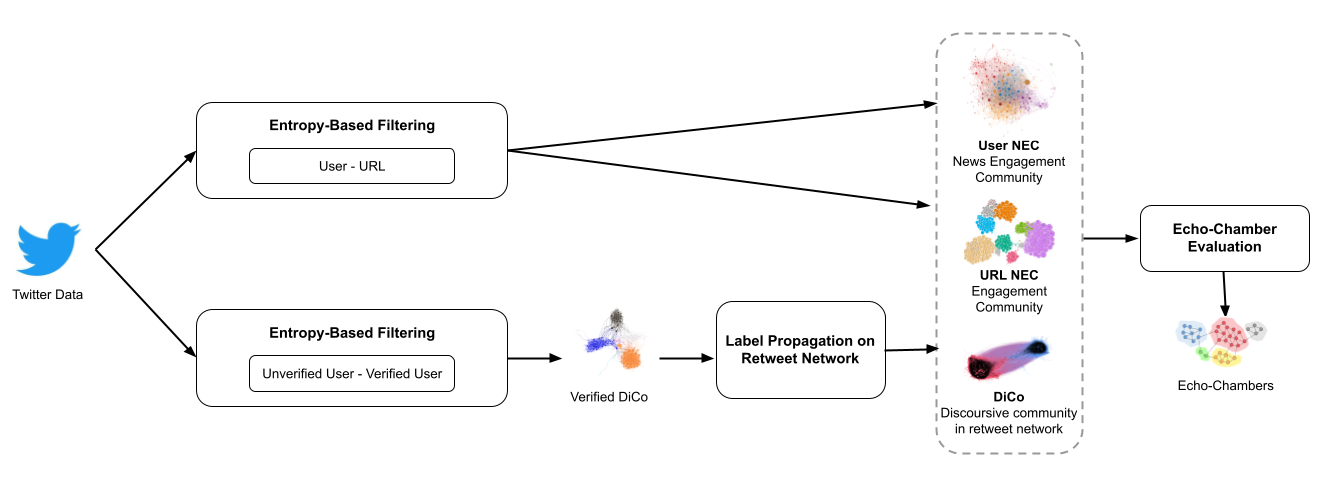
Assessing the opinion of the various accounts is not an easy task, but it can be inferred from the interaction among the various accounts. In Ref.s [10, 11, 12, 13] a method to infer the presence of a discursive community, i.e. a group of accounts contributing to the formation of a common discourse, was presented. It is based on verified users, i.e. those accounts for which Twitter has a procedure to check the identity of their owners. Verified accounts mainly belong to politicians, journalists, and celebrities; usually they are strong creators of contents [10, 11, 12]. Verified users are among the greatest contributors to the formation of a common discourse. It is possible, then, to let similarities emerge among the content created by verified users, based on the behaviour of their common audience in terms of retweets, since retweets are considered a measure of engagement [14, 15, 16].
In detail, for each pair of verified users, the number of common retweeters is counted. If the number is statistically significant with respect to an entropy-based benchmark, it is validated and we project a link between the verified users’ pair. On the monopartite network of verified users thus obtained, we run a community detection algorithm. Then, the various communities are labelled in terms of the users who belong to them (since the users are verified, it is possible, for example, to derive their political leanings and test a posteriori the resulting communities). At this point, using a label propagation procedure, the labels are extended to the retweet network of users, for each community, thus obtaining labelled communities of verified and unverified users. Once again, the use of the retweet network for label propagation is motivated by the fact that there is evidence that users belonging to communities in a retweet network share similar views [14, 15, 16]. In the following, such communities will be called discursive communities (or DiCo) and their detection is sketched in the bottom path of Fig. 1. Discursive communities contextualize the first condition: users are exposed to the content created by others sharing similar opinions, the similarity being captured by retweets to the content created by the same group of verified accounts.
Regarding the second condition, we approach its assessment by analysing the ties between the users and the URLs present in their tweets and retweets.
The top path of Fig. 1 shows the approach. The idea of leveraging the bipartite network of users and URLs was already considered in Ref. [17] for Facebook: in the present case, we translate the idea therein to Twitter. Again, the procedure goes through a comparison between observations and an entropy-based benchmark: if two users tweeted (or retweeted) the same URLs significantly more than the benchmark, we conclude that the two users share the same information diet in a statistically significant way. Similarly, if two URLs appear in the tweets (or retweets) of the same users significantly more than the benchmark, these URLs pass the validation procedure: we can thus
identify, respectively, groups of users sharing the same URLs and groups of URLs shared by the same users. In the following, user communities and URL communities that passed the validation are called, respectively, news engagement communities of users and URLs, for short users’ and URLs’ NECs, respectively.
An echo chamber is then formed when accounts in a user NEC interact among themselves inside the same discursive community. In fact, we can infer the presence of an echo chamber only when there is evidence that users exposed to the same news sources are also exposed to opinions by other users sharing similar viewpoints: the latter is encoded in retweets to users in the same DiCo, since retweets are considered as a form of endorsement to the content created by others [14, 15, 16, 10]. Let us remark that such a situation is not given, in principle: accounts belonging to the same user NEC may either not belong to the same DiCo or, even in the case in which are in the same discursive community, not interact among each other. In this sense, only users that i) belong to the same user NEC and ii) also belong to the same DiCo and iii) form a weakly connected component in the retweet network can be claimed to represent an echo chamber.
As a case study for evaluating the presence of echo chambers, we consider the online debate on Twitter regarding the Covid-19 vaccination campaign. Surprisingly enough, as compared to numerous examples shown in the literature, in the dataset under analysis, we find a limited presence of echo chambers, mainly due to the small dimensions of users’ NECs. Despite detected echo chambers being composed of a small number of users with respect to the total active users, they play a significant role in terms of retweet interactions, i.e. echo chambers have a substantial impact on the overall discussion about Covid-19 vaccination in Italy.
Contributions
The main contribution of this paper is a novel unbiased methodology for echo chamber detection. The procedure is set on the very definition of echo chambers and includes the application of an entropy-based null-model to discard signals assimilated to noise.
Research questions
Keeping in mind that our final goal is to observe if and when discursive communities and news engagement communities of users overlap, thus forming echo-chambers, we organise the structure of the paper as to answer the following Research Questions (RQs):
-
•
RQ.1: What are the characteristics of the discursive communities (DiCo) emerging from the case study under investigation? (Section 2.2);
-
•
RQ.2: What are the characteristics of the news engagement communities (NEC) of URLs and users emerging from the case study under investigation? (Section 2.3);
-
•
RQ.3: Users in the same user NEC interact among themselves in the same DiCo? In other words, do validated echo chambers exist in the scenario under investigation? (Section 2.4)
2 Results
2.1 Dataset
| Keywords | English meaning |
|---|---|
| vax, vaccino, vaccini, vaccinarsi | Variants of the word ‘vaccination’ |
| novax | A person against vaccination |
| Astrazeneca, Pfizer-BioNTech, Moderna, Sputnik | Covid-19 vaccines |
| greenpass | The certificate of vaccination |
| or of recover from the disease |
Our dataset consists of M tweets in Italian and k users; nearly k tweets contain URLs. We relied on the Twitter’s streaming API and data were collected from September to September 2021.
The data collection was keyword-based and related to the COVID-19 vaccination online debate;
the keywords for the data collection are in Table 1. The keywords are compatible with chronicles regarding vaccination debate in Italy at time of data collection. We remind the reader that the Twitter’s streaming API returns any tweet containing those terms in the text of the tweet, as well as in its metadata. It is worth noting that it is not always necessary to have each permutation of a specific keyword in the tracking list. For example, the keyword ‘COVID’ would return tweets that contain also both ‘COVID19’ and ‘COVID-19’.
2.2 Discursive Communities
Fig. 2 describes the characteristics of the main discursive communities (or DiCos) that emerge from the data. Most of the users who are part of a DiCo belong to either the ItaV-PD-Media community (; the community includes journalists and exponents of the Italian parties ItaliaViva and Democratic Party) or the FdI-L-Media community (; the community includes journalists and exponents of the Italian parties Fratelli D’Italia and Lega). About of users belong to minor DiCos, while of users do not cluster in any DiCo. The FdI-L-Media community posted most of the new content (), despite representing around a quarter of all users in our dataset. ItaV-PD-Media is responsible for of the new content while the remaining is posted by users who do not belong to any specific community. In terms of retweets, FdI-L-Media is by far the most active community, with of retweets.
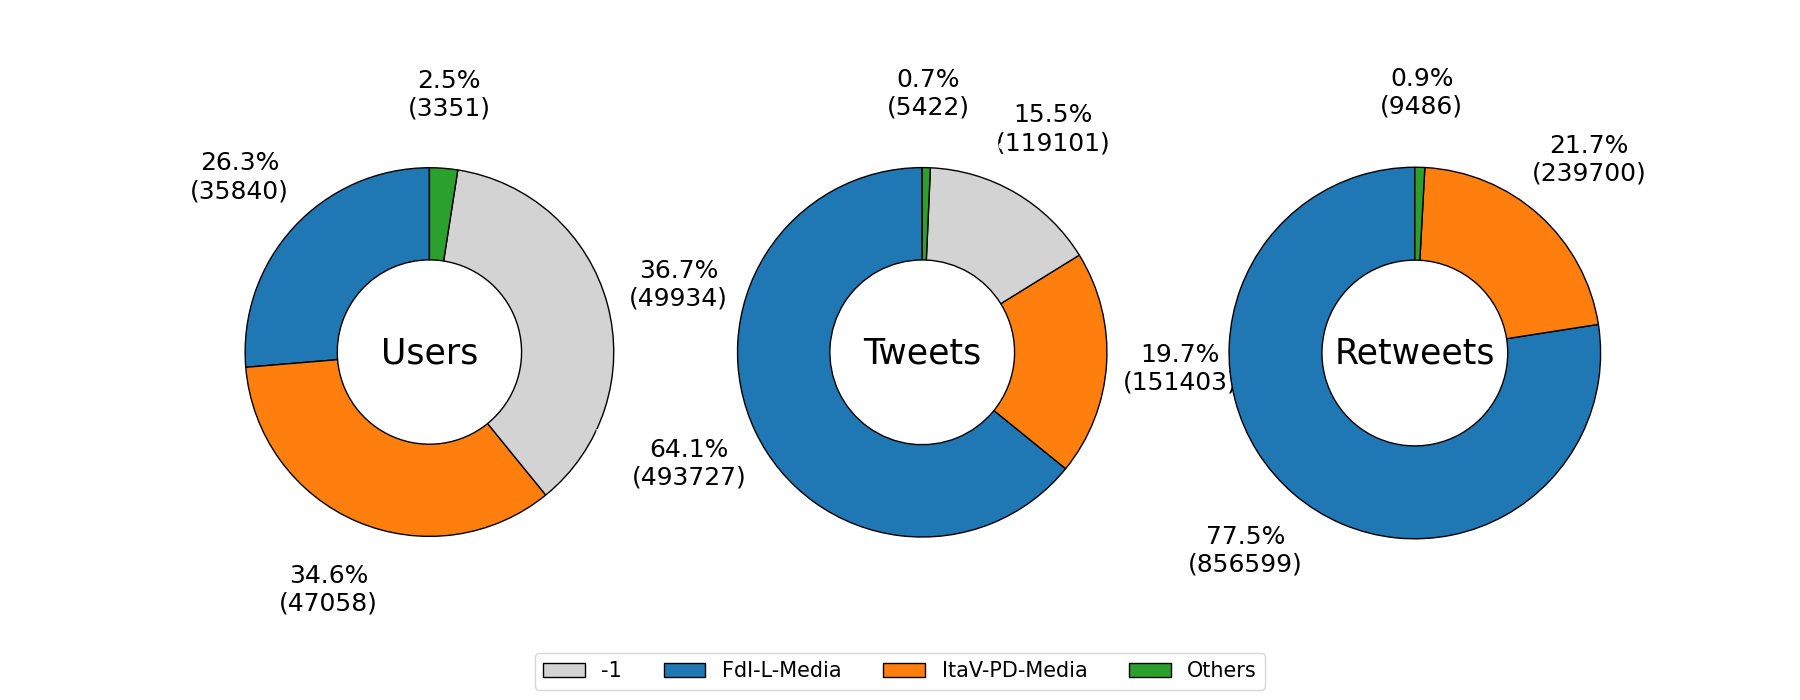
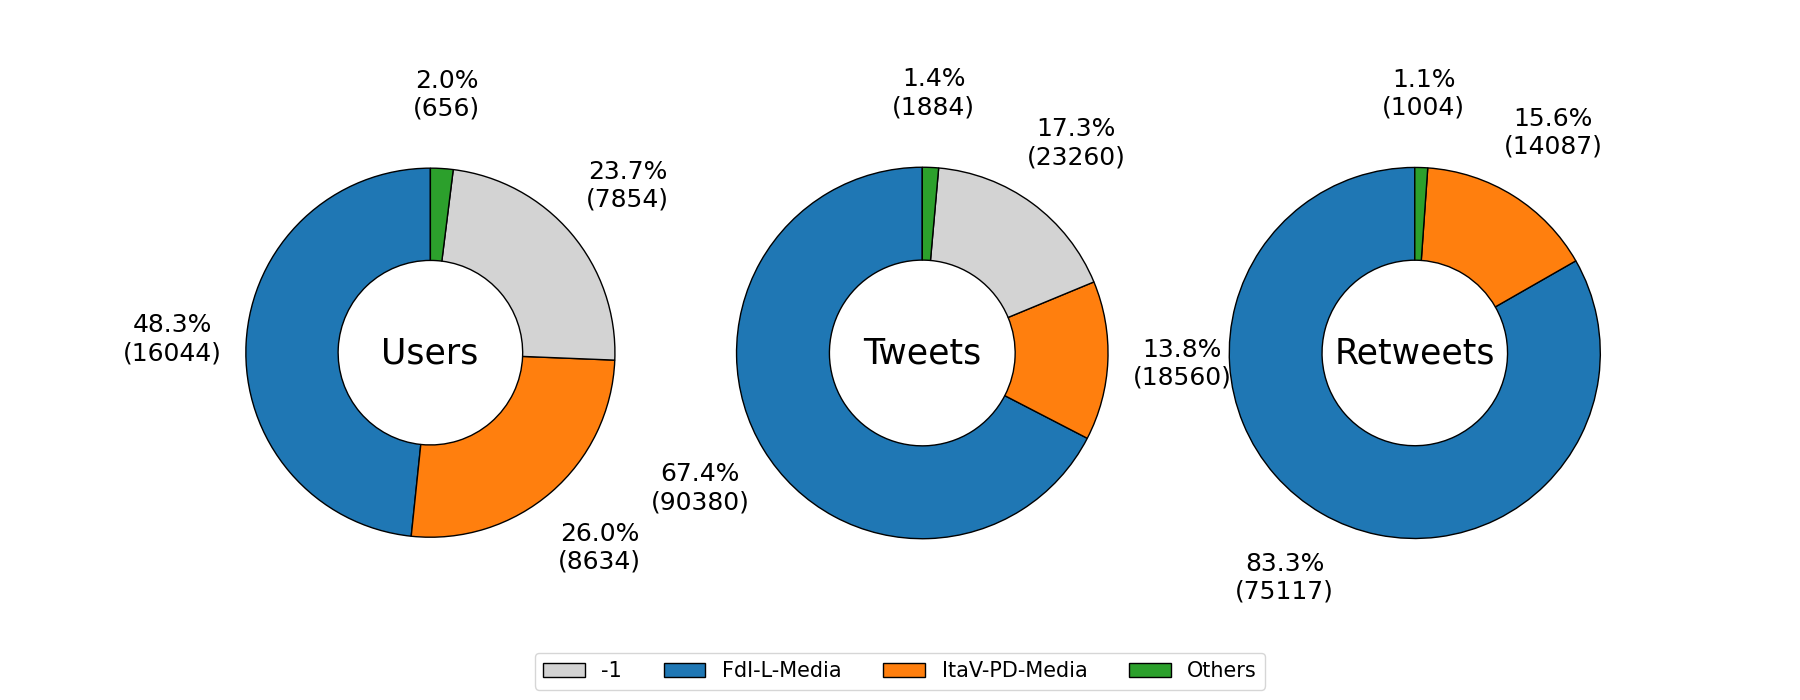
Fig. 3 characterises DiCos by focusing only on posts containing URLs. In general, the observations made for Fig. 2 still hold, with the exception that nearly one-half of users who post tweets with URLs belong to the FdI-L-Media community ().
2.3 News Engagement Communities (NECs) of users
Table 2 shows that, among all users who published at least one post with a URL (), only 566 are part of a user NEC, representing less than . On the other hand, accounts in user NECs are, proportionally, much more active in publishing URLs compared to users not validated by our procedure (67.7 vs. 5.90 URLs per account).
| Type | No. Users | verified | No. URL |
|---|---|---|---|
| Non-validated | 32,622 | 434 | 192,334 |
| Validated | 566 | 1 | 38,345 |
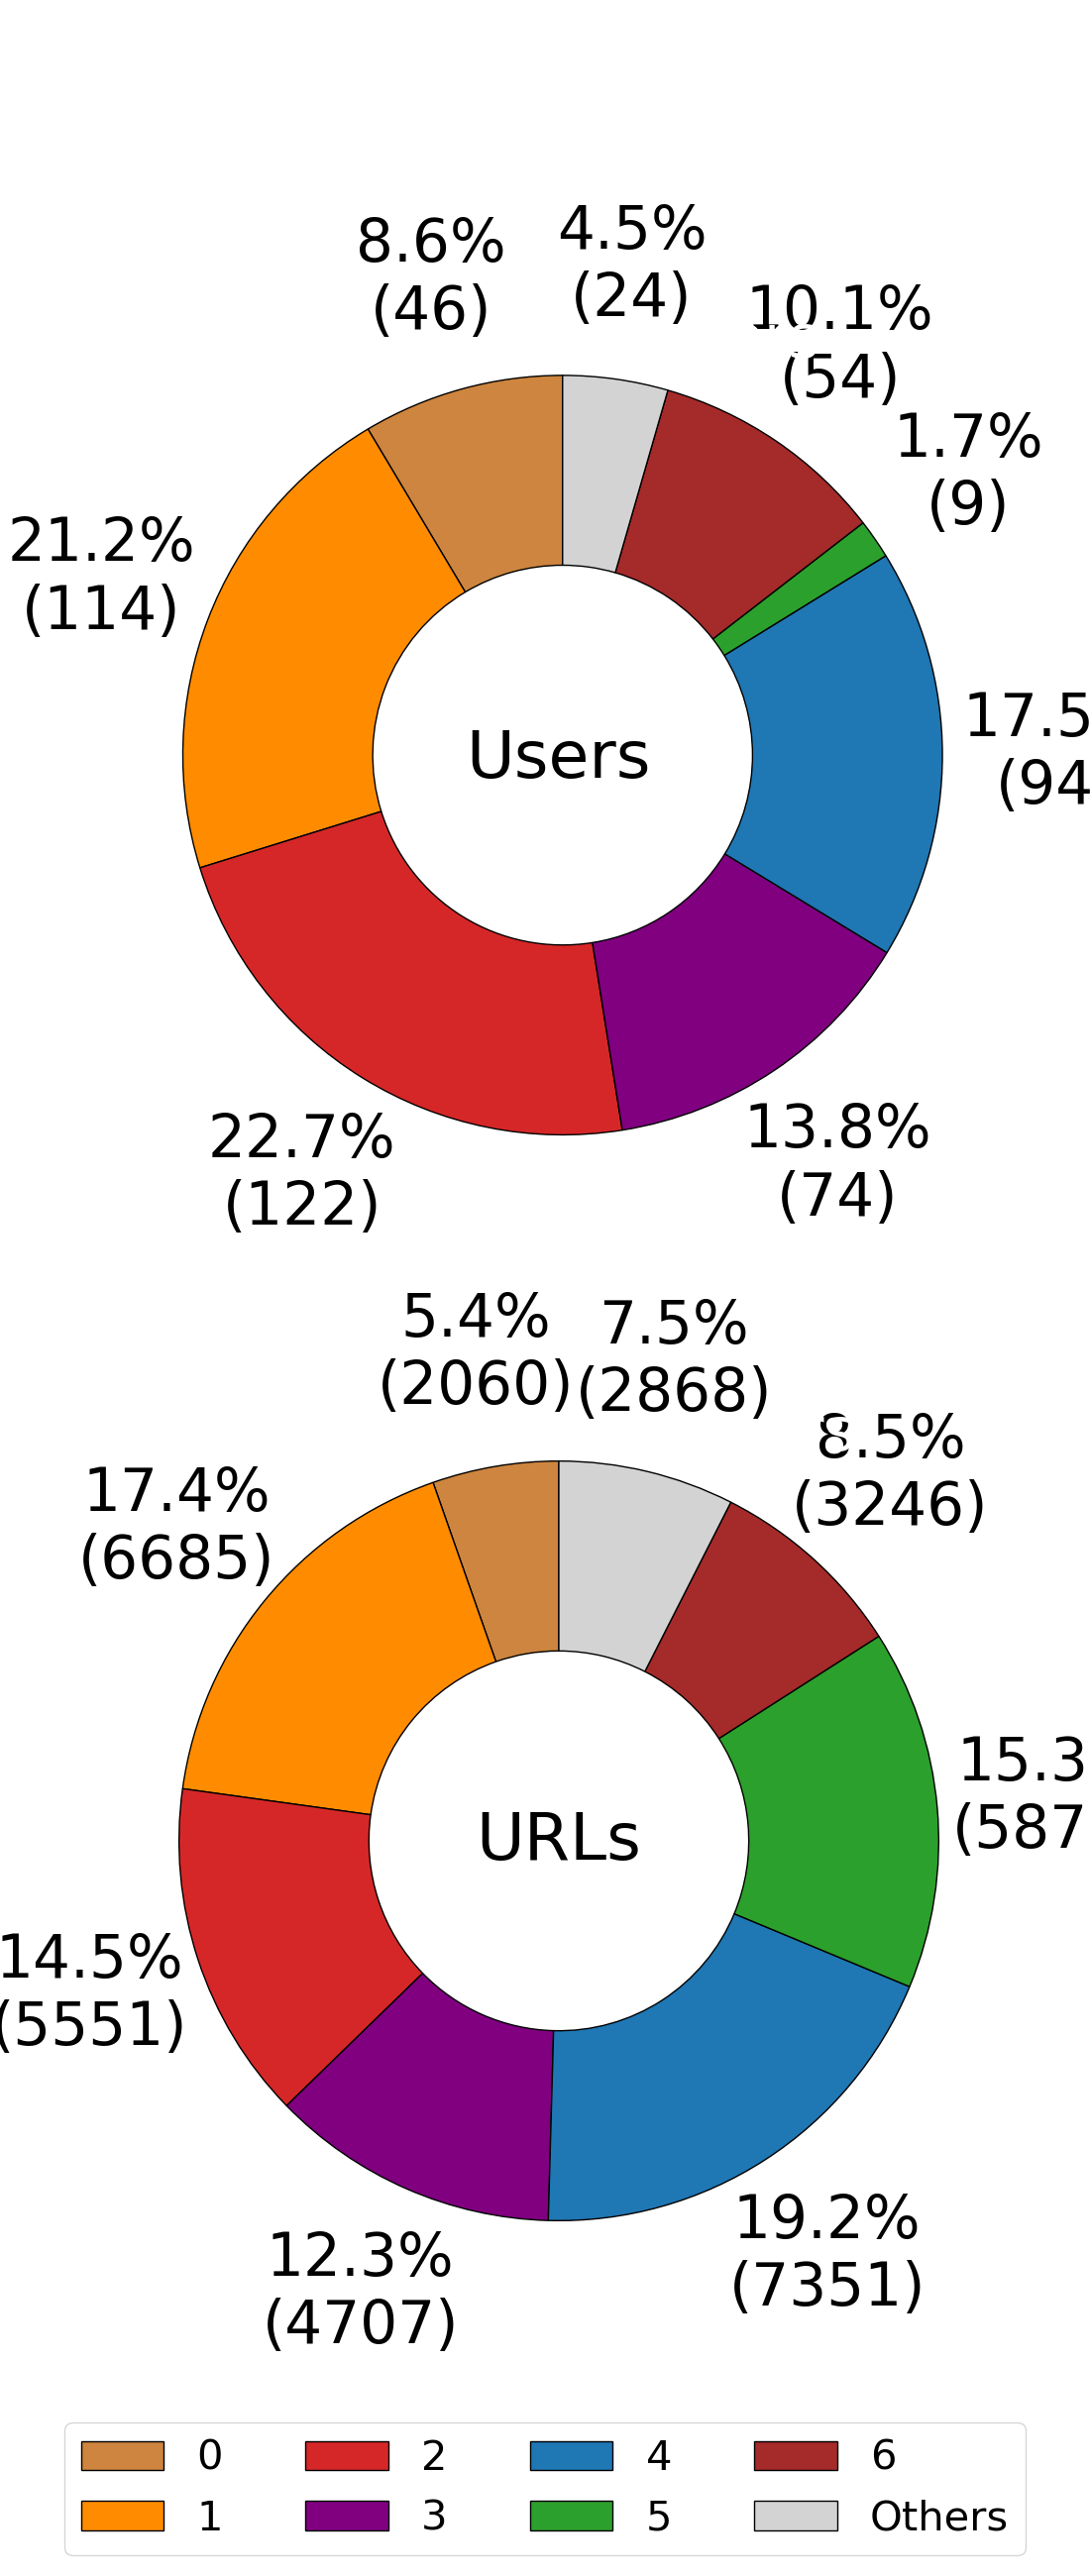
The left panel of Fig. 4 shows how the 566 users cluster into different user NECs while, on the right, a statistical insight regarding the 566 users associated with the user NEC is provided. On the right, the top doughnut chart illustrates the largest communities based on user count. Each of these prominent user NECs (IDs 0, 1, 2, 3, 4, 5 and 6) accounts for at least of the total user population within this kind of communities.
Furthermore, the bottom doughnut graph reveals that these aforementioned communities exhibit the highest frequency of tweets containing URLs. Communities 1, 2, 3, 4, and 5 collectively contribute to over of the overall URL traffic generated by all user NEC communities.
An analogous analyses of the URL NECs, i.e. the community detected on the validated projection on the layer of the URLs can be found in Section B in the appendix.
2.4 Echo chambers
Remarkably, results show that all 566 accounts (but one) belonging to the various user NECs are also part of the same DiCo, i.e. FdI-L-Media.
Nonetheless, the fact that all users in the user NECs belong to the same DiCo tells us only that users with similar “information diets” contribute to the formation of the same discourse, but not that they influence each other and reinforce the opinions of their siblings. Otherwise stated, users referring to the same news sources may never meet each other on the platform. In fact, the information about who interacts with whom is not used in the detection of user NECs.
As stated in the introduction, users in an echo chamber are users exposed to the same opinions and to the same news sources. The former part, translated to Twitter, means that they retweet each other.
In this sense, when users in the same user NEC form a (weakly) connected component in the same DiCo-induced subgraph of the retweet network (that is when there is a flux of influence in the retweet network restricted to nodes in the same discursive community), they form an echo chamber.
Remarkably, just a small minority of accounts in user NECs –only 92 out of 565– does not participate to an echo chamber. In particular, all users in user NECs 8, 9 and 10 did not retweet, on the subject under analysis, others in the same user NEC. Regarding the other user NECs, we observe that for each of them, the greatest part of nodes forms echo chambers.
In the following, echo chambers inherit the ID of their user NEC;
some echo chambers are relatively big: for instance, the ones induced by user NECs 1 and 2 include more than 100 nodes.
To study how much users in these echo chambers are tied together, we use the undirected clustering coefficient: disregarding the direction of the edges, it captures the observed frequency of interactions among the neighbours of each node [18]. We do not consider the direction of the interactions since it is not particularly relevant who is retweeting who, at this point. In the following, the clustering coefficients for the various user NECs are calculated on the subgraph of the retweet network including only nodes in the same user NEC.
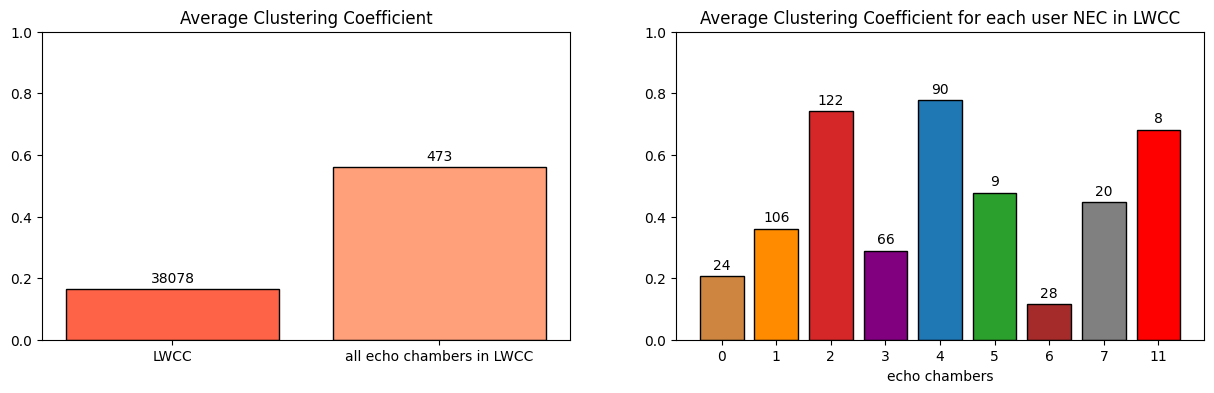
We compare the clustering coefficients of the echo chambers with the one measured on the Largest Weakly Connected Component (LWCC) of the retweet network restricted to users in the FdI-L-Media DiCo. In this way, we have a benchmark that captures the main contribution to the discourse to which the echo chambers belong.
The clustering coefficient associated with users in echo chambers is more than three times as high as that for other users within the LWCC ( compared to , see the left panel of Fig. 5).
Then, we examine the average clustering coefficient inside each echo chamber. The right panel of Fig. 5 shows that the average clustering coefficients of echo chambers , , and are greater than 0.5.
High values of the clustering coefficient imply that the activity of users in these groups contributes to the reinforcement of their opinions since all accounts therein are particularly connected among themselves and frequently endorse the content shared by their friends in the user NEC. Such a suggestion is confirmed by a manual investigation of the content shared by users in echo chambers after nearly 2 years’ time: the positions of users therein adhere to conspiracy theories and are particularly extreme. More details can be found in Section C in the appendix.
2.4.1 Echo chambers and their role in the common discourse
In the present subsection, we consider the fluxes of tweets among echo chambers and between echo chambers and the rest of the DiCo they belong to.
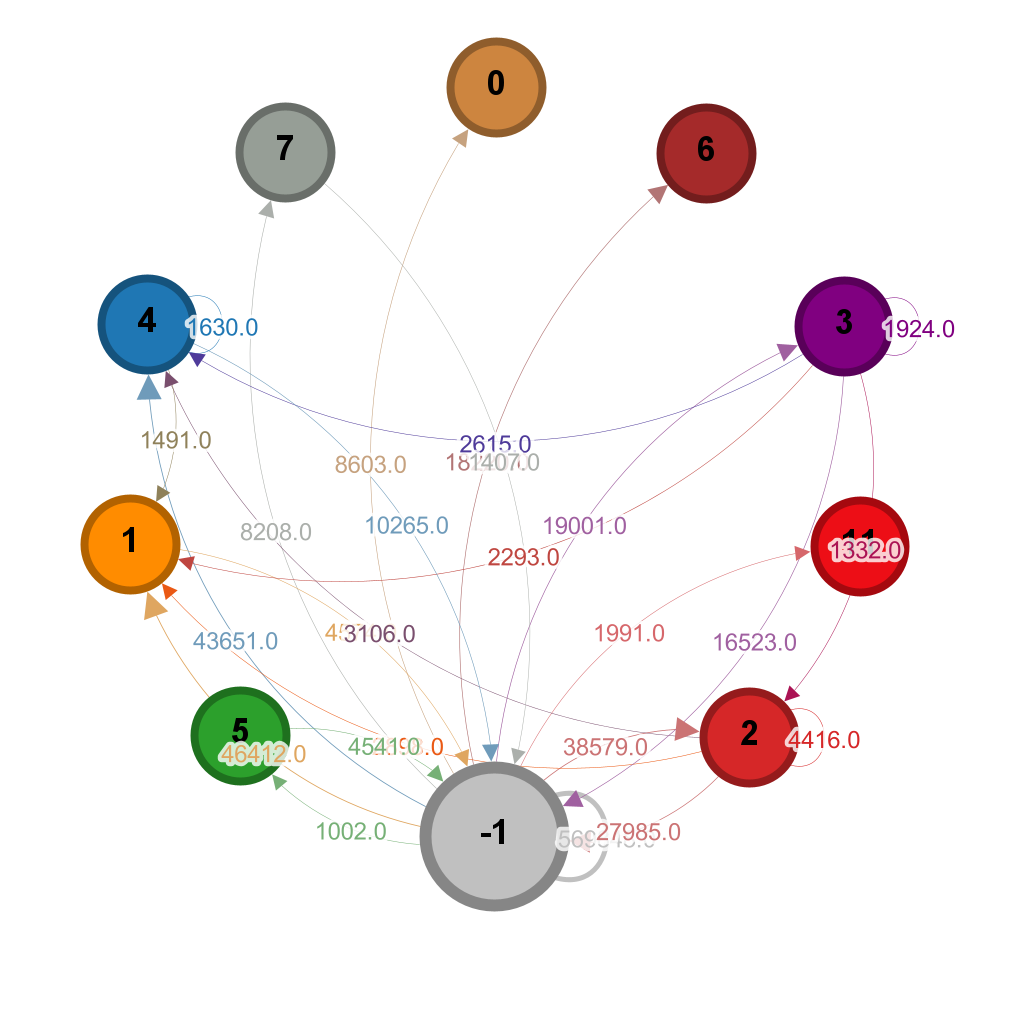
In Fig. 6, node represents all nodes in the DiCo not included in an echo chamber and an arrow indicates that tweets published by the source group are retweeted by a certain number of users in the destination group. Self-loops represent retweet activity within the same group. The values on the edges indicate the number of retweets associated with each interaction.
Despite the echo chambers being composed of a small number of users (order of , compared to the total number of DiCo users, order of ), they significantly contribute to the retweet activity of the DiCo. Specifically, echo chambers are involved in generating approximately 288k retweets, while users not in echo chambers generate around 569k retweets. More in detail, echo chambers 2 and 3 are primarily composed of popular users (in terms of received retweets), while others are primarily composed of retweeting users (, , ).
Remarkably, in our dataset users in echo chambers are particularly affected by misinformation: the probability that a link shared by an echo chamber users refers to a not-trustworthy source is 0.377, against 0.129 for other users. The trend is reverted when considering the trustworthy sources: the probability that a link shared by a user in an echo chamber refer to a trustworthy source is 0.232, against 0.379 for the other users.
More information regarding the quality of the content shared in the echo chambers can be found in Section D in the appendix.
3 Discussion
In the present paper, we proposed a novel procedure to detect echo chambers. The method is mainly based on two observations.
First, echo chambers form when users interact with others expressing similar opinions and referring to the same news. In fact, the placement in a social context with the same political alignment reinforces users’ beliefs and brings to polarization.
Secondly, in order to detect a genuine signal, a proper null-model should be implemented. This necessity was recently highlighted in the literature of Online Social Networks and it was shown to be particularly important for the detection of non-trivial phenomena [10, 19, 11, 13, 20, 21].
Definitively, our echo chamber detection method is based on the validation of observed structures through comparison with a proper maximum-entropy null-model; furthermore the maximization of the entropy guarantees for the unbiased nature of the benchmark.
We tested our procedure on a dataset including the Italian Twitter debate about Covid-19 vaccination: we found that our procedure detected a low presence of echo chambers (just less than 2% of all users in our dataset belong to an echo chamber). Remarkably, all echo chambers that we detected are part of the same discursive community, i.e. a community of users sharing similar political positions. Even if their dimension in terms of the number of users is limited, their impact on the shared discourse is remarkable: echo chambers are responsible for nearly one-third of the retweets in their discursive communities.
Let us remark that our methodology is easily extendable to any other online social network. In fact, it is based on i) the analysis of the activity of accounts sharing URLs to news sources and ii) the detection of discursive communities. While the extension of the former to other online social networks is straightforward, the latter may be more problematic: in the present case, we used the activity of verified users, that are among the main creators of content in Twitter [10], but not all social platforms have such a certification. Nevertheless, in analysing other platforms, we can still focus on users that are particularly active in the formation of a common discourse, as, for instance, influential users, as defined in [22].
Not differently from other studies, ours has some limitations, that, anyway, we believe do not affect our final conclusions.
First, it may be argued that the validation procedure is quite strict: the validation of multiple p-values results in validating extreme events (see Section E in the appendix). It is indeed true, but nevertheless, it is the only way to rule out random noise from the system and analyse the genuine signal.
Secondly, the main idea of echo chambers is that users follow accounts that have similar ideas, while in the present study, just the retweet network is used, not the information about friendship. Nevertheless,
the retweet network captures the effective interactions with interesting content, as perceived by the various users, may it come from friends or may be suggested by the platform itself: focusing on friendship only will fail to capture completely the effect of Twitter’s recommendation algorithm.
Finally, another criticism could be about the news engagement: in fact, we are considering users sharing URLs, i.e. those that not only liked the content but decided to share it either via tweets or retweets. Of course, such an approach has twofold limitations. On the one hand, by capturing only tweets and retweets, we lost part of the information about users engaging with a piece of news, but not enough to share it via the online social network platform. On the other hand, by focusing only on the URLs shared, we missed the polarising content that does not display any URL. While the former is sort of unavoidable, the latter surely represents a conservative approach. However, please consider also that by focusing on URLs, we limit the a priori intervention of researchers: all our annotations were made by a third-party fact-checker (i.e. NewsGuard, https://www.newsguardtech.com). In the analysis of texts, the authors should annotate various keywords that they assign to different political leanings, thus introducing a bias in the study, due to the authors’ perception.
4 Methods
4.1 Network analysis methods
Recently, De Clerck et al. stress the importance of using proper statistical benchmarks for the analyses of Online Social Networks [20, 21]: in fact, such systems are affected by strong noise and detecting genuine signals is fundamental in order to drive the proper conclusions. In fact, our procedure for the detection of echo chambers is based on the statistical validation of different co-occurrence networks. Co-occurrences are implicitly based on a bipartite structure: if we count, for instance, the number of URLs that have been shared by both a pair of users, we are implicitly projecting the information contained in a bipartite network in which layers represent users and URLs on the layer of users. Therefore, it is natural to discount bipartite information from observed co-occurrences.
A general framework for providing unbiased benchmarks for the analysis of complex networks was recently proposed in the literature [9], inspired by the derivation of Statistical Physics from Information Theory by Jaynes [23]. The main idea is to first create an ensemble of all graphs having the same number of nodes as in real systems. We can then define the Shannon entropy associated with the ensemble: in order to have a maximally random benchmark, we maximise the Shannon entropy, constraining some defining quantities about the system. In this sense, by comparing the real network with our null-model, all observations that cannot be explained by the constraints can be captured. Constraints can be global, as the total number of links, or local, as the degree sequence, i.e. the number of connections per node.
In the following, we will first introduce the Bipartite Configuration Model (BiCM, [24]), i.e. the application of the procedure described above to bipartite networks in which the degree sequences are the constraints. Then we will describe the validation procedure for co-occurrences, proposed in Ref. [25]. Both the BiCM and the validation procedure used in the present manuscript were performed using the bicm111https://pypi.org/project/bicm/ python module included in NEMtropy222https://pypi.org/project/NEMtropy/; the methods used to solve BiCM system of equations implemented in NEMtropy and bicm can be found in Ref. [26].
4.1.1 Formalism
In a bipartite network, nodes are divided into two sets, called layers and links exist only between nodes belonging to different layers. Given a bipartite network , let us call its layers and , respectively, and and their dimensions. Then, a bipartite binary network is completely described by its biadjacency matrix , i.e. a rectangular matrix whose generic entry is either 1 or 0 if there exists a link connecting node and or not. The degree of a generic node () is simply (). In the following, quantities related to real networks will be indicated with an asterisk .
4.1.2 BiCM
Let us call the ensemble of graphs of the Bipartite Configuration Model in which each representative graph is a bipartite network333Since all networks will have the same number of nodes in each layer, asterisks will fall only from and .. We define the Shannon entropy associated with the system as
| (1) |
We can perform a constrained maximisation of the Shannon entropy using the methods of Lagrangian multipliers, the constraints being the degree sequences of both layers, i.e. and . In this way, we will achieve a benchmark that is maximally random, but, in which the average degree sequences are equal to the ones observed in the real system. Therefore, by observing deviations from the null-model we will detect all structures of the real system that cannot be simply explained by the constraints. Such a procedure can be achieved through the maximisation of the function defined as
where is the Shannon entropy defined in Eq. 1 and , and are the Lagrangian multipliers associated, respectively, to the normalization of the probability, to the degree sequence on layer and to the degree sequence on layer . The maximization of returns a probability per graph that can be written in terms of independent probabilities per link [27]:
| (2) |
Eq. 2 is just formal since we do not know the numerical value of Lagrangian multipliers and . This can be obtained through the maximization of the likelihood of observing the real system [28, 29]. It can be shown that maximising the likelihood is equivalent to set:
In Section E of the appendix it is described in detail how to use the Bipartite Configuration Model as a statistical benchmark to validate the cooccurrences observed in the real network.
4.2 Discursive communities
As stated above and described in details in Section E of the appendix, the BiCM described above can be used as a statistical benchmark to highlight groups of users contributing to the formation of the same discourse. On Twitter, this translates to groups of users endorsing similar content. In Ref. [10] a procedure was proposed, later refined in Ref.s [19, 12, 13]. The rationale is to consider who are the creators of content and how to capture similarities among them. It has been observed in several studies that verified accounts, i.e. the ones for which the Twitter platform checked the identity of their owners –at least in the pre-Musk era– are strong creators of content [10, 19]. It is possible, then, to infer how similar they are perceived by the “general” public of unverified users by using a bipartite representation: if verified and unverified users are the two layers of a bipartite network in which the (undirected) links represent retweets444In the present construction, a link connecting a verified users with a non verified is at least one of them has retweeted the other at least once. Due to the strong production activity of verified accounts, most of the links are from the layer of verified users to the opposite one., we can validate the projection on the layer of verified users. In this way, we will detect non-trivial similarities in the common audience of unverified users: otherwise stated, if a couple of verified users are retweeted by the same (non-verified) users, they are probably sharing similar positions.
In the monopartite validated projection of verified users, communities were detected using an optimized version of Louvain algorithm [30]: since Louvain is known to be node-order dependent [31], the order of the nodes is shuffled 1000 and the configuration displaying the greatest value of the modularity is chosen.
The labels of the communities found through the community detection are then propagated in the retweet network: in fact, it is an old result that Twitter users endorse content created by others much more with retweets than with mentions [14, 15, 16]. Since in many cases, some strong creators of content are not verified (and therefore run the risk of not getting a label), we run the label propagation algorithm on the undirected version of the retweet network: the rationale is that not only the sources give an indication of the user orientation, but also her audience. Otherwise stated, if the majority of a user audience has a clear orientation, it is presumable that the considered user also has the same one. For propagating labels, we implemented the procedure proposed in Ref. [32].
4.3 News engagement communities
4.3.1 URL manipulation
To detect similarities in users’ endorsement of pieces of news, we first need to pre-process URL contained in the various tweets. Sharing a compact version of a URL allows for the sharing of long URLs in tweets while maintaining the maximum character limit. For our analyses, we translated all shortened links into their original long versions. This enabled us to (i) read the top-level domain of the news source to assign a nutrition label using NewsGuard and (ii) use the long links as unique identifiers for each shared news item in our network models.
4.3.2 NEC communities
In order to find users sharing similar “information diets”, i.e. engaging with the same URLs, we used the same approach as in Ref. [17]. We first represented users sharing (either via tweets or retweets) URLs as a bipartite network of users and URLs. Then, we projected the information contained therein on the layer of users and finally validated the projection using the procedure described above. As mentioned in Section 2.3, the fraction of validated nodes, in this case, is extremely limited, i.e. nearly , signalling that most of the users’ endorsement to URLs (and so pieces of news) is compatible with the random noise. Again, in order to find communities of users in the validated projection network, the reshuffled version of Louvain was used.
While in the context of discursive communities, the validated projection on the layer of unverified users is of limited benefit (since there are many unverified users not interacting with verified accounts), in the case of news engagement the validated projection on the layer of URLs permits to characterize more in detail the way the users make use of the news. In this case, the percentage of validated nodes is much greater, reaching . Again, we implemented the Louvain algorithm to highlight communities of URLs.
Acknowledgments
Work partially supported by the Integrated Activity Project TOFFEe (TOols for Fighting FakEs) https://toffee.imtlucca.it/. The authors thank Emanuele Brugnoli, Stefano Guarino, Walter Quattrociocchi and Fabiana Zollo for insightful discussions.
Declarations
The authors declare no competing interests.
References
- \bibcommenthead
- [1] Jamieson, K. & Cappella, J. Echo Chamber: Rush Limbaugh and the Conservative Media Establishment (Oxford University Press, 2008).
- [2] Garrett, R. K. Echo chambers online?: Politically motivated selective exposure among internet news users. Journal of Computer-Mediated Communication 14, 265–285 (2009).
- [3] Del Vicario, M. et al. The spreading of misinformation online. Proceedings of the National Academy of Sciences 113, 554–559 (2016).
- [4] Gangware, C. & Nemr, W. Weapons of Mass Distraction: Foreign State-Sponsored Disinformation in the Digital Age (Park Advisors, 2019).
- [5] Ceron, A. Internet, news, and political trust: The difference between social media and online media outlets. Journal of computer-mediated communication 20, 487–503 (2015).
- [6] Valkenburg, P. M. & Peter, J. Comm research—views from europe— five challenges for the future of media-effects research. International Journal of Communication 7, 19 (2013).
- [7] Pennycook, G. & Rand, D. G. Lazy, not biased: Susceptibility to partisan fake news is better explained by lack of reasoning than by motivated reasoning. Cognition 188, 39–50 (2019). URL https://www.sciencedirect.com/science/article/pii/S001002771830163X. The Cognitive Science of Political Thought.
- [8] Zollo, F. et al. Debunking in a world of tribes. PLoS ONE 7:e0181821 (2017). URL https://doi.org/10.1371/journal.pone.0181821.
- [9] Cimini, G. et al. The statistical physics of real-world networks. Nature Reviews Physics 1, 58–71 (2018). URL http://www.nature.com/articles/s42254-018-0002-6.
- [10] Becatti, C., Caldarelli, G., Lambiotte, R. & Saracco, F. Extracting significant signal of news consumption from social networks: the case of twitter in italian political elections. Palgrave Communications 5, 1–16 (2019).
- [11] Caldarelli, G., Nicola, R. D., Petrocchi, M., Pratelli, M. & Saracco, F. Flow of online misinformation during the peak of the covid-19 pandemic in italy. EPJ Data Science 2021 10:1 10, 1–23 (2021). URL https://epjdatascience.springeropen.com/articles/10.1140/epjds/s13688-021-00289-4.
- [12] Radicioni, T., Saracco, F., Pavan, E. & Squartini, T. Analysing twitter semantic networks: the case of 2018 italian elections. Scientific Reports 2021 11:1 11, 1–22 (2021). URL https://www.nature.com/articles/s41598-021-92337-2.
- [13] Mattei, M., Pratelli, M., Caldarelli, G., Petrocchi, M. & Saracco, F. Bow-tie structures of twitter discursive communities. Scientific Reports 2022 12:1 12, 1–23 (2022). URL https://www.nature.com/articles/s41598-022-16603-7.
- [14] Conover, M., Ratkiewicz, J. & Francisco, M. Political polarization on twitter. Icwsm (2011).
- [15] Conover, M. D., Gonçalves, B., Ratkiewicz, J., Flammini, A. & Menczer, F. Predicting the political alignment of twitter users (2011).
- [16] Conover, M. D., Gonçalves, B., Flammini, A. & Menczer, F. Partisan asymmetries in online political activity. EPJ Data Science (2012).
- [17] Guarino, S., Pierri, F., Giovanni, M. D. & Celestini, A. Information disorders during the COVID-19 infodemic: The case of italian facebook. Online Soc. Networks Media 22, 100124 (2021). URL https://doi.org/10.1016/j.osnem.2021.100124.
- [18] Caldarelli, G. Scale-Free Networks Complex Webs in Nature and Technology (Oxford University Press, 2010).
- [19] Caldarelli, G. et al. The role of bot squads in the political propaganda on twitter. Communications Physics 3, 1–15 (2020).
- [20] Clerck, B. D., Rocha, L. E. C. & Utterbeeck, F. V. Maximum entropy networks for large scale social network node analysis. Applied Network Science 2022 7:1 7, 1–22 (2022). URL https://appliednetsci.springeropen.com/articles/10.1007/s41109-022-00506-7.
- [21] Clerck, B. D. et al. Maximum entropy networks applied on twitter disinformation datasets. Studies in Computational Intelligence 1016, 132–143 (2022). URL https://link.springer.com/chapter/10.1007/978-3-030-93413-2_12.
- [22] González-Bailón, S., Borge-Holthoefer, J. & Moreno, Y. Broadcasters and hidden influentials in online protest diffusion. American Behavioral Scientist (2013).
- [23] Jaynes, E. Information theory and statistical mechanics. The Physical Review 106, 181–218 (1957).
- [24] Saracco, F., Clemente, R. D., Gabrielli, A. & Squartini, T. Randomizing bipartite networks: the case of the world trade web. Scientific Reports 5, 10595 (2015). URL http://www.nature.com/articles/srep10595.
- [25] Saracco, F. et al. Inferring monopartite projections of bipartite networks: an entropy-based approach. New Journal of Physics 19, 053022 (2017).
- [26] Vallarano, N. et al. Fast and scalable likelihood maximization for exponential random graph models with local constraints. Scientific Reports 11 (2021).
- [27] Park, J. & Newman, M. E. J. Statistical mechanics of networks. Physical Review E - Statistical, Nonlinear, and Soft Matter Physics 70 (2004).
- [28] Garlaschelli, D. & Loffredo, M. I. Maximum likelihood: Extracting unbiased information from complex networks. Physical Review E - Statistical, Nonlinear, and Soft Matter Physics 78, 1–5 (2008).
- [29] Squartini, T. & Garlaschelli, D. Analytical maximum-likelihood method to detect patterns in real networks. New Journal of Physics 13 (2011).
- [30] Blondel, V. D. et al. Fast unfolding of communities in large networks. Journal of Statistical Mechanics: Theory and Experiment 10008, 6 (2008). URL http://arxiv.org/abs/0803.0476.
- [31] Fortunato, S. Community detection in graphs. Physics Reports 486, 75–174 (2010).
- [32] Raghavan, U. N., Albert, R. & Kumara, S. Near linear time algorithm to detect community structures in large-scale networks. Physical Review E - Statistical, Nonlinear, and Soft Matter Physics (2007).
- [33] Zollo et al. Emotional dynamics in the age of misinformation. Plos One (2016).
- [34] Nickerson, R. S. Confirmation bias: A ubiquitous phenomenon in many guises. Review of general psychology 2, 175–220 (1998).
- [35] Klayman, J. in Varieties of confirmation bias (eds Busemeyer, J., Hastie, R. & Medin, D. L.) , Vol. 32 of Psychology of Learning and Motivation 385–418 (Academic Press, 1995).
- [36] Weaver, I. S. et al. Communities of online news exposure during the uk general election 2015. Online Social Networks and Media 10-11, 18–30 (2019). URL https://www.sciencedirect.com/science/article/pii/S2468696418301290.
- [37] Benjamini, Y. & Hochberg, Y. Controlling the false discovery rate: a practical and powerful approach to multiple testing. Journal of the Royal Statistical Society B 57, 289–300 (1995).
Appendix A Literature Review
The detection of echo chambers has been generally approached by the literature starting from online content whose nature is known a priori.
Through the analysis of the social accounts that interact with specific content, e.g. via likes, shares, retweets, and comments, it has been shown how information relating to specific narratives attracts distinct communities. Work in [3], by Del Vicario et al., focuses on public Facebook pages divided into two groups: conspiracy theories and news about science (conspiracy theories are ‘the pages that disseminate alternative, controversial information, often lacking supporting evidence’ [3]). The findings are that users are divided into homogeneous clusters: by analysing the accounts that share news about science and conspiracies, they are bound by ties of friendship in the network. Quoting the authors: ‘different contents generate different echo chambers, characterized by the high level of homogeneity inside them’.
Homogeneity is not only about friendship, but also about emotional approach and reaction to debunking attempts.
Zollo et al., in [33], establish how users polarised on conspiracies express more negative feelings in their comments than users polarised on science news.
Work in [8] confirms how the echo chamber paradigm goes hand in hand with the confirmation bias phenomenon –the users’ tendency to look for, prefer and interpret information in line with their thoughts [34, 35], while ignoring or downplaying evidence that contradicts their beliefs: interactions with debunking posts (i.e., posts that provide fact-checked information to specific topics) are overwhelmingly from users biased towards science or non-biased users.
The above examples show how echo chambers emerge by analysing thematic pages and noting that users divide into distinct communities according to the page topic. Going deeper, it also emerges that consecutively sharing users are linked by friendship links on the network.
Interestingly for the purpose of this article, other studies have instead analysed the dynamics of information exposure by considering the news URLs present in the posts. This is the case, e.g., of work by Weaver et al. [36], in which the network of densely-connected news articles is constructed. It starts from the number of news URLs shared by each user, to arrive at the weighted network of news URLs in which the weights between two URLs identify how many users have re-shared the URL pair.
Leveraging a state-of-the-art community detection algorithm, communities of co-shared news items are found, distinct in terms of political leaning (i.e., left-leaning and right-leaning).
Guarino et al., in [17], consider public Facebook pages, without however knowing a priori the kind/quality/reputability of their content. Focusing on the activity of users sharing links to pieces of online news, the authors construct the bipartite network of users/shared URLs and apply the Bipartite Configuration Model (BiCM) introduced in [25] to project the bipartite network on the two levels, the user level and the URL level. Applying the BiCM assures that two accounts (resp., two URLs) are connected if the number of URLs shared by both the accounts (resp., if the number of accounts sharing both the URLs) is so large that it cannot be explained by the degree distribution of the two layers only.
Appendix B NECs of URLs
Table 3 summarises the breakdown of URLs into URL NECs: just 22% of all URLs are validated by our procedure.
| Comm. ID | No. URL |
|---|---|
| Non-validated | 179,175 |
| Validated | 51,504 |
| Comm. ID | No. Users | verified | distinct URL | sources | No.URL |
|---|---|---|---|---|---|
| 4 | 7422 | 16 | 223 | 71 | 38731 |
| 1 | 674 | 1 | 79 | 9 | 2234 |
| 6 | 876 | 0 | 87 | 5 | 2019 |
| 11 | 1064 | 4 | 21 | 4 | 1681 |
| 7 | 521 | 0 | 64 | 6 | 1613 |
| 10 | 65 | 1 | 27 | 9 | 1557 |
| 9 | 584 | 1 | 58 | 1 | 1238 |
| 5 | 311 | 0 | 23 | 6 | 562 |
| 12 | 175 | 1 | 28 | 4 | 408 |
| 3 | 101 | 1 | 79 | 1 | 393 |
| 0 | 161 | 0 | 55 | 1 | 365 |
| 8 | 149 | 0 | 25 | 1 | 308 |
| 13 | 253 | 0 | 3 | 3 | 304 |
| 14 | 42 | 0 | 4 | 2 | 59 |
| 2 | 23 | 0 | 3 | 3 | 32 |
More details can be found in Table 4, which shows some information about the various URL NECs. URL NEC 4 is the largest in terms of both size (composed of 223 nodes) and impact on the overall dataset, as captured by the number of shares (k shares).
The remaining URL NECs can be distinguished based on the order of magnitude of shares: we have 6 communities whose URLs were shared thousands of times, and other communities whose URLs were shared hundreds or dozens of times. Remarkably, in all URL NECs but 4 the number of different sources is quite limited (whereby source we mean the online news outlet that published the news to which that URL points).
To have a finer description of URL NECs, we explore the frequency of non-reputable sources therein.
For each URL pointing to a news article, we consider the corresponding second-level domain555https://en.wikipedia.org/wiki/Domain_name, which refers to the name directly to the left of .com, .net, and other top-level domains (as for example nytimes.com and latimes.com). We then associate –when possible– the domains to the publishers and annotate the former using the labels provided for thye latter by the NewsGuard fact-checking website (https://www.newsguardtech.com/).
In this sense, the reputability of a URL is inherited from the reputability of its domain/publisher, i.e. a piece of news is considered more or less reputable according to the reputability of its publisher.
Following the NewsGuard classification, the labels T (‘Trustworthy’), N (‘Not trustworthy’), and UNC (‘Unclassified’) stand for the degree of reputability of the publishers. More details on the way the information from NewsGuard was processed can be found in Section F.
The first observation is that URL NECs are a receptacle of non-trustworthy sources, see Fig. 7. With respect to the total number of distinct URLs in our dataset, URL NECs capture less than one-half of trustworthy ones, while almost all non-trustworthy ones.
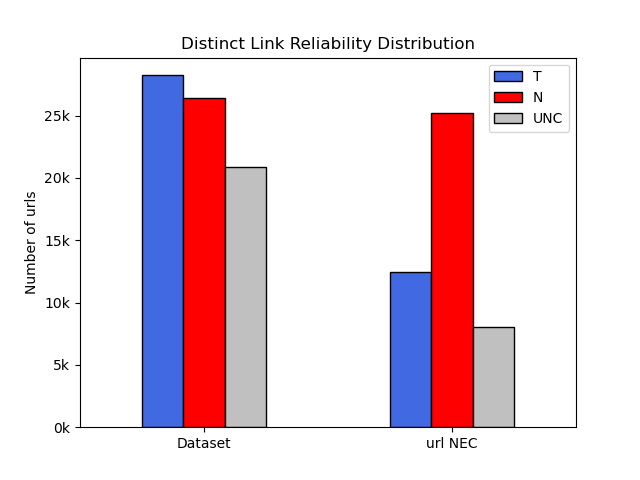
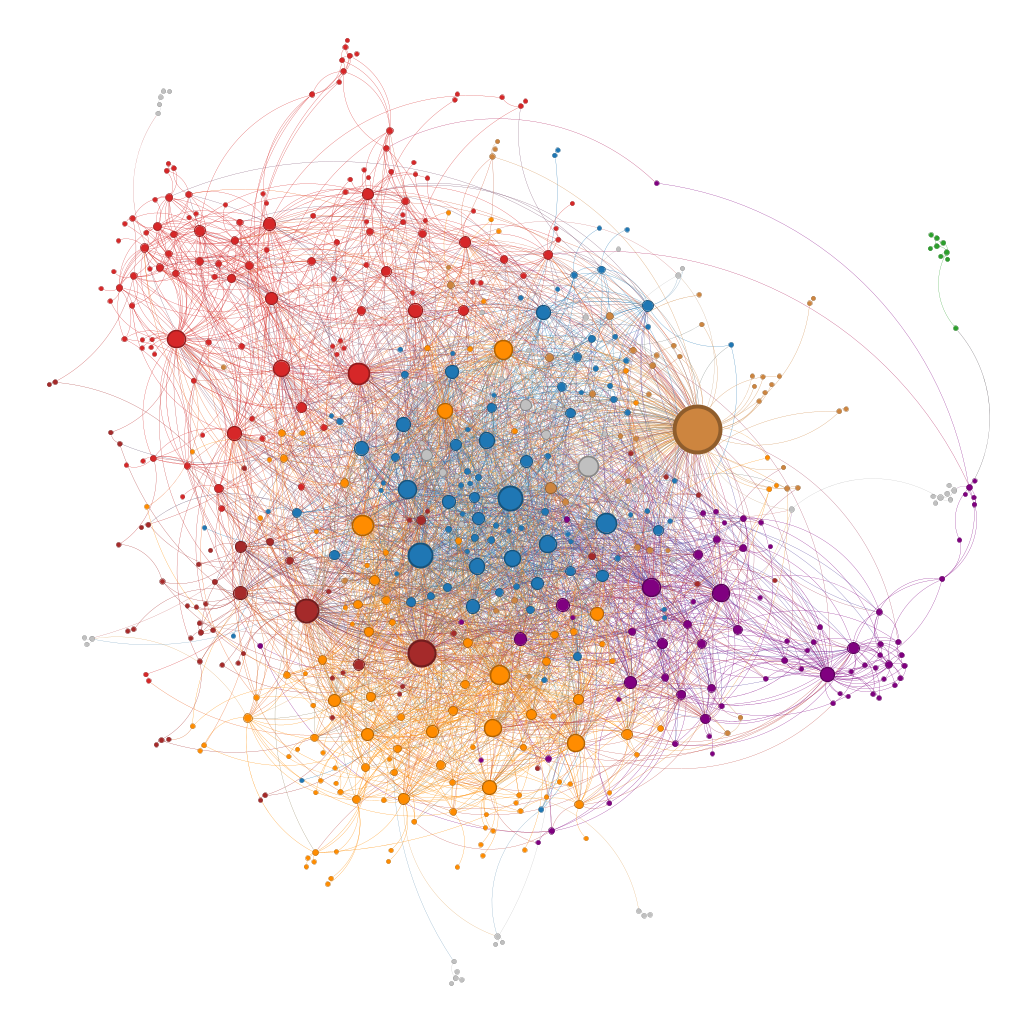
Fig. 8 pictorially shows the network of URL NECs, as it emerges from the data. The various communities display a strong homogeneity in the reputability of their sources.
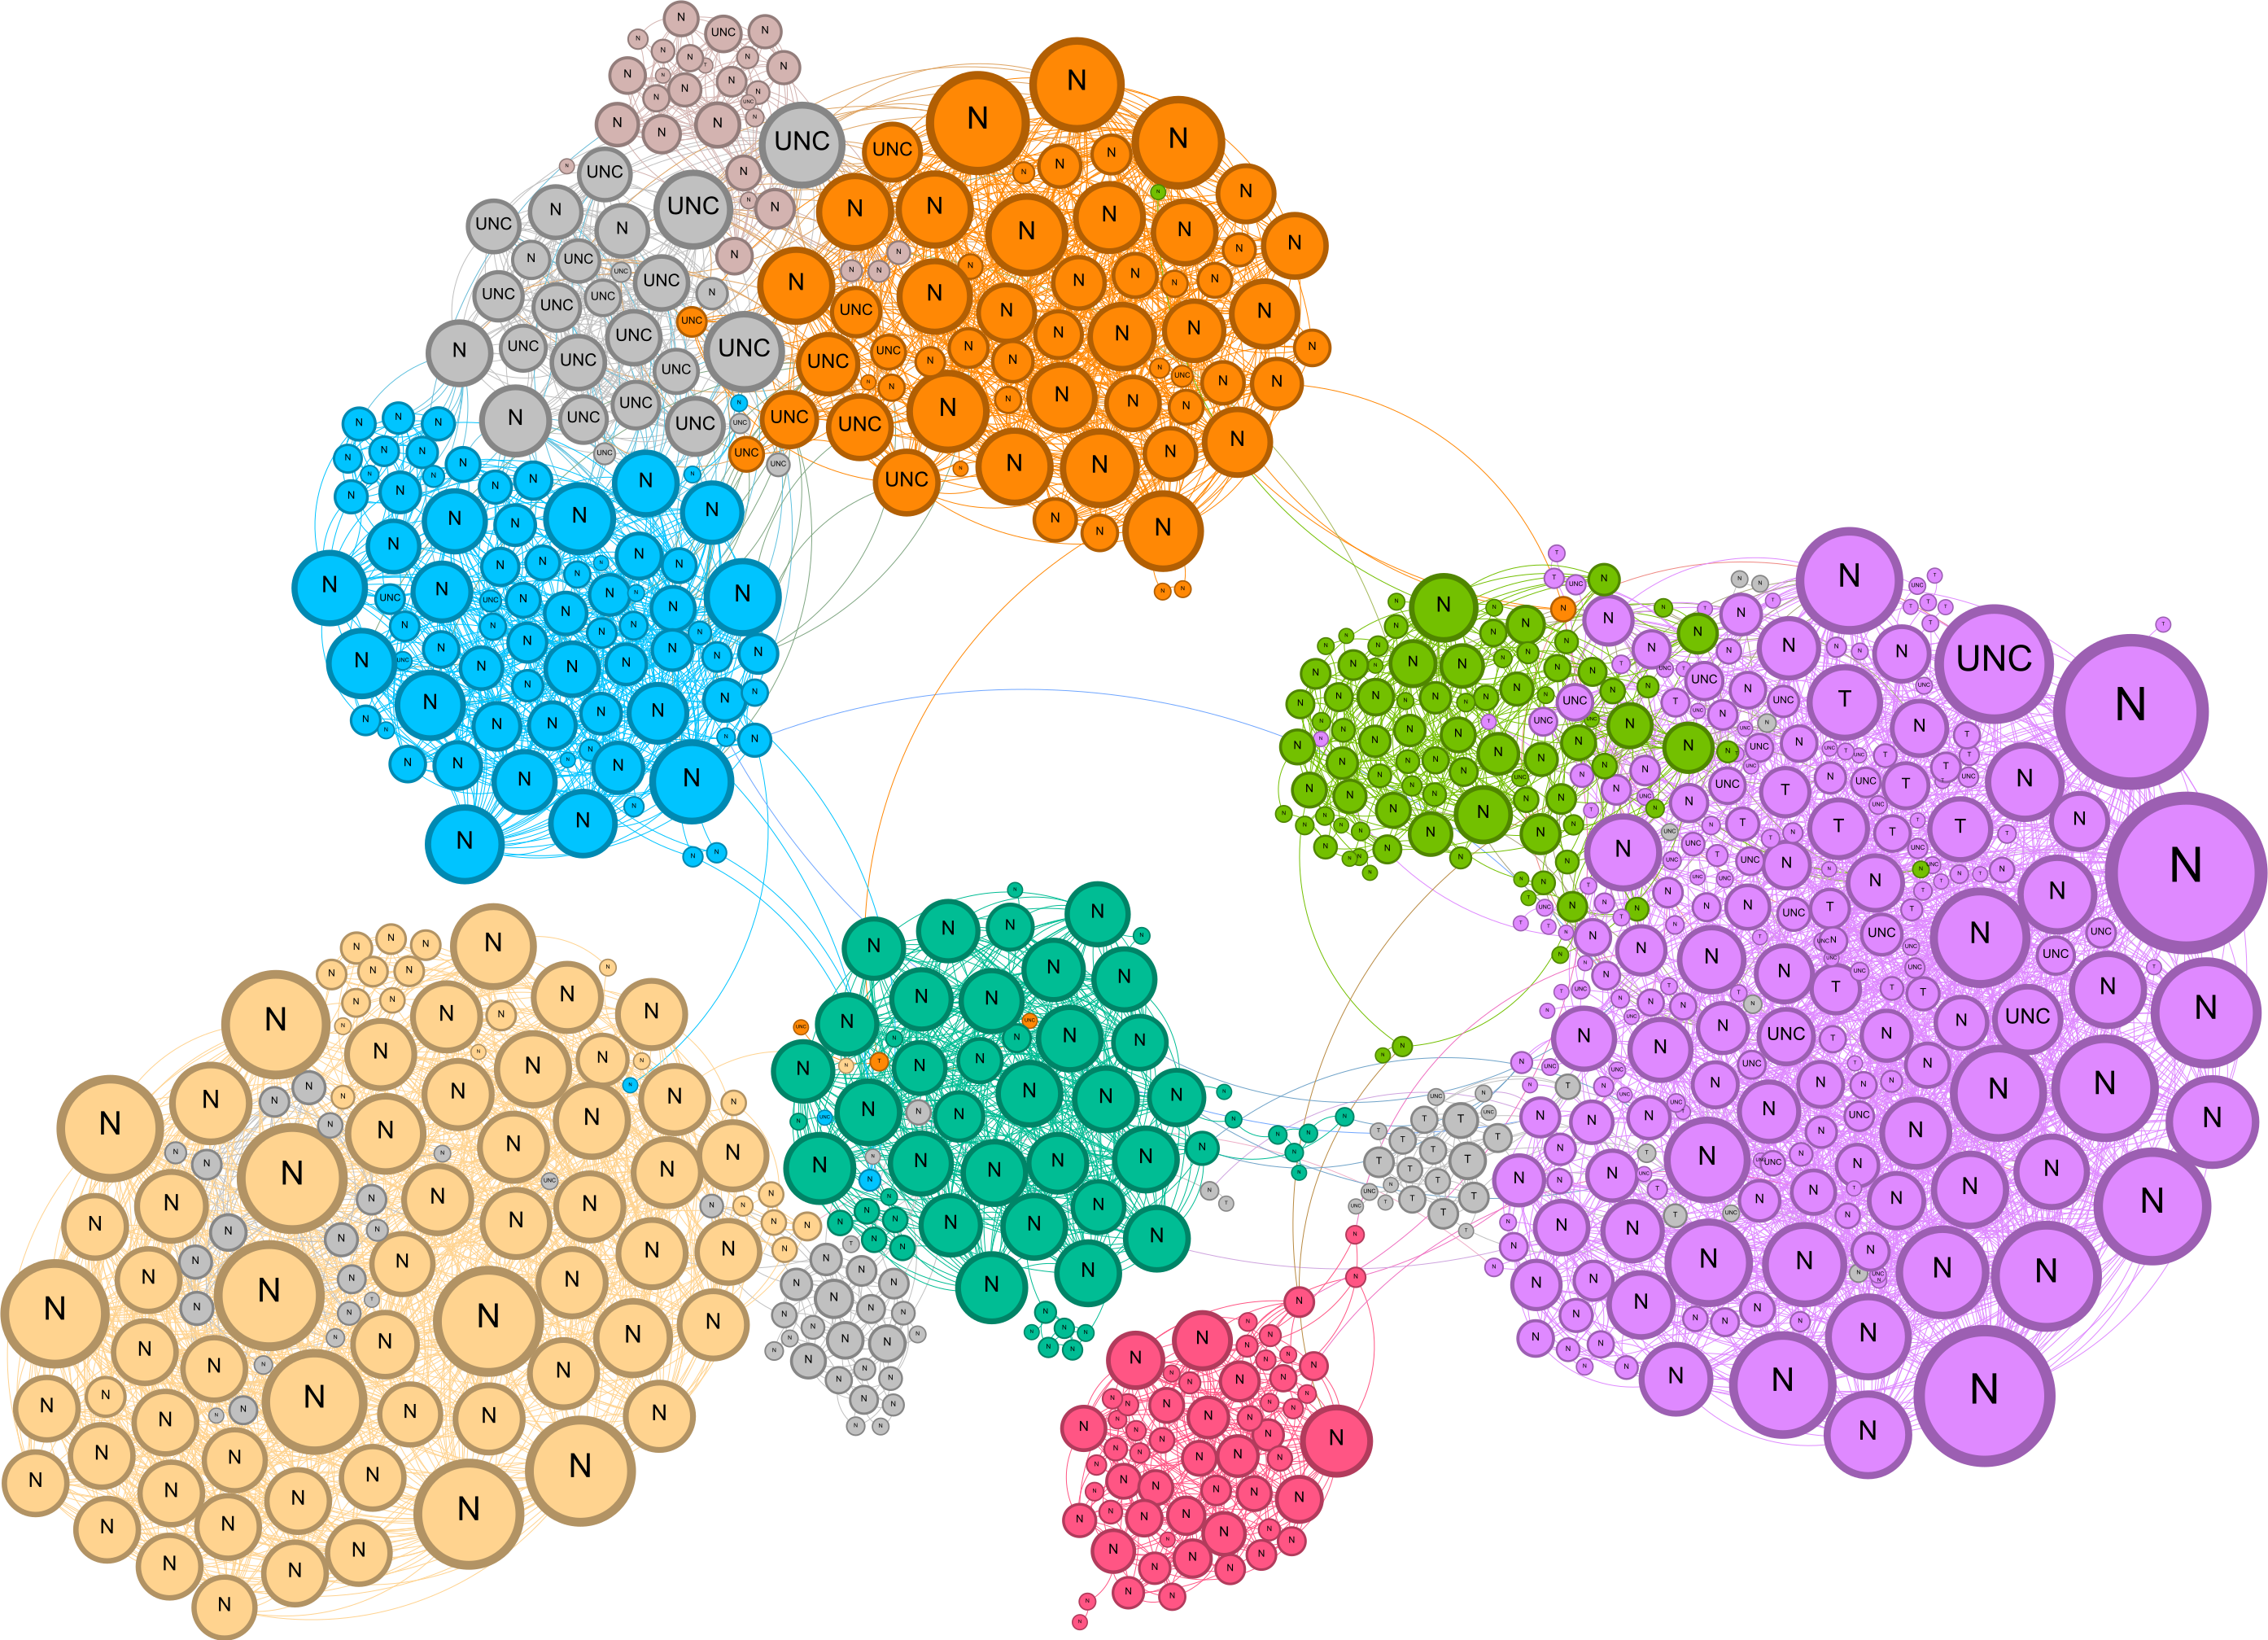
To investigate more deeply the level of homogeneity of the single community in terms of the reputability label of URLs within them, we consider the frequency of reputable and non-reputable sources of URLs therein. For the -community of URL NECs, if is the reputability value (either or ), we define the frequency of URLs from domains, i.e.
| (3) |
where is the set of all the URLs in the -community and is the subset of that contains only URLs with reputability . The purity defined in Eq. 3 can be interpreted as the probability of extracting an R-reputable URL in the -th URL NEC. If is the number of different URL NECs, we can define as the frequency of URLs from domains in all URL NECs:
| (4) |
To have a benchmark for the purity of URL NECs, we also consider a purity measure for URLs that do not belong to any community:
| (5) |
where the set of URLs that do not belong to any community is denoted as .
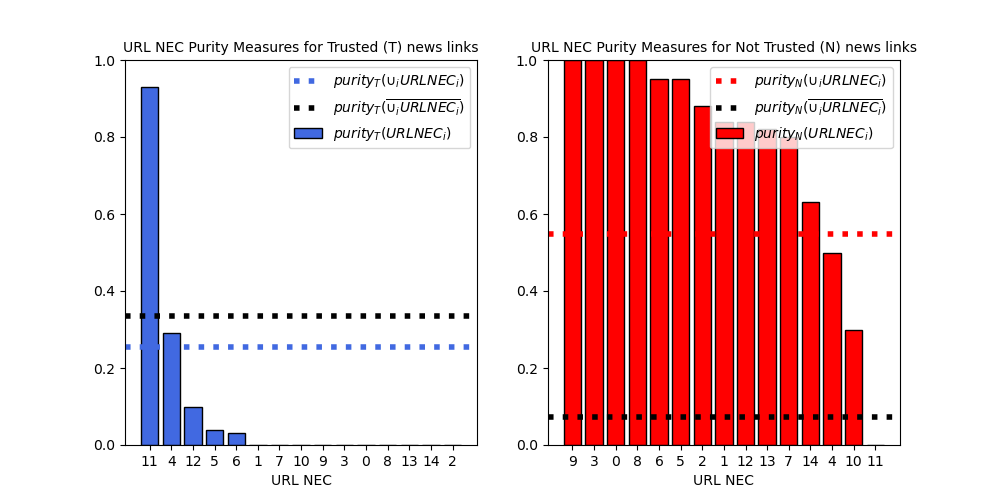
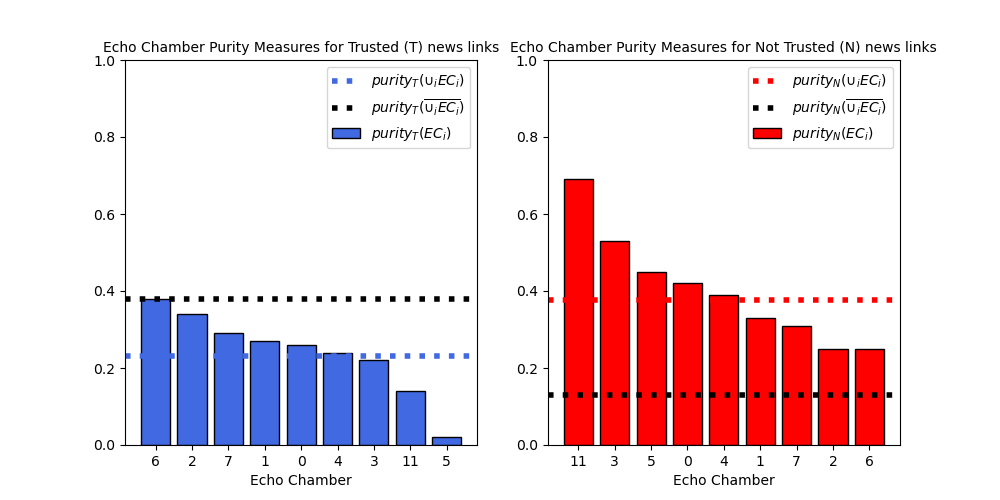
Fig. 9 shows the homogeneity of URL NEC communities concerning trustworthy (T, left panel) and not trustworthy (N, right panel) sources. On the x-axis there are the URL NEC communities, denoted by their ids, while the y-axis reports the purity of each community.
The blue dotted line indicates , the black dotted line indicates .
Focusing on the lines, on average URL NECs have higher N purity URLs () compared to T URLs (). Such a result suggests that URLs that belong to URL NECs represent niches of misinformation sources and it is corroborated by the observation that most of URL NECs refers to a limited number of different sources (see Table 4).
Appendix C A deeper insight on the narratives shared by echo chamber 4
To provide a concrete example, we focus on the content shared within echo chamber 4. As shown in Fig. 12, among the greatest echo chambers, 4 has the greatest tendency to share low credibility content. The target of our analysis is to check if the topics and narrative captured by our dataset are still present in the present narrative of the same users.
In practice, we first manually extract the main narratives from the news shared within echo chamber 4 captured by our dataset, focusing on users with the highest number of followers at the time of data collection. Finally, still focusing on users with the highest number of followers, we analyze if there are signals of these narratives in their recent posts (as of June 7, 2023) and which narratives they currently support.
In echo chamber 4, there are approximately 1.7k unique news items disseminated a total of around 7.3k times. First, we exclude the news with connection errors at the time of this analysis (k shares) and those that have been shared less than 10 times. Then we analyze the resulting news narratives, which amount to k shares and 146 unique URLs from 51 different domains. By classifying only these 146 news (over 1.7k) we cover approximately of the total URL traffic within echo chamber 4.
| ID | Narratives |
|---|---|
| 1 | The discriminatory nature of greenpass. Support to protests by individuals |
| or groups against the greenpass. | |
| 2 | Several cases of people who died because of the vaccination |
| (aneurysm, meningitis, …). | |
| 3 | Several cases of injuries after vaccination |
| (bleeding, myocarditis, pericarditis, neurological problems, excruciating pain) | |
| 4 | Various statements made by political figures against vaccinations. |
| 5 | The obligation cannot be imposed since it is unconstitutional. |
| News about VIPs and governments rejecting the vaccine. | |
| Ineffectiveness of vaccines. | |
| 6 | Mattarella incites to hatred no-vax. Experts reject the third dose, … |
| 7 | (Manipulated) data about vaccine hazard versus efficacy |
| and hospitalisations or infections despite vaccination. | |
| 8 | COVID-19 vaccines are still too experimental. |
| Police forces were not vaccinated. Support to views of no-vax doctors. | |
| VIPs and high-ups pretend to be vaccinated, but actually are not, due to the known dangers of vaccinations. |
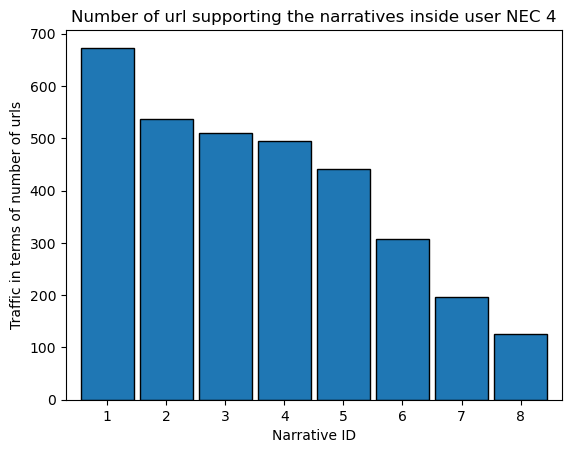
In Fig. 10 and Table 5, respectively, we show the narratives’ distribution and their descriptions.
In general, the main 8 narratives are all against vaccination and government regulations, bringing up the ineffectiveness, if not harmfulness, of the immunization procedure, as well as conspiracy theories. The details are in Table 5.
Subsequently, our attention shifts towards users in echo chamber 4, who are presumed to hold greater influence due to their substantial number of followers.
We find that the main narratives receive substantial support from the tweets of these influential users within this subset, even those not including URLs. Such an outcome suggests that it is indeed feasible to characterize the primary narrative prevalent within an echo chamber by examining the shared news, which proves to be a relatively straightforward task.
Regarding the main narrative recently endorsed by the most influential users in echo chamber 4, the results are presented in Table 6. Users under analysis maintain radical and extreme viewpoints concerning current contentious topics, such as the war in Ukraine, migrants, and LGBT issues. Remarkably, conspiracy theories about vaccines are still present in their narratives.
| User | Followers | Supported Narratives |
|---|---|---|
| user_1 | 36926 | no-migrants, no-vax, anti-EU |
| user_2 | 6929 | pro-Russia, no-vax, no-LGBT |
| user_3 | 6335 | pro-Russia, no-migrants, anti-EU, conspiracy theories |
| user_4 | 4164 | no-vax, no-migrants, pro-Russian |
| user_5 | 3117 | no-vax |
| user_6 | 2668 | pro-Russian, against the Italian government, no-vax |
| user_7 | 2641 | suspended |
| user_8 | 2448 | conspiracy theories, no-vax, no-LGBT, against the Italian government, anti-EU |
| user_9 | 2355 | religious posts, no-green pass, no-vax |
| user_10 | 2316 | against Italian government, no-vax |
Appendix D Exposure of users to misinformation
In the present section, we investigate the exposure to misinformation of users in the various groups. For each type of community (i.e., DiCo, user NECs and echo chambers), we label all messages including URLs pointing to news articles according to the annotation of the domain of news publishers as we did in Subsection B. Let us remark that if the same URL is shared multiple times by users in the same group, this multiplicity is accounted for in the present analysis.
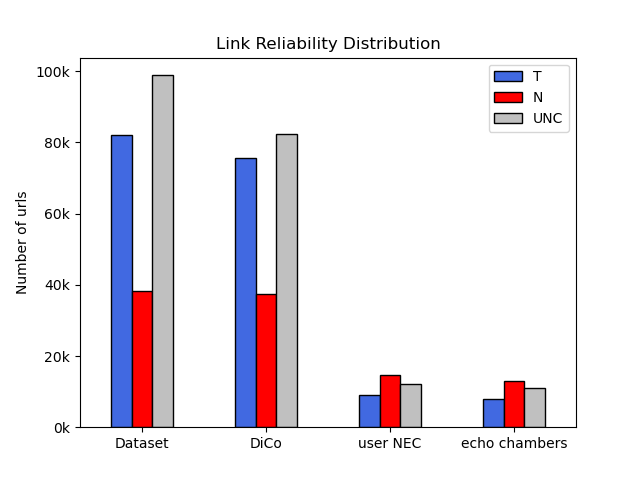
Fig. 11 illustrates the number of URLs pointing to news by publishers classified as ‘Trustworthy’ (T), ‘Not trustworthy’ (N) and ‘Unclassified’ (UNC) by NewsGuard, for the entire dataset and for each type of user community.
The first trivial observation is that, as expected in light of the results of Subsection 2.4 of the main text, the differences between user NECs and echo chambers are negligible. Secondly, DiCos cover almost the entire volume of both T and N traffic.
Remarkably, while in the entire dataset the ratio between non-trustworthy and trustworthy URLs is around 0.5, the ratio is nearly inverted in the case of echo chambers: the frequency of N sources is almost twice the one of T sources.
To provide a finer characterization of the exposure of users to misinformation in echo chambers, we ‘recycle’ the definition of purity of Section B, with a crucial difference: there the purity measure was applied, from time to time, to different sets of URLs, here we apply it to all messages shared by different sets of users. Thus, in the present case, if a URL was shared multiple times, we consider the repetitions. The rationale for this is to characterize echo chambers in terms of the extent to which links to news stories from not trustworthy news publishers circulate within them. If and count, respectively, the number of messages containing an URL and an R-reputable URL shared by users in echo chamber , with a little abuse of notation we can define a purity for echo chamber as
| (6) |
Analogously to what was done in Subsection B, we can define and , respectively for all users in echo chambers and for all users outside echo chambers.
The results of the analysis is reported in Fig. 12: on the x-axis there are the echo chambers denoted by their ids, on the y-axis the purity values.
On the left panel, purities are related to trustworthy URLs. On the right panel, purities are related to not trustworthy URLs. The blue dotted line indicates , the black dotted line indicates .
Focusing on the lines, on average echo chambers have a higher purity with respect to not trustworthy URLs () compared to trustworthy ones (). Otherwise stated, when a user in an echo chamber posts a message including an URL, the probability that it will point to a non-trustworthy news source is nearly 0.4; for some echo chambers, this probability is even much higher than
this.
As in the case of the purity for URL NECs, if we compare the values against , there is a trend reversal in passing from T to N: the value is greater than its counterpart in the echo chamber while is lower than the value measured in echo chambers.
This result is worrisome since users in echo chambers are particularly polarised and committed, basing their belief on low-quality pieces of news. Nevertheless, let us remind that the formation of echo chambers, while alarming on its own, is in general not related to the quality of news sources.
Appendix E Validated projection of bipartite networks
The BiCM null-model introduced in Subsection 4.1.2 of the main text can be used to validate the co-occurrence network defined from a bipartite one. Consider two nodes : the number of co-occurrences between them is
| (7) |
As mentioned in the subsection above, the probability of observing a graph is factorised in terms of probabilities of the existence of a single link. Therefore the probability that both nodes link a single node is simply
where is defined in Eq. 7.
In general, given node , all are different, depending on the degree . In this sense, the BiCM probability distribution of is the generalization of the binomial distribution in which each event has a different probability. Such a distribution is known in the literature with the name of Poisson-Binomial distribution. For each observed co-occurrence, we can then calculate its p-value [25].
Finally, all p-values are validated using a multiple-test hypothesis. In the present work, we use FDR [37], since it permits to control the number of False Positives. In a nutshell, the FDR procedure prescribes ordering all p-value from the lowest to greatest, i.e. . Then, if is the total number of tests, the effective threshold is given by the greatest satisfying
where is the statistically significant threshold. In the present analysis .
Appendix F Article’s reputability measure (NewsGuard)
One of the aims of the work is to characterize the variety of domains circulating within the dataset, both in terms of type (e.g., news site, marketplace, social platform, etc.) and transparency and credibility (only in the case of news sites). In this paper, we refer to domains as the ‘second-level domain’ names666https://en.wikipedia.org/wiki/Domain_name, i.e., the names directly to the left of .com, .net, and any other top-level domains. For instance, we consider domains nytimes.com, guardian.com, corriere.it.
The domains have been tagged according to their degree of credibility and transparency, as indicated by fact-checking website NewsGuard (https://www.newsguardtech.com/). The NewsGuard initiative was born from the joint effort of journalists and software developers, aiming at evaluating news sites according to criteria concerning credibility and transparency. For evaluating the credibility level of a source of information, NewsGuard metrics consider, e.g., whether the news source regularly publishes false news, whether it distinguishes between facts and opinions, or whether it does not correct a wrongly reported news. For transparency, instead, NewsGuard evaluation takes into account, e.g., whether owners, founders or authors of the news source are publicly known, or whether advertisements are easily recognizable777Details on the news site evaluation starting from the estimate of the assessment criteria are available at: https://www.newsguardtech.com/ratings/rating-process-criteria/..
| label | description |
|---|---|
| T | Trustworthy news source |
| N | Not trustworthy news source |
| P | Platform (e.g., reddit.com, twitter.com, facebook.com) |
| S | Satire |
| UNC | Unclassified source |
Table 7 shows the tags associated with domains. In the manuscript we shall be interested in quantifying the reliability of news sources that were publishing during the period of interest. Thus, we will not consider those sources corresponding to social networks (tag P). Also, we will not consider satiric news (tag S). Tags T and N in Table 7 are used only for news sites, be they newspapers, magazines, TV or radio social channels, and they stand for ‘Trustworthy’ and ‘Not trustworthy’, respectively.