Annealing tunable charge density wave order in a magnetic kagome material FeGe
Abstract
In the magnetic kagome metal FeGe, a charge density wave (CDW) order emerges inside the antiferromagnetic phase, providing a fertile playground to investigate the interplay between charge and magnetic orders. Here, we demonstrate that the CDW order, as well as magnetic properties, can be reversibly tuned on a large scale through post-growth annealing treatments. The antiferromagnetic and CDW transitions vary systematically as functions of both the temperature and the time period of annealing. Long-range CDW order with a maximum and a minimum can be realized in crystals annealed at for over 48 h. Using magnetization and magnetostrictive coefficient measurements, it is found that the CDW transition is rather stable against an external magnetic field and spin-flop transition. On the other hand, the critical field for spin-flop transition is significantly reduced in the long-range ordered CDW phase. Our results indicate that the CDW in FeGe is immune to variations in magnetic orders, while the magnetocrystalline anisotropy energy and the corresponding magnetic ground state can be altered significantly by the charge order. These findings provide crucial clues for further investigation and a better understanding of the nature of the CDW order in FeGe.
I INTRODUCTION
The interplay of lattice geometry, nontrivial band topology, and electronic correlations in kagome lattices often lead to the emergence of intriguing quantum phases of matter, such as quantum spin liquids, superconductivity, and charge-density-wave (CDW) [1, 2]. Prime examples of such phenomena can be found in various kagome materials, including the quantum spin liquid candidate ZnCu3(OH)Cl2 [3], magnetic topological materials Co3Sn2S2, Mn3Sn, Fe3Sn2 and FeSn [3, 4, 5, 6, 7], as well as the kagome superconductors V3Sb5 (K, Rb, Cs) [8, 9, 10]. A recent discovery in the magnetic kagome metal FeGe (hexagonal, B35) has added further intrigue to the field, as it revealed the presence of a CDW phase ( 100 K) deep inside the A-type antiferromagnetic (AFM) phase ( 410 K) [11, 12, 13]. This discovery provides a prominent playground to investigate the intricate interactions between lattice, charge, and spin degrees of freedom in kagome materials.
The facts that the CDW phase arises inside the AFM phase and that the magnetic moments are enhanced below the CDW transition likely suggest an intimate coupling between CDW and magnetism in FeGe [11, 14, 15]. However, the exact correlations between CDW and magnetism remain elusive. One of the key questions is whether the CDW is driven by magnetism or not. Theoretically, various scenarios, including Fermi surface nesting [16, 14], electron-phonon coupling [14], spin-phonon coupling [15], electron-electron correlations [17, 18], and magnetism-assisted structural dimerization [19], have been proposed to uncover the origin of the CDW found in FeGe. Despite a large diversity, it is generally believed that magnetism plays an important role in the formation of the CDW in FeGe. On the experimental side, the appearance of the CDW shows weak signal, and strong sample dependence, hampering systematic investigation of the underlying mechanisms. In early reports, no other transitions except the magnetic ones were found in the hexagonal phase of FeGe [20, 21, 22]. In recent neutron and scanning tunneling microscopy (STM) studies, a short-range CDW state with a typical correlation length of 20 Å 30 Å was discovered [11, 12, 13]. On the other hand, x-ray scattering experiments indicate that the CDW is long-ranged and that the CDW transition is weakly first-order [15]. These discrepancies found experimentally are likely caused by different sample qualities. To unveil the driving force of the CDW in FeGe, it is thus of prime importance to prepare samples that show clear and repeatable signatures of CDW.
Post-growth thermal treatment has been proven to be an effective method to improve the quality of single crystals, as widely used in the study of cuprate and iron-based superconductors [23, 24, 25, 26], as well as CDW materials [27]. In this paper, by post-growth annealing in a temperature range of 240 , we are able to systematically tune the CDW volume fraction from almost zero (short-ranged) to a hundred percent (long-ranged). This provides a crucial method to obtain high-quality samples hosting long-range CDW, and paves the way for studying the interplay of CDW and magnetism in FeGe. A phase diagram is established based on the annealing results, which reveal that is inversely correlated to . In addition, the CDW transition appears to be robust against external magnetic fields and the spin-flop transition, whereas the entrance of the long-range CDW order lowers the critical field for the spin-flop transition.
II Methods
II.1 Single crystal growth
Single crystals of B35-type FeGe were synthesized using the chemical vapor transport (CVT) technology [11]. Iron powders (99.99%) and germanium powders (99.999%) were weighed in the stoichiometric ratio 1:1, thoroughly ground, and loaded into a quartz tube along with additional iodine as transport agents. The quartz tube was then sealed under a high vacuum and placed into a horizontal two-zone furnace. The source and sink temperatures for the growth were set at and , respectively. After being held at the single crystal growth temperatures for 12 days, the system was cooled down naturally to room temperature by shutting down the furnace. Shiny, prismatic crystals of B35-type FeGe can be obtained in the middle of the quartz tube. These samples will be referred to as ”as grown samples”, where the perpendicular magnetic susceptibility usually shows a behavior similar to that reported by Teng el al..
II.2 Post-growth annealing
The as-grown crystals were sealed into an evacuated quartz tube, which was then inserted into a box furnace set at the specified annealing temperature. After being held at the annealing temperature for the target time period, the quartz tube was quickly removed from the furnace and quenched to room-temperature water. The obtained annealed crystals are as shiny as the as grown crystals, and no annealing induced surface change can be found. From x-ray diffraction (XRD) data as shown in the Supplementary Material, which are collected on a PANalytical powder diffractometer (Cu = 1.5406 Å radiation), the crystal structure and the lattice parameters almost keep intact during the annealing process.
II.3 Magnetization measurements
Magnetization up to 7 T was measured using a direct current scan mode in the Quantum Design Magnetic Property Measurement System (MPMS3). Magnetization up to 9 T were conducted in a Quantum Design DynaCool Physical Properties Measurement System (PPMS-9T) using a vibrating sample magnetometer (VSM) option.
II.4 Magnetostrictive coefficient measurements
An ac composite magnetoelectric (ME) method is applied to measure the magnetostrictive coefficient (d/d, where ) of the samples. The sample is mechanically bonded with a 0.2-mm-thick piezoelectric 0.7Pb(Mg1/3Nb2/3)O30.3PbTiO3 (PMN-PT) [001]-cut single crystal by Ag epoxy, as shown in Fig. 3(a). The PMN-PT acts as a strain gauge to transfer the magnetostriction of the sample into an electrical signal. An ac magnetic field 1 Oe is generated by a coil, and an ac electric signal is induced along the thickness direction of the PMN-PT due to the interlayer strain coupling. The electrical signal is measured by a lock-in amplifier (OE1022, SYSU Scientific Instruments) with a homemade sample stick (MultiField Tech.). According to the composite ME theory, the real part of ME susceptibility / will be directly proportional to the magnetostrictive coefficient. Therefore, we will treat the measured real part of ME susceptibility as d/d in this paper.
III RESULTS AND DISCUSSION
III.1 Annealing effect
At room temperature, the hexagonal B35 FeGe crystallizes in the CoSn-type structure (, No.191) with Fe3Ge kagome layers and honeycomb Ge layers stacked alternatively along the -axis. During the single-crystal growth processes of the hexagonal B35-type FeGe, we found that the single-crystal growth temperature range is narrow, and the crystal structure of FeGe is quite rigid. It is difficult to tune the sample quality either by varying growth conditions or chemical doping. After trying different methods (see Supplementary Material for more details), we found that post-growth annealing in a vacuum followed by quenching in water shows highly reproducible, controllable, and reversible results.
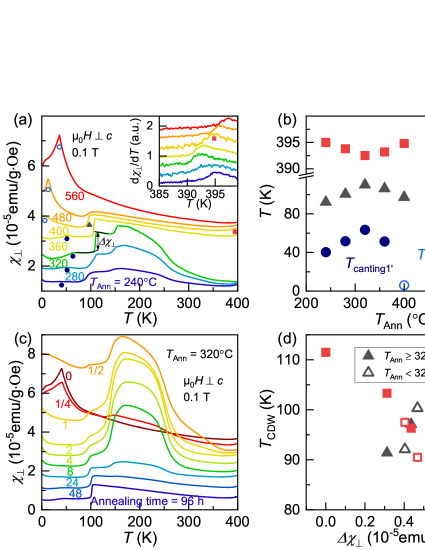
As shown in Fig. 1(a), the temperature-dependent in-plane magnetic susceptibility (, ) of FeGe samples varies significantly with different annealing temperatures . Here, the annealing time was kept at 48 h for all annealing temperatures. The susceptibility was measured in a magnetic field of 0.1 T after zero-field cooling. Data obtained for the configuration () can be found in the Supplementary Material. The overall behavior of the curve is similar to that reported by Bernhard et al. [21, 20]. For , only the AFM transition [ = 397 K, inset of Fig. 1(a)], and canting transitions are seen with no clear signatures of CDW around 100 K. As suggested by early neutron measurements, the hexagonal FeGe orders into a -axis A-type AFM below [21]. Below 55 K, the magnetic structure transforms to a -axis double cone AFM configuration, leading to a rapid increase in [21]. At 37 K, an abrupt change of the cone angle produces a peak in [21].
As the annealing temperature is lowered to , an additional feature appears around 100 K in , which is reminiscent of the CDW transition reported by X. Teng et al. [11]. By further decreasing , the CDW transition becomes more evident and shows a first-order-like sharp jump in for crystals annealed below . Indeed, a hysteretic temperature-dependent behavior is seen in for these samples near the CDW transition, further confirming the first-order nature of CDW (see Supplementary Material). For , the feature associated with the CDW transition becomes broad again. The CDW transition is most pronounced for , which shows the highest and the largest change in susceptibility () at the CDW transition. More importantly, instead of the short-range CDW reported earlier [11], the CDW becomes long-ranged in crystals annealed at , as evidenced by STM and single-crystal x-ray scattering measurements [28]. In crystals showing short-range CDW, the high-temperature undistorted structure survives and dominates the sample volume below . On the other hand, the majority of the sample volume switches to the low-temperature distorted structure once the long-range charge order sets in. Therefore, the volume fraction of the CDW phase can be tuned from nearly 0 to almost 100% in a controllable way using post-growth annealing. The appearance of long-range CDW in FeGe achieved by post-growth annealing provides a vital starting point for studying the interplay between CDW and magnetism.
In addition to the CDW transition, the magnetic transitions are also sensitive to the annealing temperatures. As presented in the inset of Fig. 1 (a), the AFM transition temperature shifts moderately by changing . On the other hand, the canting transition occurring at low temperatures depends strongly on . Unlike the peak structure seen at 40 K for samples annealed above , shows a step-like feature around 50 K for . We also note that for crystals annealed for 48 h below , an additional broad hump appears in between 150 and 250 K, which is followed by a step-like jump around 150 K. The broad hump feature has a weak ferromagnetic (FM) nature, as evidenced by the bifurcation between the zero-field-cooled (ZFC) and field-cooled (FC) curves. Clear magnetic hysteresis loops are also seen between 150 and 250 K [see Supplementary Material]. The origin of this weak FM feature is unclear at present, but impurities can be excluded because the magnetic susceptibility behavior is highly reversible during the annealing process.
In Fig. 1(b), we summarize the phase diagram of magnetic and CDW transition temperatures as a function of the annealing temperature using the data presented in Fig. 1(a). By varying , and changes systematically but with opposite trends. At , reaches a maximum value, whereas shows a minimum. The low-temperature canting transition shows complex dependency on . For higher than , the canting transition temperature tracks the trend of [see open circles in Fig. 1(b)]. By lowering below , follows the evolution of [solid blue circles in Fig. 1(b)]. As already seen in Fig. 1(a), the feature in around changes significantly for samples annealed above and below . The susceptibility jumps sharply at for samples annealed below , signifying the appearance of long-range CDW in these samples. It is very likely that the entrance of the long-range charge order interacts strongly with the magnetic order, leading to a different magnetic ground state and thus a different behavior of the canting transition. Although the magnetic structure stays unchanged in the presence of short-range CDW [11], the large lattice distortions caused by long-range CDW can in principle alter the spin texture. This is also evidenced by the sudden suppression in the critical field of the spin-flop transition in the long-range CDW state, as we will discuss in Fig. 3. To differentiate the likely different magnetic states, we may call the high-temperature () pristine phase AFM1 phase and the low-temperature CDW phase AFM2 phase. Then, the AFM1 phase leads to the transition at while AFM2 phase leads to the transition at . Further detailed study is desired to clarify the magnetic ground state in the long-range ordered CDW state.
As shown in Fig. 1(b), appears to be anticorrelated with . The CDW volume fraction are expected to be larger in samples with higher as evidenced by the evolution of short-range to long-range charge order. Note that the change in susceptibility () at the CDW transition also increases monotonically with [see Fig. 1(a)]. In an oversimplified approximation, one may naively take as a measure of the CDW volume fraction. As presented in Fig. 1(c), indeed both and vary monotonically with but with opposite slopes. It strongly indicates that the underlying physics controlling the CDW volume fraction also governs the CDW and antiferromagnetic transitions.
The CDW and magnetic properties can also be tuned by different annealing time. In Fig. 1(d), we take the case as an example. The phase diagram obtained for different annealing time can be found in Supplementary Material. The CDW transition cannot be well resolved in as-grown samples (0 h). Starting from 1/2 h of the annealing time, signatures of the CDW transition show up in the susceptibility around 100 K, together with a large hump appearing between 150 and 250 K. With further increase in annealing time, the broad hump and the magnitude of low-temperature magnetic susceptibility are significantly suppressed, accompanied by the systematic increase in and (CDW volume fraction). The maximum without the broad hump is observed in the crystal annealed at for 96 h. Annealing longer than 96 h does not lead to a further increase in and the CDW volume fraction. Need to point out that the broad hump appearing between 150 and 250 K in crystals annealed in a period of 1/4 48 h does not disturb the systematic evolution of the CDW phase. This indicates that the CDW is insensitive to these magnetic effects. Comparing the data in Fig. 1(a) with that in Fig. 1(d), the tendencies of the evolution of and as a function of annealing temperature below can be attributed to the insufficient annealing time required for low-temperature annealing.
III.2 Magnetic field effect
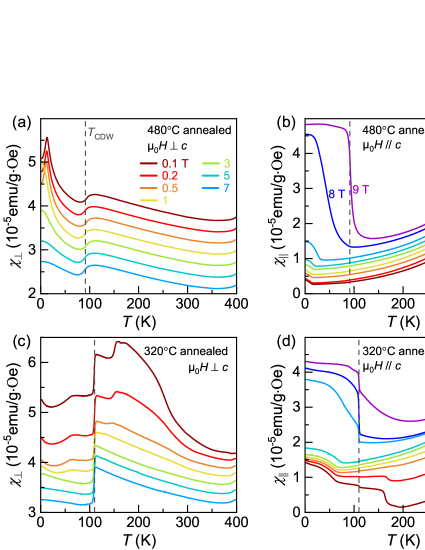
To gain further insight into the correlation between and various magnetic transitions, we investigate their response to external magnetic fields for two typical crystals obtained by annealing at and for 48 h. The results are displayed in Fig. 2. The crystal annealed at is similar to samples reported by X. Teng et al. [11], showing a short-range CDW order and a low CDW volume fraction [28]. In contrast, the single crystal annealed at exhibits a long-range CDW order with a CDW volume fraction of nearly 100%. As shown in Fig. 2(a), for the annealed sample, and approximately remain intact by increasing the magnetic field in the configuration. Meanwhile, is gradually suppressed and becomes invisible when 3 T. This is similar to that reported by X. Teng et al. [11]. When the magnetic field is applied along the axis (), no CDW transition can be observed in up to 9 T [see Fig. 2(b)], which may be due to its low CDW volume fraction. A drastic step is seen in near for fields above 7 T. This is caused by different critical magnetic fields () needed to induce the spin-flop transition above and below the CDW transition [see also Fig. 3(h)]. In the case of the single crystal annealed at [Fig. 2(c)], it is evident that and , , and the transition width, keep intact as the magnetic field increases for . The unknown magnetic transition around almost keeps intact against the applied magnetic field until 3 T, above which it becomes less visible. The broad hump between 150 and 250 K is gradually suppressed until it completely vanishes above 1 T. These results again suggest that the CDW transition is unrelated to these complicated magnetic transitions, and is unaffected by the external magnetic fields. In , the CDW transition is manifested as a discernible step-like increase, which allows the investigation of the interaction between spin-flop and CDW transitions for fields along the -axis. When 7 T, jumps sharply at due to the sudden change in at the CDW transition [see also Fig. 3(i)]. Note that in both annealing conditions, remains intact against the spin-flop transition.
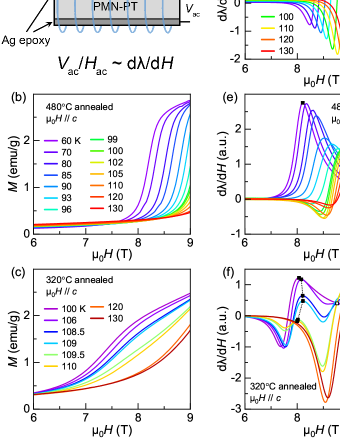
To further demonstrate the influences of the CDW transition on the spin-flop transition for , we study the field-dependent magnetization near the CDW transition in Fig. 3. In addition, a novel composite magnetoelectric method was applied to measure the relative magnetostrictive coefficient d/d, where and is the geometrical length of the sample. A schematic illustration of the magnetostriction setup is shown in Fig. 3(a). d/d is more sensitive than magnetization in terms of the spin-flop transition. Three typical crystals annealed at , , and with different CDW volume fractions were studied. For the sample annealed at , as displayed in Fig. 3(b), a steep upturn arising from the spin-flop transition can be observed in above a certain magnetic field . The value of increases gradually upon warming. Compared with the sample annealed at , the spin-flop transition in the has a significantly lower [see Fig. 3(c)]. Upon warming across , exceeds the field region we can reach in the magnetization measurements. Therefore, from the magnetization data, one cannot easily define and reveal the relationship between the CDW and spin-flop transition. In contrast, d/d shows clear features at the spin-flop transition and highlights the influence of the CDW phase on . As shown in Fig. 3(d) for the annealed sample, d/d shows a dip-peak feature around the spin-flop transition. The peak position, corresponding to , increases with increasing temperatures. No drastic anomaly associated with the CDW transition can be observed due to the nearly zero CDW volume fraction. In Fig. 3(e) for the annealed sample, d/d changes from a dip-peak feature to a peak feature around the CDW transition, indicating a moderate influence by the CDW phase. In Fig. 3(f) for the annealed sample, d/d shows two dip-peak features around the CDW transition. On the other hand, only a single dip-peak feature is seen in d/d below and above . This points to a phase coexistence in the vicinity of the CDW transition in accordance with its first-order nature.
The systematic evolution of tuned by the CDW transition can be seen more clearly in Figs. 3 (g), (h), and (i) for the corresponding samples with negligible, moderate, and 100% CDW volume fractions, respectively. For the sample annealed at , decreases linearly with cooling and no anomalies associated with the CDW transition is found. In this case, the high-temperature AFM1 phase persists down to lower temperatures in the absence of charge orders. For the annealed sample, a clear but gradual change of takes place around the CDW transition, indicating a second-order-like nature in the CDW phase transition. For the annealed sample, a sharp step-like jump in is seen together with a phase coexistence region near . This again points a first-order CDW transition. In this sample, the AFM1 phase is completely transformed into the AFM2 phase below the CDW transition.
IV Discussion
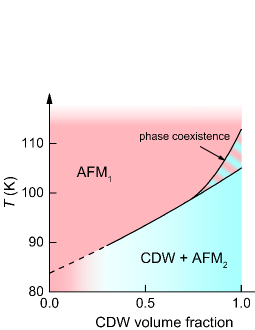
A schematic phase diagram summarizing the above experimental results is presented in Fig. 4, illustrating how the CDW volume fraction can continuously tune the CDW transition from first-order to second-order-like and finally to a crossover, as exemplified by samples annealed at , , and , respectively. In crystals hosting the long-range CDW and large CDW volume fractions, the high-temperature structurally non-distorted pristine AFM1 phase transforms completely into the low-temperature distorted phase. A phase coexistence region also exists due to the first-order nature of the CDW transition. Compared to the AFM1 phase, the long-range CDW phase likely has a different AFM2 spin configuration with significantly reduced spin-flop-transition field . As the CDW volume fraction is lowered and the CDW becomes short-ranged, only partial of the AFM1 phase is transformed to the CDW/AFM2 state. When the CDW volume fraction is negligible and the CDW transition becomes invisible, the AFM1 phase persists all the way down to low temperatures.
To understand why the CDW strongly tunes the spin-flop transition rather than the other way around, one must grasp the nature of the CDW phase. Our STM and XRD measurements [28] reveal that the crystal structure of the CDW phase features a superstructure with strong dimerization for 1/4 of the Ge1-sites in the Fe3Ge layers along the -axis. This naturally explains the significant influence of long-range ordered CDW on the spin-flop transition since is mainly determined by the magnetocrystalline anisotropy, and the Ge1-site dimerization can affect the crystal field of neighboring Fe sites. Conversely, the spin-flop-induced structure distortion is so small that it cannot affect the CDW transition temperature.
Next, We discuss the microscopic mechanism of the CDW based on our results. We have demonstrated that annealing can modify the physical properties of FeGe single crystals in a reproducible, controllable, and reversible manner. The reversibility of the annealing process imposes a strong restriction on the microscopic mechanism, which could rule out the effect of impurity, evaporation of Fe/Ge, and reaction with oxygen or water from the ambient environment. One plausible explanation is that annealing modifies the concentration of certain defects, such as site disorder, dislocations, vacancies, or interstitial species. This explanation finds support in the systematic increase in the RRR values with decreasing annealing temperature and the decrease in defects at Ge2 sites revealed by the STM measurements [28]. Another possible scenario involves microstrain induced by quenching, where slow cooling or annealing at low temperatures can eliminate the microstrain. In fact, these two scenarios are consistent with each other, as crystals obtained by low-temperature annealing and a slow cooling rate would have fewer disorders or microstrains. However, the detailed microscopic mechanism still remains elusive at present. Further investigations are needed to unveil the origin of CDW found in FeGe.
V CONCLUSION
In conclusion, we demonstrate that the CDW volume fraction in FeGe can be tuned systematically from 0 to nearly 100% through post-growth annealing in a vacuum. Importantly, the AFM and CDW transition temperatures are found to be anticorrelated with each other. Moreover, the CDW transition in FeGe is insensitive to changes in magnetic orders induced by spin-canting and spin-flop transitions. However, the charge order lowers the spin-flop-transition field significantly. These results impose crucial restrictions on the theoretical explanation of the CDW mechanism. Our study provides a prominent way for obtaining high-quality FeGe crystals hosting different CDW volume fractions, which can enable systematic investigations of the interplay between magnetic and charge orders in FeGe.
Acknowledgements.
We thank Ya-Jun Yan, Yilin Wang, Yuan Li and Christoph Meingast for their helpful discussions. This work was supported by the Natural Science Foundation of China ( No. 12004056, No. 11974065, and No. 12227806.) A.W. acknowledges the support from Chongqing Research Program of Basic Research and Frontier Technology, China (Grants No. cstc2021jcyj-msxmX0661), Fundamental Research Funds for the Central Universities, China (Grant No. 2022CDJXY-002). Y.S.C. acknowledges the support from Beijing National Laboratory for Condensed Matter Physics. M. He acknowledges the support by Chinesisch-Deutsche Mobilitätsprogamm of Chinesisch-Deutsche Zentrum für Wissenschaftsförderung (Grant No. M-0496). We would like to thank Guiwen Wang and Yan Liu at the Analytical and Testing Center of Chongqing University for their technical assistance.References
- Neupert et al. [2022] T. Neupert, M. M. Denner, J.-X. Yin, R. Thomale, and M. Z. Hasan, Nat. Phys. 18, 137 (2022).
- Jiang et al. [2022] K. Jiang, T. Wu, J.-X. Yin, Z. Wang, M. Z. Hasan, S. D. Wilson, X. Chen, and J. Hu, National Science Review 10, nwac199 (2022), https://academic.oup.com/nsr/article-pdf/10/2/nwac199/49561488/nwac199.pdf .
- Han et al. [2012] T.-H. Han, J. S. Helton, S. Chu, D. G. Nocera, J. A. Rodriguez-Rivera, C. Broholm, and Y. S. Lee, Nature 492, 406 (2012), 1307.5047 .
- Liu et al. [2018] E. Liu, Y. Sun, N. Kumar, L. Muechler, A. Sun, L. Jiao, S. Y. Yang, D. Liu, A. Liang, Q. Xu, J. Kroder, V. Süß, H. Borrmann, C. Shekhar, Z. Wang, C. Xi, W. Wang, W. Schnelle, S. Wirth, Y. Chen, S. T. Goennenwein, and C. Felser, Nat. Phys. 14, 1125 (2018).
- Nakatsuji et al. [2015] S. Nakatsuji, N. Kiyohara, and T. Higo, Nature 527, 212 (2015).
- Ye et al. [2018] L. Ye, M. Kang, J. Liu, F. Von Cube, C. R. Wicker, T. Suzuki, C. Jozwiak, A. Bostwick, E. Rotenberg, D. C. Bell, L. Fu, R. Comin, and J. G. Checkelsky, Nature 555, 638 (2018).
- Kang et al. [2020] M. Kang, L. Ye, S. Fang, J. S. You, A. Levitan, M. Han, J. I. Facio, C. Jozwiak, A. Bostwick, E. Rotenberg, M. K. Chan, R. D. McDonald, D. Graf, K. Kaznatcheev, E. Vescovo, D. C. Bell, E. Kaxiras, J. van den Brink, M. Richter, M. Prasad Ghimire, J. G. Checkelsky, and R. Comin, Nat. Mater. 19, 163 (2020).
- Ortiz et al. [2020] B. R. Ortiz, S. M. L. Teicher, Y. Hu, J. L. Zuo, P. M. Sarte, E. C. Schueller, A. M. M. Abeykoon, M. J. Krogstad, S. Rosenkranz, R. Osborn, R. Seshadri, L. Balents, J. He, and S. D. Wilson, Phys. Rev. Lett. 125, 247002 (2020).
- Yin et al. [2021] Q. Yin, Z. Tu, C. Gong, Y. Fu, S. Yan, and H. Lei, Chin. Phys. Lett. 38, 037403 (2021).
- Mi et al. [2023] X.-r. Mi, K.-y. Yang, Y.-h. Gan, L. Zhang, A.-f. Wang, Y.-s. Chai, X.-y. Zhou, and M.-q. He, Tungsten 5, 300 (2023).
- Teng et al. [2022] X. Teng, L. Chen, F. Ye, E. Rosenberg, Z. Liu, J.-X. Yin, Y.-X. Jiang, J. S. Oh, M. Z. Hasan, K. J. Neubauer, B. Gao, Y. Xie, M. Hashimoto, D. Lu, C. Jozwiak, A. Bostwick, E. Rotenberg, R. J. Birgeneau, J.-H. Chu, M. Yi, and P. Dai, Nature 609, 490 (2022).
- Yin et al. [2022] J.-X. Yin, Y.-X. Jiang, X. Teng, M. S. Hossain, S. Mardanya, T.-R. Chang, Z. Ye, G. Xu, M. M. Denner, T. Neupert, B. Lienhard, H.-B. Deng, C. Setty, Q. Si, G. Chang, Z. Guguchia, B. Gao, N. Shumiya, Q. Zhang, T. A. Cochran, D. Multer, M. Yi, P. Dai, and M. Z. Hasan, Physical Review Letters 129, 166401 (2022).
- Chen et al. [2023a] Z. Chen, X. Wu, R. Yin, J. Zhang, S. Wang, Y. Li, M. Li, A. Wang, Y. Wang, Y.-J. Yan, and D.-L. Feng, Charge density wave with strong quantum phase fluctuations in Kagome magnet FeGe (2023a), arXiv:2302.04490 [cond-mat].
- Teng et al. [2023] X. Teng, J. S. Oh, H. Tan, L. Chen, J. Huang, B. Gao, J.-X. Yin, J.-H. Chu, M. Hashimoto, D. Lu, C. Jozwiak, A. Bostwick, E. Rotenberg, G. E. Granroth, B. Yan, R. J. Birgeneau, P. Dai, and M. Yi, Nature Physics 10.1038/s41567-023-01985-w (2023).
- Miao et al. [2022] H. Miao, T. T. Zhang, H. X. Li, G. Fabbris, A. H. Said, R. Tartaglia, T. Yilmaz, E. Vescovo, J.-X. Yin, S. Murakami, L. X. Feng, K. Jiang, X. L. Wu, A. F. Wang, S. Okamoto, Y. L. Wang, and H. N. Lee, Spin-phonon coupling driven Charge density wave in a Kagome Magnet (2022), arXiv:2210.06359 [cond-mat].
- Shao et al. [2023] S. Shao, J.-X. Yin, I. Belopolski, J.-Y. You, T. Hou, H. Chen, Y. Jiang, M. S. Hossain, M. Yahyavi, C.-H. Hsu, Y. P. Feng, A. Bansil, M. Z. Hasan, and G. Chang, ACS Nano , acsnano.3c00229 (2023).
- Wu et al. [2023] L. Wu, Y. Hu, D. Wang, and X. Wan, Novel three-dimensional Fermi surface and electron-correlation-induced charge density wave in FeGe (2023), arXiv:2302.03622 [cond-mat].
- Ma et al. [2023] H.-Y. Ma, J.-X. Yin, M. Z. Hasan, and J. Liu, Theory for charge density wave and orbital-flux state in antiferromagnetic kagome metal FeGe (2023), arXiv:2303.02824 [cond-mat].
- Wang [2023] Y. Wang, Enhanced Spin-polarization via Partial Ge1-dimerization as the Driving Force of the CDW in FeGe (2023), arXiv:2304.01604 [cond-mat].
- Beckman et al. [1972] O. Beckman, K. Carrander, L. Lundgren, and M. Richardson, Physica Scripta 6, 151 (1972).
- Bernhard et al. [1984] J. Bernhard, B. Lebech, and O. Beckman, Journal of Physics F: Metal Physics 14, 2379 (1984).
- Watanabe and Kunitomi [1966] H. Watanabe and N. Kunitomi, J. Phys. Soc. Jpn. 21, 1932 (1966).
- Ishii et al. [2021] K. Ishii, S. Asano, M. Ashida, M. Fujita, B. Yu, M. Greven, J. Okamoto, D.-J. Huang, and J. Mizuki, Physical Review Materials 5, 024803 (2021).
- Rotundu et al. [2010] C. R. Rotundu, B. Freelon, T. R. Forrest, S. D. Wilson, P. N. Valdivia, G. Pinuellas, A. Kim, J.-W. Kim, Z. Islam, E. Bourret-Courchesne, N. E. Phillips, and R. J. Birgeneau, Physical Review B 82, 144525 (2010).
- Sun et al. [2019] Y. Sun, Z. Shi, and T. Tamegai, Superconductor Science and Technology 32, 103001 (2019).
- Ran et al. [2011] S. Ran, S. L. Bud’ko, D. K. Pratt, A. Kreyssig, M. G. Kim, M. J. Kramer, D. H. Ryan, W. N. Rowan-Weetaluktuk, Y. Furukawa, B. Roy, A. I. Goldman, and P. C. Canfield, Physical Review B 83, 144517 (2011).
- Sayers et al. [2020] C. J. Sayers, L. S. Farrar, S. J. Bending, M. Cattelan, A. J. H. Jones, N. A. Fox, G. Kociok-Köhn, K. Koshmak, J. Laverock, L. Pasquali, and E. Da Como, Physical Review Materials 4, 025002 (2020).
- Chen et al. [2023b] Z. Chen, X. Wu, S. Zhou, J. Zhang, R. Yin, Y. Li, M. Li, J. Gong, M. He, Y. Chai, X. Zhou, Y. Wang, A. Wang, Y.-J. Yan, and D.-L. Feng, Long-ranged charge order conspired by magnetism and lattice in an antiferromagnetic Kagome metal (2023b), arXiv:2307.07990 [cond-mat].