IXPE and XMM-Newton observations of the Soft Gamma Repeater SGR 1806–20
Abstract
Recent observations with the Imaging X-ray Polarimetry Explorer (IXPE) of two anomalous X-ray pulsars provided evidence that X-ray emission from magnetar sources is strongly polarized. Here we report on the joint IXPE and XMM-Newton observations of the soft -repeater SGR 1806–20. The spectral and timing properties of SGR 1806–20 derived from XMM-Newton data are in broad agreement with previous measurements; however, we found the source at an all-time-low persistent flux level. No significant polarization was measured apart from the – energy range, where a probable detection with and was obtained. The resulting polarization signal, together with the upper limits we derive at lower and higher energies (– and –, respectively) is compatible with a picture in which thermal radiation from the condensed star surface is reprocessed by resonant Compton scattering in the magnetosphere, similar to what proposed for the bright magnetar 4U 0142+61.
=400
1 Introduction
Soft -repeaters (SGRs) and anomalous X-ray pulsars (AXPs) form together a small class of Galactic X-ray pulsars, characterized by long spin periods (–), high spin-down rates – and the emission of short, energetic bursts of hard X-/soft gamma-rays. The huge inferred values of the (spin-down) dipole field (–), the lack of a detected binary companion and a persistent X-ray luminosity, –, typically in excess of the spin-down power, indicate that these sources are magnetars, ultra-magnetized neutron stars powered by their own magnetic energy (Duncan & Thompson, 1992; Thompson & Duncan, 1993, see also Turolla et al. 2015; Kaspi & Beloborodov 2017 for reviews and Olausen & Kaspi 2014 for a catalogue of magnetar sources111Available online at
http://www.physics.mcgill.ca/~pulsar/magnetar/main.html).
Because of the super-strong magnetic fields they host, the opacities of the two normal polarization modes are way different so the X-ray emission from SGRs/AXPs is expected to be highly polarized (up to Fernández & Davis, 2011; Taverna et al., 2014, 2020; Caiazzo et al., 2022). Theoretical predictions were finally tested when the NASA-ASI Imaging X-ray Polarimetry Explorer (IXPE; Weisskopf et al., 2022), the first satellite designed to provide imaging polarimetry in the – band, observed the two brightest magnetar sources, the AXPs 4U 0142+61 and 1RXS J170849.0–400910 (hereafter 1RXS J1708 for short) during the first year of operations. Polarization was clearly detected in the – keV band at the level in the former and to a much higher degree, , in the latter (Taverna et al., 2022; Zane et al., 2023).
In both sources the polarization strongly depends on energy. In 1RXS J1708 it monotonically increases from up to at constant polarization angle, possibly indicating that – photons come from regions of the star surface with different properties: a magnetic condensate (either solid or liquid) and an atmosphere (Zane et al., 2023). On the other hand, in 4U 0142+61 it first decreases from to zero at around – where the polarization angle swings by , and then rises to , suggesting that thermal radiation from a condensed surface patch is then reprocessed by resonant Compton scattering (RCS; Thompson et al., 2002; Fernández & Thompson, 2007; Nobili et al., 2008) onto mildly relativistic electrons flowing in the star’s twisted magnetosphere (Taverna et al., 2022, an alternative interpretation in terms of mode switching in a magnetized atmosphere was recently put forward by Lai 2023).
Polarization measurements in strongly magnetized neutron stars can probe vacuum birefringence, a strong-field, quantum electrodynamics (QED) effect predicted more than 80 years ago but never experimentally tested as yet (see e.g. Heyl & Shaviv, 2000, 2002, and references therein). Although previous magnetar observations are in agreement with QED predictions, no smoking-gun evidence for vacuum birefringence was found, mostly because thermal emission in both 4U 0142+61 and 1RXS J1708 comes from a fairly limited area of the star surface, so its intrinsic polarization is preserved at infinity anyway, even if no vacuum birefringence is present (see van Adelsberg & Perna, 2009; Santangelo et al., 2019).
Further magnetar observations with IXPE are required to address this issue and also to provide fresh insight into the similarities/differences among magnetar sources. Here we report on the simultaneous IXPE and XMM-Newton observations of the prototypical magnetar SGR 1806–20. The XMM-Newton and IXPE observations are detailed in §2 and the results of the timing, spectral and polarimetric analyses are presented in §3. Discussion follows in §4.
2 Observations
First identified as a high-energy transient in the KONUS data over 40 years ago (Mazets et al., 1981), SGR 1806–20 was shortly after realized to be a repeater (Atteia et al., 1987; Kouveliotou et al., 1987; Laros et al., 1987). The source, located at about from the Sun Bibby et al. (2008), is a regular and prolific emitter of short bursts clustered in active periods, one of which occurred in 2004 and culminated on 2004 December 27 with the emission of the most powerful giant flare (GF) observed so far from a magnetar (; Hurley et al., 2005; Palmer et al., 2005).
SGR 1806–20 spins with a period ; the period derivative increased from to in 2000–2011 and then went back to the “historical” value (see Younes et al., 2017). The latter implies a surface (dipole) field of , the highest ever recorded. The steady X-ray emission in the – keV range, (for the assumed distance of ), is well described by the superposition of a blackbody (BB) and a power law (PL) component, with (slightly variable) temperature , blackbody radius – and spectral index (Mereghetti et al., 2005b; Woods et al., 2007; Younes et al., 2015, 2017). The power law tail extends, seemingly unbroken, into higher energies (up to keV; see, e.g., Mereghetti et al., 2005a; Younes et al., 2017). The pulse profile is double-peaked with a pulsed fraction – in a wide energy range Woods et al. (2007); Younes et al. (2015, 2017).
The emission of a bright burst detected by several instruments on 2023, February 23 (Brivio et al., 2023; Mereghetti et al., 2023) marked the onset of a renewed period of activity from SGR 1806–20. To catch the source in an active state, IXPE observed SGR 1806–20 starting on 2023, March 22. In addition a DDT pointing with XMM-Newton was activated.
2.1 XMM-Newton
SGR 1806–20 was observed with the European Photon Imaging Camera (EPIC) on board the XMM-Newton satellite starting on 2023-04-07 00:18:48 UTC for an exposure time of about . The EPIC-pn (Strüder et al., 2001) was operating in Full Frame mode (FF; timing resolution of ). The MOS cameras (Turner et al., 2001) were set in Small Window mode (SW; timing resolution of ).
Standard procedures were applied in the extraction of the scientific products. Time intervals of high background activity were removed, resulting in a net exposure of and for the pn and the MOSs, respectively. We collected the source photons from within a circle of radius . The background level was estimated from a circular region of radius centered far from the source, on the same CCD for the pn and, due to the reduced window, in a different CCD for the MOSs. We checked for the potential impact of pile-up with the epatplot tool and found a negligible pile-up fraction of . The response matrices and ancillary files were generated by means of the rmfgen and arfgen tasks, respectively. The final source spectra were obtained by using specgroup, rebinning the channels by a factor of three in order to match the intrinsic EPIC spectral resolution and imposing a minimum of counts in each channel. Background-subtracted and exposure-corrected light curves were extracted using epiclccorr. The EPIC photon arrival times were referenced to the Solar System barycenter. The source was found at a count rate of (here and in the following uncertainties are reported at confidence level, unless specified otherwise).
2.2 IXPE
IXPE observed SGR 1806–20 from 2023-03-22 05:57:51 UTC to 2023-04-01 18:56:26 UTC and from 2023-04-03 11:41:03 UTC to 2023-04-13 22:20:20 UTC, for a total on-source time of . Processed Level 2 (LV2) photon lists, one for each of the three IXPE detector units (DUs), were downloaded from the archive at HEASARC222https://heasarc.gsfc.nasa.gov/docs/ixpe/archive/ and further processed to reduce the background with respect to the source signal.
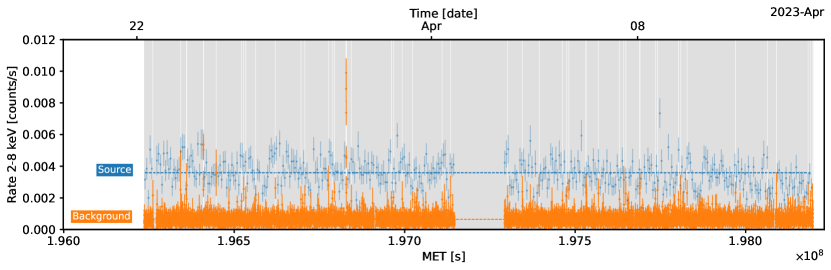
Source and background counts were extracted from a circular region centered on the source position (identified with the brightest pixel in the IXPE image) with radius and from a concentric annulus with inner and outer radius of and , respectively. In order to discriminate the background events due to charged particles and high-energy photons without affecting the genuine X-ray events, we then applied the rejection criteria described in Di Marco et al. (2023). The counting rate as a function of time is shown in Figure 1. Time periods during which the background was larger than of the source average counting rate are flagged and removed from the subsequent analysis. This step removes out of the total of the IXPE observation. Arrival times were corrected to the Solar System barycenter with the FTOOL barycorr included in HEASOFT 6.31.1, using the Jet Propulsion Laboratory Development Ephemeris 421 and the International Celestial Reference System frame.
3 Results
3.1 XMM-Newton Timing and Spectral analysis
Both pn and MOS photon arrival time lists were used in order to look for the pulsar spin signal. We started from the timing properties inferred from the most recent spin measurements of SGR 1806–20 in 2015–2016 (Younes et al., 2017) and extrapolated them to the epoch of the new XMM-Newton dataset. In particular, we assumed a spin period and a first period derivative , both referred to MJD 57202. The linear evolution of the period in 2015–2016 (see Figure 3 of Younes et al. 2017) and the relatively quiet behaviour of the source in the last few years, suggest that is constant (or at most slightly variable) since then. Correspondingly, we analyzed the new XMM-Newton datasets searching for significant peaks in the – period range, i.e. accounting for changes in and up to about with respect to the values reported by Younes et al. (2017).
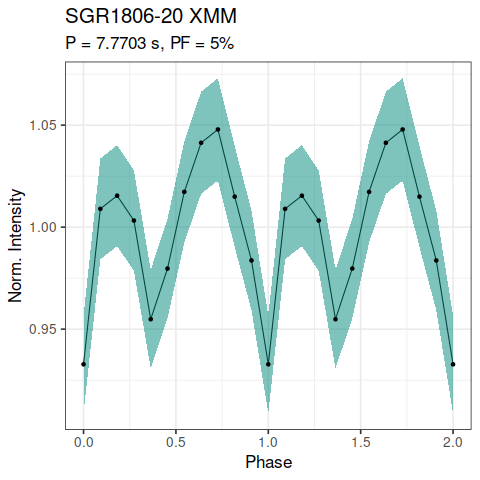
Only one significant peak with a chance probability of about of not being a statistical fluctuation, and after having corrected for the number () of independent sampling periods of the search, was found in the Rayleigh periodogram. The period is . The modulation is present both in the pn and in the MOS data alone, confirming that the signal is intrinsic to the source and not an instrumental artefact. In order to obtain a more refined measurement we applied a phase-fitting technique, which resulted in a period of (frequency ); we derived also a upper limit on the period derivative, . The – pulse shape is double-peaked, in agreement with the profiles obtained for SGR 1806–20 in the past (Younes et al., 2015). The pulsed fraction (defined as the semi-amplitude of the sinusoid divided by the source average count rate) is (see left panel of Figure 2).
| Model | Norm PL | Fluxc (Obs Unabs) | /dof. | ||||
|---|---|---|---|---|---|---|---|
| () | (keV) | (km) | – (keV) | – (km) | () | ||
| BB+PL | 6.50.3 | 0.590.04 | 1.3 | (1.30.3)10-3 | 4.3 | 351.9/298 | |
| BB+BB | 5.70.2 | 0.700.03 | 1.20.1 | 2.40.1 | 0.110.01 | 4.3 | 351.2/298 |
-
a
Derived by adopting a 8.7 kpc distance (Bibby et al., 2008).
-
b
In units of .
-
c
The fluxes are estimated in the – energy range.
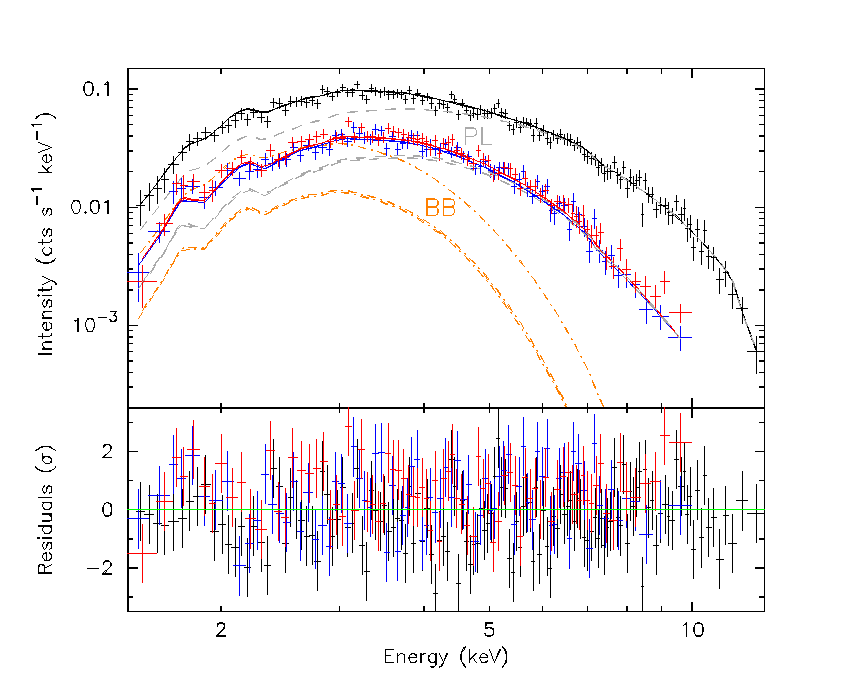
The spectral analysis of SGR 1806–20 was performed by fitting simultaneously all the EPIC datasets within XSPEC Arnaud (1996). A single component (absorbed) model, such as a PL or a BB, resulted in a poor fit (reduced – for 300 dof). A BB+PL and a BB+BB model, often adopted to describe the – magnetar spectra, yield a good agreement with the data (reduced 1.17 in both cases). The best-fitting parameters are listed in Table 1 and the EPIC spectra together with the best-fitting BB+PL model are shown in the right panel of Figure 2. We find that the addition of a second spectral component is significant to more than . Although the BB+BB and BB+PL models are equally acceptable on a statistical basis, in the following we refer to the latter. The BB+PL spectral decomposition has been widely adopted in the past for SGR 1806–20, and this choice is motivated by the clear detection of a power law tail e.g. in NuSTAR data (Younes et al., 2015, 2017). The inferred parameters are in agreement with the average values obtained in the past ten years, though the flux was unexpectedly a factor of about three lower than the average.
3.2 IXPE timing and spectro-polarimetric analysis
After background and solar-flare removal (see §2.2), no significant changes in both the source and background counts were detected in the two IXPE pointings, so that we used the combined data in our analysis.
We searched for pulsations using the statistics (Buccheri et al., 1983), which is adequate for double-peaked pulsed profiles. We joined the event lists from the three DUs and ran the search using the quasi-fast folding algorithm described in Bachetti et al. (2020, 2021). We searched over spin frequencies between and , that contained the XMM-Newton solution, and frequency derivatives . Given the low number of source counts (see below), we did not find significant peaks in the search; we derived a pulsed fraction upper limit on pulsations over the frequency interval indicated above (; c.l., evaluated following Vaughan et al. 1994). This upper limit is compatible with the detection with XMM-Newton of a pulsed fraction.
We extracted the Stokes parameters , and with the xpbin tool, exploiting the weighted analysis method Di Marco et al. (2022) implemented in the latest version (30.3) of the ixpeobssim software Baldini et al. (2022)333https://github.com/lucabaldini/ixpeobssim. As a consequence of the limited number of counts ( background-subtracted events in the three DUs), the phase- and energy-integrated (– keV) polarization degree, , is , below the Weisskopf et al. (2010), which is about for this observation and is therefore not significant444The minimum detectable polarization () is the largest signal expected to be produced by statistical fluctuations only, at a given confidence level (usually , ). The result of a polarization measurement is regarded as significant if it exceeds .. The polarization angle, , is then unconstrained. The same conclusion is reached by applying an analysis as outlined by Strohmayer (2017) within XSPEC, which provides .
In order to test if a detectable polarization is present in some specific energy intervals, we performed an energy-resolved, phase-integrated (weighted) analysis in XSPEC. We started by dividing the IXPE working energy band into equal bins (each -keV wide). The null hypothesis probability that the source is unpolarized in all the energy bins is .
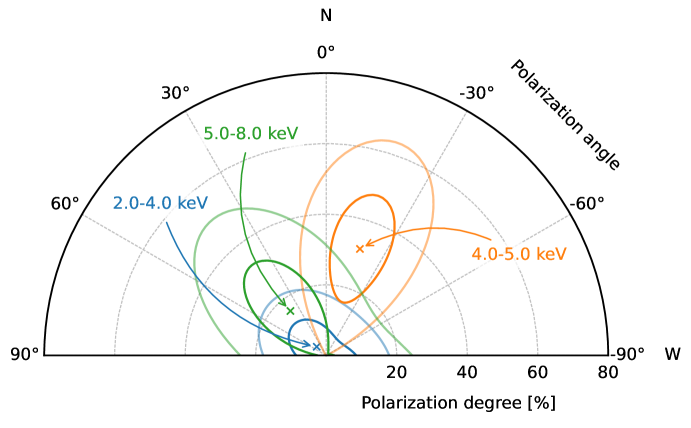
We found a signal with (slightly higher than the ) and , computed East of North, in the – range. No significant polarization was detected in the remaining bins. In particular, we found only an upper limit of and ( confidence level) in the two neighbouring bins, – and –, respectively. Despite no firm conclusion can be reached about the trend of PD with energy, this may suggest that it increases in going from to –. What happens at higher energies is harder to tell, essentially because the lower S/N ratio makes the higher and this translates into a weaker constraint on PD.
In order to improve the counting statistics we merged together the first and last pair of bins and considered the intervals –, – and –. This did not produce any improvement, resulting again in an upper limit for of and of ( confidence level) at low and high energies, respectively. Figure 3 shows the contour plots of the polarization degree and angle in each energy band, obtained with the XSPEC steppar command by assuming the spectral model obtained from the XMM-Newton observation. A somewhat different choice for the boundaries of the central interval, e.g. taking the bin from to or from to , yields consistent results.
We also attempted a phase-dependent analysis by folding the data at the spin period derived from the XMM-Newton timing and assuming (see §3.1). No significant polarization was detected after dividing the pulse cycle the into 7 equally-spaced phase bins. In the next step we restricted to two phase bins, corresponding to the intervals and , selected in such a way as to contain the secondary and primary peak of the pulse, respectively. Again no polarization was measured, either considering the entire – band or restricting to low (– keV) and high (– keV) energies. A negative result was also found limiting the analysis to the – range, where a phase-integrated signal was detected at confidence level. This was expected given that the detection is marginal even when all the counts are considered.
An unbinned analysis (without background subtraction; González-Caniulef et al., 2023) in the – keV range shows that, when marginalized over the various parameters, the median polarization degree is and about above zero. This is somewhat less than the of for the observation without binning in phase or energy.
Fits to IXPE count spectra are rather inconclusive. Single component models, either an (absorbed) BB or PL, provide a (formally) acceptable agreement with the data. However, the BB fit yields a column density of , more than twice lower than that measured by XMM-Newton and previously reported in the literature. On the other hand, the parameters derived from the PL fit are consistent (within ) with those from the XMM-Newton BB+PL fit, but this just reflects the limited IXPE energy range (–). When a single PL model is extended to the entire XMM-Newton energy band the fit is no longer satisfactory (see §3.1). A fit with a two component model (BB+BB or BB+PL) leaving all the parameters free to vary is largely unconstrained, although by freezing all the parameters (except the normalizations) to those derived from the XMM-Newton data provides a good fit ( for dof).
A joint fit of the three Stokes parameters with the XSPEC model phabs (bbodyradpolconst powerlawpolconst), freezing again all the spectral parameters to those of the XMM-Newton analysis, does not provide any conclusive result. The upper limit ( confidence level) on the polarization degree of the PL is about while the polarization of the BB is unconstrained. A similar conclusion is reached by truncating the PL at low energies. We remark that, while the fit is statistically acceptable in all these cases, nothing can be said about the relative polarization direction between the two components.
4 Discussion
IXPE observed SGR 1806–20 in two segments for a total exposure time of about in March–April 2023. During the second stint, XMM-Newton targeted the source for about to provide complementary spectral and timing information. Despite the renewed bursting activity, SGR 1806–20 was found at a (unabsorbed) flux level of in the – band, the lowest ever recorded, although still compatible within the uncertainties with the NuSTAR one reported by Younes et al. (2017). XMM-Newton spectra are well fitted by an (absorbed) BB+PL model and the spectral parameters (, , ) are in broad agreement with those found by Younes et al. (2017). There is, however, a hint for a decrease of the BB radius with respect to the values measured by Younes et al. (2017) in 2015–2016, even if their NuSTAR data did not allow for a precise determination of the BB flux, and of a steepening of the PL with respect to the values measured by XMM-Newton in the same energy range prior to 2011 (Younes et al., 2015). The period and the upper limit for we found are consistent with the past timing history of the source. The XMM-Newton pulse profile is double peaked with a pulsed fraction , in agreement with previous measurements, while no pulsations were detected in the IXPE data.
The low flux level of SGR 1806–20 and the high background prevented a complete spectro-polarimentric and timing analysis of IXPE data. No pulsations were detected, with an upper limit of on the pulsed fraction. Although poorly constrained, the IXPE spectrum is compatible with the BB+PL decomposition obtained from the analysis of XMM-Newton data. No significant polarization has been detected integrating over the source rotational period and in the – keV energy band.
Interestingly, by restricting the analysis to the – keV range we found a polarization signal significant at confidence level, with PD and PA . At lower (– keV) and higher (– keV) energies only upper limits can be derived on PD, with values at of and , respectively.
Although XMM-Newton spectra are compatible with both a BB+PL and a BB+BB decomposition, the former is in our opinion favored, as discussed in §3.1. If the power law tail is associated with RCS, the predicted polarization degree saturates at in the energy interval where this component dominates Taverna et al. (2020). The thermal emission can originate either from a magnetized, cooling atmosphere, with PD – (except for very peculiar viewing geometries, see e.g. Taverna et al., 2015), or from the bare, condensed surface of the star, in which case a much lower PD – is expected. It has been also proposed that radiation emerging from atmospheres heated from above by particle bombardment has a modest polarization degree (comparable to that of the condensed surface, González-Caniulef et al., 2019; Doroshenko et al., 2022).
The constraints placed by the upper limits at low and high energies, together with a -c.l. polarization degree of at intermediate energies (where the thermal and non-thermal component coexist, see above) are compatible with a picture in which thermal emission comes from the bare NS surface or from an atmosphere heated by backflowing particles. This scenario was also applied to 4U 0142+61, where a clear swing of PA with energy was detected, signalling that radiation is dominated by O-mode photons (coming from the condensed surface/heated atmosphere) at low energies and by X-mode photons (reprocessed by scatterings) at higher ones. The two sources may therefore be similar. Due to the low signal-to-noise ratio, no conclusion can be drawn about the dependence of the polarization direction on the energy and hence on which polarization mode is prevailing in a given energy range. However, emission from a condensed surface/heated atmosphere can be either mostly in the X- or in the O-mode (depending e.g. on the orientation of the local magnetic field and the photon energy for the former and on the temperature gradient for the latter, see Taverna et al., 2022; Zane et al., 2023), so that a swing in PA is not necessarily expected.
Along this line, we explored a simple RCS model, in which thermal emission comes from two hot spots placed near the magnetic equator of the bare NS surface, including vacuum birefringence. With this choice of the emission geometry (similar to that adopted for 4U 0142+61), radiation from the magnetic condensate exhibits a relatively large polarization degree ( in the O-mode) at low energies (; Taverna et al., 2022). Since the magnetic field in the outer layers of a magnetar is expected to locally deviate from a dipole, the surface thermal map is likely different from the usual (dipolar) one, in which the hotter regions are around the magnetic poles, and may change in time (see Tiengo et al., 2013; Borghese et al., 2021, for some observational evidences; see also De Grandis et al. 2020, 2021 for theoretical considerations). Such a configuration indeed reproduces quantitatively both the observed XMM-Newton – keV spectrum and the – keV pulse profile, as well as being compatible with the IXPE detection/upper limits of PD in different energy bins (see Figure 3).
The low pulsed fraction of SGR 1806–20 points to a sizable emitting surface area, as further supported by the inferred BB radius, , rather large compared to that usually seen in other magnetar sources (–; Olausen & Kaspi, 2014, see references therein). The actual size of the emitting region depends on the emission properties of the surface (and also on the geometry and viewing angle of the source). For poorly radiating surfaces, like a magnetic condensate, it is typically larger than . In the model outlined above, the (total) size is , for an assumed star radius . The size of the emitting region is not per se a primary factor in establishing the intrinsic polarization properties of the source, which are mostly determined by the physical processes occurring in the surface/magnetosphere and by the source geometry. Indeed, by replacing in our model the magnetic condensate with a fully ionized, magnetized, H atmosphere produces too a large polarization degree at lower energies. On the other hand, the extent to which QED affects the observed polarization depends on the size of the emitting area. If radiation comes from a limited region, across which the direction of the -field changes little, vacuum birefringence produces almost no detectable effect, i.e. the predicted polarization at infinity is the same with or without QED. In case the emitting area has size , instead, the polarization computed without QED effects is quite lower than that with QED. Despite SGR 1806–20 appears promising in this respect, the low counting statistics prevented us to test the QED vs. no-QED scenario.
The quite large upper limit above does not rule out different emission scenarios in which the PD is actually larger than , the value predicted by saturated RCS. Phase-averaged values as high as , for instance, may hint at the presence of hot gaseous caps on the star surface, as proposed by Zane et al. (2023) for 1RXS J1708. This possibility would be still consistent with the spectral properties of the source, given that a BB+BB model also provides a good representation of XMM-Newton spectra.
IXPE observations of magnetars have clearly demonstrated the capabilities of polarization measurements in probing the physical conditions in strongly magnetized neutron stars. This includes the presence of QED effects, in favor of which indirect evidences were already gathered from the analysis of 4U 0142+61 and 1RXS J1708. The emerging picture shows substantial differences in the polarization pattern between 4U 0142+61 (and possibly SGR 1806–20) and 1RXS J1708, signalling that emission at higher energies (–) may arise from different physical conditions in the different sources. As the case of SGR 1806–20 shows, collecting enough counts is crucial in providing clear-cut results. Further progress will require observing a larger sample of weaker sources which will be possible for IXPE only with longer exposure times.
References
- Arnaud (1996) Arnaud, K. A. 1996, in Astronomical Society of the Pacific Conference Series, Vol. 101, Astronomical Data Analysis Software and Systems V, ed. G. H. Jacoby & J. Barnes, 17
- Atteia et al. (1987) Atteia, J. L., Boer, M., Hurley, K., et al. 1987, ApJ, 320, L105, doi: 10.1086/184984
- Bachetti et al. (2021) Bachetti, M., Pilia, M., Huppenkothen, D., et al. 2021, ApJ, 909, 33, doi: 10.3847/1538-4357/abda4a
- Bachetti et al. (2020) Bachetti, M., Maccarone, T. J., Brightman, M., et al. 2020, ApJ, 891, 44, doi: 10.3847/1538-4357/ab6d00
- Baldini et al. (2022) Baldini, L., Bucciantini, N., Di Lalla, N., et al. 2022, SoftwareX, 19, 101194, doi: 10.1016/j.softx.2022.101194
- Bibby et al. (2008) Bibby, J. L., Crowther, P. A., Furness, J. P., & Clark, J. S. 2008, MNRAS, 386, L23, doi: 10.1111/j.1745-3933.2008.00453.x
- Borghese et al. (2021) Borghese, A., Rea, N., Turolla, R., et al. 2021, MNRAS, 504, 5244, doi: 10.1093/mnras/stab1236
- Brivio et al. (2023) Brivio, R., Ferro, M., Palmer, D. M., et al. 2023, GRB Coordinates Network, 33451, 1
- Buccheri et al. (1983) Buccheri, R., Bennett, K., Bignami, G. F., et al. 1983, A&A, 128, 245
- Caiazzo et al. (2022) Caiazzo, I., González-Caniulef, D., Heyl, J., & Fernández, R. 2022, MNRAS, 514, 5024, doi: 10.1093/mnras/stac1571
- De Grandis et al. (2021) De Grandis, D., Taverna, R., Turolla, R., et al. 2021, ApJ, 914, 118, doi: 10.3847/1538-4357/abfdac
- De Grandis et al. (2020) De Grandis, D., Turolla, R., Wood, T. S., et al. 2020, ApJ, 903, 40, doi: 10.3847/1538-4357/abb6f9
- Di Marco et al. (2022) Di Marco, A., Costa, E., Muleri, F., et al. 2022, AJ, 163, 170, doi: 10.3847/1538-3881/ac51c9
- Di Marco et al. (2023) Di Marco, A., Soffitta, P., Costa, E., et al. 2023, AJ, 165, 143, doi: 10.3847/1538-3881/acba0f
- Doroshenko et al. (2022) Doroshenko, V., Poutanen, J., Tsygankov, S. S., et al. 2022, Nature Astronomy, 6, 1433, doi: 10.1038/s41550-022-01799-5
- Duncan & Thompson (1992) Duncan, R. C., & Thompson, C. 1992, ApJ, 392, L9, doi: 10.1086/186413
- Fernández & Davis (2011) Fernández, R., & Davis, S. W. 2011, ApJ, 730, 131, doi: 10.1088/0004-637X/730/2/131
- Fernández & Thompson (2007) Fernández, R., & Thompson, C. 2007, ApJ, 660, 615, doi: 10.1086/511810
- González-Caniulef et al. (2023) González-Caniulef, D., Caiazzo, I., & Heyl, J. 2023, MNRAS, 519, 5902, doi: 10.1093/mnras/stad033
- González-Caniulef et al. (2019) González-Caniulef, D., Zane, S., Turolla, R., & Wu, K. 2019, MNRAS, 483, 599, doi: 10.1093/mnras/sty3159
- Heyl & Shaviv (2000) Heyl, J. S., & Shaviv, N. J. 2000, MNRAS, 311, 555, doi: 10.1046/j.1365-8711.2000.03076.x
- Heyl & Shaviv (2002) —. 2002, Phys. Rev. D, 66, 023002, doi: 10.1103/PhysRevD.66.023002
- Hurley et al. (2005) Hurley, K., Boggs, S. E., Smith, D. M., et al. 2005, Nature, 434, 1098, doi: 10.1038/nature03519
- Kaspi & Beloborodov (2017) Kaspi, V. M., & Beloborodov, A. M. 2017, ARA&A, 55, 261, doi: 10.1146/annurev-astro-081915-023329
- Kouveliotou et al. (1987) Kouveliotou, C., Norris, J. P., Cline, T. L., et al. 1987, ApJ, 322, L21, doi: 10.1086/185029
- Lai (2023) Lai, D. 2023, Proceedings of the National Academy of Science, 120, e2216534120, doi: 10.1073/pnas.2216534120
- Laros et al. (1987) Laros, J. G., Fenimore, E. E., Klebesadel, R. W., et al. 1987, ApJ, 320, L111, doi: 10.1086/184985
- Mazets et al. (1981) Mazets, E. P., Golenetskii, S. V., Ilinskii, V. N., et al. 1981, Ap&SS, 80, 3, doi: 10.1007/BF00649140
- Mereghetti et al. (2023) Mereghetti, S., Gotz, D., Ferrigno, C., et al. 2023, GRB Coordinates Network, 33494, 1
- Mereghetti et al. (2005a) Mereghetti, S., Götz, D., Mirabel, I. F., & Hurley, K. 2005a, A&A, 433, L9, doi: 10.1051/0004-6361:200500088
- Mereghetti et al. (2005b) Mereghetti, S., Tiengo, A., Esposito, P., et al. 2005b, ApJ, 628, 938, doi: 10.1086/430943
- Nobili et al. (2008) Nobili, L., Turolla, R., & Zane, S. 2008, MNRAS, 386, 1527, doi: 10.1111/j.1365-2966.2008.13125.x
- Olausen & Kaspi (2014) Olausen, S. A., & Kaspi, V. M. 2014, ApJS, 212, 6, doi: 10.1088/0067-0049/212/1/6
- Palmer et al. (2005) Palmer, D. M., Barthelmy, S., Gehrels, N., et al. 2005, Nature, 434, 1107, doi: 10.1038/nature03525
- Santangelo et al. (2019) Santangelo, A., Zane, S., Feng, H., et al. 2019, Science China Physics, Mechanics, and Astronomy, 62, 29505, doi: 10.1007/s11433-018-9234-3
- Strohmayer (2017) Strohmayer, T. E. 2017, ApJ, 838, 72, doi: 10.3847/1538-4357/aa643d
- Strüder et al. (2001) Strüder, L., Briel, U., Dennerl, K., et al. 2001, A&A, 365, L18, doi: 10.1051/0004-6361:20000066
- Taverna et al. (2014) Taverna, R., Muleri, F., Turolla, R., et al. 2014, MNRAS, 438, 1686, doi: 10.1093/mnras/stt2310
- Taverna et al. (2015) Taverna, R., Turolla, R., Gonzalez Caniulef, D., et al. 2015, MNRAS, 454, 3254, doi: 10.1093/mnras/stv2168
- Taverna et al. (2020) Taverna, R., Turolla, R., Suleimanov, V., Potekhin, A. Y., & Zane, S. 2020, MNRAS, 492, 5057, doi: 10.1093/mnras/staa204
- Taverna et al. (2022) Taverna, R., Turolla, R., Muleri, F., et al. 2022, Science, 378, 646, doi: 10.1126/science.add0080
- Thompson & Duncan (1993) Thompson, C., & Duncan, R. C. 1993, ApJ, 408, 194, doi: 10.1086/172580
- Thompson et al. (2002) Thompson, C., Lyutikov, M., & Kulkarni, S. R. 2002, ApJ, 574, 332, doi: 10.1086/340586
- Tiengo et al. (2013) Tiengo, A., Esposito, P., Mereghetti, S., et al. 2013, Nature, 500, 312, doi: 10.1038/nature12386
- Turner et al. (2001) Turner, M. J. L., Abbey, A., Arnaud, M., et al. 2001, A&A, 365, L27, doi: 10.1051/0004-6361:20000087
- Turolla et al. (2015) Turolla, R., Zane, S., & Watts, A. L. 2015, Reports on Progress in Physics, 78, 116901, doi: 10.1088/0034-4885/78/11/116901
- van Adelsberg & Perna (2009) van Adelsberg, M., & Perna, R. 2009, MNRAS, 399, 1523, doi: 10.1111/j.1365-2966.2009.15374.x
- Vaughan et al. (1994) Vaughan, B. A., van der Klis, M., Wood, K. S., et al. 1994, ApJ, 435, 362, doi: 10.1086/174818
- Weisskopf et al. (2010) Weisskopf, M. C., Guainazzi, M., Jahoda, K., et al. 2010, ApJ, 713, 912, doi: 10.1088/0004-637X/713/2/912
- Weisskopf et al. (2022) Weisskopf, M. C., Soffitta, P., Baldini, L., et al. 2022, Journal of Astronomical Telescopes, Instruments, and Systems, 8, 1 , doi: 10.1117/1.JATIS.8.2.026002
- Woods et al. (2007) Woods, P. M., Kouveliotou, C., Finger, M. H., et al. 2007, ApJ, 654, 470, doi: 10.1086/507459
- Younes et al. (2017) Younes, G., Baring, M. G., Kouveliotou, C., et al. 2017, ApJ, 851, 17, doi: 10.3847/1538-4357/aa96fd
- Younes et al. (2015) Younes, G., Kouveliotou, C., & Kaspi, V. M. 2015, ApJ, 809, 165, doi: 10.1088/0004-637X/809/2/165
- Zane et al. (2023) Zane, S., Taverna, R., González-Caniulef, D., et al. 2023, ApJ, 944, L27, doi: 10.3847/2041-8213/acb703