Eccentric Gas disk Orbiting the white dwarf SDSS J1228+1040
Abstract
Metal pollution onto white dwarfs is a wide-spread phenomenon that remains puzzling. Some of these white dwarfs also harbour gaseous debris disks. Their emission lines open a unique window to the physical properties of the polluting material, lending insights to their origin. Here, we model the emission line kinematics for the gas disk around SDSS J1228+1040, a system that has been continuously monitored for over two decades. Our model shows that the disk mass is strongly peaked at one solar radius (modulo the unknown inclination), and the disk eccentricity decreases from a value of at the disk inner edge, to nearly zero at the outer edge. This eccentricity profile is exactly what one expects if the disk is in a global eccentric mode, precessing rigidly under the combined forces of general relativity and gas pressure, and with a period of 20 yrs. The gas disk contains a mass that is roughly equivalent to that of a 100-km rocky body, while the mass of the accompanying dust disk is likely insignificant. The disk eccentricity confirms an origin in tidal disruption, and we suggest that the disrupted body is sourced from a Mars-mass planetesimal disk within a few AU. More detailed analysis of this disk is warranted.
1 Introduction
About a third of all white dwarfs show signs of on-going or recent accretion of heavy metals (e.g., Zuckerman et al., 2003). And starting from the first example of white dwarf G29-38 (Koester, 1987; Graham et al., 1990; Jura, 2003), many are now known to also exhibit infrared excesses, signs of circumstellar dust disks (e.g. Kilic et al., 2005, 2006; Farihi et al., 2009; Debes et al., 2011, 2012). These disks are likely metallic in composition and are responsible for the pollution. It is now commonly believed that large asteroids (and/or comets) around these stars are, for some reason, excited to high eccentricities and are tidally disrupted when they approach the white dwarfs within the Roche radius. The resulting debris forms the dust disk. However, many key elements in this story, including the source and the orbital excitation for these bodies, remain mysterious (for a review, see Farihi, 2016).
Interestingly, a few percent of these dusty white dwarfs are also known to possess gaseous debris disks (Manser et al., 2020). First discovered from SDSS data by Gänsicke et al. (2006) around the white dwarf SDSS J122859.93+104032.9 (short-named as J1228 below), about two dozens such disks are now known (Gänsicke et al., 2006, 2007, 2008; Farihi et al., 2012; Gentile Fusillo et al., 2021). These disks manifest as double-peaked emission lines in the spectra, most conspicuously in Ca II infrared triplets. They are found exclusively around white dwarfs hotter than , likely because only such stars are bright enough to sublimate dust at a distance of . As these hot stars consitute only a few percent of all white dwarfs, it is likely that most hot white dwarfs with dust disks also possess gas disks.
Unlike dust disks which reveal little about their kinematics, compositions, or density distributions (e.g., see a discussion in Nixon et al., 2020), gaseous disks open a lucky window. The characteristic double-peaked emission lines from these disks contain information about their radial extent, eccentricity, surface density and temperature profiles. Interestingly, many gaseous disks around white dwarfs exhibit asymmetric lines, most easily interpreted as the signature of an eccentric disk. Moreover, these disks also appear to be time variable (e.g., Wilson et al., 2014, 2015). For instance, J1228, the best monitored system (Manser et al., 2016, 2019), shows gradual variations of its line profile over a timescale of decades. This is much longer than the local Keplerian timescale, which is of order hours.
This kinematic information offers the hope of understanding the origin of these debris disks. Here, we undertake a study of the J1228 gaseous disk, with an aim to answer the following specific questions.
First, how does the disk manage to retain its eccentric shape? This disk is known to extend radially of order unity. If so, general relativistic effects precess the gas differentially, and would have led to its total circularization within a few decades. In fact, such a consideration motivates Hartmann et al. (2011); Metzger et al. (2012); Cauley et al. (2018); Fortin-Archambault et al. (2020) to propose that the observed line profiles are not due to an eccentric disk, but are instead due to non-axisymmetric brightness patterns (a vortex, or a spiral wave) on a circular disk. We resolve this issue by first fitting a physically motivated disk model (§2) against detailed observations (§3), and then considering what resists the differential precession (§4).
Second, we hope to shed some light on the origin of such a disk. The gas density distribution and other physical quantities, extracted from our physical model, are analyzed towards this end (§5).
2 Physical Model
We will construct a Keplerian disk model to reproduce the observed double-peaked line profiles in the Ca II infrared triplet.
In such an exercise, as one only measures the line-of-sight velocity, and is ignorant of the orbital period, one can only determine the length combination, , where is the orbital inclination. This differs from the usual radial velocity literature where one also knows the orbital period and can determine . We suppress the factor in this section, but re-introduce it in later discussions.
Furthermore, in order to translate line flux into gas density, we need to consider the physics of emission. The Ca II triplet are most likely recombination lines, namely, spontaneous emission from excited levels of Ca II ions after their photo-ionization and recombination. The line fluxes should, therefore, scale linearly with the rate of recombination, which, at equilibrium, equals the rate of photo-ionization. So the emissivity , where is the number density of ionizing photons from the white dwarf, and that of Ca II. The above scaling remains valid even when the disk is very optically thick to the recombination lines (as is the case for our disk).
This consideration allows us to determine the local gas density, under some simplifying assumptions. In particular, we will assume that depends on the radial distance from the white dwarf as , with being a free parameter. We expect when the disk is optically thin to the ionizing photons. We will also assume that the disk has a negligible vertical extent and is not being viewed nearly edge-on. These allow us to determine the local column density from the height-integrated emission. Lastly, we assume that Ca II perfectly traces the local gas density.
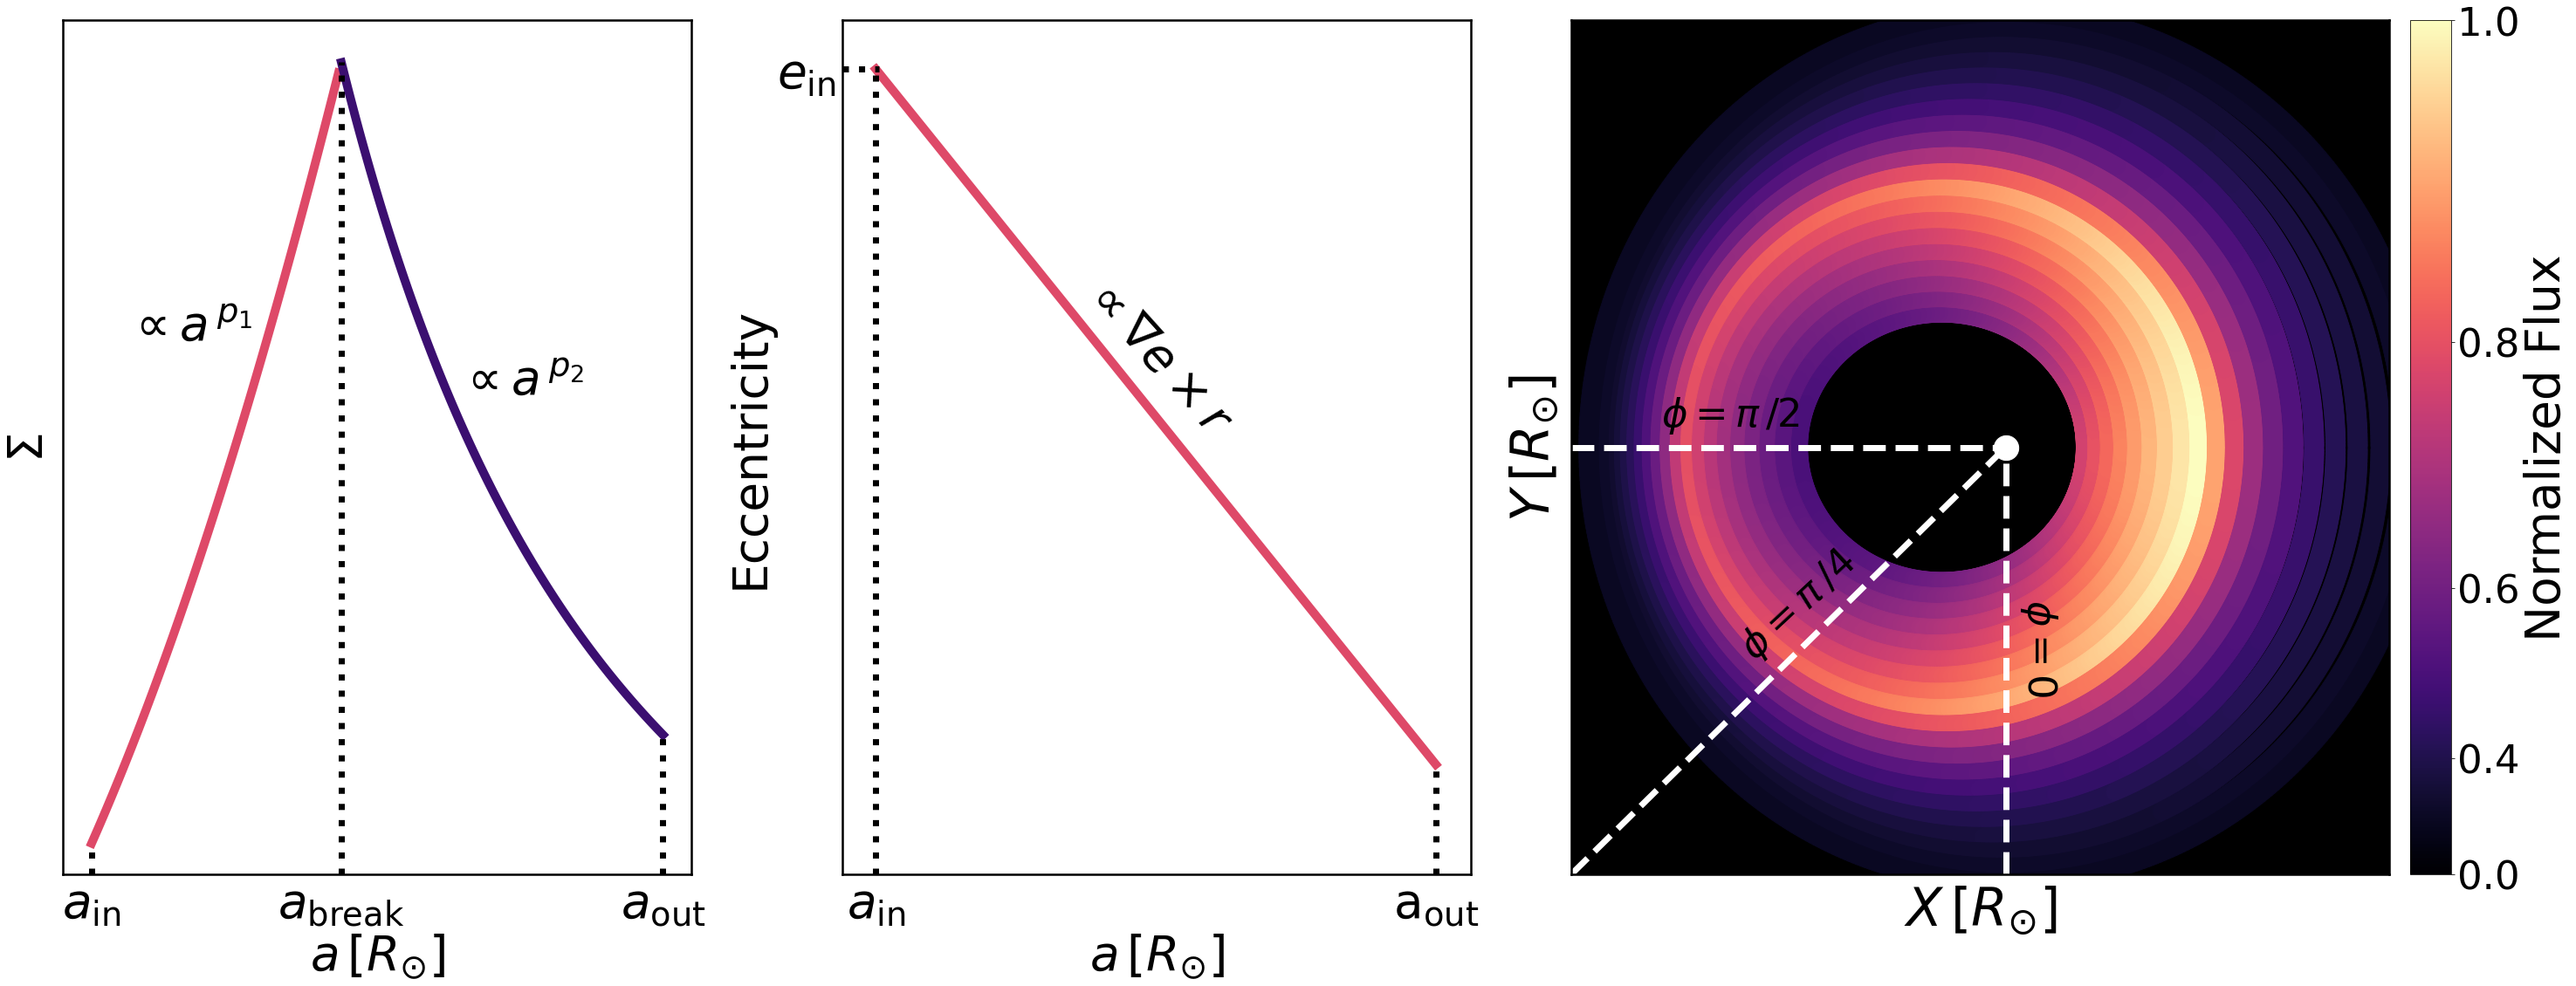
We model the gas disk around J1228 as an assembly of tightly packed, con-focal elliptical Keplerian rings. Their semi-major axes are evenly distributed between and . The gas surface density profile is assumed to be a broken power-law with a transition radius :
| (1) |
Such a broken profile is motivated by the observed line profiles, which also suggest that and .
As the simplest approximation, we assume that the ring eccentricities vary linearly with the semi-major axis as
| (2) |
We do not specify the sign of the eccentricity gradient (). The rings are assumed to remain apse-aligned at all times. This requires the disk to precess rigidly, a working assumption we justify in §4.
The line emissivity , from a ring segment of length , is therefore
| (3) |
with being the Keplerian velocity of the segment. The first factor () describes the radial dependence for the ionizing flux, and the last factor describes the fractional mass within the line segment. This scales inversely with the local Keplerian velocity as mass is conserved along a Keplerian streamline. This behaviour is behind the so-called ‘apocentre glow’ in debris disks(Pan et al., 2016; MacGregor et al., 2017). The overall normalization constant is discussed in §5, where we show that our model disk correctly accounts for the observed flux.
To assign a Doppler velocity to the above line segment, we introduce a phase angle , where corresponds to the case where the orbital long axis lie on the plane of the sky. The resultant line profile is symmetric at this phase, while the line is at its more asymmetric when .
3 MCMC And Results
3.1 Markov Chain Monte-Carlo
Manser et al. (2016) have gathered spectra of J1228 from March 2003 to May 2015 in a total of 18 epochs, using the VLT, the SDSS telescope and the WHT. C. Manser has kindly provided us with the data. Some subsequent observations are presented in Manser et al. (2019) but are not used for fitting.
To prepare the emission profiles for analysis, we convert the Ca-II triplet data from wavelength (Å) to velocity (), using the atomic rest-wavelengths, and a systemic velocity of . This value is within the range reported by Manser et al. (2016): .111One can also determine the systemic velocity from the white dwarf spectra, after accounting for a gravitational redshift of for lines emitted from the surface of the white dwarf. It is chosen so that the emission lines at the June 2007 epoch, which have very similar amplitudes in the blue- and red-shifted peaks, are also symmetric in the velocity space. We co-add the three lines to produce a joint line profile.
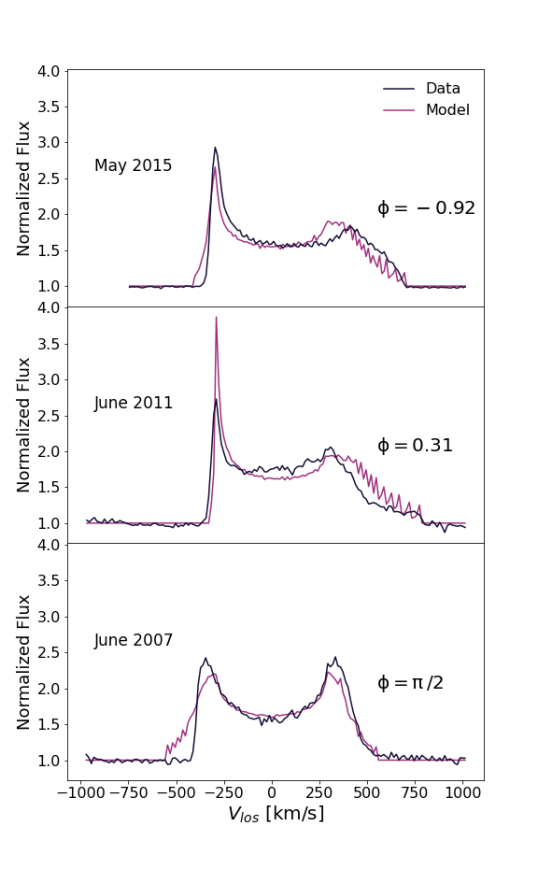
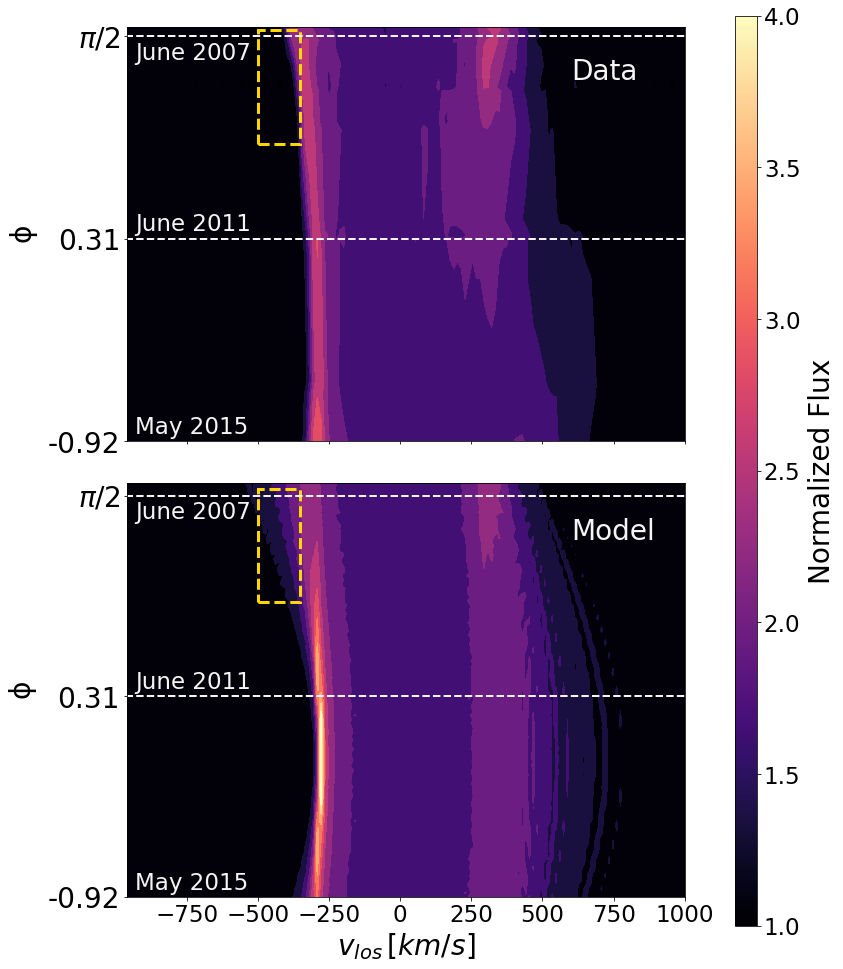
The precession of the disk means we have the good fortune to observe it from different vantage points, each giving some unique constraints on the disk model. We decided, initially, to focus on data from three (equally spaced) epochs: June 2007, June 2011, and May 2015. We assign a phase of to the first epoch (most symmetric), and phases of and to the remaining two. This choice is motivated by our inferred precession period of (see below). Our initial attempt did not produce a satisfactory fit to the June 2007 data, so we proceed to include two more epochs, April 2007 and July 2007, with their corresponding values, into the procedure. This serves to strengthen the model constraint around .
We now determine the best fit model parameters, using the emcee (Foreman-Mackey et al., 2013) implementation of the Markov Chain Monte-Carlo (mcmc) method.
This procedure requires appropriate priors. For each of our 8 parameters, we choose a flat prior over a wide range (Table 1). Our prior on the eccentricity profile warrants some comments. First, we posit that everywhere. To avoid streamline crossing within the disk, we further impose the condition (Goldreich & Tremaine, 1979)
| (4) |
We run emcee with 100 walkers and iterate each for 4000 steps. This ensures that the auto-correlation time is a sufficiently small fraction of the total run. We then trim the first 2000 steps to minimize the effects of the initial conditions. The full results are presented in Figure 4. There is a good convergence for all parameters, though some show a slight (but unimportant) bimodal distributions in their posteriors. The maximum-likelihood parameters, and their corresponding uncertainties, are presented in Table 1. Furthermore, the resultant line profiles for the three chosen epochs are presented in Figure 2; while Fig. 3 illustrates them for a continuum of phases.
While the overall comparison is satisfactory, we note that the data show a conspicuous shortage of emission in the blue wing at (bottom panel in Fig. 2, yellow box in Fig. 3). This is the phase where we expect symmetric emission, and indeed the blue and the red peaks do look symmetric. The deficit is only in the wing, and it persists in observations from nearby epochs (April and July 2007). The latter rules out the possibility that the choice of our epoch is the cause of such an asymmetry. We have no explanation for this deficit.
3.2 Disk Properties
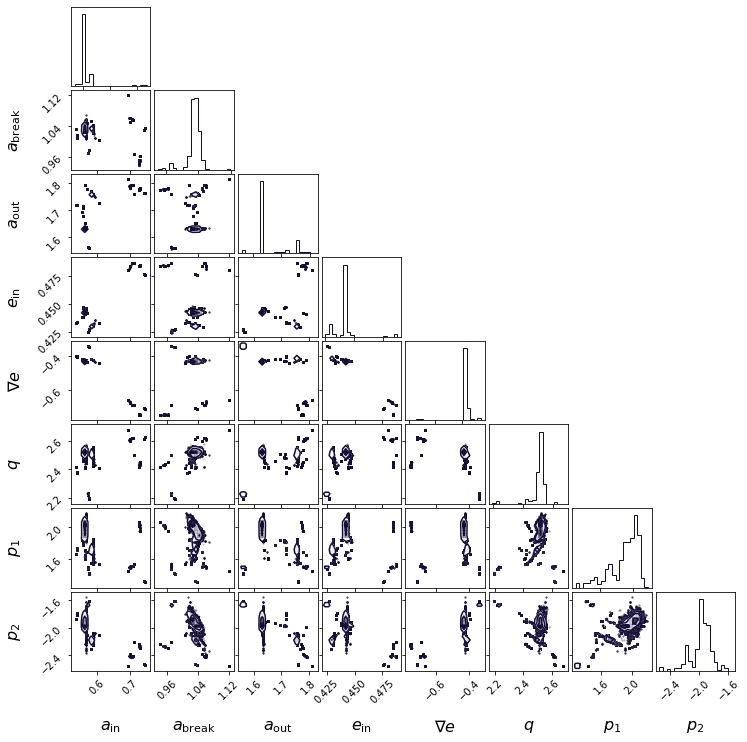
We now review the properties of our best-fit model. Gänsicke et al. (2006) and Hartmann et al. (2016) have previously determined the inner and outer radii for the gas disk: and . Our solutions are broadly consistent with their values, with and . Bear in mind that these are larger than the physical lengths by . Our value for the inner eccentricity () is also consistent with that inferred by Manser et al. (2016, 2019) This value is higher than the value in the original discovery paper (Gänsicke et al., 2006), because they happened to catch the lines when they were more symmetric.
Our most interesting result is the eccentricity gradient. We find a significant and negative eccentricity gradient: . Compared to the inner disk, the outer disk is substantially more circular, and is in fact consistent with being circular. This result can be intuitively understood by looking at the top panel of Fig. 2: the sharp spike in the blue wing comes about because the rings are compressed together at apoapse (both in physical space and in velocity space). To do so, the inner part of the disk has to be more eccentric. We return to this negative eccentricity gradient in §4.
| Parameter | Prior | Solution | |
|---|---|---|---|
| Mean () | Uncertainty () | ||
| 0.57 | |||
| 1.0 | |||
| 1.7 | |||
| 0.44 | |||
| Eqn. 4 | -0.42 | ||
| 2.4 | |||
| 1.8 | |||
| -1.9 | |||
With our inferred surface density profile (power-law indexes ), the mass of the disk is strongly concentrated around . We also find that , slightly steeper than our expectation for an optically thin disk (). It is worth commenting that, while one naively expects a degeneracy between and , since all of them describe radial dependencies ( on radius, while on semi-major axis), Fig. 4 convincingly shows that the degeneracy is broken, likely by the fact that the rings are substantially eccentric.
4 Rigidly Precessing Disk
Here, we first argue that the disk cannot be differentially precessing, as general relativity would have it. We then show, using the tool of linear eigen-mode calculations, that it has the appropriate gas pressure to resist differential GR precession. In fact, both the observed precession period and the eccentricity profile agree with theoretical expectations. We thus firmly establish a long-suspected behaviour, that the J1228 disk is rigidly precessing.
We first establish a new estimate for the observed precession period. Previously, Manser et al. (2016) reported a period of 24-30 yrs, based on data up to May 2015. More recent monitoring extends the data to May 2018 (Manser et al., 2019) . From these, one infers that the triplet evolves through a symmetric profile around Oct. 2017. The last time they did so was around July 2007. This led us to refine the precession period to a value of 20.5 yrs.
We now also insert the factor of where necessary. Previously, Gänsicke et al. (2006) have assigned an inclination of to the disk, based on the crude arguments that the disk is far from being face-on (double-peaked emission), and is also not edge-on (no self-absorption). This value remains uncertain, so we keep it as a variable.
4.1 GR Makes It Differential
An eccentric ring that is in proximity of the white dwarf experiences general relativistic (GR) precession. Let the complex eccentricity be
| (5) |
where is the longitude of pericentre measured relative to a fixed direction in space. GR acts to advance at a rate
| (6) |
where is the Keplerian frequency.
Since our gas disk extends radially by of order unity, the above equation suggests that the eccentric disk should have been markedly twisted after only yrs, the precession period for the inner most orbit. If so, streamlines from different orbits could have crossed, and the resulting dissipation should have circularized and shrunk the disk. In contrast, the sharp spikes seen in the line profiles suggest a significant eccentricity. In fact, the disk has been observed to remain the same eccentric shape for over 20 yrs.
For this reason, previous studies have argued that J1228 and other similar white dwarfs do not harbour eccentric disks, but instead host circular disks with non-axisymmetric brightness patterns (e.g., spiral wave, vortex, Hartmann et al., 2011; Metzger et al., 2012).There are also suggestions of eccentric disks but with misaligned apses (Cauley et al., 2018; Fortin-Archambault et al., 2020). These proposals, while being able to provide reasonable fits to the data, are not physically motivated. An asymmetric pattern on a circular disk can be rapidly sheared out on the Keplerian timescale (even faster than GR); and an eccentric disk with misaligned apses are not known to be self-sustaining.
4.2 Pressure Keeps It Rigid
In our work, we opt to model the disk as a series of apse-aligned rings that rigidly precess. We now confirm that this is physically motivated.
First, the radial pressure gradient also causes precession, at a rate that is, to order of magnitude,
| (7) |
for a ring with width (Goodchild & Ogilvie, 2006; Teyssandier & Ogilvie, 2016). To be competitive against GR (eq. 6), we only need , or a gas temperature222Cooler disks may still maintain rigid precession, but will require a very steep eccentricity gradient.
| (8) |
where we have evaluated at and have scaled the mean-molecular weight against that for singly-ionized metallic gas (see below). The temperature of the gas disk is likely controlled by photo-ionization and ranges from to (Melis et al., 2010, also our own CLOUDY experiments). So the whole disk can easily communicate via pressure, and can smooth out any precessional mis-demeanour.
The negative eccentricity gradient we report here supports the hypothesis that the disk is rigidly precessing. Such a configuration means that the rings are more compressed together at their apocentres. The radial pressure gradient there tends to precess the inner streamline backwards, while precess the outer streamlines forwards. This equilibrates their differential GR rates (eq. 6).
We now make the above arguments more quantitative. We follow Miranda & Rafikov (2018) to compute the eccentricity eigenmode, the global coherent response of the disk to an eccentricity perturbation. Teyssandier & Ogilvie (2016) have studied the linear response of a locally isothermal, 3-D disk. For the case of a power-law disk, where the surface density scales as , and where the temperature also obeys a power-law,
| (9) |
Miranda & Rafikov (2018) simplified the Teyssandier & Ogilvie (2016) equation into
| (10) |
where is the (apse-aligned) eccentricity eigenfunction, and the frequency of global precession. The isothermal sound speed is and we adopt (see §5).
For our problem, since we only measure the length combination , we transform the above equation to
| (11) |
where and .
One seems to have some flexibilities in choosing the boundary condition (see, e.g. Miranda & Rafikov, 2018). We adopt the following set
| (12) |
These differ from that in Miranda & Rafikov (2018), where they also took at the outer boundary. Our adopted one is more descriptive of our best-fit solution. In any case, this does not much affect the precession rate.
For our broken power-law disk, we integrate Eq. 11 from the two boundaries towards and insist that and remain continuous across . We then look for eigenmodes of the lowest radial order. These have the smoothest eccentricity profiles and hence the lowest dissipation rates.
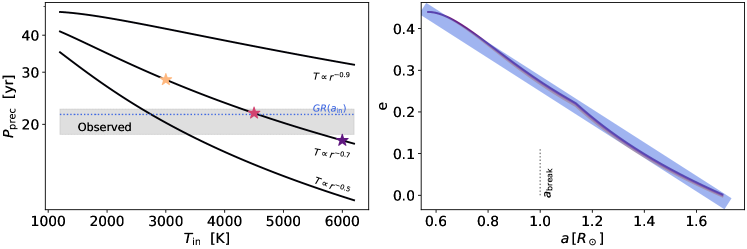
We present in Fig. 5 the results of these calculations, adopting the best-fit model parameters from Table 1.As we do not have information on the values of and , we experiment within some sensible ranges. These calculations are performed for , but the conclusion remains largely the same, given our uncertainties in and , for inclinations as low as .
We conclude two findings. First, within the relevant range of , and sensible temperature profiles (), we find that the theoretical modes have periods comparable to the observed value ( yrs). Second, even though we have only modelled the disk using a linear profile (the simplest choice), this profile agrees very well with the shape of the linear eigen-functions. These two quantitative agreements strongly supports the hypothesis that J1228 hosts a rigidly precessing gas disk, under the combined effects of GR and gas pressure.
5 Insights on Origin
We now discuss what our results imply for the origin of the gas disk around J1228, as well as for the pollution of white dwarfs in general. We base our discussions on the current favourite model for white dwarf pollution, tidal disruption of highly eccentric planetesimals (see review by Farihi, 2016).
5.1 Disk Mass and the Progenitor Mass
We estimate a mass for the gas disk, , by assuming that viscous spreading of the gas disk supplies the observed accretion onto J1228.
The gas scale height is
| (13) |
If the disk is accreting under a constant viscosity parameter (Shakura & Sunyaev, 1973), the viscous diffusion time is
| (14) | |||||
We adopt the accretion rate as determined by Dwomoh & Bauer (2023)333This updated rate accounts for diffusion from thermohaline mixing and is much greater than the estimate of in in Gänsicke et al. (2012), . and estimate the current disk mass by assuming , to obtain
| (15) | |||||
We argue that this estimate likely also reflects the total mass of the original disrupted planetesimal. The current disk is significantly eccentric – it avoids rapid streamline crossing and circularization by organizing itself into a coherent eccentric mode. But over the viscous timescale, the eccentricity should be gradually damped as the disk spreads radially. So the current disk has likely weathered no more than a few viscous times. Or, its current mass is close to its original mass. If true, this means the original disrupted plantesimals has a radius .
To substantiate the above estimate for the disk mass, we also consider whether it is consistent with the observed Ca II emissions. Let us adopt the same chemical composition as that for CI chrondrite from Palme et al. (2014), and assume that all metals are singly ionized, the mean nuclei weight of the gas is and the mean molecular weight is . So the above mass estimate corresponds to a surface density , a midplane density of . In the meantime, Ca is only of the total nucleus number. We therefore arrive at a radial column density for Ca of , and a vertical one at . We find:
-
•
if all Ca is in Ca II,444Ca I, with an ionization potential of eV, is easily ionized; while Ca II, with a potential of eV, is much harder to ionize., with a photo-ionization cross-section of , the optical depth for a Ca II ionizing photon is . So the gas midplane is very opaque to the Ca II ionizing photons. This may explain why we obtain a steeper fall-off of the ionizing flux (), than is expected for an optically thin disk ().
-
•
The vertical optical depth for the Ca II infrared triplet is (Cloudy result). This explains why the line ratios within the CaII triplet do not reflect their individual strengths, but approach those of a blackbody (Melis et al., 2010).
-
•
the above mass estimate allows us to explain the total flux observed in Ca II triplet. For J1228, about of its energy are in photons that can ionize Ca II (ionization energy eV). Let the disk be optically thick to these photons from the midplane up to scale heights. The total energy intercepted by Ca II is then . As Ca II is ionized and recombined, a fraction of the ionization energy is emitted in Ca II triplets (photon energy eV). So we expect a total line flux of . The observed total line flux is (Manser et al., 2016), or we require . In comparison, using the above midplane radial optical depth (), and assume that the disk is in vertical hydro-static equilibrium, we find that the disk can capture these photons up to a height multiple of . In other words, the observed CaII line fluxes can be explained by our inferred disk density.
5.2 The Three Radii
We aim to draw clues on the progenitor by considering the three radii we inferred for the disk, , and .
With our values of and , most of the disk mass lies closely around . This suggests that may be a special radius for the progenitor body. Gas deposited here may then viscously spread both outwards and inwards, forming the extended disk. In particular, Metzger et al. (2012); Rafikov (2016) showed that the surface density of an isothermal accretion disk should scale as , similar to our value of .
We consider two physical radii, one for dust sublimation and the other for tidal disruption. Using the most updated stellar parameters from Koester et al. (2014), , , , a blackbody at distance is heated to a temperature
| (16) |
where is roughly the sublimation temperature of silicate grains under our disk midplane density, (Pollack et al., 1994).555The fit provided by Isella & Natta (2005) is .
This will place the sublimation radius at around , much beyond , but close to our inferred outer edge, . It is therefore likely that the gas disk is truncated near the sublimation boundary. There may well be a dust component lying beyond it (see dicussion below).
On the other hand, the tidal disruption radius, for a body with negligible internal strength and on a parabolic orbit (), is located at a peri-centre distance of (Sridhar & Tremaine, 1992; Watanabe & Miyama, 1992)666A finite internal strength will allow the body to survive closer to the white dwarf (see, e.g. Zhang et al., 2021).
| (17) |
On the other extreme, for a body on a circular orbit, the above factor should be replaced by (Chandrasekhar, 1961), and is moved outwards to . Other bound trajectories range in-between these two extremes. Our inferred lies inward of , supporting the story that the parent body is tidally disrupted by the white dwarf. Around J1228, its debris is vaporized to form the observed gas disk.
Lastly, the observed line profiles clearly indicate that the gas disk has an abrupt inner cutoff at . Metzger et al. (2012) suggested that stellar magnetic field may be able to truncate the disk, much like that around in T Tauri stars. However, we suspect a different explanation may be at work here. In the inner part of the disk, rigid precession under the stronger GR precession demands a steeper eccentricity gradient. If the disk extends closer to the white dwarf than is observed, the implied high eccentricity will be challenging for its survival – nonlinear effects can disrupt the pattern of rigid precession and cause streamline crossing. We hypothesize that disk eccentricity, rather than stellar magnetic field, truncates our disk at the observed . More detailed study is required.
5.3 A Co-spatial Dust Disk?
The spectral energy distribution of J1228 shows the presence of a dusty component, with a total luminosity of , and blackbody temperatures that range from to (Brinkworth et al., 2009). If the dust lies in a geometrically flat disk and sees the central star unobstructed, it should be illuminated to a temperature (Chiang & Goldreich, 1997; Jura, 2003)
| (18) |
So the above dust temperatures translate to a range of to .
But this would place the dust component in the same radius as the gas disk. The eccentricity of the gas disk makes this problematic. The gas and dust components, if orbiting at different eccentricities and precessing independently (i.e., dust experiences GR but not gas pressure), will encounter each other at enormous speeds, of order a few hundred km/s. This leads to evaporation/sputtering of the dust grains, and circularization of the gas disk (if dust mass is high enough). In fact, this un-welcomed prospect led Metzger et al. (2012) to suggest that the gas disk cannot be eccentric, a proposition now amply refuted by our analysis.
One way to resolve this is if the grains are hotter than eq. 18 dictates and can therefore lie further away, beyond the gas disk. This is possible if the grains are not in a flat disk and do not block each other’s view to the star. Their temperatures will then be described by eq. 16. The observed blackbody may then arise from a region beyond , largely avoiding the most eccentric part of the gas disk. These grains can lie even further away, if they are smaller than the wavelengths of their own thermal radiation and are thus super-heated.
Such a situation (free-floating grains) can arise if the grains are short-lived and have not yet undergone collisional flattening (into a thin disk). Because of the proximity of the gas disk to the sublimation radius, these grains may be in condensation/sublimation equilibrium with the gas disk, and are transiently formed and destroyed. In this case, one can obtain a lower-limit to the dust mass by assuming that the observed dust luminosity is produced by grains of size , bulk density and temperature ,
| (19) | |||||
In other words, only a minute amount of dust is needed to reproduce the observed SED. The mass of the gas disk may be close to that of the progenitor body.
5.4 the Progenitor
Here, we remark on how the J1228 disk informs on the origin of white dwarf pollution.
The observed gas disk is markedly eccentric. Barring the possibility that the eccentricity is excited after formation (see, e.g., proposal from Miranda & Rafikov, 2018), this points to a very eccentric orbit for the progenitor. This is expected in the hypothesis of tidal disruption.
We can infer the original peri-centre approach, by assuming that the orbital angular momentum () is largely conserved when the tidal debris is circularized into the observed disk. This yields , for and at . This is at least a couple times smaller than the Roche radius (eq. 17).
Who can place the progenitor on such an odd orbit, with its improbably small peri-centre approach? The most likely scenario to date is planetary perturbations. Moreover, secular perturbations of the Kozai type are likely involved to boost the probability. Furthermore, to prevent suppression by GR precession, the secular perturbations may need to act in cohort with mean-motion interactions and/or close encounters. This requires the mean-motion of the progenitor to be within a factor of a few from that of the planet.
Such planetary perturbations can also help in circularizing the tidal debris. Unlike the very weak GR precession (which induces an apse advance of a mere radian per peri-centre passage), planetary perturbations can effectively scramble the orbits of different parts of the tidal stream, dissipate their relative kinetic energy and place them on much more compact orbits. If so, the entire process should take much less than the diffusion time ( yrs), or else the disk that forms would contain only a small fraction of the progenitor mass. This suggests that the perturber should have an orbit not much further than a few AU.
Lastly, we muse on the probability of seeing a live disk around a close-by white dwarf. J1228 lies at a distance of pc. Stars of similar temperatures have a space density of (Leggett et al., 1998). So we expect similarly hot stars within a similar distance as J1228. Among these, about two dozen gas disks are reported. So the occurrence rate of gas disk among hot white dwarfs is , not dissimilar to the occurrence rate of dust disk among all white dwarfs. If such a disk accretes in a few diffusion time (), and if all progenitors are similar in size (km), we then infer, over the lifetime of hot white dwarfs ( to yrs), a source planetesimal disk with mass of a Mars mass () is required.
6 Conclusion
We undertake a detailed modelling of the gaseous disk around the white dwarf SDSS J1228+1040. We find that the disk has a surface density profile that peaks around , and an eccentricity profile that decreases outward. The latter, we show, uncannily reproduces the theoretical profile of a disk that precesses rigidly under the combined forces of general-relativity and gas pressure. In other words, the observed disk is in an eccentric eigen-state. This explains why the disk can be eccentric yet long-lived. As we expect the eccentricity to be dissipated in the viscous timescale ( yrs), the current disk should have formed fairly recently.
Based on the high accretion rate onto the white dwarf (current estimate ), we infer a mass of for the gaseous disk. Such a mass estimate is also consistent with the emission measures in the Ca II triplets. The young age of the current disk then implies that it still contains most of the source mass, pegging the progenitor at a size of .
Given the eccentricity of the gas disk, there is unlikely to be a massive dusty debris disk that is co-spatial. Rather, we suggest that the observed dust emission may arise from small amounts of grains that are in condensation/sublimation equilibrium with the gas disk.
The progenitor that is tidally stripped apart likely arrives from an orbit of a few AU or shorter in range, perturbed by a nearby planetary body to reach a peri-centre distance of . To account for the observed rate of gaseous disks among similarly hot white dwarfs, we estimate that the source disk need to contain of order a Mars mass. Moreover, this disk and its planetary perturber likely orbit around the white dwarf within a few AU, so that the tidal debris can quickly circularize (downsize) to its current shape.
Our study in this work is preliminary in nature. We have not investigated in detail the temperature structure and the emission mechanism of the metallic disk. Emission line diagnostics may be used to constrain the disk inclination, which may lead to further insights. We also fall short of analyzing the ’circularization’ process after tidal disruption. This latter seems a promising route to infer the nature of the progenitor and the architecture of planetary system around J1228.
Such careful studies are clearly warranted. J1228 is likely not unusual. First, many white dwarfs with gaseous disks show variable emissions, indicating eccentric, precessing disks (Gänsicke et al., 2008; Melis et al., 2010; Wilson et al., 2014; Cauley et al., 2018; Manser et al., 2021). Similar dynamics as we reveal here for J1228 may be in play in all of these disks. Second, while J1228 is hot and can sublimate rocks at around , cooler white dwarfs will only harbour fully dusty disks. Such a disk reveals no information on its kinematics and surface density. J1228 offers us a lucky window into these otherwise obscure disks and may well be the Rosetta stone to decipher the mystery of white dwarf pollution.
We acknowledge NSERC for funding. We also thank C. Manser for providing the line data, and Renu Malhotra for discussions.
References
- Brinkworth et al. (2009) Brinkworth, C. S., Gänsicke, B. T., Marsh, T. R., Hoard, D. W., & Tappert, C. 2009, ApJ, 696, 1402, doi: 10.1088/0004-637X/696/2/1402
- Cauley et al. (2018) Cauley, P. W., Farihi, J., Redfield, S., et al. 2018, ApJ, 852, L22, doi: 10.3847/2041-8213/aaa3d9
- Chandrasekhar (1961) Chandrasekhar, S. 1961, Hydrodynamic and hydromagnetic stability
- Chiang & Goldreich (1997) Chiang, E. I., & Goldreich, P. 1997, ApJ, 490, 368, doi: 10.1086/304869
- Debes et al. (2012) Debes, J. H., Hoard, D. W., Farihi, J., et al. 2012, ApJ, 759, 37, doi: 10.1088/0004-637X/759/1/37
- Debes et al. (2011) Debes, J. H., Hoard, D. W., Wachter, S., Leisawitz, D. T., & Cohen, M. 2011, ApJS, 197, 38, doi: 10.1088/0067-0049/197/2/38
- Dwomoh & Bauer (2023) Dwomoh, A., & Bauer, E. B. 2023, arXiv e-prints, arXiv:2306.03864
- Farihi (2016) Farihi, J. 2016, New Astronomy, 71, 9, doi: 10.1016/j.newar.2016.03.001
- Farihi et al. (2012) Farihi, J., Gänsicke, B. T., Steele, P. R., et al. 2012, MNRAS, 421, 1635, doi: 10.1111/j.1365-2966.2012.20421.x
- Farihi et al. (2009) Farihi, J., Jura, M., & Zuckerman, B. 2009, ApJ, 694, 805, doi: 10.1088/0004-637X/694/2/805
- Foreman-Mackey et al. (2013) Foreman-Mackey, D., Hogg, D. W., Lang, D., & Goodman, J. 2013, PASP, 125, 306, doi: 10.1086/670067
- Fortin-Archambault et al. (2020) Fortin-Archambault, M., Dufour, P., & Xu, S. 2020, ApJ, 888, 47, doi: 10.3847/1538-4357/ab585a
- Gänsicke et al. (2012) Gänsicke, B. T., Koester, D., Farihi, J., et al. 2012, MNRAS, 424, 333, doi: 10.1111/j.1365-2966.2012.21201.x
- Gänsicke et al. (2008) Gänsicke, B. T., Koester, D., Marsh, T. R., Rebassa-Mansergas, A., & Southworth, J. 2008, MNRAS, 391, L103, doi: 10.1111/j.1745-3933.2008.00565.x
- Gänsicke et al. (2007) Gänsicke, B. T., Marsh, T. R., & Southworth, J. 2007, MNRAS, 380, L35, doi: 10.1111/j.1745-3933.2007.00343.x
- Gänsicke et al. (2006) Gänsicke, B. T., Marsh, T. R., Southworth, J., & Rebassa-Mansergas, A. 2006, Science, 314, 1908, doi: 10.1126/science.1135033
- Gentile Fusillo et al. (2021) Gentile Fusillo, N. P., Manser, C. J., Gänsicke, B. T., et al. 2021, MNRAS, 504, 2707, doi: 10.1093/mnras/stab992
- Goldreich & Tremaine (1979) Goldreich, P., & Tremaine, S. 1979, AJ, 84, 1638, doi: 10.1086/112587
- Goodchild & Ogilvie (2006) Goodchild, S., & Ogilvie, G. 2006, MNRAS, 368, 1123, doi: 10.1111/j.1365-2966.2006.10197.x
- Graham et al. (1990) Graham, J. R., Matthews, K., Neugebauer, G., & Soifer, B. T. 1990, ApJ, 357, 216, doi: 10.1086/168907
- Hartmann et al. (2011) Hartmann, S., Nagel, T., Rauch, T., & Werner, K. 2011, A&A, 530, A7, doi: 10.1051/0004-6361/201116625
- Hartmann et al. (2016) —. 2016, A&A, 593, A67, doi: 10.1051/0004-6361/201628403
- Isella & Natta (2005) Isella, A., & Natta, A. 2005, A&A, 438, 899, doi: 10.1051/0004-6361:20052773
- Jura (2003) Jura, M. 2003, ApJ, 584, L91, doi: 10.1086/374036
- Kilic et al. (2005) Kilic, M., von Hippel, T., Leggett, S. K., & Winget, D. E. 2005, ApJ, 632, L115, doi: 10.1086/497825
- Kilic et al. (2006) —. 2006, ApJ, 646, 474, doi: 10.1086/504682
- Koester (1987) Koester, D. 1987, ApJ, 322, 852, doi: 10.1086/165779
- Koester et al. (2014) Koester, D., Gänsicke, B. T., & Farihi, J. 2014, A&A, 566, A34, doi: 10.1051/0004-6361/201423691
- Leggett et al. (1998) Leggett, S. K., Ruiz, M. T., & Bergeron, P. 1998, ApJ, 497, 294, doi: 10.1086/305463
- MacGregor et al. (2017) MacGregor, M. A., Matrà, L., Kalas, P., et al. 2017, ApJ, 842, 8, doi: 10.3847/1538-4357/aa71ae
- Manser et al. (2020) Manser, C. J., Gänsicke, B. T., Gentile Fusillo, N. P., et al. 2020, MNRAS, 493, 2127, doi: 10.1093/mnras/staa359
- Manser et al. (2016) Manser, C. J., Gänsicke, B. T., Marsh, T. R., et al. 2016, MNRAS, 455, 4467, doi: 10.1093/mnras/stv2603
- Manser et al. (2019) Manser, C. J., Gänsicke, B. T., Eggl, S., et al. 2019, Science, 364, 66, doi: 10.1126/science.aat5330
- Manser et al. (2021) Manser, C. J., Dennihy, E., Gänsicke, B. T., et al. 2021, MNRAS, 508, 5657, doi: 10.1093/mnras/stab2948
- Melis et al. (2010) Melis, C., Jura, M., Albert, L., Klein, B., & Zuckerman, B. 2010, ApJ, 722, 1078, doi: 10.1088/0004-637X/722/2/1078
- Metzger et al. (2012) Metzger, B. D., Rafikov, R. R., & Bochkarev, K. V. 2012, MNRAS, 423, 505, doi: 10.1111/j.1365-2966.2012.20895.x
- Miranda & Rafikov (2018) Miranda, R., & Rafikov, R. R. 2018, ApJ, 857, 135, doi: 10.3847/1538-4357/aab9a2
- Nixon et al. (2020) Nixon, C. J., Pringle, J. E., Coughlin, E. R., Swan, A., & Farihi, J. 2020, arXiv e-prints, arXiv:2006.07639, doi: 10.48550/arXiv.2006.07639
- Palme et al. (2014) Palme, H., Lodders, K., & Jones, A. 2014, in Planets, Asteriods, Comets and The Solar System, ed. A. M. Davis, Vol. 2, 15–36
- Pan et al. (2016) Pan, M., Nesvold, E. R., & Kuchner, M. J. 2016, ApJ, 832, 81, doi: 10.3847/0004-637X/832/1/81
- Pollack et al. (1994) Pollack, J. B., Hollenbach, D., Beckwith, S., et al. 1994, ApJ, 421, 615, doi: 10.1086/173677
- Rafikov (2011) Rafikov, R. R. 2011, MNRAS, 416, L55, doi: 10.1111/j.1745-3933.2011.01096.x
- Rafikov (2016) —. 2016, ApJ, 830, 7, doi: 10.3847/0004-637X/830/1/7
- Shakura & Sunyaev (1973) Shakura, N. I., & Sunyaev, R. A. 1973, A&A, 24, 337
- Sridhar & Tremaine (1992) Sridhar, S., & Tremaine, S. 1992, Icarus, 95, 86, doi: 10.1016/0019-1035(92)90193-B
- Teyssandier & Ogilvie (2016) Teyssandier, J., & Ogilvie, G. I. 2016, MNRAS, 458, 3221, doi: 10.1093/mnras/stw521
- Watanabe & Miyama (1992) Watanabe, S.-I., & Miyama, S. M. 1992, ApJ, 391, 318, doi: 10.1086/171348
- Wilson et al. (2015) Wilson, D. J., Gaensicke, B. T., Koester, D., et al. 2015, in Astronomical Society of the Pacific Conference Series, Vol. 493, 19th European Workshop on White Dwarfs, ed. P. Dufour, P. Bergeron, & G. Fontaine, 279
- Wilson et al. (2014) Wilson, D. J., Gänsicke, B. T., Koester, D., et al. 2014, MNRAS, 445, 1878, doi: 10.1093/mnras/stu1876
- Zhang et al. (2021) Zhang, Y., Liu, S.-F., & Lin, D. N. C. 2021, ApJ, 915, 91, doi: 10.3847/1538-4357/ac00ae
- Zuckerman et al. (2003) Zuckerman, B., Koester, D., Reid, I. N., & Hünsch, M. 2003, ApJ, 596, 477, doi: 10.1086/377492