The El Gordo Galaxy Cluster Challenges CDM for Any Plausible Collision Velocity
Abstract
El Gordo (ACT-CL J0102-4915) is an extraordinarily large and bright galaxy cluster collision. In a previous study, we found that El Gordo is in tension with the cold dark matter (CDM) standard model when assuming the nominal mass and infall velocity values from the hydrodynamical simulations of Zhang et al. ( and , respectively). The recent weak-lensing study of Kim et al. showed that the mass of El Gordo is actually . Here we explore the level of tension between El Gordo and CDM for the new mass estimate, assuming several values. We find that in order to reduce the tension below the level, the El Gordo subclusters should have ( when considering the combined tension with the Bullet Cluster). To the best of our knowledge, the El Gordo hydrodynamical simulations conducted so far require to simultaneously reproduce its morphology and its high X-ray luminosity and temperature. We therefore conclude that El Gordo still poses a significant challenge to CDM cosmology. Whether the properties of El Gordo can be reconciled with a lower should be tested with new hydrodynamical simulations that explore different configurations of the interaction.
hyperrefOption \WarningFilterhyperrefToken \WarningFilterpdftex(dest) \acceptjournalApJ
1 Introduction
El Gordo (ACT-CL J0102-4915) is a supermassive interacting galaxy cluster composed of two infalling subclusters observed at redshift . It was found by the Atacama Cosmology Telescope (ACT) collaboration in a 455 deg2 survey (Menanteau et al., 2010; Marriage et al., 2011). El Gordo is well known for its extreme properties of mass, redshift, and infall velocity, which are remarkably rare in the context of the cold dark matter (CDM) standard model of cosmology (Menanteau et al., 2012; Katz et al., 2013; Jee et al., 2014).
The properties of El Gordo were constrained for the first time by Menanteau et al. (2012) from the analysis of additional multi-wavelength observations. Those authors described El Gordo as the most massive, hottest, most X-ray luminous, and brightest Sunyaev-Zel’dovich (SZ) effect cluster known at redshift . They also noted the presence of a wake formed in the X-ray surface brightness caused by the passage of one subcluster through the other. Their estimated values for the redshift, mass, and relative velocity between the two subclusters at the time of observation are: , , and , respectively, where is the Hubble constant in units of 70 km s-1 Mpc-1 and is the mass within the radius such that the average enclosed density is the cosmic average, which at that epoch was slightly below the critical density. The estimated range of was obtained from the line-of-sight peculiar velocity difference between the two subclusters () and from assuming that the collision is likely taking place close to the plane of the sky (inclination angle ), leading to . Menanteau et al. (2012) justified the low adopted by noting that we can only see the El Gordo morphological features so prominently if the interaction is nearly in the plane of the sky. The low assumption is also supported by the high degree of polarization in the radio relics of El Gordo (Lindner et al., 2014). Menanteau et al. (2012) assumed that the infall velocity of the two subclusters () should be about the same as . However, the present velocity is not necessarily a good guide to the pre-merger velocity due to dynamical friction and gas drag, among other processes. -body/hydrodynamical simulations are needed to get a better constraint on .
Ng et al. (2015) performed a series of -body simulations of El Gordo that focused on estimating its particular dynamical and kinematic features. They aimed to constrain , , and the pericenter velocity , among other parameters. Their estimated is lower than that observed by Menanteau et al. (2012) but consistent within uncertainties. From the polarization fraction of El Gordo’s synchrotron radiation (Lindner et al., 2014), Ng et al. (2015) obtained an upper limit to the inclination angle of . Taking as inputs a mass of , a mass ratio of 1.71, a projected separation of Mpc between the subclusters, and their estimated value for , their best-fit model obtained with the Markov Chain Monte Carlo (MCMC) method yields , , and . In their model, the value of at a subcluster separation equal to the sum of the two virial radii roughly corresponds to of the value (see section 5.1 of Ng et al., 2015), which means that they would have obtained for their best-fit value. It is worth noting that in their MCMC analysis, they exclude all realizations that would result in higher than the escape velocity. Unlike other studies of El Gordo, Ng et al. (2015) found that the best-fitting configuration is that in which the two subclusters already had a pericenter passage and are returning toward a second passage.
Hydrodynamical simulations of El Gordo aim to understand the detailed gas dynamics required to reproduce the SZ and X-ray observables of this cluster, including its twin-tailed morphology. The first hydrodynamical simulation of El Gordo was carried out by Donnert (2014). Using the results of Menanteau et al. (2012), they chose as initial parameters: total mass , mass ratio of 2.35, main cluster radius Mpc, secondary cluster radius Mpc, at a distance of 5.23 Mpc, and a small impact parameter of kpc. Though they were not able to reproduce the X-ray wake in their simulation, they managed to match the observed X-ray luminosity of erg s-1 (Menanteau et al., 2012) very accurately when the observed dark matter core separation is kpc, similar to the observed separation of kpc (Jee et al., 2014).
The hydrodynamical simulations of Molnar & Broadhurst (2015) used a total mass of with mass ratio 1.87 and radii of Mpc and Mpc for the individual subclusters. Those authors ran several simulations for different (at a distance of 4.25 Mpc) and in order to find the best match to observations of El Gordo. They found that for and kpc, they could reproduce the twin-tailed morphology of El Gordo, its relative radial velocity, and the relative positions of its X-ray, SZ, and weak-lensing peaks. However, they could not match the high observed X-ray luminosity and temperature of El Gordo (Zhang et al., 2015). Moreover, their best-fit model assumes an inclination angle of , which is well above the maximum value of as constrained by Ng et al. (2015) from the polarization fraction. However, they obtained for this model, very consistent with the value obtained by Ng et al. (2015). With this, Molnar & Broadhurst (2015) also showed that the assumption made by Menanteau et al. (2012) clearly underestimates the value of : according to their simulations, .
The latest and most complete exploration of the parameter space using hydrodynamical simulations of El Gordo was done by Zhang et al. (2015). These are also the simulations that better manage to reproduce the observed properties of El Gordo as they simultaneously reproduce its morphology, luminosity, temperature, and relative radial velocity. Zhang et al. (2015) test two different scenarios for the interaction. The first scenario (referred to as Model A by the authors) assumes that the interaction is a very energetic head-on collision between the two subclusters. Donnert (2014) and Molnar & Broadhurst (2015) also assume this scenario in their simulations. The best-fit parameters found by Zhang et al. (2015) in their Model A are: , mass ratio of 2, Mpc, Mpc, (at 5.84 Mpc), and kpc, viewed at an inclination angle . With these parameters, they could generate X-ray surface brightness and mass density distributions that match the observations. But the twin-tailed X-ray morphology that they obtained is smaller and more asymmetric than observed and only appears when the projected distance between the clusters is kpc. Also, the luminosity for this model ( erg s-1) is a bit higher than observed, while the inclination angle surpasses significantly the maximum estimated value (Ng et al., 2015).
In their second scenario (Model B), Zhang et al. (2015) assume that the interaction took place as a less violent, off-centered collision. The best-fit parameters in this Model B case are: , mass ratio of 3.6, Mpc, Mpc, (at 6.72 Mpc), and kpc, viewed at an inclination angle of . With these parameters, the model reproduces the temperature and X-ray luminosity of El Gordo and a two-tailed X-ray morphology bearing closer resemblance to the observed morphology, especially concerning the size and symmetry of the tails and the projected separation of the clusters ( kpc). Since this model performs better than fiducial Model A at reproducing the morphological properties of El Gordo, Zhang et al. (2015) chose this set of parameters as their preferred model.
In our previous work (Asencio, Banik, & Kroupa, 2021), we calculated the probability of finding a pair of clusters in CDM cosmology at with the mass, mass ratio, and infall velocity given by the best-fit pre-merger parameters of Model B (Zhang et al., 2015) in the survey region in which the El Gordo properties were first constrained (sky area of 755 deg2; Menanteau et al., 2012). We found that the probability of such a pre-merger configuration arising in CDM is only , which corresponds to a failure for a 1D Gaussian. In other words, according to our statistical analysis, only one El Gordo analog is expected in a volume of . This is larger than the effective (from to ) survey volume of El Gordo, and larger than the effective full-sky volume. The probability is even lower if we take into account that El Gordo is not the only object whose properties pose a problem for the CDM model. The Bullet Cluster is another interacting galaxy cluster known for its very high infall velocity (; Lage & Farrar, 2014). From Kraljic & Sarkar (2015), we inferred that the probability of observing the Bullet Cluster in the survey region where it was discovered is (). Combining the probability of observing both El Gordo and the Bullet Cluster in their respective survey regions, we obtained a total probability of (). We also discussed the impact that the different uncertainties in the analysis assumptions could have had on our nominal result. These caused the final result to differ somewhat from the nominal value. But for the most plausible assumptions, we always obtained a tension . From these results, we concluded that the CDM model is falsified at high significance () assuming the best-fit parameters of Zhang et al. (2015) whether we consider El Gordo alone or together with other problematic clusters.
However, a very recent and detailed weak-lensing study of El Gordo (Kim et al., 2021) obtained a lower estimate for its mass and mass ratio. In Section 2, we obtain the tension between El Gordo and CDM for the new mass and mass ratio values, assuming several different infall velocities. In Section 3, we discuss our results and their implications for CDM in light of the values obtained in prior numerical and hydrodynamical simulations of El Gordo. We conclude in Section 4.
2 Analysis and results
The weak-lensing study of Kim et al. (2021) found that El Gordo has a mass of and a mass ratio of 1.52. The mass estimate of is supported by recent strong-lensing analyses (Caminha et al., 2023; Diego et al., 2023). Kim et al. (2021) claim that using the new mass estimate and assuming at a separation of 5.5 Mpc, the tension with the CDM model disappears. This is technically true since repeating the analysis performed in Asencio et al. (2021) for the nominal values of mass, mass ratio, and infall velocity assumed in Kim et al. (2021) increases the probability of finding an El Gordo-like object in CDM to (2.73).
However, the significant decrease of the tension with respect to our previous study (Asencio et al., 2021) is mainly caused by the lower infall velocity assumption and not by the lower mass estimate. Kim et al. (2021) obtained this by performing a similar analysis to that of Ng et al. (2015), but also accounting for some of the inaccuracies present in this analysis. The main problems that they identified in Ng et al. (2015) were the assumption that dynamical friction is negligible in the El Gordo case, an incorrect sampling of the angle in their MCMC analysis, and the fact that they allow for merger scenarios in which the two subclusters start to free-fall at a distance similar to the present subcluster separation. In their corrected version of the analysis, they found that the scenario in which El Gordo’s subclusters are returning for a second pericenter passage is no longer favored. As in Ng et al. (2015), they also impose an upper limit to their MCMC analysis that rules out all models with collision velocities higher than their escape velocity ( at the current subcluster separation of 0.7 Mpc for the parameters found by Kim et al., 2021)111This corresponds to an escape velocity of at Mpc, the distance at which we obtain in our analysis, which is the main reason they obtain such a low . This constraint is motivated by the fact that previous studies from cosmological simulations had already shown that it is highly unlikely that the pairwise velocity of massive merging clusters () exceeds 3000 km s-1 in a CDM cosmology (Lee & Komatsu, 2010; Thompson & Nagamine, 2012; Ng et al., 2015). Since the analysis of Kim et al. (2021) imposes as a prior that we should not consider any value which is unlikely to arise in CDM, the value they obtain cannot be used to estimate the likelihood of observing El Gordo in CDM.
As it is not possible to infer the actual infall velocity needed to reproduce the observed morphology of El Gordo for the new mass estimate without performing a more detailed study using -body or hydrodynamical simulations, we obtain the level of tension between CDM and El Gordo assuming , a mass ratio of 1.52, and several different values of at a distance of 6.06 Mpc using the nominal ‘lightcone tomography’ technique we presented in Asencio et al. (2021). The method can be briefly summarized as follows: the probability of observing an El Gordo-like object in the survey region according to CDM is determined by looking for pre-merger El Gordo analogs in a large -body cosmological simulation. The conditions required for a cluster pair to be a candidate are: (i) mass ratio below that of El Gordo (1.52 for the model that we test in this study); and (ii) infall velocity/escape velocity ratio above that of El Gordo at twice the sum of its virial radii. This lets us obtain , the number of candidate pairs above a certain mass (in logarithmic scale). This function is very well fitted by a parabola. From this fit, the frequency of very high-mass candidates for which there are no analogs in the simulation box can be extrapolated. This process is repeated at three different redshifts. This allows us to infer the relation between the redshift and the number of analogs above a certain minimum mass. From this, one can obtain the number of El Gordo analogs in any mass and redshift range. We estimate that the pre-merger configuration took place at and take for the El Gordo mass. The number of analogs then has to be scaled to account for the fact that the survey volume in which El Gordo was found is smaller than the simulation box volume. The number of analogs which have and cosmic scale factor in a less likely region of parameter space than El Gordo is then converted into a probability using Poisson statistics: . This probability is related to the equivalent number of standard deviations for a normal distribution by the Gaussian equation: .
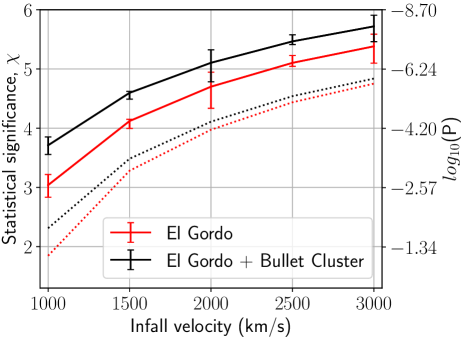
The results are shown in Figure 1, where we have also plotted the level of tension for El Gordo and the Bullet Cluster combined. This can be approximately done by adding the square of the El Gordo value () to , where is based on scaling the result of Kraljic & Sarkar (2015) to the sky area in which the Bullet Cluster was discovered (see section 3.4 of Asencio et al., 2021).
3 Discussion
Figure 1 shows that the infall velocity required to get below in the El Gordo case is . This falls to when considering both El Gordo and the Bullet Cluster. In the following, we discuss the implications of these results given the values obtained in previous studies of El Gordo.
As mentioned in Section 2, the value (Kim et al., 2021) is obtained for those models in which the collision velocity does not exceed the escape velocity. When testing for possible scenarios of the El Gordo interaction, there is no observational reason to assume that the two subclusters are gravitationally bound, as far as we are concerned. The argument that Kim et al. (2021) provide to impose a limit to is the “timing argument” (also invoked by Ng et al., 2015), the idea that structures in the Universe owe their peculiar velocities to interactions with other structures. Due to dynamical friction, when massive structures interact with less massive structures, kinetic energy in bulk motion is transformed into random motions. The maximum velocity that massive structures are expected to have can be inferred from cosmological simulations. These show that objects with and relative velocity are very unlikely to arise in the CDM cosmology (Lee & Komatsu, 2010; Thompson & Nagamine, 2012). Kim et al. (2021) and Ng et al. (2015) imposed this upper limit to since the escape velocity of El Gordo is of the same order as the maximum pairwise velocity found in CDM cosmological simulations. This constitutes a circular argument, so we consider all studies that imposed this condition to be unsuitable for assessing the likelihood of observing El Gordo in the CDM cosmology.
A collision velocity larger than the escape velocity can arise if the two subclusters are infalling on hyperbolic orbits and dynamical friction from the dark matter halos does not operate to slow down the relative velocity of the subclusters. It is also possible that the standard description of galaxy clusters as systems governed by Newtonian gravity and surrounded by a cold dark matter halo might be incorrect (see section 4.3 of Asencio et al., 2021). In that case, the infall velocity required to achieve a certain morphology could be different than in the standard model. Moreover, if the collisionless component surrounding the clusters was formed by sterile neutrinos (or some form of hot dark matter), the effect of dynamical friction would be less significant due to their higher velocity dispersion. Thus, if the CDM description of galaxy clusters is incorrect, this could manifest as a particularly large in CDM models. Therefore, it is necessary to account for all values in order to objectively assess the validity of CDM with regards to the properties of the El Gordo cluster.
Moreover, seems rather unlikely since all the El Gordo studies that used hydrodynamical simulations have shown that is required to reproduce its morphology and/or its strong X-ray emission (Donnert, 2014; Molnar & Broadhurst, 2015; Zhang et al., 2015). The X-ray emission in galaxy clusters is generally understood to be caused by thermal bremsstrahlung from hot gas (Sarazin, 1986). In the case of El Gordo, the fact that the X-ray morphology presents one single peak (with two faint tails) strongly suggests that the gas heating was caused by the energetic collision of the two subclusters and that the passage of one of the subclusters through the other led to the formation of an X-ray wake (Menanteau et al., 2012). The hot intracluster medium of each individual subcluster could also have generated some X-ray emission, but the hydrodynamic simulations show that the X-ray morphology and luminosity require a strong collision. The fact that the bolometric X-ray luminosity of El Gordo seems to be correlated with radio relics which have no obvious connection with the individual galaxy clusters further supports the hypothesis that the X-ray emission of El Gordo is mainly generated from the interaction of its two subclusters (section 4.4 of Menanteau et al., 2012).
Very low values are also not supported by the observed peculiar velocity () and inclination angle (; Ng et al., 2015) as these imply in the most conservative scenario. This means that would already be of the same order as in the Kim et al. (2021) model, which is in contradiction with the results of hydrodynamical simulations as these imply (Molnar & Broadhurst, 2015).
The results of Ng et al. (2015) do not give a clear estimate of as they consider more relevant for their study. Still, can be inferred by comparison with other studies. For this value, El Gordo would be in tension with CDM (see Figure 1). However, Kim et al. (2021) identified several problems with their MCMC analysis, so their nominal results might not be very reliable. More importantly, Ng et al. (2015) also excluded all models in which the collision velocity exceeds the escape velocity of El Gordo, which makes their velocity estimates unsuitable to test CDM as they implicitly assume its validity.
The first hydrodynamical simulations of El Gordo (Donnert, 2014) found that with , the total X-ray luminosity of El Gordo can be reproduced, but not its two-tailed morphology. According to our analysis, this infall velocity is incompatible with CDM at confidence. Donnert (2014) assumed a mass ratio and initial distance quite similar to those adopted in our analysis, but they assumed a somewhat higher mass (). Their value is quite consistent with the best-fit obtained in the more detailed simulations of Zhang et al. (2015) for a similar mass (). Given that in the Zhang et al. (2015) simulations the higher-mass Model B () requires a lower infall velocity than the lower-mass Model A (), we find it unlikely that assuming a higher mass had caused Donnert (2014) to overestimate .
Molnar & Broadhurst (2015) explored a wider parameter space in their hydrodynamical simulations of El Gordo. They found that for , they could fairly accurately reproduce the X-ray morphology, the positions of the X-ray peak and mass peaks, and the observed relative radial velocity. Still, the mean temperature and total X-ray luminosity obtained with this model are lower than observed (Zhang et al., 2015). Molnar & Broadhurst (2015) used a similar mass and mass ratio to the ones used in our analysis, but they chose a lower initial separation (4.25 Mpc). At our initial distance (6.06 Mpc) and under the assumption of energy conservation their corresponds to
| (1) |
where is the gravitational constant and is the total mass (Molnar & Broadhurst, 2015). This value corresponds to an tension with the CDM model in our analysis ( with the Bullet Cluster). This tension is slightly reduced by considering their other valid models with at 4.25 Mpc (2302.05 km s-1 at 6.06 Mpc), but with this velocity it is not possible to reproduce the X-ray brightness profile of El Gordo as accurately as with .
Zhang et al. (2015) presented two models of the El Gordo interaction in their hydrodynamical simulations. We focus on their Model A since this is the one that most closely resembles the latest observations and the assumptions made in our analysis. It has an infall velocity of , which our analysis shows to be in more than tension with CDM. Even though it still has some deficiencies (e.g. more asymmetric tidal tail, inclination angle is too large), this model is the only one so far that manages to reach the high temperature and luminosity of El Gordo, reproduce its surface brightness profile and mass density distribution and, to some extent, generate the two-tailed X-ray morphology, all while assuming a total mass of and a mass ratio of , consistent with the latest weak-lensing results (Kim et al., 2021).
The previous estimates of the El Gordo (or the joint El Gordo Bullet Cluster) tension with the CDM cosmology were obtained accounting for the area of the survey regions in which El Gordo and the Bullet Cluster were found. Our more conservative estimates (dotted lines in Figure 1) assume these survey regions covered the full sky, which would imply that El Gordo (and the Bullet Cluster) are the only problematic objects for CDM that have been observed so far. However, other interacting galaxy clusters with extreme properties have already been found, including A1758 at with two subclusters of total mass (Schellenberger et al., 2019) and MACS J1149.5+2223 at with three subclusters of total mass (Bruno et al., 2021), Moreover, full-sky surveys such as the Planck survey have already identified several other clusters with very high masses at , including PLCK G214.6+37.0 (composed of three subclusters at with total mass ; Planck Collaboration VIII, 2011) and PLCK G287.0+32.9 (a quadruple system of clusters at with total mass ; Planck Collaboration VI, 2013).222Note that at and structures with and , respectively, are expected to be extremely rare in a CDM cosmology (Watson et al., 2014). We therefore consider it reasonable to scale the number of candidate pairs to the survey volume in our nominal analysis.
However, we cannot be certain about whether there were any selection effects involved in the discovery of El Gordo and the Bullet Cluster. An important issue is whether wider less sensitive surveys had been used to get hints that extreme galaxy cluster collisions would be found in certain regions of the sky. If this were the case, the tension obtained in our nominal analysis might have been overestimated. The maximum impact that this could have on our results is given by our conservative scenario (dotted lines in Figure 1), where we obtained the tension at each for the case in which El Gordo (and the Bullet Cluster) are assumed to be the only objects in the sky contributing to the tension with CDM. These results show that even in this extremely conservative scenario, the tension with CDM is still for (Molnar & Broadhurst, 2015; Zhang et al., 2015, Model B). This increases to for , the infall velocity of Model A (Zhang et al., 2015).
4 Conclusions
For the new weak-lensing mass estimate of El Gordo (Kim et al., 2021) and for all infall velocities consistent with the hydrodynamical simulations described in Section 1, El Gordo still falsifies CDM at close to . According to the nominal model of Molnar & Broadhurst (2015), infall velocities of are required to reproduce the morphological properties of El Gordo ( tension). needs to be higher in order to reproduce El Gordo’s high temperature and luminosity: according to Donnert (2014), which corresponds to tension. The only nominal models that manage to simultaneously reproduce both its morphology and its high luminosity and temperature are fiducial Model A and fiducial Model B from Zhang et al. (2015), with and , respectively. Out of these two models, only Model A has a mass and mass ratio similar to the observed ones. Its value corresponds to tension. The tension with CDM is even higher () when we take into account the Bullet Cluster as another problematic object for CDM. El Gordo and the Bullet Cluster are not the only observed galaxy clusters whose properties are highly unusual in a CDM context. Because of this, we took into consideration the sky area in which El Gordo and the Bullet Cluster were found when obtaining our previous results. However, it is possible that the surveys might have already been targeting these particular objects based on previous wider surveys, which could have enabled their identification in a smaller survey region. To estimate the maximum extent to which this could have caused us to overestimate the tension with CDM, we obtained the tension assuming the discovery surveys covered the full sky. We found that even in this very conservative scenario, the tension between these galaxy cluster collisions and CDM amounts to . We therefore conclude that El Gordo and the Bullet Cluster would still pose a significant challenge to CDM even if selection effects had an influence on the survey areas in which they were discovered.
Given the recent more accurate results on El Gordo’s mass and other properties, we expect that our results will encourage the scientific community to revisit the hydrodynamical simulations of El Gordo. This will clarify if a lower compatible with CDM can be consistent with the observed properties of El Gordo, or if this massive early collision does indeed point to a failure of the CDM model.
Data availability
The data underlying this article are available in the article.
References
- Asencio et al. (2021) Asencio, E., Banik, I., & Kroupa, P. 2021, MNRAS, 500, 5249, doi: 10.1093/mnras/staa3441
- Bruno et al. (2021) Bruno, L., Rajpurohit, K., Brunetti, G., et al. 2021, A&A, 650, A44, doi: 10.1051/0004-6361/202039877
- Caminha et al. (2023) Caminha, G. B., Grillo, C., Rosati, P., et al. 2023, A&A, in press, arXiv:2209.02718, doi: 10.1051/0004-6361/202244897
- Diego et al. (2023) Diego, J. M., Meena, A. K., Adams, N. J., et al. 2023, A&A, 672, A3, doi: 10.1051/0004-6361/202245238
- Donnert (2014) Donnert, J. M. F. 2014, MNRAS, 438, 1971, doi: 10.1093/mnras/stt2291
- Jee et al. (2014) Jee, M. J., Hughes, J. P., Menanteau, F., et al. 2014, ApJ, 785, 20, doi: 10.1088/0004-637X/785/1/20
- Katz et al. (2013) Katz, H., McGaugh, S., Teuben, P., & Angus, G. W. 2013, ApJ, 772, 10, doi: 10.1088/0004-637x/772/1/10
- Kim et al. (2021) Kim, J., Jee, M. J., Hughes, J. P., et al. 2021, ApJ, 923, 101, doi: 10.3847/1538-4357/ac294f
- Kraljic & Sarkar (2015) Kraljic, D., & Sarkar, S. 2015, JCAP, 2015, 050, doi: 10.1088/1475-7516/2015/04/050
- Lage & Farrar (2014) Lage, C., & Farrar, G. 2014, ApJ, 787, 144, doi: 10.1088/0004-637X/787/2/144
- Lee & Komatsu (2010) Lee, J., & Komatsu, E. 2010, ApJ, 718, 60, doi: 10.1088/0004-637X/718/1/60
- Lindner et al. (2014) Lindner, R. R., Baker, A. J., Hughes, J. P., et al. 2014, ApJ, 786, 49, doi: 10.1088/0004-637X/786/1/49
- Marriage et al. (2011) Marriage, T. A., Acquaviva, V., Ade, P. A. R., et al. 2011, ApJ, 737, 61, doi: 10.1088/0004-637X/737/2/61
- Menanteau et al. (2010) Menanteau, F., González, J., Juin, J., et al. 2010, ApJ, 723, 1523, doi: 10.1088/0004-637x/723/2/1523
- Menanteau et al. (2012) Menanteau, F., Hughes, J. P., Sifón, C., et al. 2012, ApJ, 748, 7, doi: 10.1088/0004-637x/748/1/7
- Molnar & Broadhurst (2015) Molnar, S. M., & Broadhurst, T. 2015, ApJ, 800, 37, doi: 10.1088/0004-637x/800/1/37
- Ng et al. (2015) Ng, K. Y., Dawson, W. A., Wittman, D., et al. 2015, MNRAS, 453, 1531, doi: 10.1093/mnras/stv1713
- Planck Collaboration VI (2013) Planck Collaboration VI. 2013, A&A, 550, A132, doi: 10.1051/0004-6361/201220039
- Planck Collaboration VIII (2011) Planck Collaboration VIII. 2011, A&A, 536, A8, doi: 10.1051/0004-6361/201116459
- Sarazin (1986) Sarazin, C. L. 1986, Reviews of Modern Physics, 58, 1, doi: 10.1103/RevModPhys.58.1
- Schellenberger et al. (2019) Schellenberger, G., David, L., O’Sullivan, E., Vrtilek, J. M., & Haines, C. P. 2019, ApJ, 882, 59, doi: 10.3847/1538-4357/ab35e4
- Thompson & Nagamine (2012) Thompson, R., & Nagamine, K. 2012, MNRAS, 419, 3560, doi: 10.1111/j.1365-2966.2011.20000.x
- Watson et al. (2014) Watson, W. A., Iliev, I. T., Diego, J. M., et al. 2014, MNRAS, 437, 3776, doi: 10.1093/mnras/stt2173
- Zhang et al. (2015) Zhang, C., Yu, Q., & Lu, Y. 2015, ApJ, 813, 129, doi: 10.1088/0004-637x/813/2/129