Tackling Hallucinations in Neural Chart Summarization
Abstract
Hallucinations in text generation occur when the system produces text that is not grounded in the input. In this work, we tackle the problem of hallucinations in neural chart summarization. Our analysis shows that the target side of chart summarization training datasets often contains additional information, leading to hallucinations. We propose a natural language inference (NLI) based method to preprocess the training data and show through human evaluation that our method significantly reduces hallucinations. We also found that shortening long-distance dependencies in the input sequence and adding chart-related information like title and legends improves the overall performance.
1 Introduction
The task of generating a summary to accompany a chart is an instance of data-to-text generation and has a long tradition in natural language generation (NLG) Elzer et al. (2007); Ferres et al. (2007); Demir et al. (2012). Recent neural models for chart summarization (Obeid and Hoque, 2020; Hsu et al., 2021; Zhu et al., 2021; Kantharaj et al., 2022) carry the promise to be trainable from data and hence more versatile than approaches using manually constructed templates, and to produce more fluent text than previous statistical NLG systems. However, texts generated by state-of-the-art neural systems frequently include information which is not grounded in the input (“extrinsic hallucination”), or is even contradictory to it (“intrinsic hallucination”), see an example in Table 1.
![[Uncaptioned image]](/html/2308.00399/assets/x1.png)
This statistic shows the road rage behavior of drivers in the United States as of 2015. Four percent of the drivers said they have been on the receiving end of a rude gesture. The survey was conducted online and all the participants had a valid U.S. driving license.
Hallucinations in NLG (Koehn and Knowles, 2017; Raunak et al., 2021) have been a concern in neural models for various tasks (Huang et al., 2021; Lee et al., 2019; Rebuffel et al., 2022). We identify two reasons for hallucinations in chart summarization: (1) complexity and missing information in the input format of chart data; (2) presence of ungrounded information in chart summaries of the training data. Our contributions are as follows:
-
•
We demonstrate the importance of providing more context and reducing long-distance dependencies in the linearized input format.
-
•
We propose an NLI cleaning step to remove ungrounded information in the training data.
Our experimental code and model output will be released on Github under an open license.111https://github.com/WorldHellow/Hallucinations-C2T
2 Background and Related Work
2.1 Recent work in Chart Summarization
Several chart summarization datasets and models were developed recently. Obeid and Hoque (2020) created the Chart-to-Text data with English charts from statista.com (dubbed c2t-small in this paper). They model chart summarization as a data-to-text problem and adapt a transformer by Gong et al. (2019). Kantharaj et al. (2022) released an extended dataset crawled from the same platform, also called Chart-to-text (c2t-big in this paper). They finetune multiple pretrained models, such as BART (Lewis et al., 2020) and T5 (Raffel et al., 2020). Table 2 shows the statistics of both datasets.
2.2 Hallucinations in Data-to-text NLG
In NLG, hallucination or unfaithful output means generated text that is not grounded in the input. Ji et al. (2023) describe two types of hallucinations: Intrinsic Hallucinations refer to generated output that contradicts the source content, and Extrinsic Hallucinations refer to output that cannot be verified by the source. Ji et al. (2023) name three main causes for hallucinations: (1) source-reference divergence (reference text not supported by the input data), (2) modeling choices, and (3) decoding strategies. Efforts are made to mitigate hallucinations in NLG, particularly in data-to-text models. At the data level, clean and faithful datasets such as ToTTo (Parikh et al., 2020) and RotoWire-FG (Wang, 2019) were created with significant manual effort. For data preprocessing, Nie et al. (2019) use a domain-specific language understanding module to automatically remove noise from input meaning representations and reduce hallucinations. A more domain-general automatic approach was proposed by Dušek and Kasner (2020) with a transformer finetuned for NLI, but it was only applied to evaluate faithfulness of generated text, not to correct it. Our approach combines the latter two by applying NLI for automatic data cleaning.
3 Problem Identification
We manually analyzed two samples of 50 generated chart summaries of Obeid and Hoque (2020)’s transformer trained on c2t-small and Kantharaj et al. (2022)’s T5 model finetuned on c2t-big. For the c2t-small transformer, 22 summaries had intrinsic and 13 had extrinsic hallucinations. Some summaries were also incoherent and repetitive. For the c2t-big T5 model, 4 out of 50 summaries had intrinsic and 11 had extrinsic hallucinations.
Based on our analysis, we speculate that intrinsic and extrinsic hallucinations have different causes as identified by Ji et al. (2023). Intrinsic hallucinations may happen due to input sequence formatting (i.e., modeling choices), while extrinsic hallucinations are caused by the source-reference divergence in training data (missing input information and noise) Maynez et al. (2020). We address the input format in Section 4 by adding context and reducing long-distance dependencies, and we further address noise in references in Section 5.
4 Input Format Adjustment
4.1 Context and Distance in Input Formatting
The source data table must be linearized for input into a sequence-to-sequence model. Obeid and Hoque (2020)’s linearization includes and axis labels, values, and chart type, but lacks the chart title (see Table 8 in the Appendix for an example). We speculate that excluding the title results in extrinsic hallucination, i.e., generation of entities from parametric knowledge instead of the input data (Longpre et al., 2021).
Kantharaj et al. (2022)’s T5-based approach produced far better results than Obeid and Hoque (2020), but some hallucinations were still present. They format the data table by following the template: title + y-values + x-values (see Table 9 in the Appendix for an example). This format includes the title, but it lacks the and axis labels and the corresponding - values are not adjacent. The distance between each and its corresponding value is large, and we speculate the model faces difficulty when learning pairwise relationships between and , leading to intrinsic hallucination.
| Road rage behavior among drivers in the U.S. as of 2015 x-y labels situation - share of respondents x-y values On the receiving end of a rude gesture 53%, Yelled or used profanity 26%, Made a rude gesture 17%, Felt physically threatened 13%, Exited their vehicle to engage angrily 4% |
4.2 Proposed Input Formatting
Considering these input format problems, we hypothesise that reducing long-distance dependencies between and axis values in the linearized input data will alleviate intrinsic hallucinations; adding title and and axis labels should reduce extrinsic ones. We thus propose a linearized input with adjacent x-y pairs. The template we use is: title + x-y labels + x-y values. See Table 3 for an example.
4.3 Experimental Setup
We finetune T5 Raffel et al. (2020) with our linearization proposed in Section 4.2, comparing to both original linearizations discussed in Section 4.1. We include ablated versions to check the effects of including the title, including axis labels, or using adjacent x-y pairs. As a prefix to T5’s decoder input, we use “C2T: ”. More training details are provided in Table 11 in the Appendix. We evaluate using BLEU (Post, 2018), ROUGE-2 (Lin, 2004), perplexity,222https://huggingface.co/docs/transformers/perplexity and NUBIA (Kane et al., 2020). NUBIA produces a score based on logical agreement, contradiction, neutrality, and semantic similarity.
4.4 Metrics Results
| Model | BL | RG-2 | PPL | L | C | Neu | SS | N |
|---|---|---|---|---|---|---|---|---|
| Transformer by Obeid and Hoque (2020) | 18.5 | - | - | - | - | - | - | - |
| T5-S-O&HL | 26.1 | 33.5 | 7.4 | 5.5 | 67.8 | 26.5 | 3.0/5 | 35.4 |
| T5-S-O&HL + title | 31.0 | 44.0 | 16.0 | 24.8 | 23.5 | 51.5 | 3.0/5 | 60.6 |
| T5-S-OL | 33.9 | 44.8 | 7.5 | 33.2 | 22.3 | 44.4 | 3.5/5 | 46.9 |
| T5-S-OL-NLI | 34.2 | 43.7 | 7.1 | 33.1 | 10.2 | 56.5 | 3.5/5 | 44.5 |
| Model | BL | RG-2 | PPL | L | C | Neu | SS | N |
|---|---|---|---|---|---|---|---|---|
| T5 by Kantharaj et al. (2022) | 37.0 | 50.5 | 10.0 | 34.5 | 22.9 | 42.5 | 3.6/5 | 53.5 |
| T5-B-K + axis labels | 37.6 | 50.5 | 8.2 | 33.0 | 23.9 | 42.9 | 3.6/5 | 51.4 |
| T5-B-OL | 39.8 | 55.0 | 8.2 | 39.3 | 21.3 | 39.3 | 3.6/5 | 55.6 |
| T5-B-OL-NLI | 42.2 | 50.7 | 8.2 | 40.3 | 15.1 | 44.5 | 3.6/5 | 53.5 |
On the c2t-small data, T5-S-OL (our linearization) is compared to the original model of Obeid and Hoque (2020), a T5 finetuned using their linearization (T5-S-O&HL), and an ablation variant which uses their linearization and adds the chart title (T5-S-O&HL + title). Results in Table 4 show that our linearization improves almost all metrics. While the overall NUBIA score is lower, its most important elements (logical agreement, contradiction, semantic similarity) are improved (cf. Section 6.2). Obeid and Hoque (2020)’s input format produces many entity hallucinations. Including the chart title format improves performance substantially, which is expected as this provides crucial context for the model. Further small gains stem from less redundancy in our linearization.333Axis labels and chart type are not repeated in our format, compare Table 8 and 10 in the Appendix.
On the c2t-big data, T5-B-OL (our linearization) is compared to the original T5 model of Kantharaj et al. (2022) and an ablation using their linearization with added axis labels (T5-B-K + axis labels). Table 5 shows improvements on almost all metrics, with NUBIA not reflecting its individual elements’ improvements, similar as above (cf. Section 6.2). Adding axis labels to Kantharaj et al. (2022)’s format is a very modest help, but using adjacent x-y pairs in our format yields a larger improvement.444More on ablations in Appendix A.2.
4.5 Manual Analysis
We manually analyzed 50 output samples from T5-S-OL, checking for hallucinations. To find intrinsic hallucinations, we checked for any information in the summaries that would conflict with the input (x-y values, entities, or trends). For extrinsic hallucinations, we checked for the presence of any information that was not verifiable from the input data. We found no intrinsic hallucinations, but 18 summaries still had extrinsic hallucinations. Table 7 in the Appendix provides example outputs.
5 Cleaning Noisy References with NLI
5.1 Noise in Training Summaries
Since source-reference divergence can also cause hallucinations, we analyzed the reference side of the same sample of 50 instances from the c2t-small dataset as in Section 3 to look for text that is not grounded in the source chart. 20 out of 50 summaries contained ungrounded information. While this ungrounded information makes the summaries more interesting, it cannot be verified from the chart and hence counts as extrinsic hallucination. We also analyzed references in the c2t-big dataset and found a similar pattern, which is expected since both datasets come from the same source.
5.2 Influence on Generation
To show that ungrounded information in training data influence system outputs, we run an experiment on the Autochart dataset Zhu et al. (2021), which is handcrafted and thus guaranteed not to contain hallucinations. We introduce synthetic ungrounded text at random places in Autochart summaries using vanilla GPT-2 Radford et al. (2019) generation prompted by preceding summary text, thus creating a noisy Autochart version.555See Section A.1 in the Appendix for details. The summary of the chart is segmented, and a random sentence from the summary is used as a prompt for GPT-2 to produce an ungrounded sentence. The generated text is then inserted at a random location in the segmented summary, creating a new summary with ungrounded information. We analyze 50 outputs from a T5 model finetuned on both original (T5-AC-orig) and noisy (T5-AC-noisy) versions. While we found no hallucinations in outputs of T5-AC-orig, we identified 27 extrinsic hallucinations in T5-AC-noisy’s outputs. T5-AC-noisy also produced repetitive summaries (43 out of 50).
5.3 Improving Faithfulness using NLI
To alleviate extrinsic hallucinations caused by the training data, we propose using NLI, taking inspiration from Pang et al. (2021) and Dušek and Kasner (2020). We use NLI as a preprocessing tool: any sentences in a summary that are not entailed in the linearized data will be discarded. We use the BART-MNLI pretrained model666https://huggingface.co/facebook/bart-large-mnli for this. It is based on Yin et al. (2019)’s study on zero-shot text classification as an entailment problem and trained to produce an entailment score on a scale of 0-100 (with no specific neutral or contradiction labels).
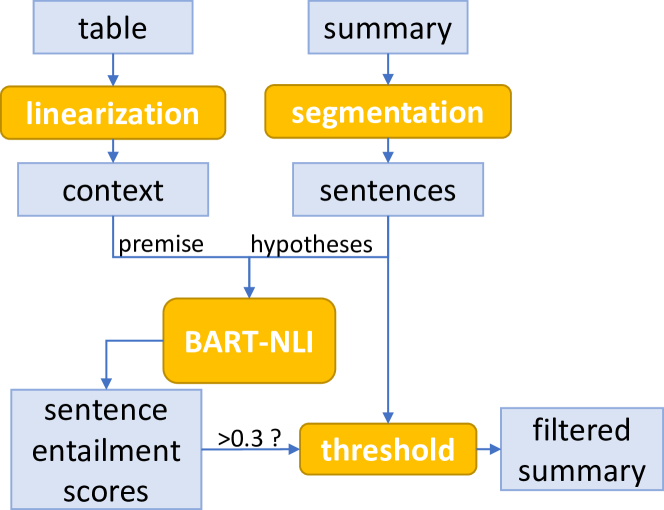
Figure 1 shows a diagram of the overall cleaning process. We apply the filtering step to the entire c2t-small dataset by segmenting the summaries, passing each sentence as hypothesis and linearized data as premise. If the sentence gets an entailment score above the threshold of 0.3, we keep it, otherwise we discard the sentence.777The threshold was found empirically (see Appendix A.1.3). Out of the 100 filtered summaries, 69 were correctly filtered, and 31 were incorrectly filtered. We also applied the above process to c2t-big dataset.
5.4 Finetuning T5 on Filtered Data
To evaluate the filtering, we compare two pairs of finetuned T5 models on both c2t-small and c2t-big, filtered (T5-B/S-OL-NLI) and non-filtered (T5-B/S-OL). All use our proposed linearization method. We use data splits described in Section 2.
Tables 4 and 5 show the results of T5 finetuned on the filtered data and the baselines. The automatic metrics do not show any clear trend for T5-S-OL-NLI: BLEU improves but ROUGE drops; NUBIA logical agreement stays unchanged, contradictions decrease but neutral statements (also interpretable as hallucinations) increase. For T5-B-OL-NLI, we get minor improvements in BLEU and NUBIA logical agreement, but again a drop in ROUGE. This does not indicate improvements; however, upon manual analysis of 50 summaries for the same charts as in Section 4.5, we found that only 4 outputs from T5-S-OL-NLI still contained hallucinations (compared to 18 for T5-S-OL).
| Model | VC | OIP | Inf | Coh | Flu |
|---|---|---|---|---|---|
| T5-S-OL | 56.00% | 38.00% | 3.80/5 | 3.81/5 | 3.88/5 |
| T5-S-OL-NLI | 76.00% | 17.00% | 3.60/5 | 3.91/5 | 3.96/5 |
| -value | 1.5e-5 | 1.0e-5 | 0.914 | 0.333 | 0.465 |
5.5 Human Evaluation
We conduct a detailed human evaluation, comparing T5-S-OL (see Section 4.1) and T5-S-OL-NLI (trained in Section 5.4). We evaluate the following: (1) Value Correctness (VC): Numbers/values in the summary are from the chart, (2) Outside Information Presence (OIP): The summary contains information not grounded in the chart, (3) Informativeness (Inf): The summary conveys a lot of information about the chart, (4) Coherence (Coh): The summary content is orderly and logically consistent, and (5) Fluency (Flu): The text is grammatically correct and is not repetitive.
We used Prolific to recruit English native speakers from the UK888https://www.prolific.co/, the hourly pay rate was 9.5 GBP. and Google Forms to conduct the survey. For each model, 50 samples were used and split into 5 experiments with 10 samples each. Each sample was annotated by 5 participants, in total 25 participants completed the survey. Table 6 shows the result. Considering faithfulness (VC and OIP), the T5-S-OL-NLI model trained on filtered data performs significantly better than the baseline T5-S-OL, showing that our method of alleviating hallucinations via cleaning training summaries through NLI is effective.
6 Discussions
6.1 Ungrounded Information in Training Data
In Section 5.1, we reported on ungrounded information in training data and showed in Section 5.2 that this leads to hallucinations in generated outputs. While there are good reasons for ungrounded information in human-written summaries (e.g., providing additional detail/background or linking to other events; cf. Thomson and Reiter, 2020), using such data to train an end-to-end model that does not distinguish between describing the chart and providing additional information is not appropriate and leads to inaccurate outputs, which is unsuitable for real-world scenarios (cf. Maynez et al., 2020; Xu et al., 2021).
6.2 Metrics’ Shortcomings in Assessing Hallucinations
None of the automatic metrics we used (see Section 4.3) measure hallucinations explicitly. BLEU and ROUGE are reference-based and prone to biases stemming from ungrounded information in references (see Section 6.1), such as assigning higher scores to hallucinated outputs. NUBIA is a trained aggregate metric of several components (NLI-based logical agreement, contradiction and neutrality, plus semantic similarity and fluency). We found that this aggregation can lead to nontransparent or confusing results: even if individual components are clearly improved, NUBIA may drop (see Section 4.4). Therefore, we found logical agreement and semantic similarity scores to be the most useful constituents of NUBIA for indicating the presence of hallucinations in generated texts.
7 Conclusions
We show that reducing long-distance dependencies and providing more context on the model’s input results in fewer intrinsic hallucinations, and demonstrate that extrinsic hallucinations are a result of ungrounded information in the training summaries. Furthermore, we show through human evaluation that employing NLI to filter training summaries results in a significant drop in hallucinations.
Limitations
The main limitation of our work is that we were unable to eliminate the extrinsic hallucinations completely. In Section 5.3, we mentioned that 31 out of 100 summaries were not filtered correctly, meaning that these summaries were left with ungrounded information, which resulted in 4 out of 50 generated summaries with extrinsic hallucinations. BART-NLI is developed for linguistic input and we employ it to infer from non-linguistic input. The second limitation is that generated summaries are shorter on average. T5-S-OL-NLI generated 28% of the summaries of just a single sentence. We expected this problem because our method of filtering only removes sentences and does not replace them with statements entailed in the data. The final limitation is that our model is only limited to producing summaries in the English language as it is trained on English summaries.
Acknowledgements
This research was supported by the European Research Council (Grant agreement No. 101039303 NG-NLG) and (in part) supported by the EUINACTION grant from NORFACE Governance (462-19-010, GL950/2-1). We acknowledge the use of resources provided by the LINDAT/CLARIAH-CZ Research Infrastructure (Czech Ministry of Education, Youth and Sports project No. LM2018101).
Ethics Statement
The human evaluation study was approved by the ethics committee of the respective national professional linguistic association. All the annotators were from the United Kingdom and each annotator was paid according to the hourly minimum wage in the United Kingdom, i.e. 9.5 GBP. The annotators were paid immediately after the results were analyzed. We only collected Prolific IDs of the users and they were deleted after the analysis of the data.
References
- Bird et al. (2009) Steven Bird, Ewan Klein, and Edward Loper. 2009. Natural language processing with Python: analyzing text with the natural language toolkit. O’Reilly Media, Inc.
- Demir et al. (2012) Seniz Demir, Sandra Carberry, and Kathleen F. McCoy. 2012. Summarizing information graphics textually. Computational Linguistics, 38(3):527–574.
- Dušek and Kasner (2020) Ondřej Dušek and Zdeněk Kasner. 2020. Evaluating semantic accuracy of data-to-text generation with natural language inference. In Proceedings of the 13th International Conference on Natural Language Generation, pages 131–137, Dublin, Ireland. Association for Computational Linguistics.
- Elzer et al. (2007) Stephanie Elzer, Edward Schwartz, Sandra Carberry, Daniel Chester, Seniz Demir, and Peng Wu. 2007. A browser extension for providing visually impaired users access to the content of bar charts on the web. In Proceedings of the Third International Conference on Web Information Systems and Technologies - Web Interfaces and Applications, pages 59–66.
- Ferres et al. (2007) Leo Ferres, Petro Verkhogliad, Gitte Lindgaard, Louis Boucher, Antoine Chretien, and Martin Lachance. 2007. Improving accessibility to statistical graphs: The IGraph-Lite system. In Proceedings of the 9th International ACM SIGACCESS Conference on Computers and Accessibility, Assets ’07, page 67–74, New York, NY, USA. Association for Computing Machinery.
- Gong et al. (2019) Li Gong, Josep Crego, and Jean Senellart. 2019. Enhanced transformer model for data-to-text generation. In Proceedings of the 3rd Workshop on Neural Generation and Translation, pages 148–156, Hong Kong. Association for Computational Linguistics.
- Hsu et al. (2021) Ting-Yao Hsu, C Lee Giles, and Ting-Hao Huang. 2021. SciCap: Generating captions for scientific figures. In Findings of the Association for Computational Linguistics: EMNLP 2021, pages 3258–3264, Punta Cana, Dominican Republic. Association for Computational Linguistics.
- Huang et al. (2021) Yichong Huang, Xiachong Feng, Xiaocheng Feng, and Bing Qin. 2021. The factual inconsistency problem in abstractive text summarization: A survey. arXiv preprint arXiv:2104.14839.
- Ji et al. (2023) Ziwei Ji, Nayeon Lee, Rita Frieske, Tiezheng Yu, Dan Su, Yan Xu, Etsuko Ishii, Ye Jin Bang, Andrea Madotto, and Pascale Fung. 2023. Survey of hallucination in natural language generation. ACM Comput. Surv., 55(12).
- Kane et al. (2020) Hassan Kane, Muhammed Yusuf Kocyigit, Ali Abdalla, Pelkins Ajanoh, and Mohamed Coulibali. 2020. NUBIA: NeUral based interchangeability assessor for text generation. In Proceedings of the 1st Workshop on Evaluating NLG Evaluation, pages 28–37, Online (Dublin, Ireland). Association for Computational Linguistics.
- Kantharaj et al. (2022) Shankar Kantharaj, Rixie Tiffany Leong, Xiang Lin, Ahmed Masry, Megh Thakkar, Enamul Hoque, and Shafiq Joty. 2022. Chart-to-text: A large-scale benchmark for chart summarization. In Proceedings of the 60th Annual Meeting of the Association for Computational Linguistics (Volume 1: Long Papers), pages 4005–4023, Dublin, Ireland. Association for Computational Linguistics.
- Kingma and Ba (2015) Diederik P. Kingma and Jimmy Ba. 2015. Adam: A Method for Stochastic Optimization. In Proceedings of the 3rd International Conference on Learning Representations (ICLR 2015). ICLR.
- Koehn and Knowles (2017) Philipp Koehn and Rebecca Knowles. 2017. Six challenges for neural machine translation. In Proceedings of the First Workshop on Neural Machine Translation, pages 28–39, Vancouver. Association for Computational Linguistics.
- Lee et al. (2019) Katherine Lee, Orhan Firat, Ashish Agarwal, Clara Fannjiang, and David Sussillo. 2019. Hallucinations in neural machine translation.
- Lewis et al. (2020) Mike Lewis, Yinhan Liu, Naman Goyal, Marjan Ghazvininejad, Abdelrahman Mohamed, Omer Levy, Veselin Stoyanov, and Luke Zettlemoyer. 2020. BART: Denoising Sequence-to-Sequence Pre-training for Natural Language Generation, Translation, and Comprehension. In Proceedings of the 58th Annual Meeting of the Association for Computational Linguistics, pages 7871–7880, Online. Association for Computational Linguistics.
- Likert (1932) Rensis Likert. 1932. A technique for the measurement of attitudes. Archives of Psychology, 22 140, 55.
- Lin (2004) Chin-Yew Lin. 2004. ROUGE: A package for automatic evaluation of summaries. In Text Summarization Branches Out, pages 74–81, Barcelona, Spain. Association for Computational Linguistics.
- Longpre et al. (2021) Shayne Longpre, Kartik Perisetla, Anthony Chen, Nikhil Ramesh, Chris DuBois, and Sameer Singh. 2021. Entity-based knowledge conflicts in question answering. In Proceedings of the 2021 Conference on Empirical Methods in Natural Language Processing, pages 7052–7063, Online and Punta Cana, Dominican Republic. Association for Computational Linguistics.
- Maynez et al. (2020) Joshua Maynez, Shashi Narayan, Bernd Bohnet, and Ryan McDonald. 2020. On faithfulness and factuality in abstractive summarization. In Proceedings of the 58th Annual Meeting of the Association for Computational Linguistics, pages 1906–1919, Online. Association for Computational Linguistics.
- Nie et al. (2019) Feng Nie, Jin-Ge Yao, Jinpeng Wang, Rong Pan, and Chin-Yew Lin. 2019. A simple recipe towards reducing hallucination in neural surface realisation. In Proceedings of the 57th Annual Meeting of the Association for Computational Linguistics, pages 2673–2679, Florence, Italy. Association for Computational Linguistics.
- Obeid and Hoque (2020) Jason Obeid and Enamul Hoque. 2020. Chart-to-text: Generating natural language descriptions for charts by adapting the transformer model. In Proceedings of the 13th International Conference on Natural Language Generation, pages 138–147, Dublin, Ireland. Association for Computational Linguistics.
- Pang et al. (2021) Richard Yuanzhe Pang, Adam Lelkes, Vinh Tran, and Cong Yu. 2021. AgreeSum: Agreement-oriented multi-document summarization. In Findings of the Association for Computational Linguistics: ACL-IJCNLP 2021, pages 3377–3391, Online. Association for Computational Linguistics.
- Parikh et al. (2020) Ankur Parikh, Xuezhi Wang, Sebastian Gehrmann, Manaal Faruqui, Bhuwan Dhingra, Diyi Yang, and Dipanjan Das. 2020. ToTTo: A controlled table-to-text generation dataset. In Proceedings of the 2020 Conference on Empirical Methods in Natural Language Processing (EMNLP), pages 1173–1186, Online. Association for Computational Linguistics.
- Post (2018) Matt Post. 2018. A call for clarity in reporting BLEU scores. In Proceedings of the Third Conference on Machine Translation: Research Papers, pages 186–191, Brussels, Belgium. Association for Computational Linguistics.
- Radford et al. (2019) Alec Radford, Jeff Wu, Rewon Child, David Luan, Dario Amodei, and Ilya Sutskever. 2019. Language models are unsupervised multitask learners.
- Raffel et al. (2020) Colin Raffel, Noam Shazeer, Adam Roberts, Katherine Lee, Sharan Narang, Michael Matena, Yanqi Zhou, Wei Li, and Peter J. Liu. 2020. Exploring the limits of transfer learning with a unified text-to-text transformer. Journal of Machine Learning Research, 21(140):1–67.
- Raunak et al. (2021) Vikas Raunak, Arul Menezes, and Marcin Junczys-Dowmunt. 2021. The curious case of hallucinations in neural machine translation. In Proceedings of the 2021 Conference of the North American Chapter of the Association for Computational Linguistics: Human Language Technologies, pages 1172–1183, Online. Association for Computational Linguistics.
- Rebuffel et al. (2022) Clément Rebuffel, Marco Roberti, Laure Soulier, Geoffrey Scoutheeten, Rossella Cancelliere, and Patrick Gallinari. 2022. Controlling hallucinations at word level in data-to-text generation. Data Mining and Knowledge Discovery, 36(1):318–354.
- Thomson and Reiter (2020) Craig Thomson and Ehud Reiter. 2020. A Gold Standard Methodology for Evaluating Accuracy in Data-To-Text Systems. In Proceedings of the 13th International Conference on Natural Language Generation, pages 158–168, Dublin, Ireland. Association for Computational Linguistics.
- Wang (2019) Hongmin Wang. 2019. Revisiting challenges in data-to-text generation with fact grounding. In Proceedings of the 12th International Conference on Natural Language Generation, pages 311–322, Tokyo, Japan. Association for Computational Linguistics.
- Xu et al. (2021) Xinnuo Xu, Ondřej Dušek, Shashi Narayan, Verena Rieser, and Ioannis Konstas. 2021. MiRANews: Dataset and Benchmarks for Multi-Resource-Assisted News Summarization. In Findings of the Association for Computational Linguistics: EMNLP 2021, pages 1541–1552, Punta Cana, Dominican Republic. Association for Computational Linguistics.
- Yin et al. (2019) Wenpeng Yin, Jamaal Hay, and Dan Roth. 2019. Benchmarking zero-shot text classification: Datasets, evaluation and entailment approach. In Proceedings of the 2019 Conference on Empirical Methods in Natural Language Processing and the 9th International Joint Conference on Natural Language Processing (EMNLP-IJCNLP), pages 3914–3923, Hong Kong, China. Association for Computational Linguistics.
- Zhu et al. (2021) Jiawen Zhu, Jinye Ran, Roy Ka-Wei Lee, Zhi Li, and Kenny Choo. 2021. AutoChart: A dataset for chart-to-text generation task. In Proceedings of the International Conference on Recent Advances in Natural Language Processing (RANLP 2021), pages 1636–1644, Held Online. INCOMA Ltd.
Appendix A Appendix
A.1 Experiment using Autochart
A.1.1 Splits
The authors of autochart did not create any data splits. The total size of the dataset is 23,543 chart-summary pairs. From the dataset, we use 10,593 and split it with the ratio of 70:15:15.
A.1.2 GPT-2 Noise Generation
To inject noise in the summaries, we first segment the summary using NLTK (Bird et al., 2009) sentence tokenizer. After segmenting the summary, we randomly pick a sentence and give it as a prompt to the GPT-2 model. For GPT-2 generation, we use greedy search. The generated sentence is then inserted at a random location in the segmented summary list, and then all the sentences are combined.
A.1.3 Threshold Determination
We analyzed a random sample of 100 filtered summaries and found that the mean entailment score of the entailed sentences was 89, while the mean entailment score given to the non-entailed sentences was 8.7. This means that the model is sure when assigning the score, and making minor adjustments to the threshold would not lead to significant improvements.
A.2 Ablations
We conducted ablation experiments to investigate where the improvement comes from in the linearization. We computed two ablations: (1) Obeid and Hoque (2020)’s linearization with added chart title (T5-S-O&HL+title), and (2) Kantharaj et al. (2022)’s linearization with added axis labels (T5-B-K + axis labels). Results are shown in Tables 4 and 5. Both ablation show improvements over the original linearizations, but do not match our scores, showing that all our format changes are helpful. For (1) resulting scores are between our linearization and Obeid and Hoque (2020)’s linearization, and for (2) resulting scores are very close to the original linearization results, however, they are slightly worse than ours. The most significant enhancement is due to (1), which is understandable as the model’s performance improves with increased context. Likewise, the inclusion of x-y labels leads to an enhancement over the initial outcomes. However, the performance is further boosted when the input data values are combined.
A.3 Human Evaluation Survey Details
A.3.1 Consent Form
Each user was asked to sign the consent form based on the following text: This study is being conducted as part of ongoing research at [——]. If you have any questions or comments about the study, please contact us on Prolific. You must be at least 18 years old to participate. Your participation in this research is voluntary. There are no risks or benefits to participating in this study. In the next section we will ask for your Prolific ID. All data will be anonymized prior to analysis and Prolific IDs will not be published.
A.3.2 Survey Description
Dear Participants, you will be evaluating summaries of charts. Choose the summary that has Value Correctness and Outside Information Presence. Rate the informativeness, coherence, and fluency of the summaries given the chart.
Value Correctness:
Numbers/figures/values in the summary are from the chart. Here you determine which of the summaries are accurate.
Outside Information:
Information that is not from the chart at all. Here you determine which of the summaries have information not taken from the chart.
Informativeness:
The summary conveys a lot of information about the chart. 1 being the least informative and 5 being the most informative.
Coherence:
The information included in the summary is orderly and logically consistent. Here you rate the coherence of the summary. 1 being the least coherent and 5 being the most coherent.
Fluency:
Summary is grammatically correct and does not contain any repetitions. Here you rate the fluency of the summary. 1 being the least fluent and 5 being the most fluent.
A.3.3 Evaluation of Measured Properties
Value correctness gives us a binary scores, meaning, either the summary has correct values or not. Similarly for outside information presence, we also get binary scores. For, informativeness, coherence, and fluency, we get scores out of 5-point Likert scale (Likert, 1932), 5 being the highest score, and 1 being the lowest score.
| T5-S-OL | T5-B-OL | T5-S-OL-NLI |
| This statistic shows road rage behavior among drivers in the United States. During the survey, 53 percent of respondents stated they had been on the receiving end of a rude gesture. All the participants in this survey had a valid U.S. driving license. | This statistic represents the road rage behavior among drivers in the United States as of April 2015. During the survey, 13 percent of respondents stated that they felt physically threatened by another driver to engage in angrily with another driver. The survey was conducted online and all the participants had a valid U.S. driving license. | This statistic shows the road rage behavior among drivers in the United States. 53 percent of respondents said they had been on the receiving end of a rude gesture and 26 percent of the respondents said they have yelled or used profanity at another driver. |
![[Uncaptioned image]](/html/2308.00399/assets/x3.png)
|
Platform Facebook 0 bar chart 18-24 36 1 bar chart 25-29 41 2 bar chart 30-34 50 3 bar chart Platform Instagram 0 bar chart 18-24 24 1 bar chart 25-29 17 2 bar chart 30-34 13 3 bar chart Platform YouTube 0 bar chart 18-24 12 1 bar chart 25-29 14 2 bar chart 30-34 11 3 bar chart Platform LinkedIn 0 bar chart 18-24 7 1 bar chart 25-29 10 2 bar chart 30-34 10 3 bar chart Platform Pinterest 0 bar chart 18-24 9 1 bar chart 25-29 8 2 bar chart 30-34 8 3 bar chart Platform Snapchat 0 bar chart 18-24 9 1 bar chart 25-29 9 2 bar chart 30-34 5 3 bar chart Platform Twitter 0 bar chart 18-24 3 1 bar chart 25-29 1 2 bar chart 30-34 2 3 bar chart |
![[Uncaptioned image]](/html/2308.00399/assets/x4.png)
|
Foreign-born population in the United States, 1900-2013 10.3 13.5 13.9 14.2 11.6 10.3 9.7 9.6 14.1 19.8 31.1 39.9 41.3 1900 1910 1920 1930 1940 1950 1960 1970 1980 1990 2000 2010 2013 |
![[Uncaptioned image]](/html/2308.00399/assets/x5.png)
|
Sales volume of beer in Prince Edward Island ( P.E.I ) from FY 2012 to FY 2019 , by product type ( in million liters ) labels Year - Packaged - Draught values 2019 8.62 1.13 , 2018 8.65 1.1 , 2017 8.19 0.98 , 2016 8.48 0.91 , 2015 8.39 0.83 , 2014 8.47 0.74 , 2013 8.84 0.65 , 2012 8.79 0.64 |
| Model Version | Model Repository |
|---|---|
| Pre-trained T5-base (Raffel et al., 2020) | https://huggingface.co/t5-base |
| Parameter | Value |
| Maximum input length | 1024 |
| Maximum target length | 512 |
| Truncation | True |
| Padding | max_length |
| batch size | 2 |
| Optimizer | Weighted Adam (Kingma and Ba, 2015) |
| Learning rate | 3e-4 |
| Weight decay | 0.01 |
| Training epochs and hours for T5-S-O&HL | 6 epochs, 11 hours |
| Training epochs and hours for T5-S-OL | 6 epochs, 11 hours |
| Training epochs and hours for T5-AC-orig | 8 epochs, 6 hours |
| Training epochs and hours for T5-AC-noisy | 8 epochs, 6 hours |
| Training epochs for T5-S-OL-NLI | 6 epochs, 11 hours |
| Training epochs for T5-B-OL | 12 epochs, 37 hours |
| Training runs for all the models | Single run |
| Beam size | 4 |
| GPU | Tesla T4 16 GB |