Autonomous data extraction from peer reviewed literature for training machine learning models of oxidation potentials
Abstract
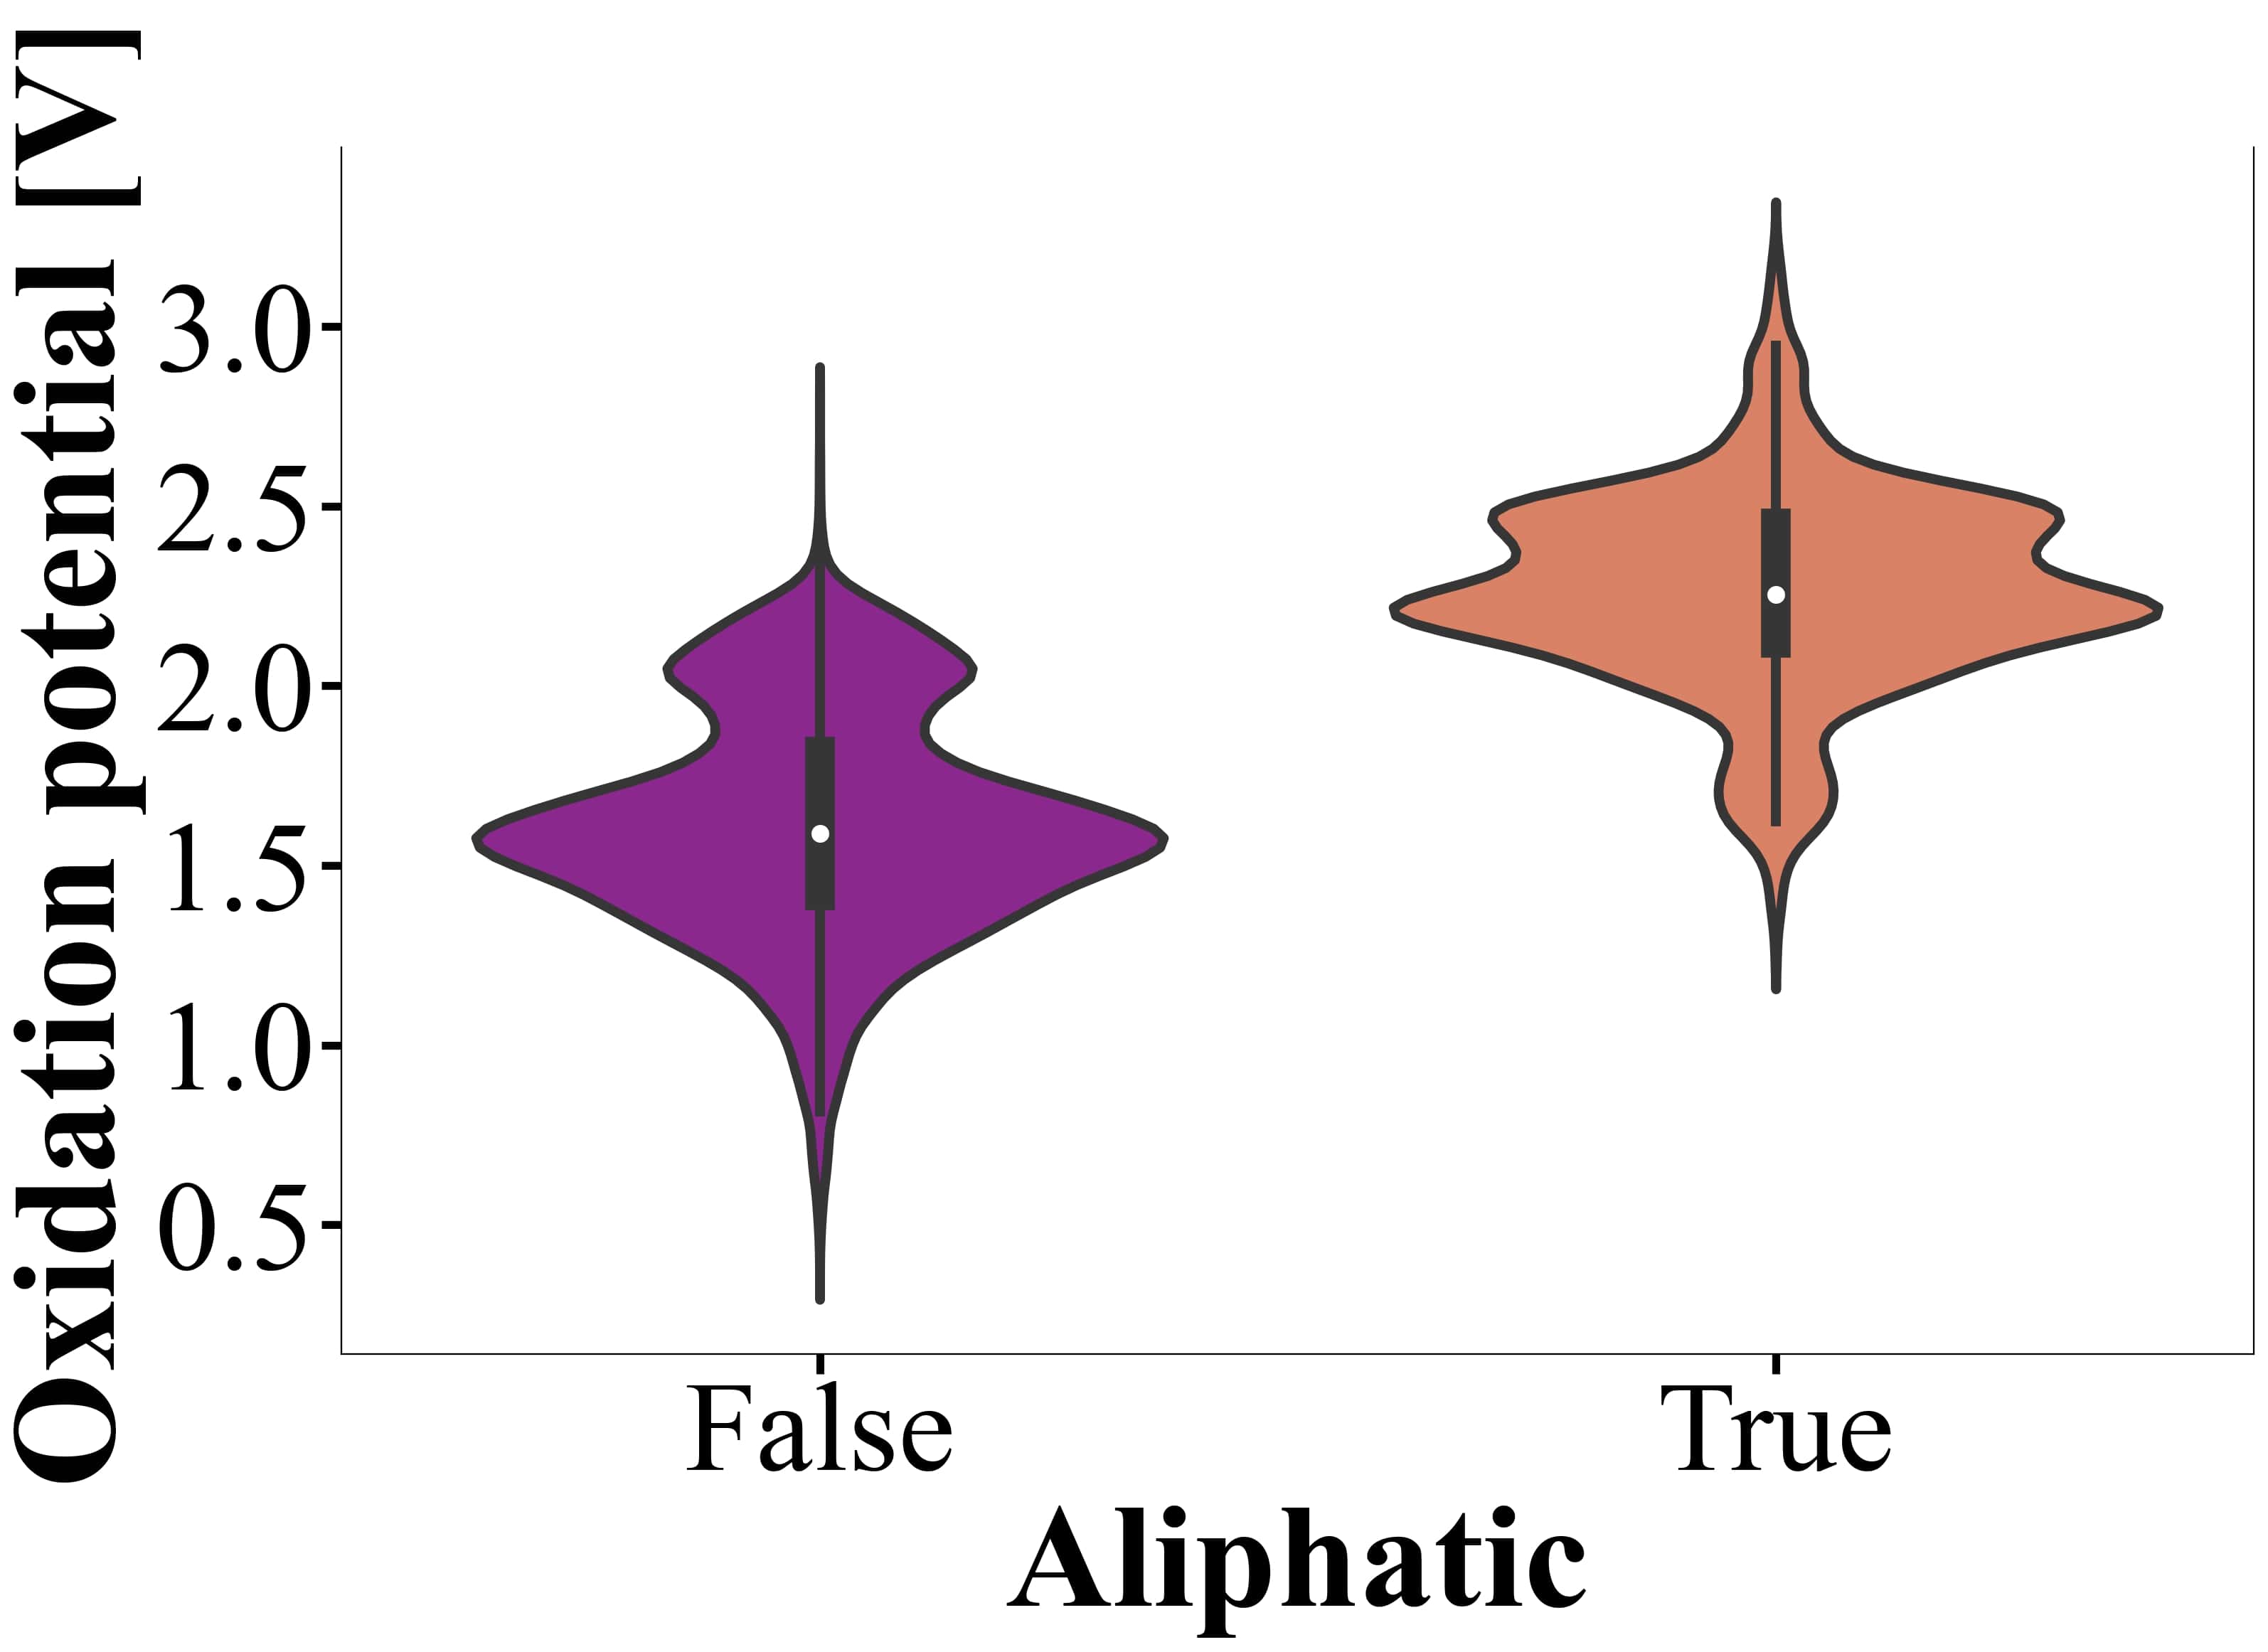
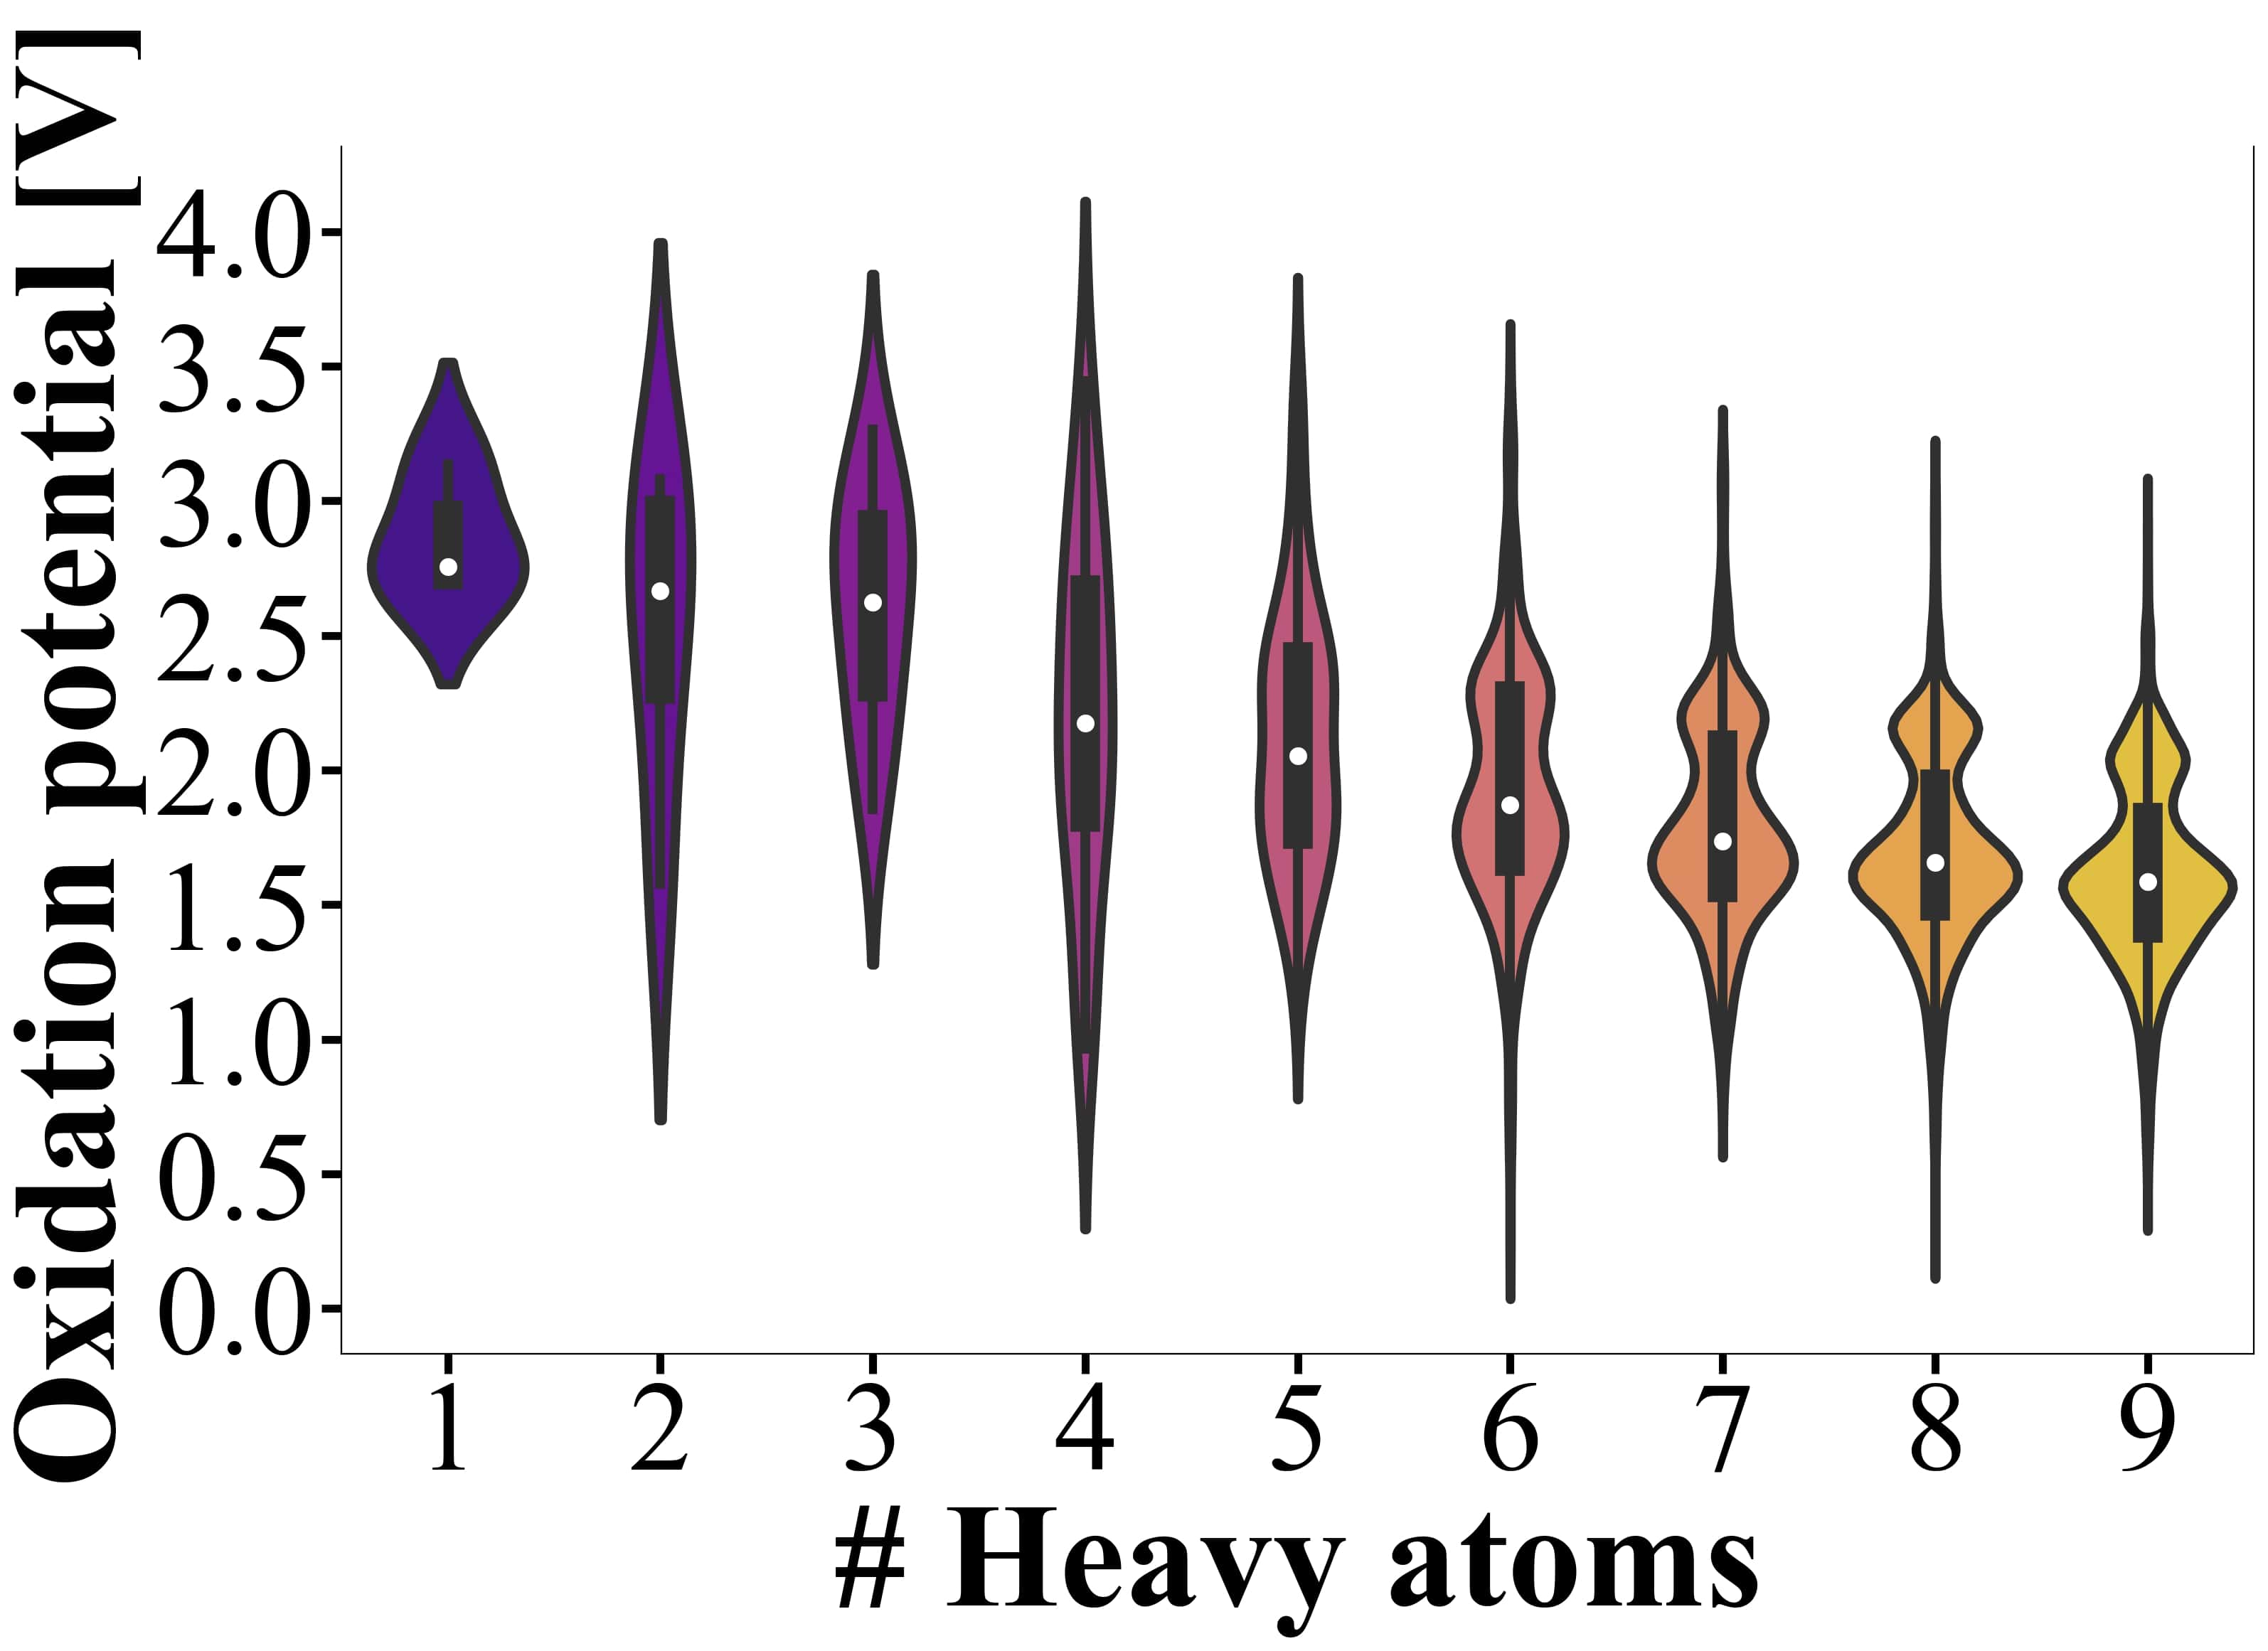
We present an automated data-collection pipeline involving a convolutional neural network and a large language model to extract user-specified tabular data from peer-reviewed literature. The pipeline is applied to 74 reports published between 1957 and 2014 with experimentally-measured oxidation potentials for 592 organic molecules (-0.75–3.58 V). After data curation (solvents, reference electrodes, and missed data points), we trained multiple supervised machine learning models reaching prediction errors similar to experimental uncertainty (0.2 V). For experimental measurements of identical molecules reported in multiple studies, we identified the most likely value based on out-of-sample machine learning predictions. Using the trained machine learning models, we then estimated oxidation potentials of 132k small organic molecules from the QM9 data set, with predicted values spanning 0.21–3.46 V. Analysis of the QM9 predictions in terms of plausible descriptor-property trends suggests that aliphaticity increases the oxidation potential of an organic molecule on average from 1.5 V to 2 V, while an increase in number of heavy atoms lowers it systematically. The pipeline introduced offers significant reductions in human labor otherwise required for conventional manual data collection of experimental results, and exemplifies how to accelerate scientific research through automation.
I Introduction
The accessibility and utilization of literature data through systematic reviews and meta-analyses are of significant importance across all scientific disciplines to rigorously assess the wealth of information contained in multiple studies and compile them in large-scale data sets 1, 2, 3, 4.
However, reproducibility concerns as well as the rapid growth in the number of scientific publications 5, 6 poses significant limitations on efficiently reading, understanding, and extracting the enormous volume of ever growing information.
The development of automated retrieval of pertinent information7 could address the challenge of training meaningful machine learning (ML) models that require sufficiently large scientific data sets 8, 9.
In particular, tabular data in literature sources holds immense importance in scientific research as they organize a large body of information in an easily-readable fashion.
Thus, the efficient extraction of tabular information would greatly streamline data collection from a large number of studies.
Yet, upon examining different reference sources, it is evident that tables are presented in a variety of layouts, visual appearances, and encoding formats (eg. HTML, PDF, JPG), which poses a significant hurdle in the automated detection of tables in the literature10.
However, recent advances in algorithmic designs and computing capabilities have seen the development of convolutional neural network (CNN) models, such as TableNet10, 11, 12, that are trained to locate tables in document pages displayed as images and are capable of reaching state-of-the-art performances on the ICDAR 2013 table competition data set 13.
A secondary challenge that follows table detection using CNN models is the accurate extraction of text from images, a task known as optical character recognition (OCR) 14.
Google’s Tesseract-OCR engine 15, 16 and various ML and deep neural network (DNN) models have been demonstrated to successfully convert images of typed, handwritten, or printed text into machine-encoded text with low character-level substitution rates and word-level error-rates 16, 17.
Then, a third, and closely-related problem relevant to scientific research is the ability of these models to extract specific text.
This presents a significant challenge due to the need for semantic understanding, especially as documents may display several tables containing different types of data with irrelevant accompanying information 18.
The recent development of large language models (LLMs) presents a promising solution to the challenge of semantic understanding as they can leverage their extensive training on large volumes of text to recognize and interpret the meaning of specified text 19.
Indeed, LLMs have already seen widespread usage for a variety of scientific purposes 20.
For instance, in chemistry, LLMs have been utilized to generate code, learn complex molecular distributions, aid in materials and drug design, and to extract chemical information from scientific documents 21, 22, 23, 24, 25, 26.
Generative pre-trained transformers (eg. GPT-2, GPT-3.5, GPT-4) models developed by OpenAI present particularly exciting applications for research in chemistry and other scientific disciplines for their human-like semantic understanding and their ability to generate human-like text when presented with a prompt 27, 28, 29, 30, 31.
In this work, an automated data-collection pipeline is introduced that accurately locates tables and extracts text from literature sources using the CNN TableNet, and the LLM GPT-3.5, respectively. We demonstrate its usefulness by building a chemically-diverse data set of experimentally-measured oxidation potentials (measured in acetonitrile solvent vs standard calomel electrode, SCE) of organic molecules from peer-reviewed literature. Oxidation potentials are important electrochemical stability and reactivity descriptors; modeling them with efficient machine learning and high predictive power could crucially accelerate the computational design and discovery of superior functional materials, such as batteries, supercapacitors, electrolytes, and electrocatalysts for applications in fuel cells and renewable energy conversion 32, 33, 34, 35. Based on the experimental data extracted using our pipeline, we have trained multiple supervised ML models that reach experimental uncertainty, and that can be used to identify less/more likely values among conflicting data entries. The generalizability of the ML models is used to predict and analyze the oxidation potential distribution in 132k organic molecules coming from the QM9 data set 36. Previous ML studies of redox potentials of organic molecules were limited to small data sets based on simulated values which typically encode severe approximations making it difficult to draw direct conclusions relevant for experimental decision making.37, 38, 39, 40, 41, 42, 43, 44, 45, 46.
II Methodology
II.1 From Literature to Data Set
The first component of the automated tabular data extraction pipeline (Figure 1) after the collection of literature sources is the detection and localization of tables (CNN step of Figure 1).
This is accomplished by using TableNet with a DenseNet-121 encoder architecture (8,220,550 trainable parameters; 461,504 non-trainable parameters) with dropout (0.6) 48 (see Section J of Supplementary Information for the Python implementation used in this work and Paliwal et al. 12 for further details about the architecture).
This model was trained for 35 epochs on 495 scanned RGB images (816 1056 pixels) of document pages containing tables with English text compiled in the Marmot data set (80/20 train/test random split) with labelled coordinates of the rectangular table regions in each image 49.
The model learns these coordinates such that it can output cropped images of the documents containing just the detected tables.
The generalization capabilities of the CNN were then assessed by its ability to locate tables in 74 literature sources (published 1957-2014), saved as PDFs, that reported the experimentally-measured oxidation potentials of organic molecules (see Bibliography of Supplementary Information for the used references).
pdf2image50 was used to convert the PDF pages to JPGs (816 1056 pixels), which were inputted into the CNN.
The text contained in the outputted cropped images were extracted using pytesseract47, the Python wrapper for Tesseract-OCR (pytesseract step of Figure 1).
The blocks of text were each individually forwarded into the GPT-3.5 API once to screen for data of oxidation potentials with the following prompt (LLM steps of Figure 1):
Does this following piece of text contain one or more tables of oxidation potentials of organic molecules? If it does, give the code for a neatly-displayed Panda DataFrame explicitly listing only the molecules and their corresponding oxidation potentials. Ensure to list all molecules. Also, if stated, report the reference electrode and the solvent the measurements occurred in.
If GPT-3.5 was able to successfully output the name of molecules, their oxidation potentials, and the reference electrode and solvent used in the experimental measurements, the master data set was compiled by including only neutrally-charged samples measured in acetonitrile to account for typical electrochemical measurement conditions in the laboratory 51.
For samples labelled by their full names, the Leruli API52 was used to convert the names to their canonical SMILES53, followed by the use of RDKit54 to produce XYZ files from the SMILES (Leruli, RDKit steps of Figure 1).
The XYZ files were inputted into the extended tight binding (XTB) API55, 56 to produce (implicit solvation) optimized geometries in acetonitrile.
XTB also produced 17 calculated values for each molecule, including their HOMO-LUMO gaps and solvation free energies in acetonitrile.
The oxidation potentials of molecules measured in multiple studies were taken as the mean value.
Measurements referenced against non-SCE electrodes were converted to be referenced against SCE as according to handbooks on the standard potentials of reference electrodes 57, 58.
The data set was supplemented as necessary by human labor for samples that the pipeline missed or incorrectly reported, as well as for cases in which the reference electrodes and solvents used in the experimental measurements could not be determined from the text contained in the tables.
II.2 eXtreme Gradient Boosting and Kernel Ridge Regression
XGBoost Regression (eXtreme Gradient Boosting Regression: XGBR) was selected as a candidate ML algorithm due to its exceptional performance and versatility in handling various regression tasks due to gradient boosting and optimized tree-based ensemble learning algorithms 59.
Kernel ridge regression (KRR) was also tested as it is a popular algorithm for ML in quantum chemistry due to its ease of hyperparameter tuning, in addition to its excellent ability to capture non-linear relationships using kernel functions and its efficiently handing of high-dimensional data 60, 61. It accomplishes this using kernel functions, which in this work are selected to be Laplacian kernels of the form
Bayesian optimization implemented with hyperopt64 was used for hyperparameter-tuning both algorithm types, with hyperparameters selected as those that returned the lowest mean absolute error, MAE, on four-fold cross-validation on the training set (80/20 train/test random split).
II.3 Physics-Based Structural Representations
Four XGBR models were developed in this work with the following input features: ACSF65; ACSF, XTB values; ACSF, MORDRED 66; ACSF, XTB values, MORDRED.
MORDRED is a popular two- and three-dimensional molecular descriptor-calculation software in cheminformatics and is used, in this work, to generate three-dimensional descriptors from MOL files produced from the XTB-geometry-optimized XYZ coordinates.
Three KRR models were also developed with input features of ACSF, SOAP67, and SLATM68.
The XYZ files were used to produce three popular physics-inspired structural representations69 of atomic and molecular environments: atom-centered symmetry functions (ACSF), smooth overlap of atomic positions (SOAP)67, and Spectrum of London and Axilrod-Teller-Muto potentials (SLATM) 68.
These representations were used to predict the oxidation potentials of organic molecules using three KRR models.
ACSFs are local descriptors that express a molecule’s total energy as a sum of atomic energies by constructing many-body symmetry functions, composed of radial and angular parts, for all atoms within a specified cutoff radius as given by a cutoff function65. This work uses radial symmetry functions of
| (2) |
where defines the width of the Gaussian function and shifts the Gaussian functions by a certain radial distance65. This work uses angular symmetry functions of
| (3) |
where defines the angular resolution of the symmetry functions and shifts the maxima of the cosine functions between 0 and radians65.
The ACSF representations are generated using the DScribe library70 with 9.0 Å, 6 pairs of parameters for the radial functions, and 6 triplets of parameters for the angular functions.
SOAP descriptors represent local atomic environments where each is described by a single power spectrum of the form
| (4) |
where index different atoms67, 70.
DScribe was again used to generate SOAP representations in this work, with parameters selected as (maximum number of radial basis functions), (maximum degree of spherical harmonics), , and spherical Gaussian-type orbitals for the radial basis functions, .
SLATM returns a global representation of the charge density of a given system by concatenating different many-body potential spectra composed of one, two, and three-body terms representing the atomic nuclear charges, London potentials, and Axilrod-Teller-Muto van der Waals potentials, respectively68.
In this work, SLATM representations were generated using the QML-code library 62.
The best-performing ML model on the test set was then used to screen the oxidation potentials of 132k molecules listed in the QM9 database36, 71, which reports the geometries of 134k stable small organic molecules with up to 9 heavy (non-hydrogen) atoms (C, N, O, F) computed at the B3LYP/6-31G(2df,p) level of quantum chemistry72, 73, 74. The molecules in QM9 thus lie within the domain of the extracted data set by chemical composition and is suitable for estimations of oxidation potentials by the developed ML model based on interpolations.
III Results and Discussion
III.1 Extracting Data
The performance of the automated data collection pipeline in accurately identifying tables containing oxidation potentials and extracting their values was verified via human labor.
In the 74 reference sources, one human count returned a total of 182 tables, containing a variety of information such as oxidation potentials, spectroscopic data, product yields, and reaction kinetics.
Of these, the CNN failed to locate 19 tables, a 10 % error which is comparable to that associated with some top-performing table detection models 10(Figure 2) (see Section I of Supplementary Information for an example output from the CNN).
The extracted text from the table images outputted from the CNN were then forwarded into GPT-3.5 to screen for measurements of oxidation potentials.
One human count returned a total of 1715 measurements.
GPT-3.5 failed to accurately report the oxidation potentials of 445 samples (26 % error) (see Section I of Supplementary Information for an example output from GPT-3.5).
However, 262 instances of these were due to the molecular samples being labelled with bond-line structures, numbers, or by their substituent groups.
171 samples were simply missed by GPT-3.5, and 12 samples had incorrectly reported oxidation potentials.
Therefore, only considering samples that were not detected or were incorrectly reported, GPT-3.5 yields an error rate of 13%.
The data extraction performance may be improved by including optical chemical structure recognition tools to screen for molecular names and SMILES of compounds represented as bond-line structures75, 76, 77.
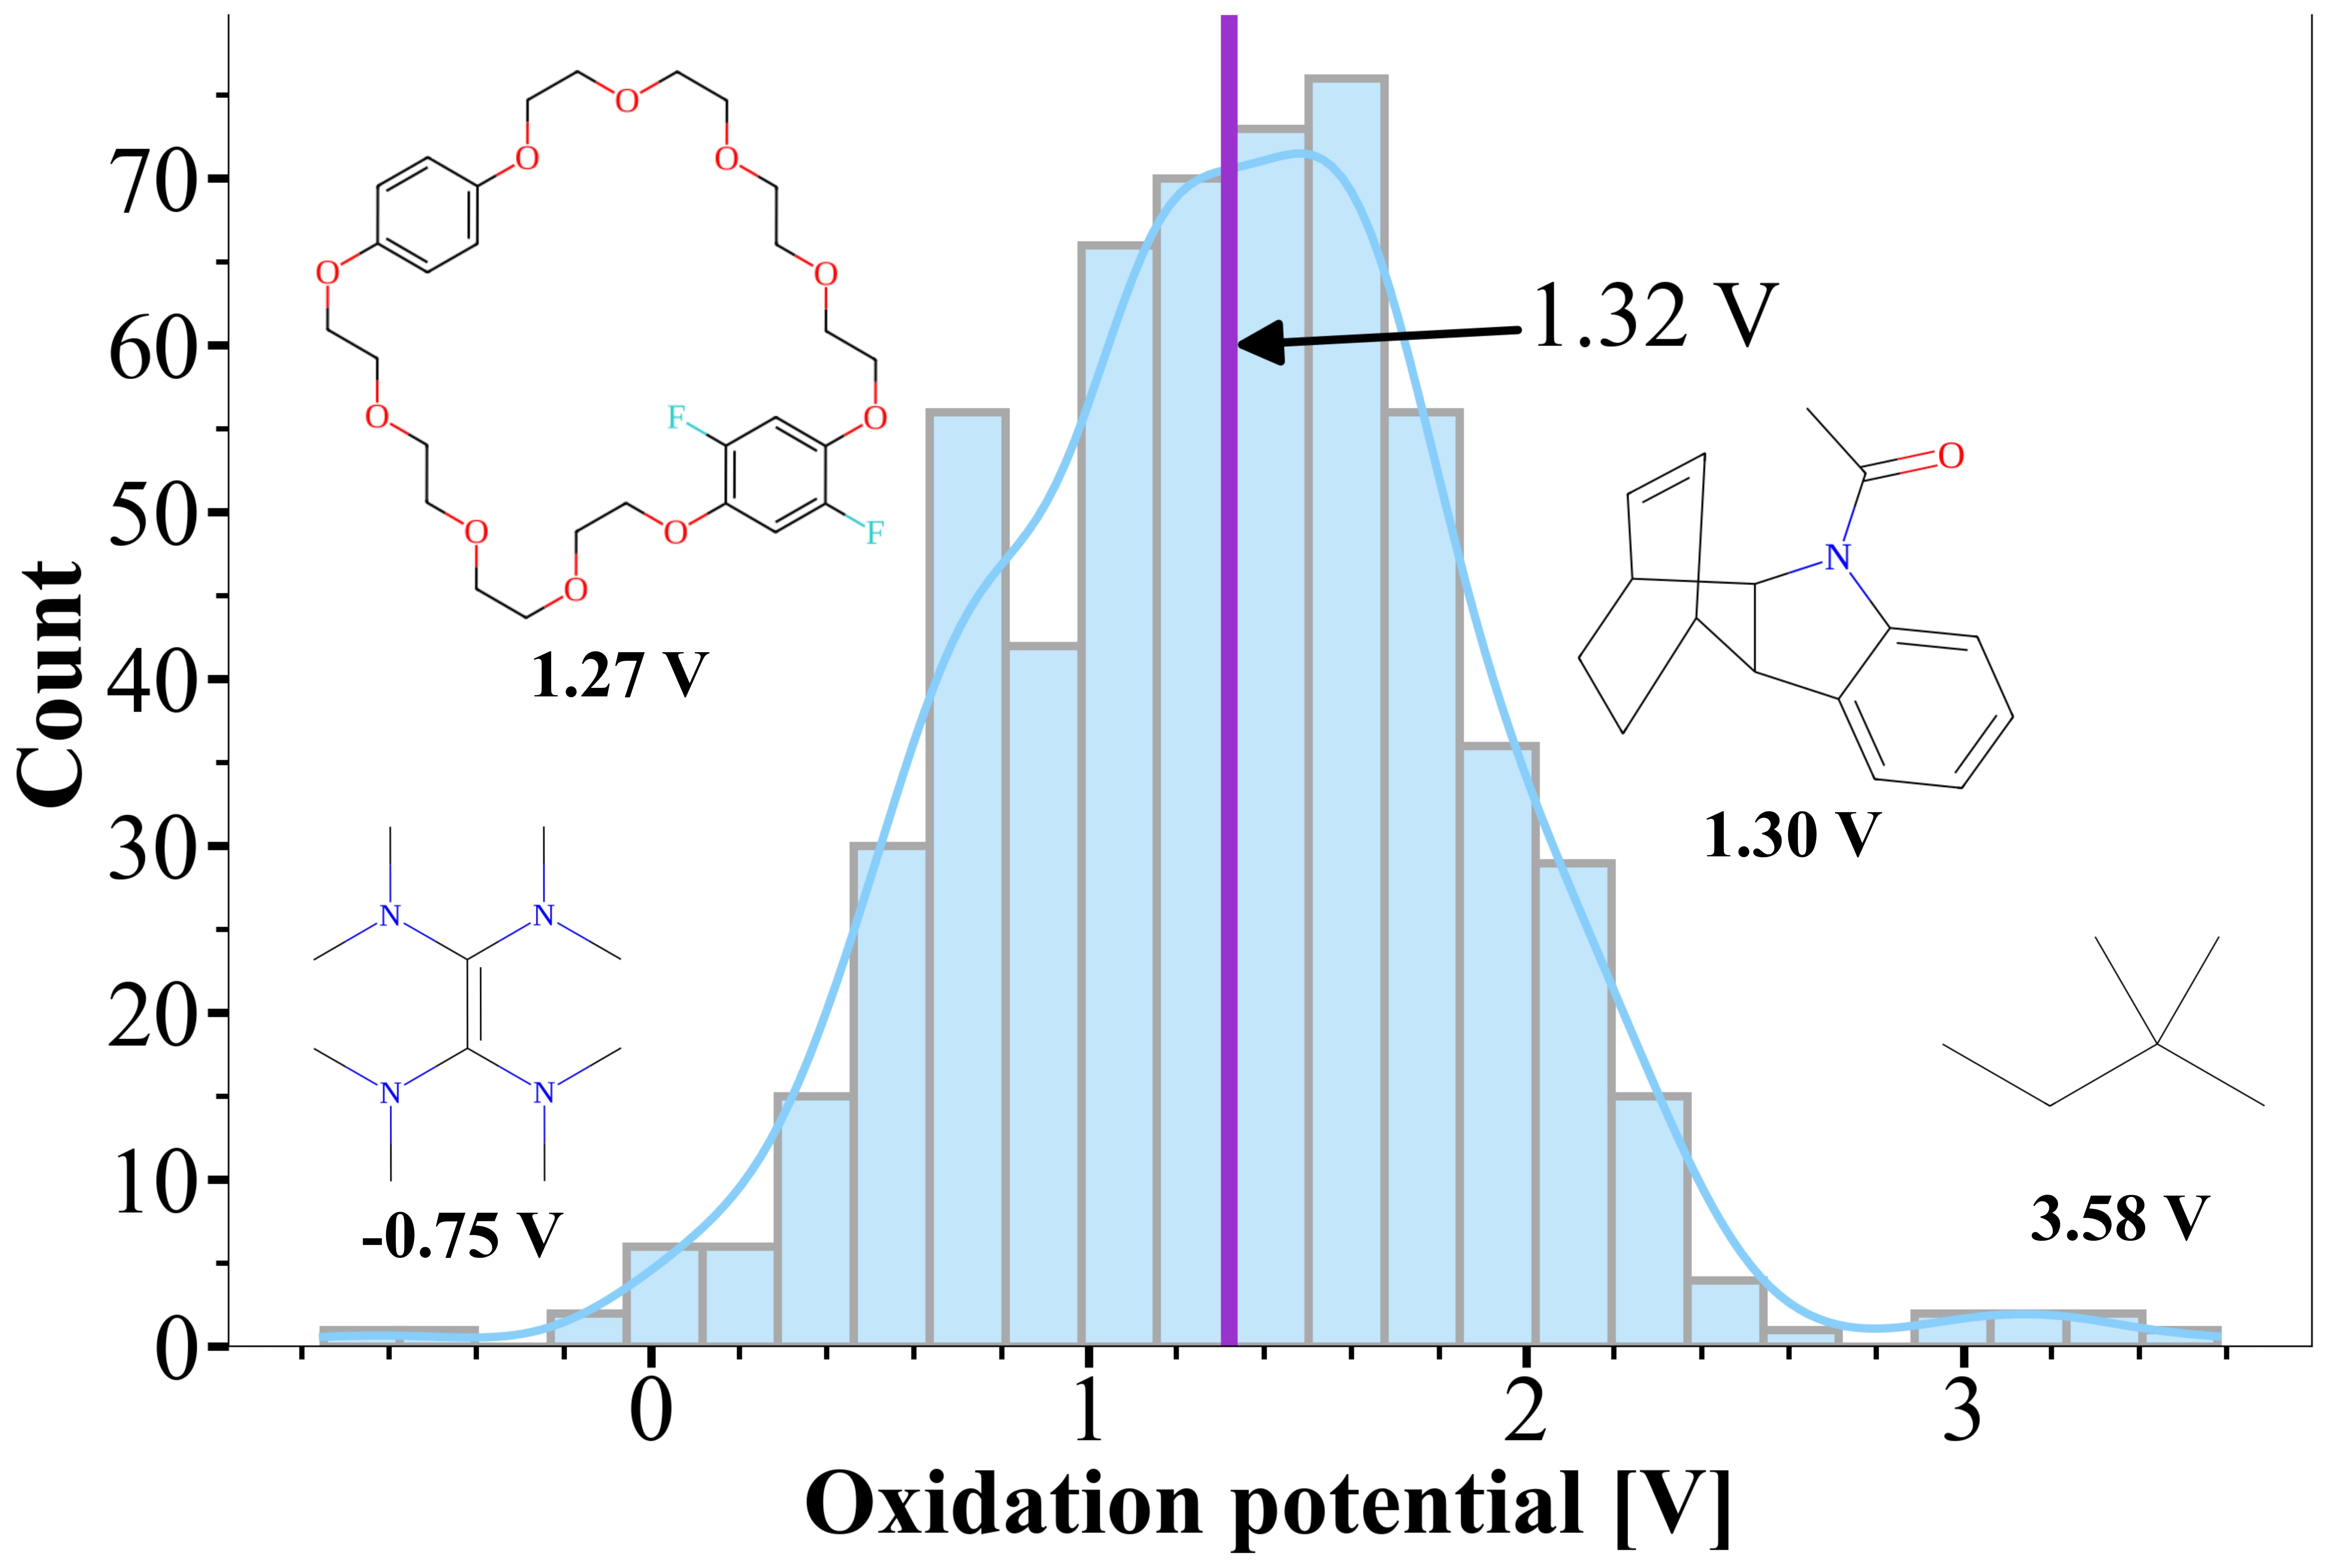
The compiled data set includes 592 unique molecules with a range of oxidation potentials of -0.75–3.58 V, with a mean value of 1.32 V (Figure 3).
See Section A of Supplementary Information for the table listing the oxidation potentials of all molecules.
On average the molecules have a molar mass of 184 g/mol (28–680 g/mol), 26 atoms (5–86 atoms), and 13 heavy atoms (2–46 heavy atoms) (see Section B of Supplementary Information for distribution plots of these parameters).
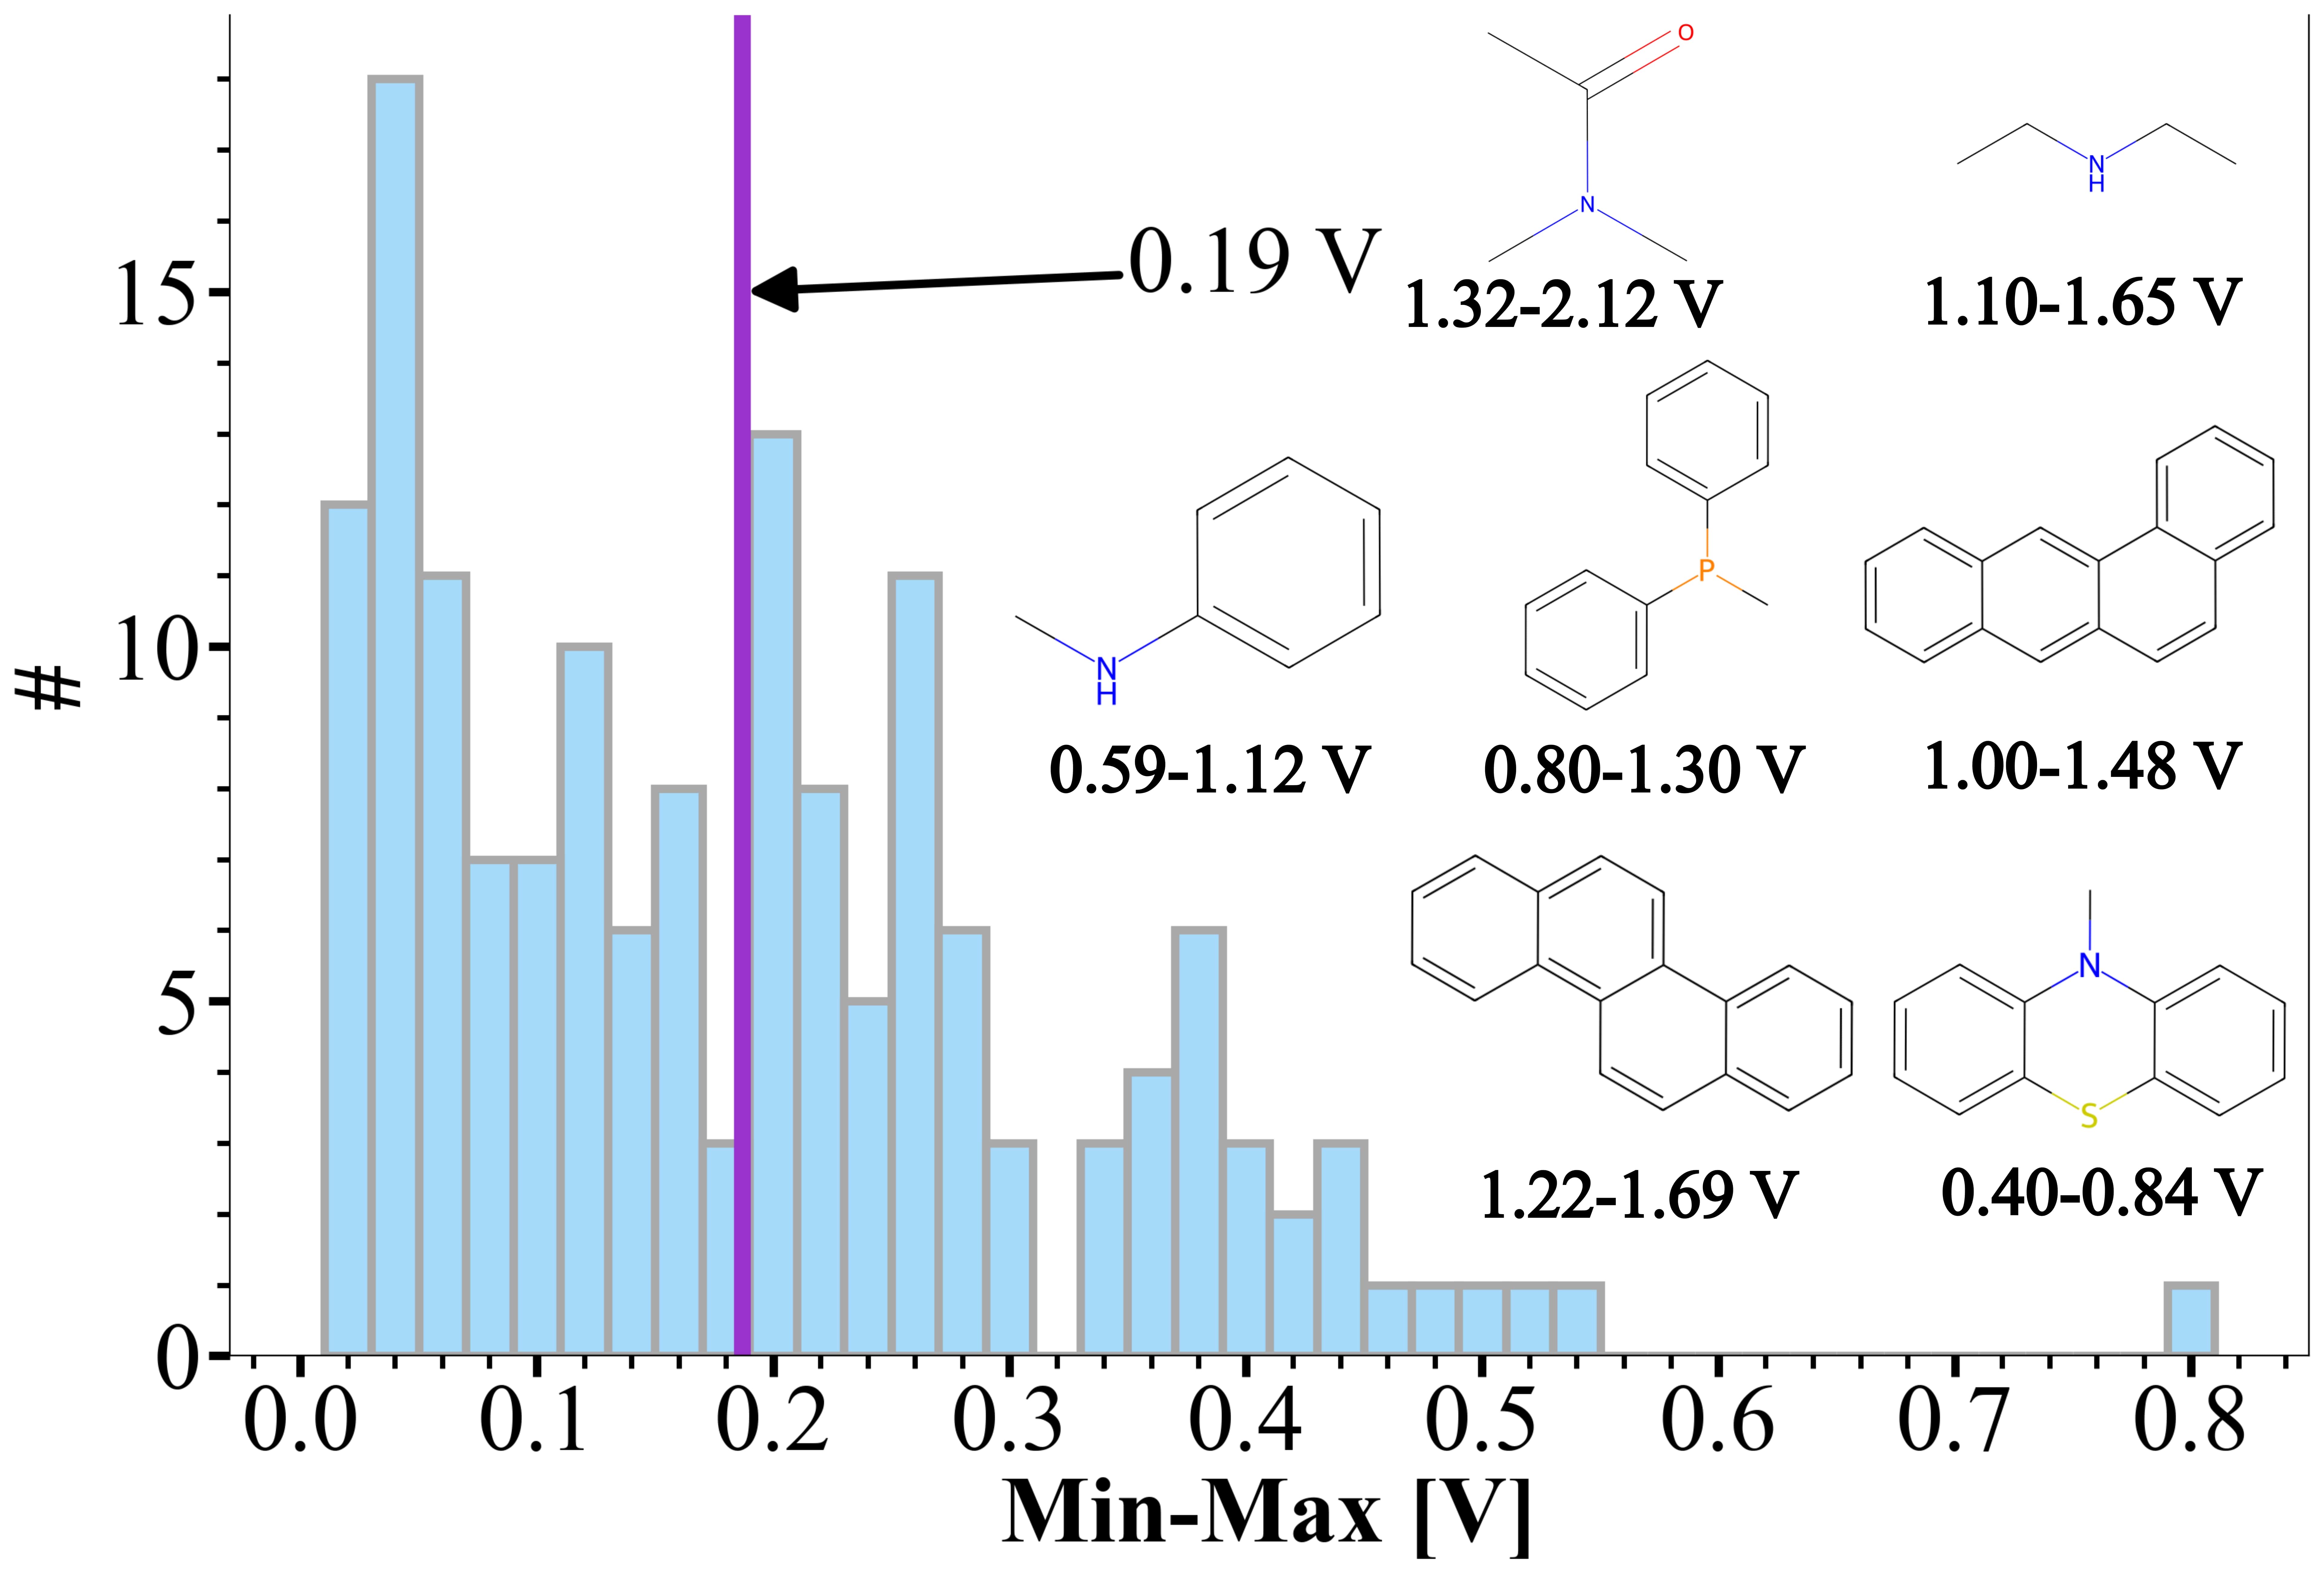
Out of these 592 molecules, for 155 molecules there are multiple entries in the literature; their deviations are shown in Figure 4.
III.2 ML Model Performance
The performances of the XGBR and KRR models were assessed by their MAE and their coefficients of determination, R2.
A target accuracy for the MAE was established as 0.2 V, which was deemed to appropriately represent experimental uncertainties since the average of the min-max range of oxidation potentials of molecules measured in multiple studies is 0.19 V (Figure 4).
By assessing these models by these metrics on the test set, the best performance on the out-of-sample test set was observed for the XGBR model trained on ACSF, XTB, MORDRED (MAE 0.15 V, R2 0.80), followed by ACSF, XTB; ACSF; ACSF, MORDRED (see Section C of Supplementary Information for actual vs predicted oxidation potentials of the test set).
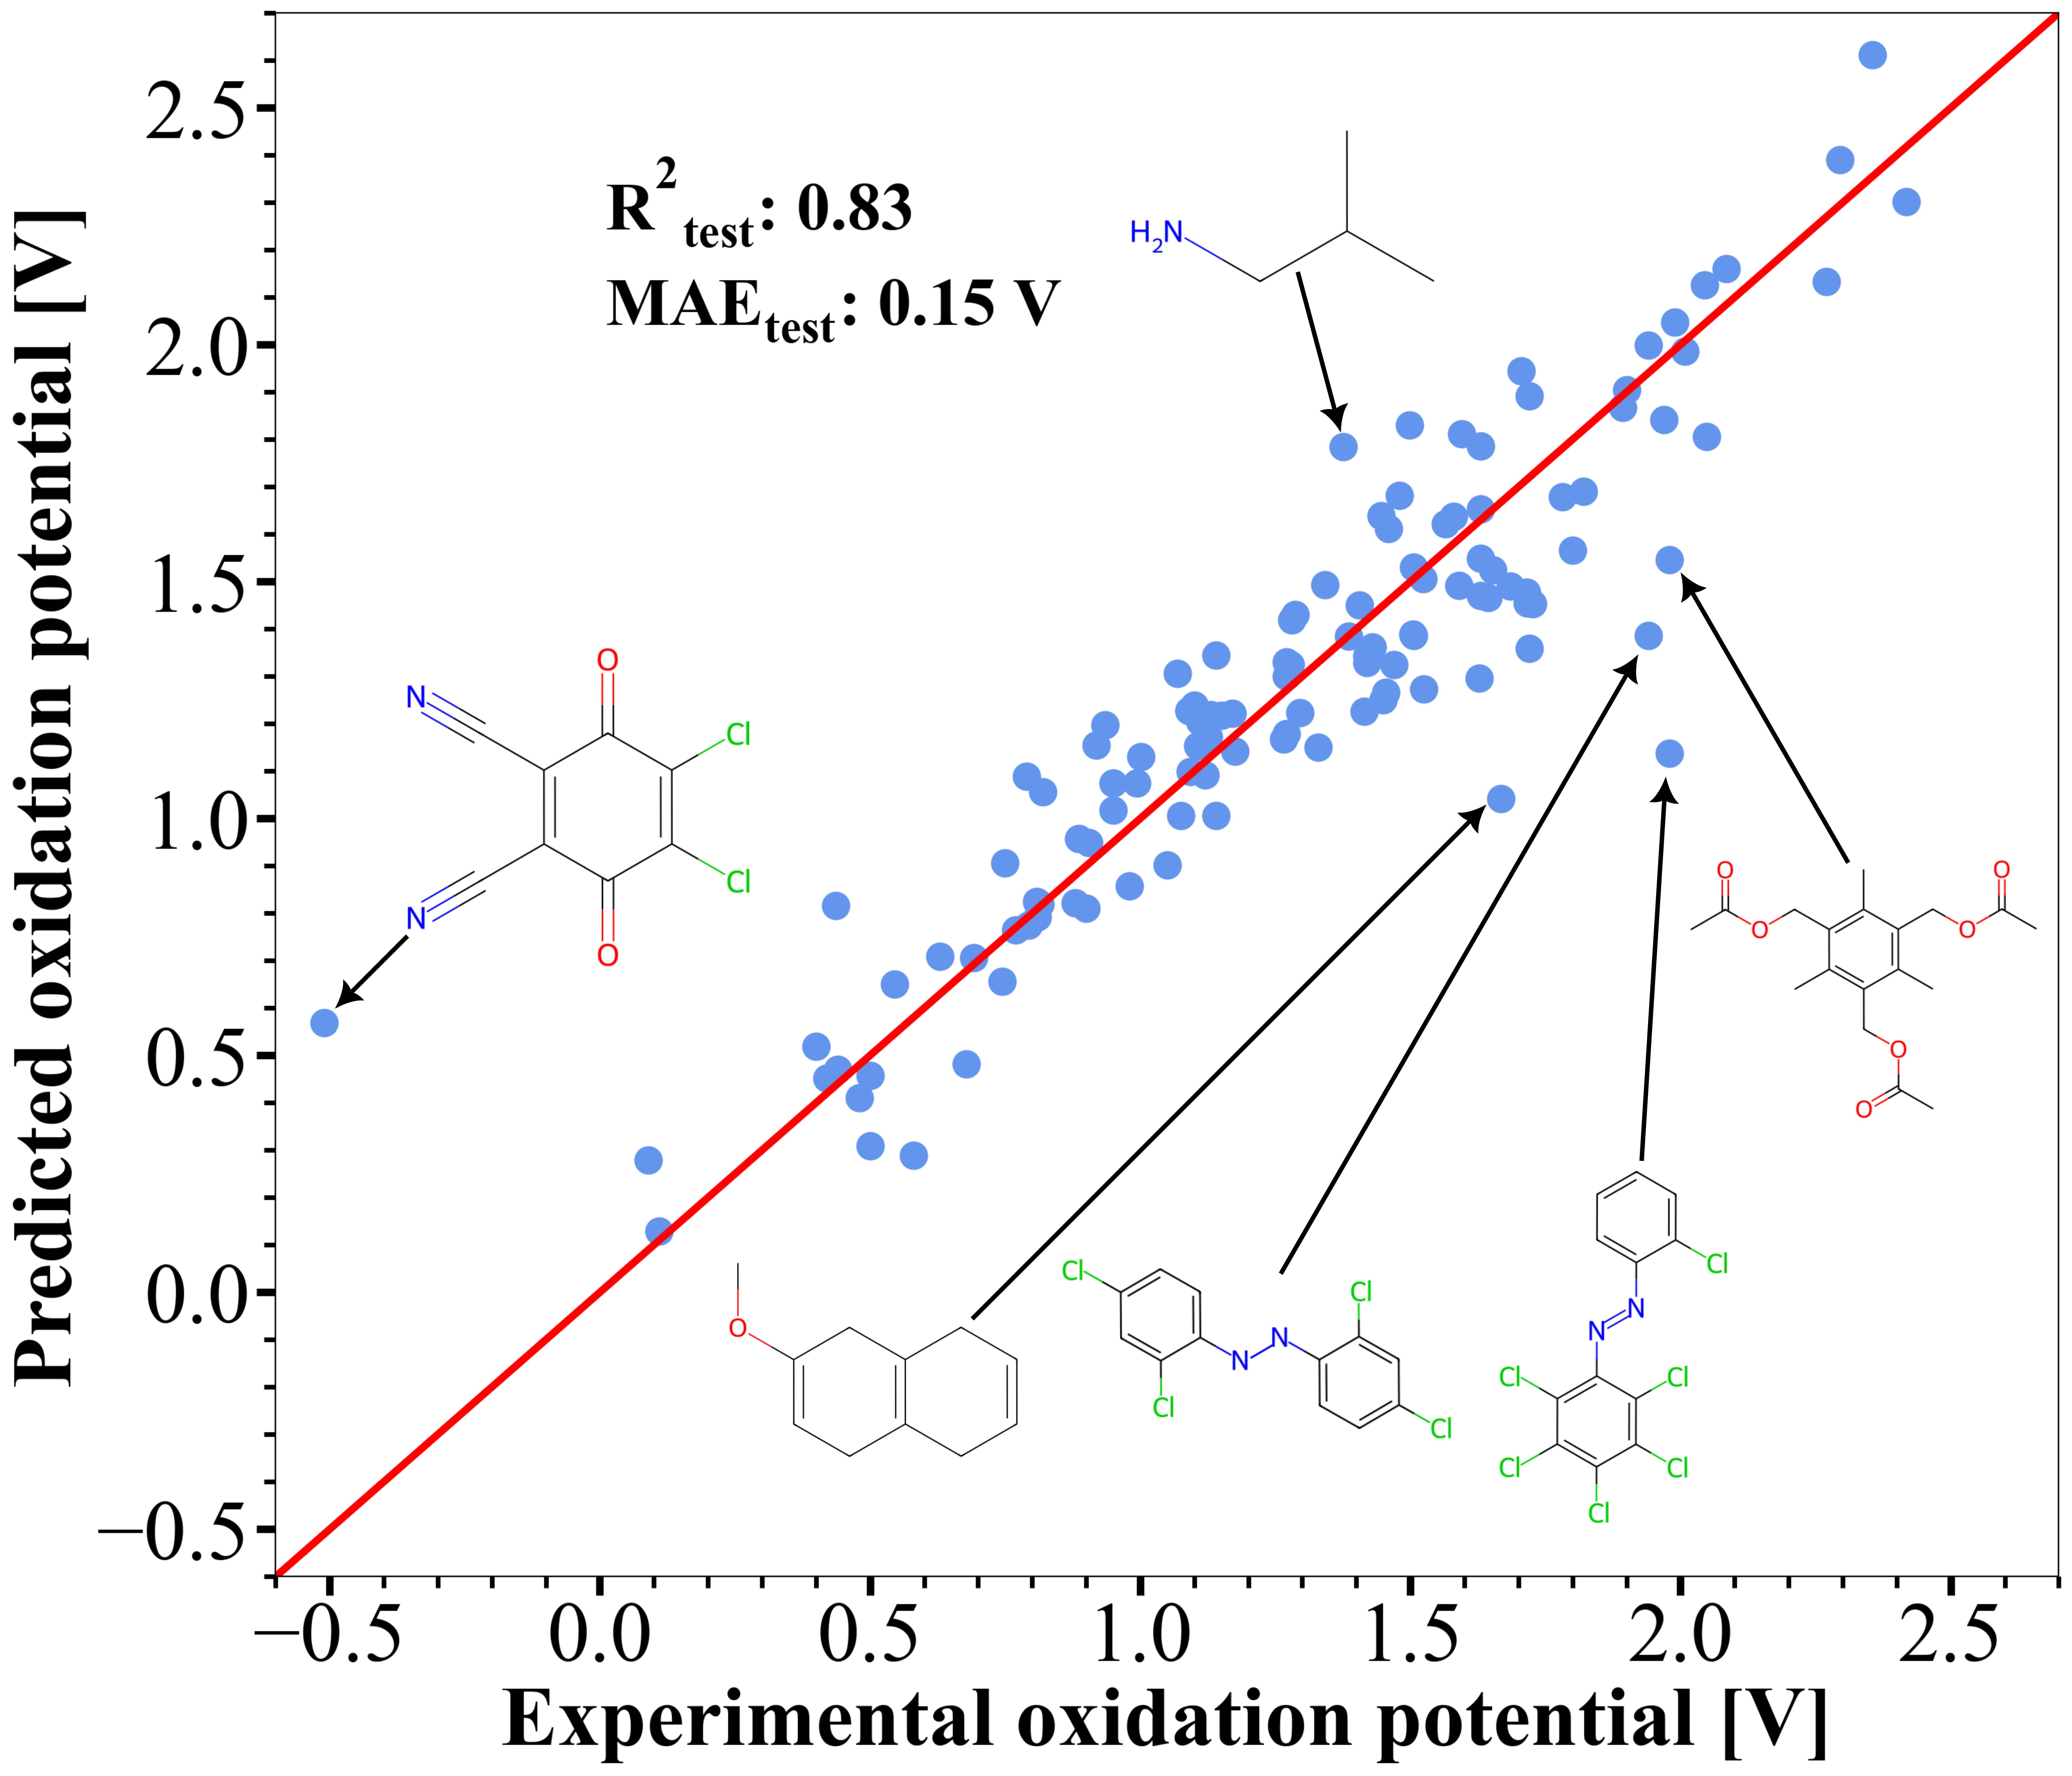
Similarly, the KRR model trained on the SLATM representation yields the lowest test set error (MAE 0.15 V; R2 0.83) (Figure 5a), followed by SOAP, then ACSF (see Section C of Supplementary Information for actual vs predicted oxidation potentials of the test set).
From these XGBR and KRR models, the KRR model trained on SLATM achieves the best performance on the test set as it achieved the greatest R2 value and the lowest MAE.
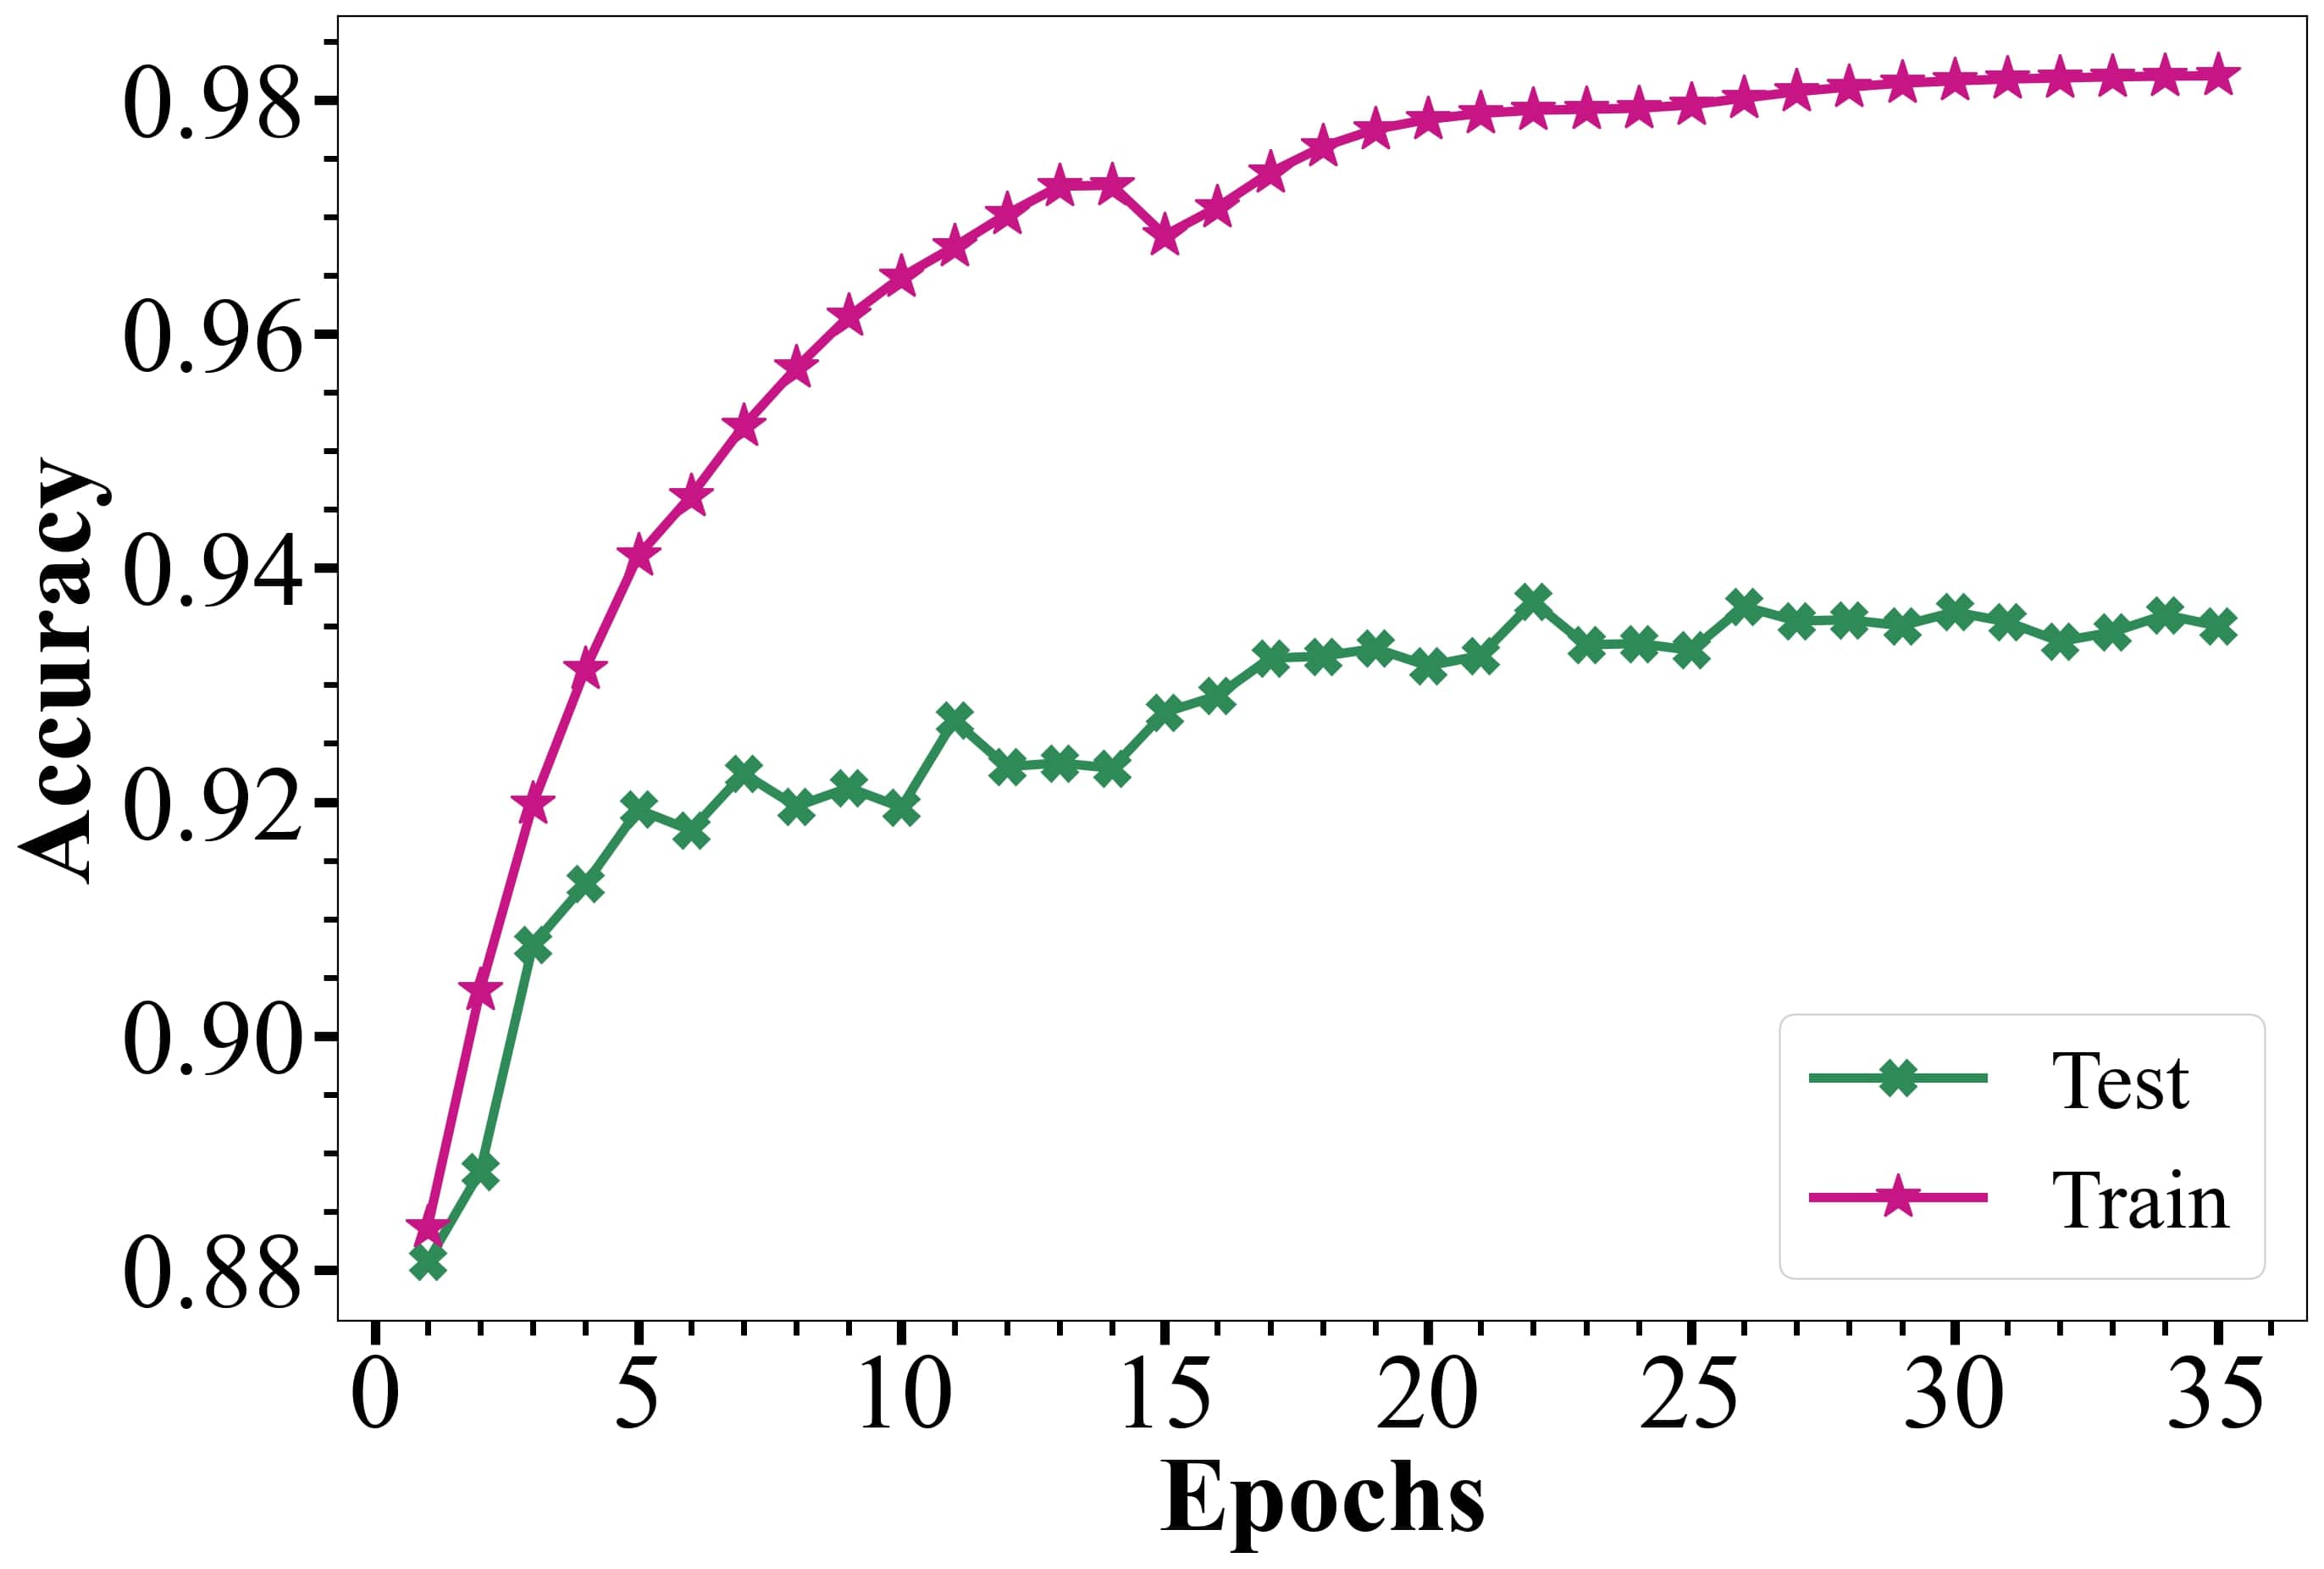
Further, the performances of the XGBR and KRR models were assessed using learning curves, which are key to evaluating the efficiency of ML models (Figure 6).
They show the MAEs of the various models at ten different subset sizes, , of the training set, as evaluated by four-fold cross-validation and plotted on a log-log scale.
The hyperparameters of these models were optimized for the largest training set size and were fixed for the training set size.
For instance, the KRR model trained on SLATM representation reaches the target MAE of 0.2 V the fastest after training on 416 samples (70 % of the data set), with similar performances achieved for XGBR models trained on ACSF, XTB, MORDRED and ACSF, XTB (Figure 6).
Compellingly, it is clear that all representations lead to systematic linear decays in the MAEs of the oxidation potentials, as is generally expected for learning curves 78.
This indicates that these physics-based molecular representations and molecular descriptors are well-suited to machine learn fundamental chemical properties like oxidation potentials.
Moreover, it demonstrates that the data collected from the literature through the automated process used in this work are of sufficient quality such that experimental uncertainty in the ML-predictions can be reached with a relatively small data set.
Further, these results suggest that the accuracy of these ML models can be systematically improved by increasing training data.
Improvements on the automated pipeline used in this work and its application toward a larger volume of literature work may be a method to efficiently expand this data set.
We noticed that experimental outcomes for 155 molecules were independently reported in otherwise unrelated publications. The distribution of the corresponding min-max values is featured in Figure 4. For some molecules, the deviation is considerable, and could be due to all sorts of reasons including noise from use of different experimental set-ups (e.g. use of different reference electrodes) as well as human error. For example, N,N-dimethylacetamide was measured to have an oxidation potential of 1.32 V 79, or of 2.12 V80. To estimate which measurement values for molecules with large deviations are more likely, the fifty molecules with the largest deviations were removed from training a KRR model on SLATM (80/20 train/test random split, four-fold cross-validation for hyperparameter tuning; MAE 0.15 V; R 0.85), which was subsequently used to predict the oxidation potentials of the fifty “suspicious” molecules (see Section C of Supplementary Information for the performance of the KRR model on the test set). Whichever experimental value that was closest to the predicted value was deemed to be the more likely value. In the case of N,N-dimethylacetamide, the ML prediction amounts to 1.90 V, statistically suggesting that the value of 2.12 V is closer to the truth than the value of 1.32. This kind of scoring has been performed for all the 50 molecules left out of training (see Section D of Supplementary Information).
III.3 Estimated Oxidation Potentials of QM9 Molecules and Descriptor-Property Analyses
The XGBR model trained on the ACSF representations and XTB-calculated values (MAE 0.16 V, R2 0.78) was used to estimate the oxidation potentials of 132k organic molecules contained in the QM9 database.
QM9 does not report calculated values of oxidation potentials and as far as the author is aware, no previous work has performed a screen of the database to estimate such values.
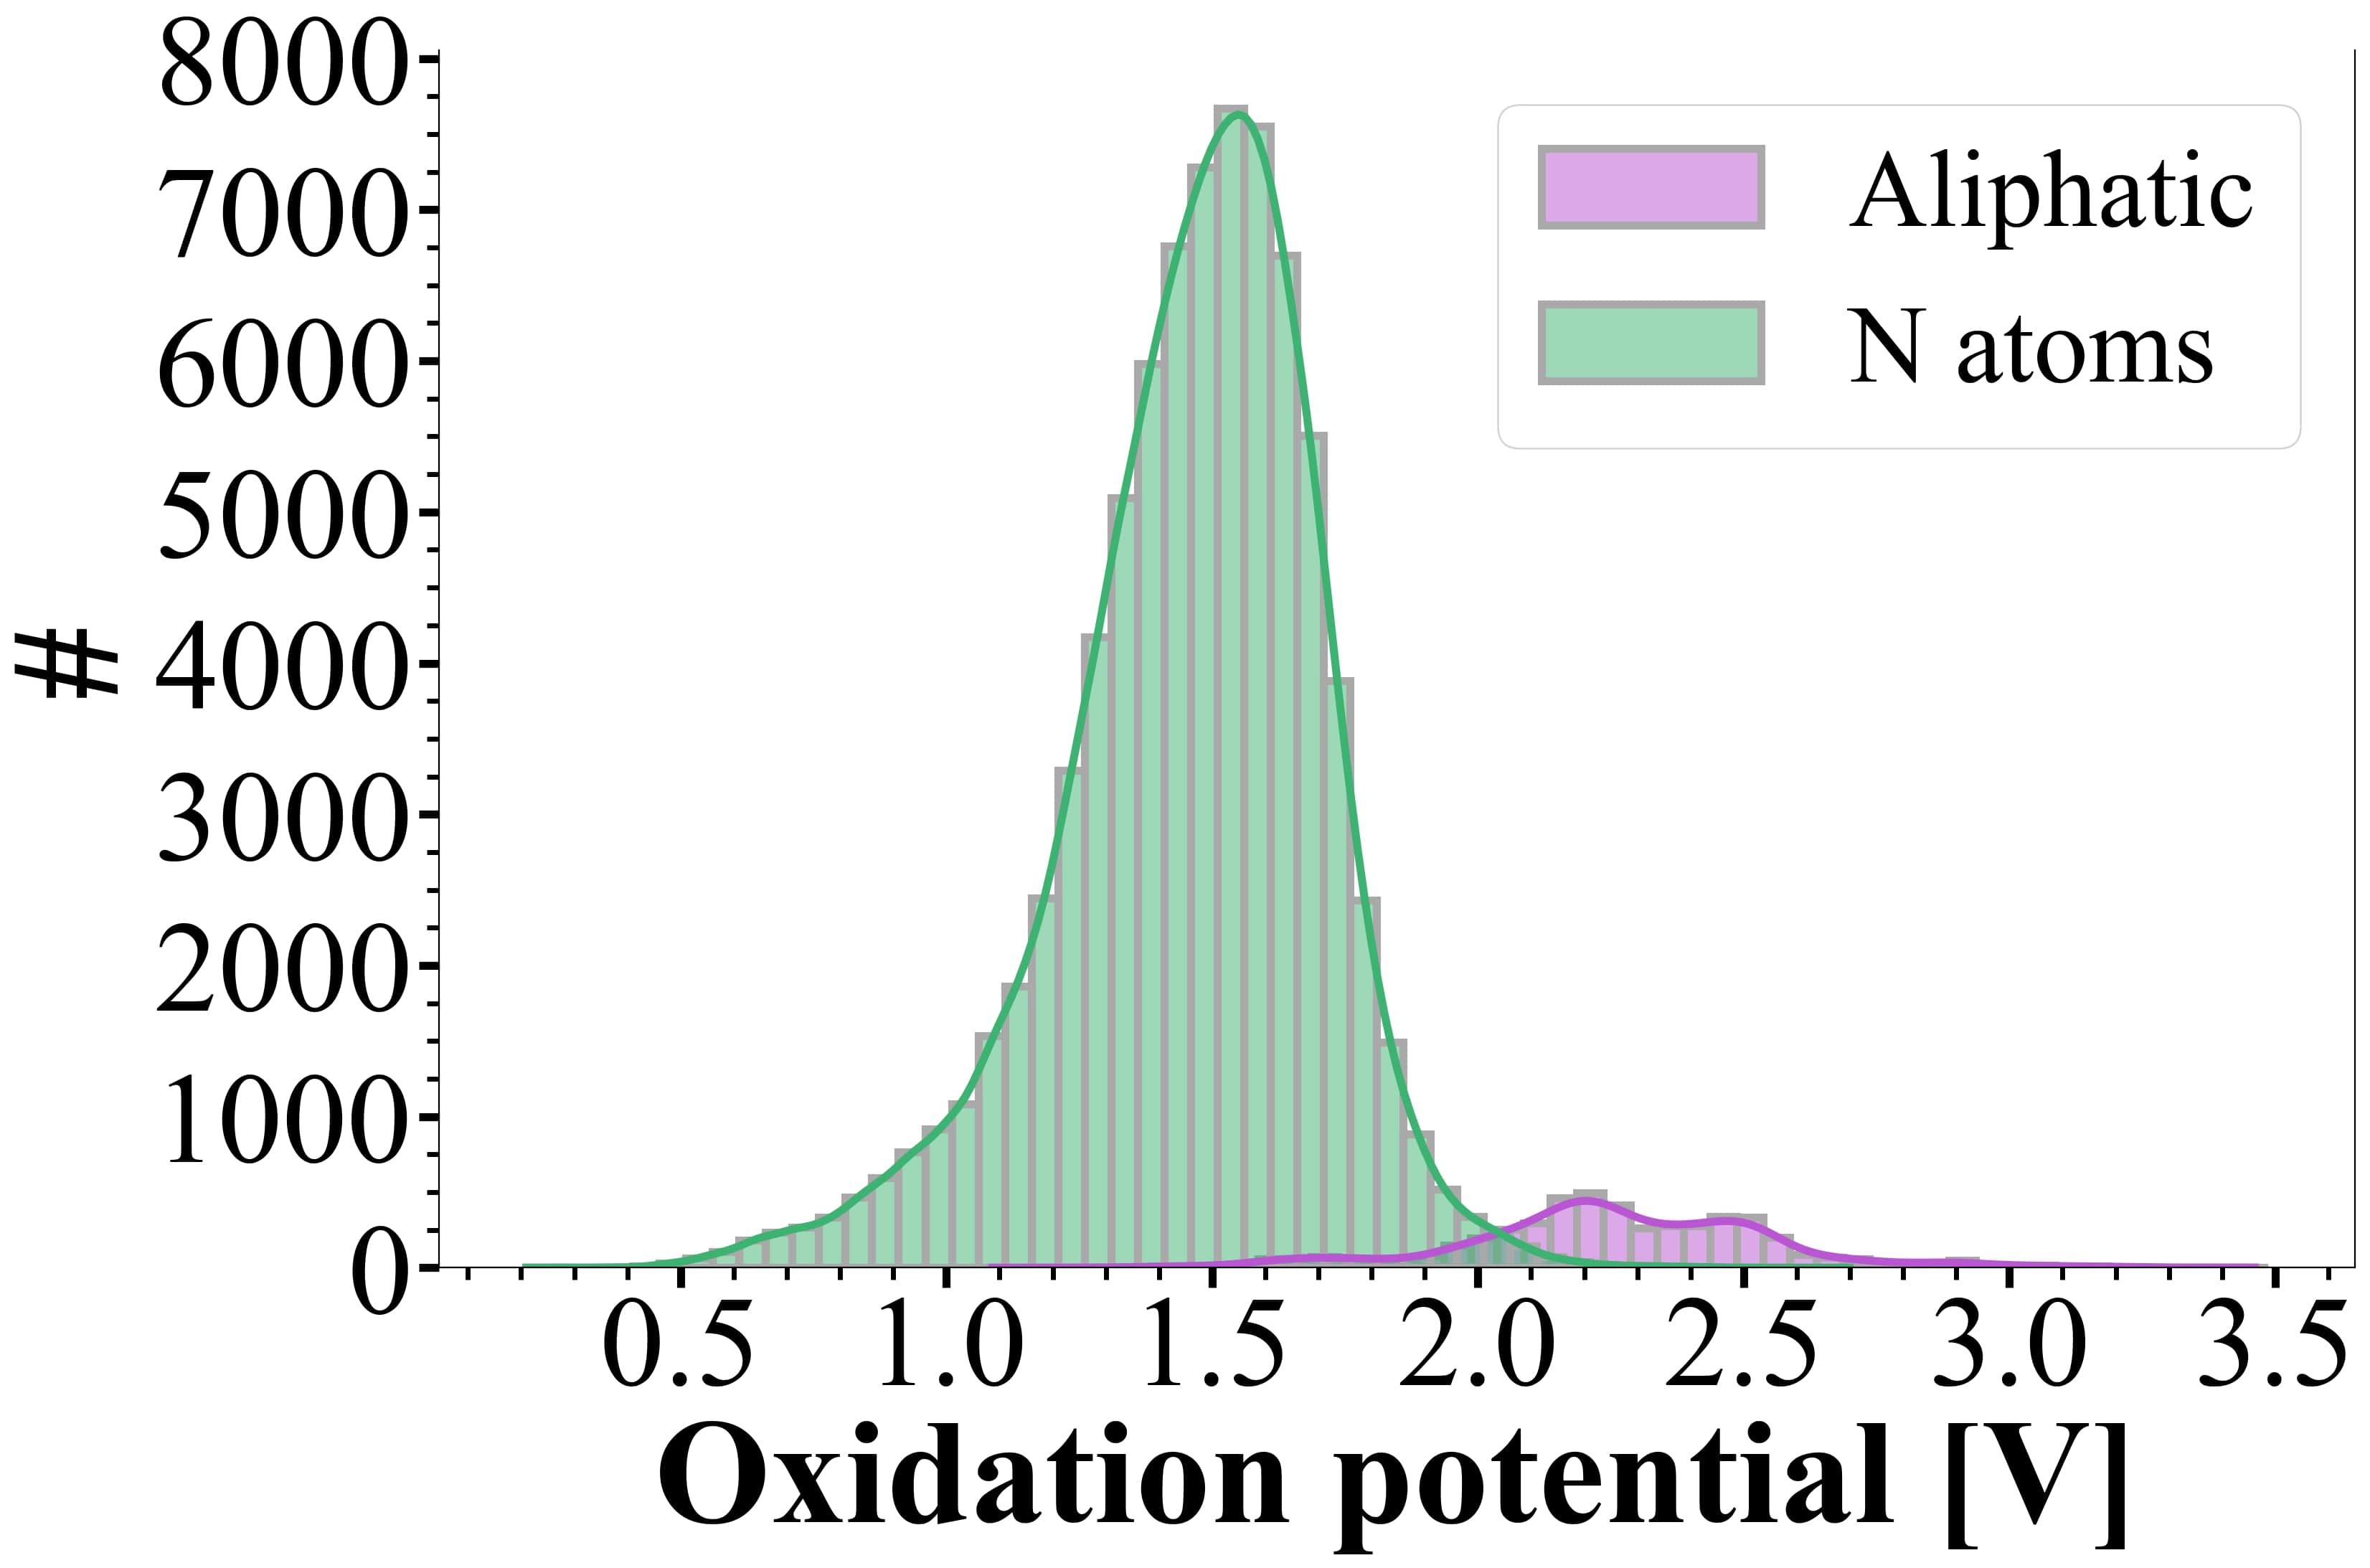
The geometries reported by the QM9 database were optimized in acetonitrile using XTB which were then used to generate the ACSF representations and inputted with the XTB-calculated values into the XGBR model, resulting in molecules in the QM9 database having oxidation potentials that follow a trimodal distribution, with two distinct peaks, and an average of 1.63 V (0.21–3.46 V) (Figure 7).
The oxidation potentials of the molecules are correlated with their corresponding XTB-estimated values of their HOMO-LUMO energy gaps (Figure 8) and solvation free energies calculated for single conformers (see Section G of Supplementary Information for hexbin plot of oxidation potentials and solvation free energies of QM9 molecules) in acetonitrile because these are two fundamental properties of a molecule that determine its propensity to accept or donate an electron, as well as its stability in a particular solvent.
There appears to be no obvious correlation between oxidation potentials and the two energy values, which may suggest that more data points encompassing a greater diversity of molecules are required for a clearer trend to emerge.
However, the samples in the scatter plots appear to be clustered in certain distributions, suggesting the presence of boundaries in chemical compound space in which small organic molecules can exist with certain combinations of oxidation potentials, HOMO-LUMO gaps, and solvation free energies.
Previous work has shown that the distribution of HOMO-LUMO gap energies of molecules in QM9 follows a multimodal distribution with peaks that correspond to sub-distributions based on simple structural features 81.
To determine if the peaks in the distribution of oxidation potentials in QM9 are similarly composed of sub-distributions, a frequency analysis of functional groups and specific atoms, degree of unsaturation, and molecular types was performed using SMILES strings and substructure matching as implemented in RDKit54 (see Section H of Supplementary Information for full frequency analyses of functional groups and atom types).
Intriguingly, upon visual inspection of the distributions, aliphatic molecules are clustered near the peaks at 2.0, 2.5 V (Figure 9a, 9b).
However, many molecules with other structural features contribute to the peak at 1.5 V, such as molecules containing halogens, aromatics rings, amines, amides, and carbonyl groups (see Section H of Supplementary Information for corresponding distribution plots). In particular, molecules containing nitrogens exhibit a unimodal distribution of their oxidation potentials with a peak at 1.5 V (Figure 9a). Other trends of note include near-linear increases in oxidation potentials of molecules with greater number of rings, carbons, hydroxyl groups, ethers, and hydrogens (see Section H of Supplementary Information for corresponding violin plots). There also appears to be near-linear decreases in oxidation potentials of molecules with greater numbers of aldehydes, ketones, carbon-oxygen double-bonds, larger degree of unsaturation, and number of heavy atoms, with the latter displaying a particularly prominent linear relationship (Figure 9c).
IV Conclusion
This work introduced an automated data-extraction pipeline involving a convolutional neural network for table detection and a large language model for the selective extraction of scientific information.
This pipeline was utilized to extract data from 74 peer-reviewed scientific publications listing tables of experimentally-measured oxidation potentials of organic molecules, resulting in a data set of 592 unique organic molecules, their canonical SMILES, generated XYZ-coordinates, and their oxidation potentials.
ML models that reach experimental uncertainty of 0.2 V were trained on this data set, which were subsequently used to estimate the true oxidation potentials of molecules with great discrepancies across multiple measurements and determine which measurements are more reliable.
Oxidation potentials of 132k small organic molecules in the QM9 data set were also estimated using the trained ML models and correlated with simple molecular descriptors.
This analysis suggests that the oxidation potentials of these molecules depend on the number of heavy atoms and chemical compositions, in particular aliphaticity and nitrogen content.
These results suggest that the automated data-extraction pipelines may serve accelerated discoveries of novel molecules and materials through self-driving labs82.
More specifically, rather than generating training data from scratch, analogous pipelines can be used to train ML models for initializing the experimental planning decisions necessary to launch iterative self-driving lab campaigns.
To this end, it could be desirable to develop a deeply-connected neural network, or another algorithmic model that can achieve higher table-detection accuracies, to limit data loss.
It might be worth investigating the incorporation of optical chemical structure recognition tools to improve a large language model’s ability to recognize as molecules the bond-line structure representations and drawings.
Further, it may be valuable to develop a large language model that is specifically trained to understand the semantics and jargon of various scientific disciplines to further improve the extraction of user-specified information.
V Supplementary Information
The supplementary information contains references of the literature sources from which data was extracted, and a table listing the samples’ SMILES and experimentally-measured oxidation potentials (V, vs. SCE). Generated xyz-coordinates of the extracted molecules and 132k molecules in QM9, optimized in acetonitrile solvent, are provided. Scatter plots of actual vs predicted oxidation potentials of the XGBoost and KRR models on various molecular representations are shown. For the fifty molecules with the largest measurement deviations across multiple studies, estimations of their true oxidation potentials and the experimental values closest to these estimates are listed. It also shows the molecules with the most positive and most negative oxidation potentials in the extracted data set, as well as for the molecules in the QM9 data set based on their ML-estimated oxidation potentials. Additionally, frequency analyses of the functional groups and atom types in QM9 molecules are displayed. Sample outputs from the CNN and the LLM are displayed. Moreover, Python code to construct the TableNet convolutional neural network for table detection and hyperparameters of the KRR trained on ACSF and XTB-calculated values are available.
Acknowledgements.
O.A.v.L. has received funding from the European Research Council (ERC) under the European Union’s Horizon 2020 research and innovation programme (grant agreement No. 772834). This project has received funding from the European Union’s Horizon 2020 research and innovation programme under grant agreement No. 957189. This research is part of the University of Toronto’s Acceleration Consortium, which receives funding from the Canada First Research Excellence Fund (CFREF). O.A.v.L. has received support as the Ed Clark Chair of Advanced Materials and as a Canada CIFAR AI Chair.References
- Akhter et al. [2019] S. Akhter, T. Pauyo, and M. Khan, Basic methods handbook for clinical orthopaedic research: a practical guide and case based research approach , 331 (2019).
- Ahn and Kang [2018] E. Ahn and H. Kang, Korean journal of anesthesiology 71, 103 (2018).
- Owens [2021] J. K. Owens, Nurse Author & Editor 31, 69 (2021).
- Büchter et al. [2020] R. B. Büchter, A. Weise, and D. Pieper, BMC medical research methodology 20, 1 (2020).
- Bornmann et al. [2021] L. Bornmann, R. Haunschild, and R. Mutz, Humanities and Social Sciences Communications 8, 1 (2021).
- Larsen and Von Ins [2010] P. Larsen and M. Von Ins, Scientometrics 84, 575 (2010).
- Hong et al. [2021] Z. Hong, L. Ward, K. Chard, B. Blaiszik, and I. Foster, JOM 73, 3383 (2021).
- Jordan and Mitchell [2015] M. I. Jordan and T. M. Mitchell, Science 349, 255 (2015).
- Foody et al. [2006] G. M. Foody, A. Mathur, C. Sanchez-Hernandez, and D. S. Boyd, Remote Sensing of Environment 104, 1 (2006).
- Hashmi et al. [2021] K. A. Hashmi, M. Liwicki, D. Stricker, M. A. Afzal, M. A. Afzal, and M. Z. Afzal, IEEE Access 9, 87663 (2021).
- Colter et al. [2022] Z. Colter, M. Fayazi, Z. Benameur-El Youbi, S. Kamp, S. Yu, and R. Dreslinski, Array 15, 100220 (2022).
- Paliwal et al. [2019] S. S. Paliwal, D. Vishwanath, R. Rahul, M. Sharma, and L. Vig, in 2019 International Conference on Document Analysis and Recognition (ICDAR) (IEEE, 2019) pp. 128–133.
- Göbel et al. [2013] M. Göbel, T. Hassan, E. Oro, and G. Orsi, in 2013 12th International Conference on Document Analysis and Recognition (IEEE, 2013) pp. 1449–1453.
- Islam et al. [2017] N. Islam, Z. Islam, and N. Noor, arXiv preprint arXiv:1710.05703 (2017).
- Smith [2007] R. Smith, in Ninth international conference on document analysis and recognition (ICDAR 2007), Vol. 2 (IEEE, 2007) pp. 629–633.
- Smith [2013] R. W. Smith, in Document Recognition and Retrieval XX, Vol. 8658 (SPIE, 2013) p. 865802.
- Memon et al. [2020] J. Memon, M. Sami, R. A. Khan, and M. Uddin, IEEE Access 8, 142642 (2020).
- Liu et al. [2022] J. Liu, Y. Chabot, R. Troncy, V.-P. Huynh, T. Labbé, and P. Monnin, Journal of Web Semantics , 100761 (2022).
- Zhao et al. [2023] W. X. Zhao, K. Zhou, J. Li, T. Tang, X. Wang, Y. Hou, Y. Min, B. Zhang, J. Zhang, Z. Dong, et al., arXiv preprint arXiv:2303.18223 (2023).
- Fan et al. [2023] L. Fan, L. Li, Z. Ma, S. Lee, H. Yu, and L. Hemphill, arXiv preprint arXiv:2304.02020 (2023).
- Flam-Shepherd et al. [2022] D. Flam-Shepherd, K. Zhu, and A. Aspuru-Guzik, Nature Communications 13, 3293 (2022).
- Grisoni [2023] F. Grisoni, Current Opinion in Structural Biology 79, 102527 (2023).
- Hocky and White [2022] G. M. Hocky and A. D. White, Digital discovery 1, 79 (2022).
- Jablonka et al. [2023] K. M. Jablonka, P. Schwaller, A. Ortega-Guerrero, and B. Smit, (2023), 10.26434/chemrxiv-2023-fw8n4.
- Fu et al. [2023] N. Fu, L. Wei, Y. Song, Q. Li, R. Xin, S. S. Omee, R. Dong, E. M. D. Siriwardane, and J. Hu, Machine Learning: Science and Technology 4, 015001 (2023).
- Swain and Cole [2016] M. C. Swain and J. M. Cole, Journal of chemical information and modeling 56, 1894 (2016).
- [27] OpenAI, “Introducing chatgpt,” .
- Eloundou et al. [2023] T. Eloundou, S. Manning, P. Mishkin, and D. Rock, arXiv preprint arXiv:2303.10130 (2023).
- OpenAI [2023] R. OpenAI, arXiv (2023).
- Koubaa [2023] A. Koubaa, (2023).
- Shen et al. [2023] Y. Shen, L. Heacock, J. Elias, K. D. Hentel, B. Reig, G. Shih, and L. Moy, “Chatgpt and other large language models are double-edged swords,” (2023).
- Zhong et al. [2020] F. Zhong, M. Yang, M. Ding, and C. Jia, Frontiers in Chemistry 8, 451 (2020).
- de la Cruz et al. [2020] C. de la Cruz, A. Molina, N. Patil, E. Ventosa, R. Marcilla, and A. Mavrandonakis, Sustainable Energy & Fuels 4, 5513 (2020).
- Cao et al. [2020] J. Cao, J. Tian, J. Xu, and Y. Wang, Energy & Fuels 34, 13384 (2020).
- Li et al. [2020] M. Li, Z. Rhodes, J. R. Cabrera-Pardo, and S. D. Minteer, Sustainable Energy & Fuels 4, 4370 (2020).
- Ramakrishnan et al. [2014] R. Ramakrishnan, P. O. Dral, M. Rupp, and O. A. Von Lilienfeld, Scientific data 1, 1 (2014).
- Marenich et al. [2014] A. V. Marenich, J. Ho, M. L. Coote, C. J. Cramer, and D. G. Truhlar, Physical Chemistry Chemical Physics 16, 15068 (2014).
- Baik and Friesner [2002] M.-H. Baik and R. A. Friesner, The Journal of Physical Chemistry A 106, 7407 (2002).
- Bachman et al. [2014] J. E. Bachman, L. A. Curtiss, and R. S. Assary, The Journal of Physical Chemistry A 118, 8852 (2014).
- Hruska et al. [2022] E. Hruska, A. Gale, and F. Liu, Journal of Chemical Theory and Computation 18, 1096 (2022).
- Zhang et al. [2017] J. Zhang, H. Zhang, T. Wu, Q. Wang, and D. van der Spoel, Journal of chemical theory and computation 13, 1034 (2017).
- Cramer et al. [1999] C. J. Cramer, D. G. Truhlar, et al., Chemical Reviews 99, 2161 (1999).
- Zhang and Xu [2020] Y. Zhang and X. Xu, Industrial & Engineering Chemistry Research 60, 343 (2020).
- Ghule et al. [2022] S. Ghule, S. R. Dash, S. Bagchi, K. Joshi, and K. Vanka, ACS omega 7, 11742 (2022).
- Wang and Cheng [2022] F. Wang and J. Cheng, The Journal of Chemical Physics 157, 024103 (2022).
- Allam et al. [2020] O. Allam, R. Kuramshin, Z. Stoichev, B. Cho, S. Lee, and S. Jang, Materials Today Energy 17, 100482 (2020).
- [47] “pytesseract — pypi.org,” https://pypi.org/project/pytesseract/.
- Huang et al. [2017] G. Huang, Z. Liu, L. Van Der Maaten, and K. Q. Weinberger, in Proceedings of the IEEE conference on computer vision and pattern recognition (2017) pp. 4700–4708.
- Fang et al. [2012] J. Fang, X. Tao, Z. Tang, R. Qiu, and Y. Liu, in 2012 10th IAPR International Workshop on Document Analysis Systems (IEEE, 2012) pp. 445–449.
- [50] “pdf2image — pypi.org,” https://pypi.org/project/pdf2image/.
- Elgrishi et al. [2018] N. Elgrishi, K. J. Rountree, B. D. McCarthy, E. S. Rountree, T. T. Eisenhart, and J. L. Dempsey, Journal of chemical education 95, 197 (2018).
- Lemm et al. [2021] D. Lemm, G. von Rudorff, and A. von Lilienfeld, “Leruli. com, online molecular property predictions in real time and for free,” (2021).
- Weininger [1988] D. Weininger, Journal of chemical information and computer sciences 28, 31 (1988).
- Landrum et al. [2013] G. Landrum et al., Greg Landrum 8, 31 (2013).
- Bannwarth et al. [2021] C. Bannwarth, E. Caldeweyher, S. Ehlert, A. Hansen, P. Pracht, J. Seibert, S. Spicher, and S. Grimme, Wiley Interdisciplinary Reviews: Computational Molecular Science 11, e1493 (2021).
- Grimme et al. [2017] S. Grimme, C. Bannwarth, and P. Shushkov, Journal of chemical theory and computation 13, 1989 (2017).
- Izutsu [2009] K. Izutsu, Electrochemistry in nonaqueous solutions (John Wiley & Sons, 2009).
- Inzelt et al. [2013] G. Inzelt, A. Lewenstam, and F. Scholz, Handbook of reference electrodes, Vol. 541 (Springer, 2013).
- Chen and Guestrin [2016] T. Chen and C. Guestrin, in Proceedings of the 22nd acm sigkdd international conference on knowledge discovery and data mining (2016) pp. 785–794.
- Ramakrishnan and von Lilienfeld [2017] R. Ramakrishnan and O. A. von Lilienfeld, Reviews in computational chemistry 30, 225 (2017).
- Huang et al. [2018] B. Huang, N. O. Symonds, and O. A. von Lilienfeld, arXiv preprint arXiv:1807.04259 (2018).
- Christensen et al. [2017] A. S. Christensen, F. Faber, B. Huang, L. Bratholm, A. Tkatchenko, K. Muller, and O. von Lilienfeld, URL https://github. com/qmlcode/qml (2017).
- [63] “sklearn.kernel_ridge.KernelRidge — scikit-learn.org,” https://scikit-learn.org/stable/modules/generated/sklearn.kernel_ridge.KernelRidge.html.
- Bergstra et al. [2013] J. Bergstra, D. Yamins, and D. Cox, in International conference on machine learning (PMLR, 2013) pp. 115–123.
- Behler [2011] J. Behler, The Journal of chemical physics 134, 074106 (2011).
- Moriwaki et al. [2018] H. Moriwaki, Y.-S. Tian, N. Kawashita, and T. Takagi, Journal of cheminformatics 10, 1 (2018).
- Bartók et al. [2013] A. P. Bartók, R. Kondor, and G. Csányi, Physical Review B 87, 184115 (2013).
- Huang and von Lilienfeld [2020] B. Huang and O. A. von Lilienfeld, Nature chemistry 12, 945 (2020).
- Musil et al. [2021] F. Musil, A. Grisafi, A. P. Bartók, C. Ortner, G. Csányi, and M. Ceriotti, Chemical Reviews 121, 9759 (2021).
- Himanen et al. [2020] L. Himanen, M. O. Jäger, E. V. Morooka, F. F. Canova, Y. S. Ranawat, D. Z. Gao, P. Rinke, and A. S. Foster, Computer Physics Communications 247, 106949 (2020).
- Ruddigkeit et al. [2012] L. Ruddigkeit, R. Van Deursen, L. C. Blum, and J.-L. Reymond, Journal of chemical information and modeling 52, 2864 (2012).
- Petersson et al. [1988] a. Petersson, A. Bennett, T. G. Tensfeldt, M. A. Al-Laham, W. A. Shirley, and J. Mantzaris, The Journal of chemical physics 89, 2193 (1988).
- Lee et al. [1988] C. Lee, W. Yang, and R. G. Parr, Physical review B 37, 785 (1988).
- Becke [1993] A. D. Becke, The Journal of Chemical Physics. doi: https://doi. org/10.1063/1.464913 (1993).
- Rajan et al. [2020] K. Rajan, A. Zielesny, and C. Steinbeck, Journal of Cheminformatics 12, 1 (2020).
- Rajan et al. [2021a] K. Rajan, A. Zielesny, and C. Steinbeck, Journal of Cheminformatics 13, 1 (2021a).
- Rajan et al. [2021b] K. Rajan, H. O. Brinkhaus, M. Sorokina, A. Zielesny, and C. Steinbeck, Journal of Cheminformatics 13, 1 (2021b).
- Amari [1993] S.-I. Amari, Neural networks 6, 161 (1993).
- Miller et al. [1972] L. L. Miller, G. Nordblom, and E. A. Mayeda, The Journal of Organic Chemistry 37, 916 (1972).
- Weinberg and Weinberg [1968] N. Weinberg and H. Weinberg, Chemical Reviews 68, 449 (1968).
- Mazouin et al. [2022] B. Mazouin, A. A. Schöpfer, and O. A. von Lilienfeld, Materials Advances 3, 8306 (2022).
- Abolhasani and Kumacheva [2023] M. Abolhasani and E. Kumacheva, Nature Synthesis , 1 (2023).