Self-supervised Multidimensional Scaling with -ratio: Improving Microbiome Visualization
Abstract
Multidimensional scaling (MDS) is an unsupervised learning technique that preserves pairwise distances between observations and is commonly used for analyzing multivariate biological datasets. Recent advances in MDS have achieved successful classification results, but the configurations heavily depend on the choice of hyperparameters, limiting its broader application. Here, we present a self-supervised MDS approach informed by the dispersions of observations that share a common binary label (-ratio). Our visualization accurately configures the -ratio while consistently preserving the global structure with a low data distortion compared to existing dimensionality reduction tools. Using an algal microbiome dataset, we show that this new method better illustrates the community’s response to the host, suggesting its potential impact on microbiology and ecology data analysis 1.
Keywords: Multidimensional scaling, microbiome, F-statistic, dimensionality reduction.
1 Introduction
Biotechnological advances in the past several decades have expanded the size and features of the multivariate data, necessitating a dimensionality reduction as a tool for the interpretation. By extracting an essential information from the biological data, the dimensionality reduction seeks a visual representation of the multivariate in a lower dimensional space. To retain a consistent data structure while performing the dimension reduction, a configuration is sought in a way that preserves dissimilarity between samples, a process called as the multidimensional scaling (MDS). Compared to other nonlinear methods in dimensionality reduction [21, 18, 22], MDS is known to retain a global structure and represent a long-range interaction between samples, allowing its popularity for a long time since its inception [8].
In the classical MDS, the configuration is determined in a way that minimizes the difference between the dissimilarity in the original and the lower dimensional space. Because biological observations often present a compositional structure (highly skewed, zero-inflated [11]), choosing an appropriate dissimilarity metric is an important step for processing the data and representing in the low dimensional space. For example, when interpreting a microbial community dataset such as 16S rRNA gene expression, a distance metric such as Unifrac [16, 17] allows to incorporate taxonomic information as well as the compositional structure.
Whereas the dimensionality reduction provides a qualitative interpretation on the multivariate data structure, statistical inference such as hypothesis testing is carried out at the same time to give a quantitative analysis on the structural difference by biological responses. One way to test the difference between response groups is to compare dispersions of the multivariate structure that are calculated across or within the sample groups, which gives an F-statistic[11]. The process employs a different information than those used for MDS, in that it is unsupervised learning method and does not use label information. Therefore, MDS configuration under a low dimension (e.g., 2) may not fully explain a small but statistically meaningful difference between groups of different treatment.
The insufficient explanation by the classical MDS encourages to revise the method and to address a structural hypothesis by including an external information which is conferred by the responses or class labels [10]. Broadly termed as the confirmatory MDS, this approach is based on applying an external constraint to the classical MDS, thereby providing a more contextual illustration of data structure [2]. Given that several local configurations can be produced from classical MDS, there is a notion accepting altered configurations up to a point where they do not deviate too much from the original configuration.
In these confirmatory MDS methods, an objective function is constructed by adding a confirmatory term to the stress, weighed by a hyperparameter, and informed by the labels or responses. These confirmatory MDS methods have successfully visualized the multivariate structure in a way that differentiates sample groups with a discriminative purpose [6, 24]. However, choosing a proper hyperparameter remains as a bottleneck towards a broader application of these inventive methods. For example, setting a high hyperparameter can result in an undesirable stress and a misleading configuration heavily distorted from the original.
In this work we introduce a weakly supervised version of MDS informed by F-statistic of multivariate dataset, which we refer to as FMDS. In other words, FMDS is informed by a hypothesis testing results under a binary class setting using -statistic. The proposed approach is motivated by a purpose to explain a statistical difference between groups, if any, and to incorporate it to the confirmatory analysis by combining with classical MDS configuration. Our motivation distinguishes itself from existing variations in confirmatory MDS because the method does not target to directly discriminate between groups. Furthermore, by characterizing the proposed framework we show that FMDS configuration is less dependent to the choice of the model hyperparameter, mediating the existing issue with the distortion.
2 Related Work
Classical multidimensional scaling:
Consider a balanced design where the number of total observations is , and each observation is -dimensional, pertaining to a set of labels for every . Using on the set of observations , a pairwise distance between and can be obtained using an appropriate distance metric (e.g., Euclidean, Bray-Curtis [4], UniFrac [16]). In the classical MDS, a lower-dimensional configuration is sought in a way that preserves the pairwise distance while the dimension is reduced. This is enabled by minimizing the “raw stress” [3]: . Therefore, the classical MDS is unsupervised learning and it does not require a set of labels for training.
Supervised multidimensional scaling [23]:
Supervised multidimensional scaling imposes an additional constraint to the configuration using a confirmatory feature that is informed by class labels. The purpose is to discriminate observations by the labels as well as carrying out the task of minimizing the stress. To achieve this an objective function is proposed by summing the raw stress and a confirmatory term,
| (1) |
where the confirmatory term contains labels so that the configuration points and are not too far apart when . In addition, a hyperparameter is chosen to determine the degree of classification task over the stress minimization.
Non-parametric multivariate analysis of variance:
When testing a difference between groups of multivariate data, test statistics are obtained through calculating variances or a sum of distances / dissimilarities. Most widely used metric is -statistic, a ratio between two sums respectively calculated from inter- and intra-group variances. However, performing -test necessitates an assumption that the observations follow a normal distribution with common variance, which is hardly met in practice when dealing with biological dataset. In this non-parametric context, an alternative approach has been proposed by permuting the labels iteratively to create an empirical distribution [1, 12]. First, define the pseudo -ratio as
| (2) |
where denotes an indicator function. While the pseudo does not always follow the -distribution under the non-parametric setting, an empirical distribution can be constructed instead by ‘permuting’ the labels for a large enough size of dataset [11, 1]. In other words, denote as a new -ratio that is obtained from the permuted labels, and by iterating the permutation to obtain a -value,
| (3) |
The procedure was first proposed by Anderson [1], known as the permutational multivariate analysis of variance (PERMANOVA).
3 Approach
We have set our goal to incorporate the multivariate hypothesis testing result for determining an MDS configuration of the dataset. To achieve the goal, we take a self-supervised approach with the following two steps. First, a two-dimensional configuration is trained by performing the classical MDS (i.e., unsupervised). Next, the configuration points are adjusted in a way that best represents a value calculated from the multivariate, binary-labeled dataset. This is enabled by adding a confirmatory term to the raw stress, a similar approach proposed by the supervised MDS [23],
| (4) |
where is a scalar function that maps -ratio from -dimension onto the lower dimension, 2, which is determined by the configuration . Introducing the mapping allows to address a difference in -ratio distributions between - and 2-dimension, thereby bridging a gap in the P values. A detailed derivation of and a description on the confirmatory term is provided in Supplementary Note 1, and its pseudocode is shown in Algorithm 1.
| : | two-dimensional configuration |
|---|---|
| : | pairwise distance matrix |
| : | labels set |
| : | mapping function |
|---|---|
| : | sorted list of permuted |
| : | sorted list of permuted |
3.1 Majorize-Minimization (MM) algorithm
Minimizing raw stress to perform MDS has been achieved by several iteration methods in the past few decades, part of which have originated in the field of graph drawing [13]. Because the stress is a non-convex function in terms of , there is no global minimum and it may require a different initialization [8, 26]. This has also led with proposing several optimization methods including 2D Newton–Raphson [13], (stochastic [26]) gradient descent [15], divide-and-conquer [25, 19], and majorization [7].
In our problem setting, we implemented the majorization (or Majorize-Minimization) approach to minimize the FMDS objective (Equation 4). In brief, for every , Equation 4 can be minimized by writing
| (5) | ||||
| (6) |
where we define and as
| (7) |
Majorizing with Equation 6 gives a quadratic expression in terms of , as similarly described by Borg [3] and Witten [23]. Finally, a derivative is analytically taken with respect to and is set to zero to find a local minimum, given that the expression is convex with assumptions. Detailed procedure is described in Supplementary note 2 and we provide the update rule in Algorithm 2.
| : | hyperparameter balancing raw stress and confirmatory term |
| : | pairwise distance matrix |
| : | labels |
| : | two-dimensional configuration |
4 Experiments
We first characterized the behavior of FMDS across a range of hyperparameters and compared its performance to benchmark dimensionality reduction methods, including supervised MDS [23], UMAP [18], and a self-supervised neural network such as SimCLR [5]. For the evaluation we considered two types of datasets, simulated and experimental, both of which serve as examples where the two-dimensional configurations from classical MDS were not consistent with the hypothesis testing results. Next, in Section 4.2, we demonstrate how FMDS can improve visualizing biological samples in a way that multivariate test results are addressed.
4.1 Evaluating performance of F-informed MDS
We evaluated the performance of FMDS by quantifying a degree of deviation of the configuration from the original distances . It is carried out by calculating two metrics; the first is the “normalized” stress or Stress-1 [3],
| (8) |
and the second using a Shepard diagram [9] and its correlation coefficient.
4.1.1 Simulated dataset
We first considered a three-dimensional dataset of two balanced groups that follow normal distributions slightly different in means, , , but the same covariance matrix . Such set of observations can be constructed as, for example,
| (9) |
where , , and .
Here the means are different at the third dimension, where the lowest variance was imposed among the principal diagonals of (Supplementary Figure 1). Therefore, a classical MDS does not distinguish groups in a two-dimensional configuration, but performing a multivariate hypothesis testing on the datasets, e.g., PERMANOVA [1], indicates there is a statistically significant difference between the groups with .
Using the simulated dataset, we measured the normalized stress (Equation 8) and correlation in Shepard diagram. Using Algorithm 2 we confirmed the configuration converged over a number of iterations for a range of hyperparameter up to , a value that ensured the confirmatory term in Equation 4 becomes negligible compared to MDS term (Figure 1).
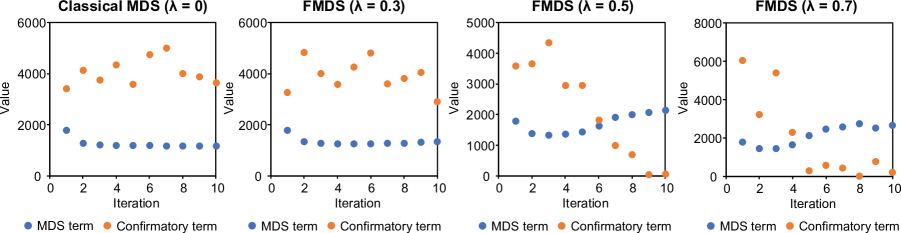
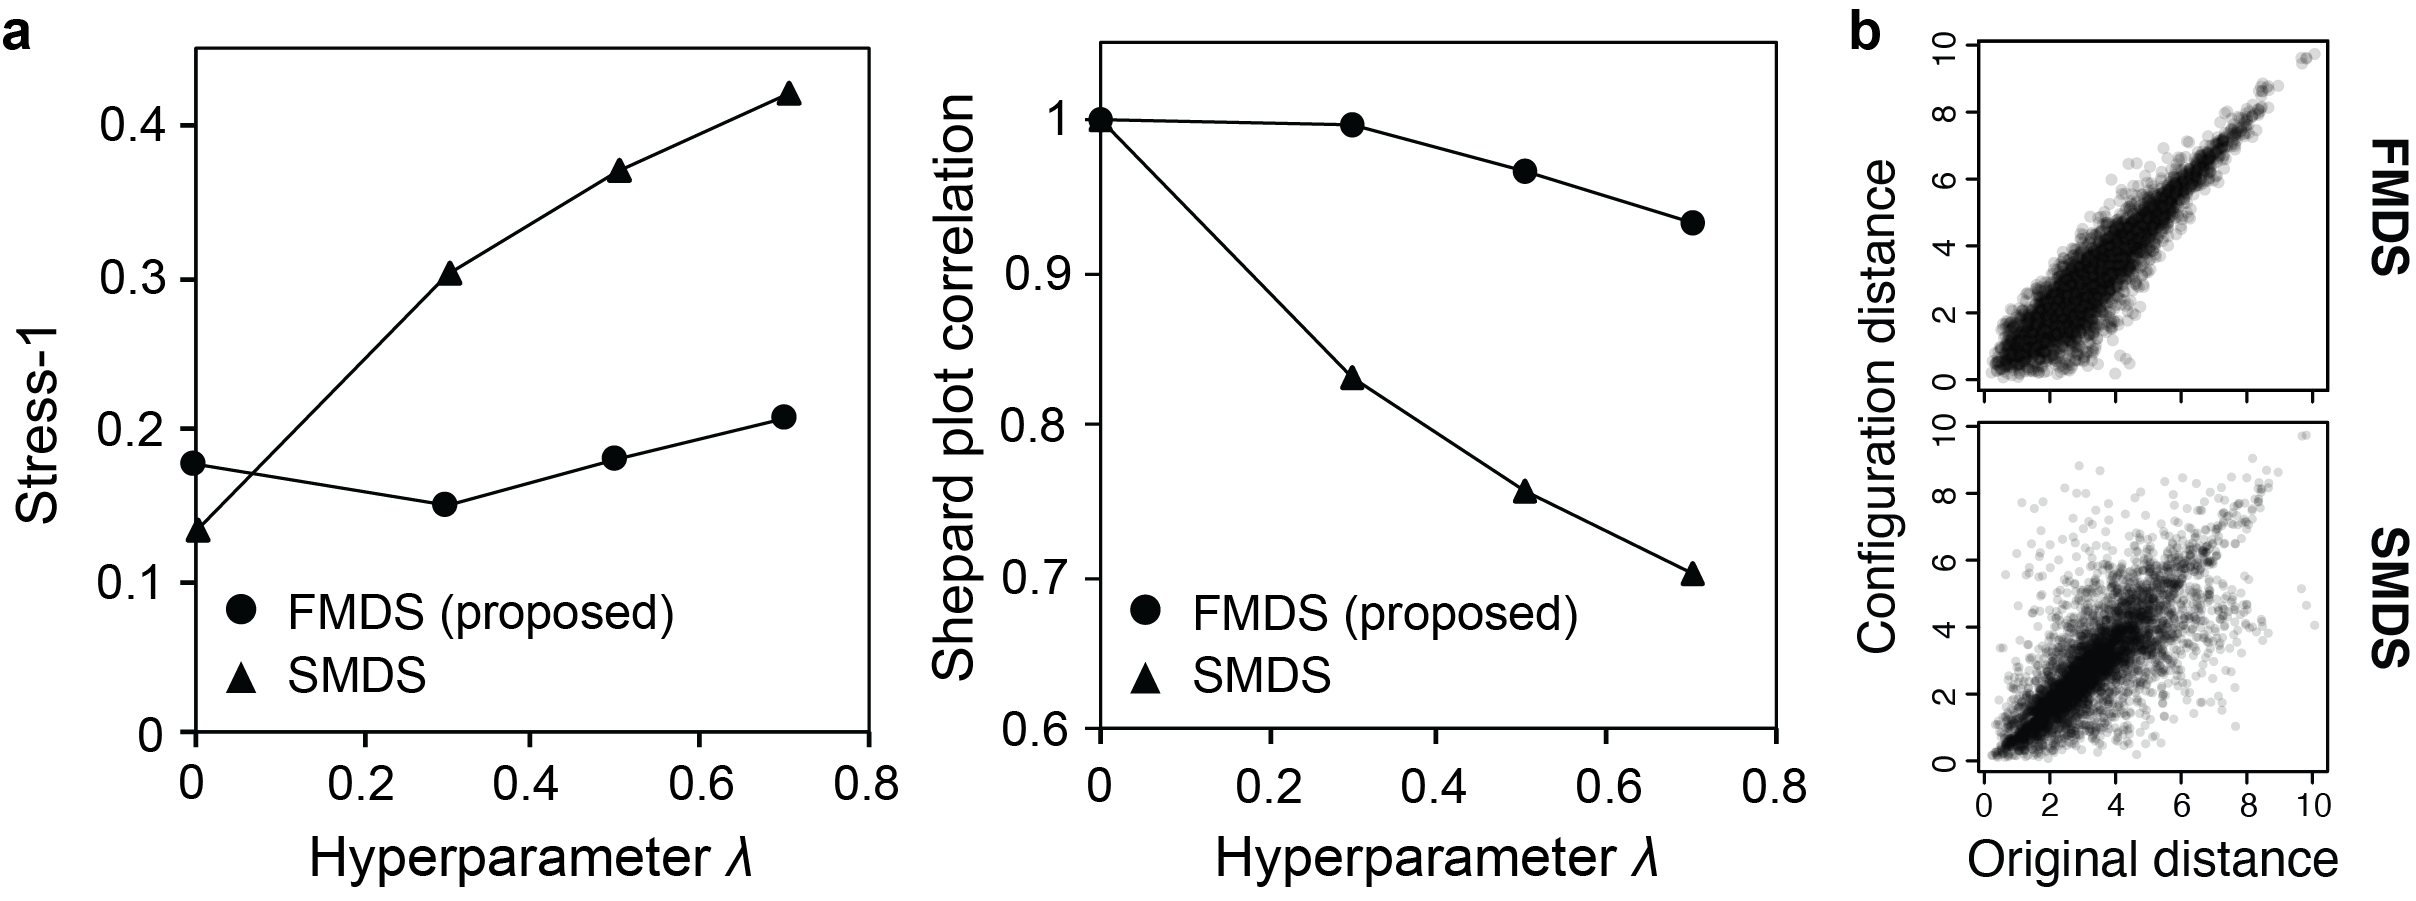
Figure 2 shows a summarized result of the performance of FMDS compared to existing MDS methods. Regardless of a choice of the hyperparameter , FMDS visualization exhibited a consistent performance with its stress and correlation coefficient (Figure 2a). The behavior is in contrast to the previous supervised MDS [23] which was monotonically dependent to , as expected, because SMDS distinguishes groups at the expense of the original distance structure. Overall, the stress obtained from the proposed MDS is consistently lower than those from SMDS. Similarly, as displayed in Figure 2b, Shepard plot shows the proposed FMDS presents a higher correlation of the sample pair distance in between the original and two-dimensional space.
We then compare the performance of FMDS to other dimensionality reductions such as UMAP [18], that are widely used in visualizing multivariate data. While UMAP does not employ the same hyperparameter as FMDS or SMDS, we evaluated its performance by varying the size of local neighborhood, used for manifold approximation, from 5 to 30. For a better comparison supervised learning mode with UMAP is also implemented. Table 1 shows the summarized result of performance by FMDS, SMDS, and UMAP with two different modes for the range of hyperparameters using simulated dataset. The result suggests the proposed FMDS produces a 2D configuration by imposing a consistently lower distortion of distance structure compared to other methods.
4.1.2 Microbial community
We next take a microbial community as another dataset to compare the performances of different dimensionality reductions. The dataset presents a compositional structure expressed by abundance of 16S rRNA gene of 72 bacterial taxa. As a distance metric, the weighted Unifrac [17] is chosen to obtain pairwise distance between individual community samples. We considered two datasets (Site 1 and Site 2) where each contains thirty-six, balanced community samples with a binary label (e.g., with or without a presence of bacterial host) [14].
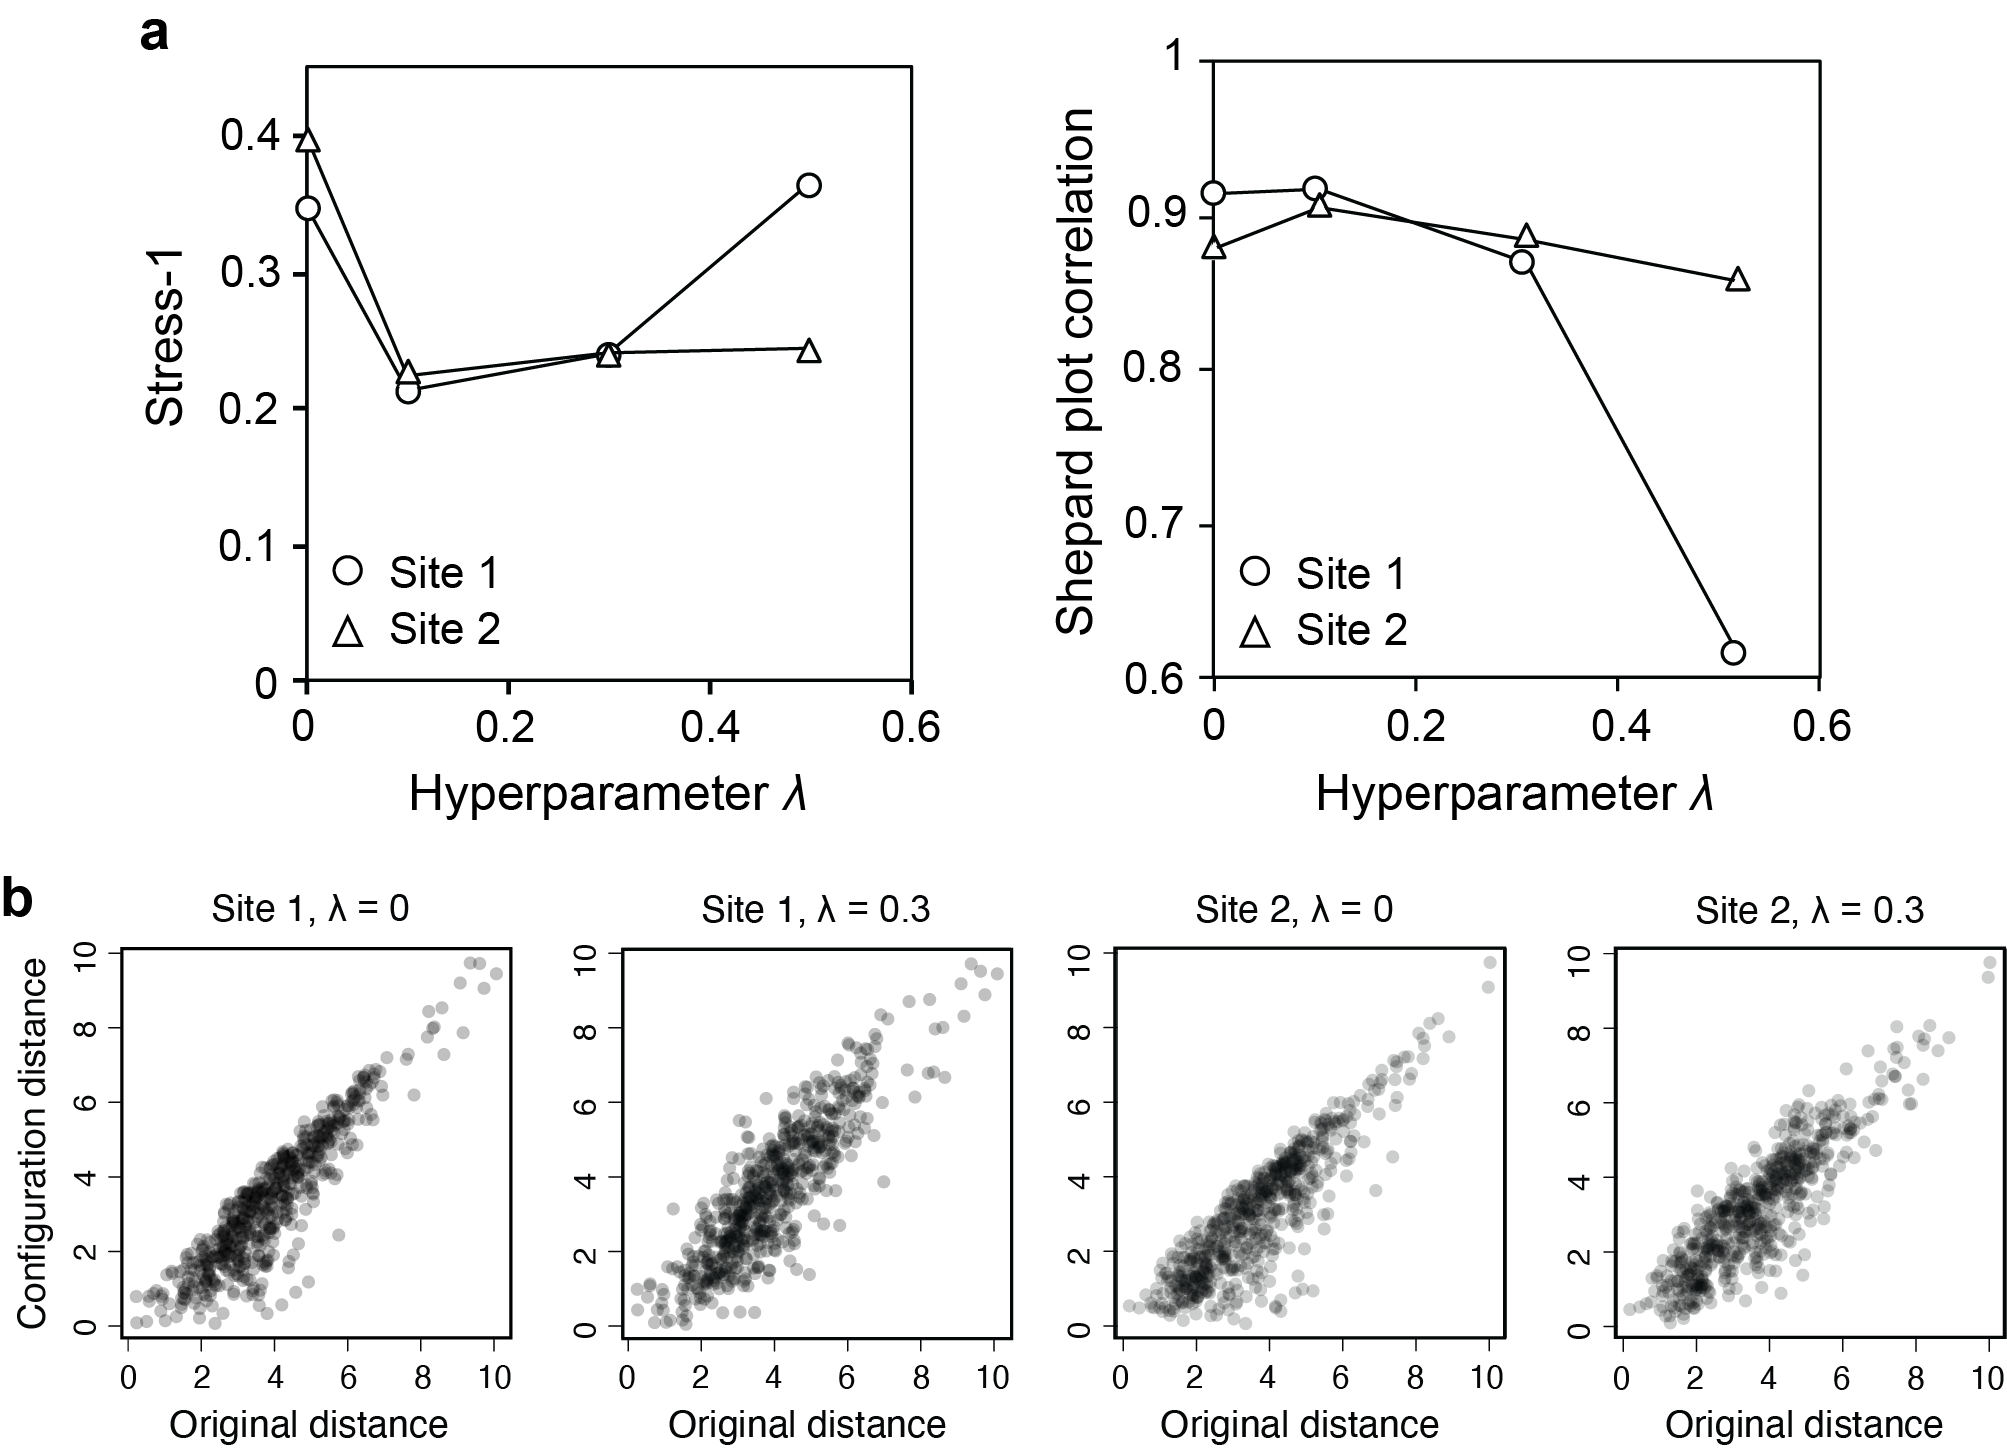
The performance of FMDS is evaluated by calculating Stress-1 and the Shepard plot visualization. Again we observe that FMDS configuration produced a low stress that is less dependent on the hyperparameter , which even decreases with nonzero (0.1, 0.3) than a classical MDS (Figure 3a). Shepard plot and Pearson correlation also show that the configurations nicely preserve the original distance in the microbial community data, except for a case when the largest = 0.5 is applied to Site 1 community dataset.
Self-supervised learning with SimCLR and PopPhy-CNN.
In addition to the above, we also sought to compare our FMDS with existing neural network models that are used for dimensionality reduction. For converting compositional microbial abundance with its phylogenetic information into a matrix, we implement PopPhy-CNN [20] architecture. In brief, the encoder consists of one Gaussian noise filter, two 2D convolution layers (with kernel size of 5 by 3), and one fully connected layer with 32 output nodes. For the self-supervised learning framework we choose SimCLR [5], where the data augmentation is performed by applying random brightness and contrast filter. In a pretraining step of SimCLR, a model is constructed by compiling encoder, projection head (two dense layers each of 32 output nodes), and one dense layer (10 output nodes). Site 1 and 2 datasets are merged and split into train and evaluation data (60, 12 each) for the pretraining step, resulting a linear probing accuracy of 53.3% after 50 training epochs. In the following finetuning step, the encoder is added with linear probe, which resulted in a validation accuracy of 83.3% after 50 epochs. Trained encoder is used to obtain a 32 nodes-sized feature for each microbial community sample in Site 1 and 2. Detailed parameters and steps for training / evaluating the neural network architecture is described in Supplementary note 3.
Performace evaluation of FMDS with other methods.
Table 2 shows the summarized performance of FMDS with microbiome dataset compared to existing dimensionality reduction methods (UMAP, neural network architecture). Again we observe that the proposed MDS delivers a two-dimensional configuration with less distorted distance structure when compared to self-supervised learning model (SimCLR) or supervised UMAP. Overall, the evaluation suggests that FMDS outperforms existing (self-) supervised learning tools by preserving the global structure in regards to the pairwise distances.
4.2 Discriminant analysis with FMDS
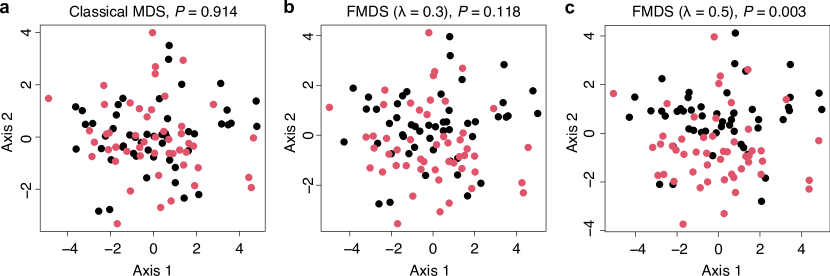
We next demonstrate how FMDS can handle two-dimensional configuration by addressing sample group difference. First, we consider the simulated dataset (Section 4.1.1) again where a classical MDS does not distinguish the binary groups in two-dimensional configuration () because the group difference lies in the third dimension which is not identifiable (Figure 4a). However, the group difference becomes more visible when FMDS is employed, as shown in Figure 4b,c. The distinctions are also verified by a low -value resulting from PERMANOVA test using the two-dimensional configurations ().
Bacterial community dataset.
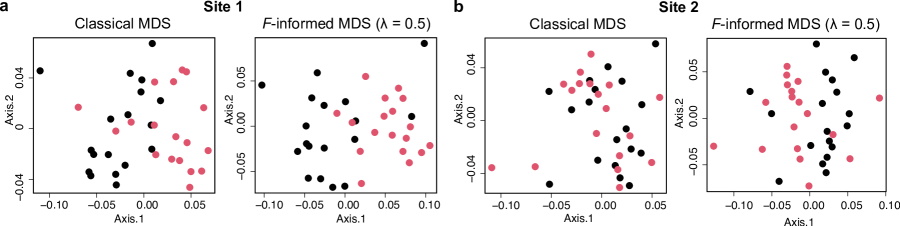
Finally, we demonstrate how FMDS visualization can improve interpreting microbiome structure while addressing -test results at the same time. Our datasets, Site 1 and 2, present a unique case where a classical two-dimensional MDS does not fully explain statistical test results on group differences. As shown in Figure 5a, groups in site 1 are dispersed in a different location whereas site 2 groups are not, when visualized using the classical MDS. In both Sites, however, moderately small -values are obtained (, Table 3), indicating the group difference in the community structure is, in fact, statistically significant.
We then visualize the microbiome data using classical and FMDS and compare the configurations. As expected, for Site 1 community samples the configuration retains its distinction between the class labels regardless of the choice of the hyperparameter (Figure 5). Moreover, for Site 2 samples we observe a higher distinction between the groups with increasing when compared to classical MDS (Figure 5b, Supplementary Figure 3). The observation with the visualizations is justified by a quantitative measure using -value calculated on the 2D configurations (Table 3).
| -value | Site 1 | Site 2 |
|---|---|---|
| Original | 0.001 | 0.093 |
| Classical MDS | 0.001 | 0.05 |
| FMDS () | 0.001 | 0.099 |
5 Conclusion
In this work, a self-supervised multidimensional scaling is proposed based on the F-statistic and is characterized by comparing the configuration to hypothesis testing results. Using simulated dataset and ecological samples, it is shown that the proposed MDS outperforms an existing method for addressing class labels, as evaluated by its stress and Shepard plot. One limitation of FMDS is that it requires a high computational cost compared to existing methods, in its algorithmic performance during iterations (Supplementary note 4).
A special attention has been given on its behavior where its performances were less dependent on the choice of hyperparameter to an extent where algorithm effectively converges. The finding suggests that the new approach mediates the downside of typical confirmatory MDS as a dimensionality reduction tool, in which stress minimization has been underscored by a discriminatory purpose via a high value of hyperparameter setting. In practice, users may avoid the hassle of hyperparameter selection using such as cross-validation.
Taken together, The proposed MDS can be useful for interpreting a biological dataset with more visual information to explain a hypothesis testing result at the same time, thereby presenting a broader applicability of MDS in modern biological and multivariate data analysis.
Acknowledgements
The work was supported by the Department of Energy’s Genome Sciences Program grant SCW1039. H.K. was partly supported by the Kwanjeong Educational Foundation. S.K. was partly supported by Global Korea Scholarship (GKS).
References
- [1] Anderson, M. J. A new method for non-parametric multivariate analysis of variance. Austral Ecology 26, 1 (2001), 32–46.
- [2] Borg, I., and Groenen, P. Confirmatory MDS. Springer New York, New York, NY, 1997, pp. 181–197.
- [3] Borg, I., and Groenen, P. MDS Models and Measures of Fit. Springer New York, New York, NY, 2005, pp. 37–61.
- [4] Bray, J. R., and Curtis, J. T. An ordination of the upland forest communities of southern wisconsin. Ecological Monographs 27, 4 (1957), 325–349.
- [5] Chen, T., Kornblith, S., Norouzi, M., and Hinton, G. A simple framework for contrastive learning of visual representations. In Proceedings of the 37th International Conference on Machine Learning, vol. 119, Proceedings of Machine Learning Research, pp. 1597–1607.
- [6] Cox, T. F., and Ferry, G. Discriminant analysis using non-metric multidimensional scaling. Pattern Recognition 26, 1 (1993), 145–153.
- [7] de Leeuw, J. Convergence of the majorization method for multidimensional scaling. Journal of Classification 5, 2 (1988), 163–180.
- [8] Demaine, E., Hesterberg, A., Koehler, F., Lynch, J., and Urschel, J. Multidimensional scaling: Approximation and complexity, September 01, 2021 2021.
- [9] Dexter, E., Rollwagen-Bollens, G., and Bollens, S. M. The trouble with stress: A flexible method for the evaluation of nonmetric multidimensional scaling. Limnology and Oceanography: Methods 16, 7 (2018), 434–443.
- [10] Ding, C. S. Testing Pattern Hypotheses with MDS. Springer International Publishing, Cham, 2018, pp. 165–173.
- [11] Gijbels, I., and Omelka, M. Testing for homogeneity of multivariate dispersions using dissimilarity measures. Biometrics 69, 1 (2013), 137–145.
- [12] Holmes, A. P., Blair, R. C., Watson, J. D., and Ford, I. Nonparametric analysis of statistic images from functional mapping experiments. Journal of Cerebral Blood Flow & Metabolism 16, 1 (1996), 7–22.
- [13] Kamada, T., and Kawai, S. An algorithm for drawing general undirected graphs. Information Processing Letters 31, 1 (1989), 7–15.
- [14] Kim, H., Kimbrel, J. A., Vaiana, C. A., Wollard, J. R., Mayali, X., and Buie, C. R. Bacterial response to spatial gradients of algal-derived nutrients in a porous microplate. The ISME Journal 16, 4 (2022), 1036–1045.
- [15] Kruskal, J. B. Nonmetric multidimensional scaling: A numerical method. Psychometrika 29, 2 (1964), 115–129.
- [16] Lozupone, C., and Knight, R. Unifrac: a new phylogenetic method for comparing microbial communities. Applied and Environmental Microbiology 71, 12 (2005), 8228–35.
- [17] Lozupone, C. A., Hamady, M., Kelley, S. T., and Knight, R. Quantitative and qualitative beta diversity measures lead to different insights into factors that structure microbial communities. Applied and Environmental Microbiology 73, 5 (2007), 1576–85.
- [18] McInnes, L., Healy, J., and Melville, J. UMAP: Uniform manifold approximation and projection for dimension reduction, February 2018.
- [19] Qu, T., and Cai, Z. A fast multidimensional scaling algorithm. In 2015 IEEE International Conference on Robotics and Biomimetics (ROBIO), pp. 2569–2574.
- [20] Reiman, D., Metwally, A. A., Sun, J., and Dai, Y. Popphy-cnn: A phylogenetic tree embedded architecture for convolutional neural networks to predict host phenotype from metagenomic data. IEEE Journal of Biomedical and Health Informatics 24, 10 (2020), 2993–3001.
- [21] Tenenbaum, J. B., de Silva, V., and Langford, J. C. A global geometric framework for nonlinear dimensionality reduction. Science 290, 5500 (2000), 2319–23.
- [22] van der Maaten, L., and Hinton, G. Visualizing data using t-sne. Journal of Machine Learning Research 9, 86 (2008), 2579–2605.
- [23] Witten, D. M., and Tibshirani, R. Supervised multidimensional scaling for visualization, classification, and bipartite ranking. Computational Statistics & Data Analysis 55, 1 (2011), 789–801.
- [24] Yang, F., Yang, W., Gao, R., and Liao, Q. Discriminative multidimensional scaling for low-resolution face recognition. IEEE Signal Processing Letters 25, 3 (2018), 388–392.
- [25] Yang, T., Liu, J., McMillan, L., and Wang, W. A fast approximation to multidimensional scaling. In Proceedings of the ECCV Workshop on Computation Intensive Methods for Computer Vision (CIMCV).
- [26] Zheng, J. X., Pawar, S., and Goodman, D. F. M. Graph drawing by stochastic gradient descent. IEEE Transactions on Visualization and Computer Graphics 25, 9 (2019), 2738–2748.