GOALS-JWST: Gas Dynamics and Excitation in NGC 7469 revealed by NIRSpec
Abstract
We present new JWST-NIRSpec IFS data for the luminous infrared galaxy NGC 7469: a nearby (70.6 Mpc) active galaxy with a Sy 1.5 nucleus that drives a highly ionized gas outflow and a prominent nuclear star-forming ring. Using the superb sensitivity and high spatial resolution of the JWST instrument NIRSpec-IFS, we investigate the role of the Seyfert nucleus in the excitation and dynamics of the circumnuclear gas. Our analysis focuses on the [Fe ii], H2, and hydrogen recombination lines that trace the radiation/shocked-excited molecular and ionized ISM around the AGN. We investigate the gas excitation through H2/Br and [Fe ii]/Pa emission line ratios and find that photoionization by the AGN dominateswithin the central 300 pc of the galaxy and together with a small region showing signatures of shock-heated gas; these shock-heated regions are likely associated with a compact radio jet. In addition, the velocity field and velocity dispersion maps reveal complex gas kinematics. Rotation is the dominant feature, but we also identify non-circular motions consistent with gas inflows as traced by the velocity residuals and the spiral pattern in the Pa velocity dispersion map. The inflow is consistent with the mass outflow rate and two orders of magnitude higher than the AGN accretion rate. The compact nuclear radio jet has enough power to drive the highly ionized outflow. This scenario suggests that the inflow and outflow are in a self-regulating feeding-feedback process, with a contribution from the radio jet helping to drive the outflow.
1 Introduction
Luminous infrared galaxies (LIRGs) are systems with high infrared luminosities () that, in the nearby universe, are mostly major mergers (Sanders & Mirabel, 1996). These galaxies host extreme environments where both starburst and nuclear activity play a significant role in shaping their evolution (e.g. Hekatelyne et al., 2020). Spatially resolved studies show that the gas excitation in LIRGs and their ultraluminous counterparts (ULIRGs, ) is governed by a mixture of processes typical of active galactic nuclei (AGN, sometimes hidden behind large amounts of dust with up to ; U et al., 2019; Pérez-Torres et al., 2021), star-forming regions, and shocked gas (e.g. Rich et al., 2015; Hekatelyne et al., 2020).
The gas dynamics in (U)LIRGs are often heavily impacted by the interaction with other galaxies, the presence of AGNs and/or Starbursts. Evidence for this comes from the detection of outflows on a variety of physical scales and gas phases: cold (Feruglio et al., 2010; Xu et al., 2014; Veilleux et al., 2017; Falstad et al., 2018; Barcos-Muñoz et al., 2018; Lutz et al., 2020; Pereira-Santaella et al., 2020) and hot molecular gas (U et al., 2013, 2019; Medling et al., 2015; Riffel et al., 2020; Motter et al., 2021), as well as moderately- (Rich et al., 2012, 2014; Arribas et al., 2014; Rich et al., 2015; Robleto-Orús et al., 2021; Xu & Wang, 2022) and highly-ionized gas (Rodríguez-Ardila et al., 2006; Müller-Sánchez et al., 2011; U et al., 2022; Armus et al., 2023) and neutral gas (Rupke & Veilleux, 2011; Morganti et al., 2016; Su et al., 2023). Streaming motions, such as gas inflows, toward the nuclear regions of ULIRGs have also been detected in some sources (Hekatelyne et al., 2018; Medling et al., 2019; Aalto et al., 2019; González-Alfonso et al., 2021). These inflows may act in providing the fuel necessary to trigger and feed the AGN.
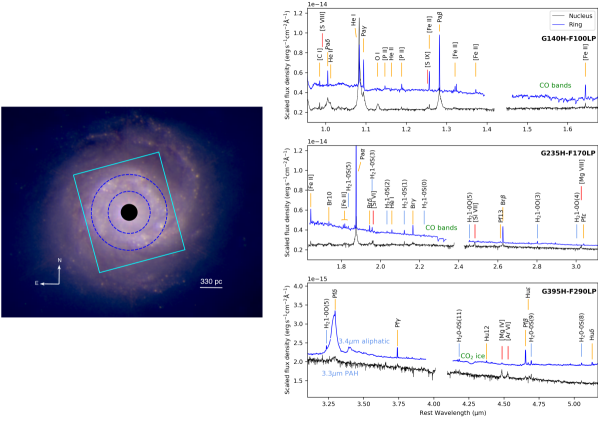
NGC 7469 is an active galaxy hosting a Seyfert 1.5 nucleus (Landt et al., 2008) located at 70.6 Mpc () with a (R’)SAB(rs)a morphology (de Vaucouleurs et al., 1991). The central kiloparsec region of NGC 7469 shows a bright AGN surrounded by a star-forming ring (e.g. Davies et al., 2004; Díaz-Santos et al., 2007; Song et al., 2021). The ring has inner and outer radii of 330 pc and 616 pc (see Fig. 1) with a bimodal stellar population as seen from HST imaging (Díaz-Santos et al., 2007) with a star formation rate of M⊙yr-1 estimated from the radio continuum (Song et al., 2021) consistent with M⊙yr-1 estimated from the recombination, [Neii], and [Neiii] (Lai et al., 2022). JWST NIRCam (Rieke et al., 2023) and MIRI (Bouchet et al., 2015) imaging reveal previously undetected embedded stellar clusters with colors that suggest stellar ages of Myr (Bohn et al., 2023). The H2/PAH ratio, which measures the excess H2 relative to PAHs, is within the range of values from normal photo-dissociation models implying that the ring is not currently being affected by AGN feedback (Lai et al., 2022).
NGC 7469 hosts a nuclear outflow traced by highly ionized gas as evidenced in the JWST MIRI MRS observations (U et al., 2022; Armus et al., 2023) and in the Near-IR via the [Si vi]m line emission line (Müller-Sánchez et al., 2011). This outflow has an extent of 400 pc and affects mostly the region located between the nucleus and the ring, referred to as the inner interstellar medium (inner-ISM). The outflow has a stratified and decelerating structure as evidenced by highly blueshifted wings on the coronal emission lines (Armus et al., 2023). The warm molecular gas shows enhanced velocity dispersion to the northwest of the central AGN, suggestive of the presence of shocked gas (U et al., 2022). Considering the richness of physical phenomena in its inner kiloparsec region, NGC 7469 is an ideal target to investigate the AGN–starburst–ISM interaction.
In this Letter, we report the morphology, kinematics, and excitation of the ionized atomic and hot ( K) molecular gas in the central region of NGC 7469 as observed by JWST (Rigby et al., 2023, and references therein) with the NIRSpec instrument in its integral field spectroscopy (IFS) mode. We describe the observations and data reduction in Section 2 and our results in Section 3. We discuss the kinematics and gas excitation in Section 4 and present our conclusions in Section 5.
2 Data
2.1 JWST-NIRSpec Observations
NGC 7469 was observed with the NIRSpec IFS (Böker et al., 2022; Jakobsen et al., 2022) on July 19th 2022 UT as part of the JWST Director Discretionary Time Early Release Science (DD-ERS) program (PID: 1328, PIs Lee Armus & Aaron Evans). We employed NIRSpec in the high resolution mode () in three grating/filter combinations — G140H/F100LP, G235H/F170LP, G395H/F290LP — covering the wavelength range of 0.97 to 5.27m with a nominal field of view (FoV) of ″ (see Figure 1). In order to fully cover the star-forming ring ( across), we used the large cycling four-point dither pattern, which provides a FoV of corresponding to kpc2 at the distance of NGC 7469 (Fig. 1). For extended targets, MSA leakage correction (leakcal) exposures are necessary to account for the leakage from the permanently open micro-shutters. While observing NGC 7469, we used the same dither pattern for the leakcals as we did for the science observations. The science exposure times in each grating/filter combination is 817 s and the total observing time, including the leakcals and overheads, is 10.5 ks.
2.2 Data reduction
We reduce the level-1 data downloaded from MAST using the JWST pipeline version 1.8.3 (Bushouse et al., 2022) in batch mode. The reference files follow the context version jwst_12027.pmap. The first reduction step is Detector1, which generates rate files with detector level correction applied to them. Both science and leakage calibration files are processed at the Detector1 step. The second reduction step for spectroscopic data is Spec2, which applies the distortion, wavelength, and flux calibrations, and other 2D corrections to the science data, including the leakage subtraction.
The outlier rejection algorithm is not efficient in the current version of the pipeline. Most of the outliers have fluxes higher than the typical flux of the brighter emission lines or show negative flux values. We optimized the outlier rejection by flagging spectral pixels that showed clear contamination in the calibrated science frames (Brian Welsh, private communication). These corrected frames are then fed to the last reduction step Spec3 that builds the data cubes by combining individual exposures taken at each dither position. We obtain three data cubes corresponding to each grating and filter combination: G140H/100LP, G235H/170LP and G395H/290LP.
In order to correct the pipeline-processed cubes for astrometry we adopt the peak of the continuum in each cube as the position of the nucleus. We then modify the NIRSpec-IFS data cube headers to align with the continuum peak of CH1-short MIRI-MRS cube. Our final datacubes have a spatial resolution of at 1.9m, allowing us to resolve structures down to pc.
3 Analysis and results
The right panels of Fig. 1 show two spectra extracted from the nucleus ( radius, in black) and from the star-forming ring ( radii, in blue) in NGC 7469. In the nuclear spectrum, we detect prominent emission from the Hydrogen (H) recombination lines, particularly broad components in the Paschen series, and permitted lines such as O i and He ii. This broad component may be associated with the broad line region (BLR) of AGNs and is typical of type 1 sources. The nuclear spectrum also features coronal lines such as in [Si vii] and [Mg viii] with blueshifted profiles, similar to observations of higher ionization coronal lines from Armus et al. (2023), indicative of gas outflows. Narrow lines such as [Fe ii], H2 , and the PAH band at 3.3m are only weakly detected. The strong continuum radiation from the AGN might be the cause for the reduced equivalent width of these lines at the nucleus. On the other hand, PAH features and CO absorption bands are featured prominently in the ring spectrum, while coronal lines and the broad component of the H recombination lines disappear. We also see other ionized gas species such as [P ii] and [Fe ii], as well as various H2 transitions in the ring. For the present paper, we focus our analysis on a subset of the emission lines observed (i.e. [Fe ii], H2, and the H i lines) in order to highlight the conditions of the multiphase ISM. A companion paper (Lai et al., 2023) will present a more detailed analysis of the properties of dust grains found in this data set using the m PAH and m aliphatic features.
Due to the under-sampling of the point spread function (PSF) in the NIRSpec IFS mode, the per-spaxel spectra in the nuclear region exhibit a wiggly pattern that is different from the fringes characteristic of 1d spectra extracted from MRS data. To mitigate this effect, we use a spectrum averaged over an aperture with a radius of as representative of the nuclear region. The chosen aperture size is motivated by the size of the PSF of at 1.9m (Wylezalek et al., 2022).
In order to obtain emission line moment maps, we use the Python package IFSCUBE (Ruschel-Dutra & Dall’Agnol De Oliveira, 2020; Ruschel-Dutra et al., 2021) to fit the emission lines of interest and with Gaussian functions and underlying continuum with a polynomial function in each spaxel of the data cube. We fit a broad component ( km s-1 at systemic velocity), typical of Type 1 AGNs, and a narrow component to the hydrogen recombination lines. A single narrow component is enough to reproduce the emission line profiles of the forbidden and molecular hydrogen lines. A third-degree polynomial reproduced the underlying continuum at the gratings G140H and G235H. The fitting in each grating is performed independently, but within each grating, we tie the systemic velocity and velocity dispersion of the lines that trace the same gas phase.
3.1 Flux and Line Ratios
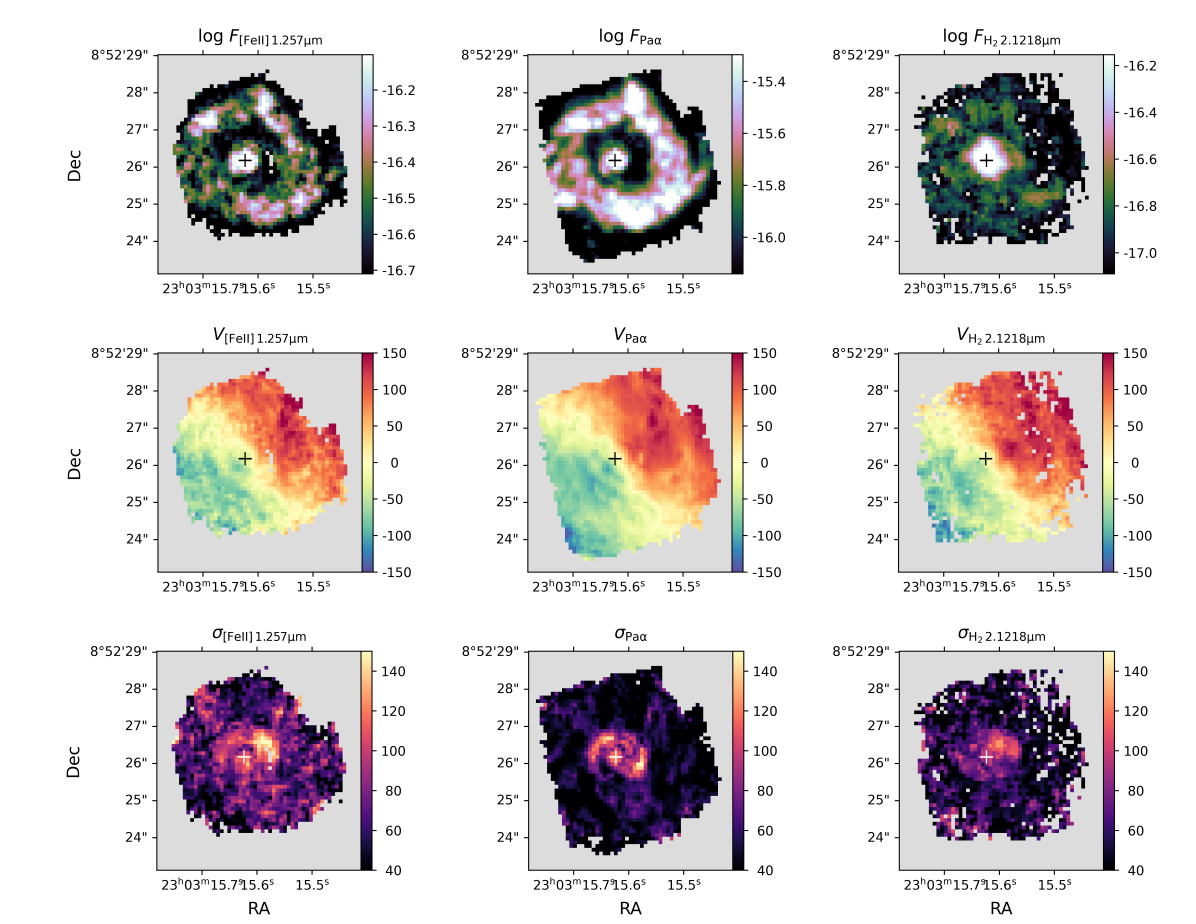
The resulting moment maps from our spectral fitting procedure for three emission lines representative of the atomic ionized — [Fe ii] m and Pa— and the molecular gas — H2 m — phases are shown in Figure 2. Both [Fe ii] and Pa have low ionization potentials, with IP = 7.9 eV and 13.6 eV, respectively, and the integrated flux maps show that they trace the star-forming ring and the point source at the nucleus. The ring has knots of star formation to the North, West, and South, but is fainter and more flocculent to the East of the nucleus. The 02 resolution from NIRSpec, at 1.9m, reveals a tail southeast of the nucleus in the inner ISM region that, in projection, connects the ring to the AGN as seen in the Pa flux map (see Fig. 1). The inner ISM region has surface brightness around an order of magnitude lower than the ring and the nucleus, indicating that the excitation/heating of the gas might be different in this region. The H2 flux is more concentrated at the center where the peak of the emission is also observed. It does not show a ring-like pattern; instead, it displays a more extended and diffuse morphology, resembling a spiral arm to the Southwest as previously noticed in the warm molecular phase with MIRI (U et al., 2022) and cool CO gas (Davies et al., 2004). Both H2 m and H2 m fluxes have this distribution.
In order to investigate the origin of the gas emitted in the central region of NGC 7469, we create emission line ratio maps of H2/Br and [Fe ii] m/Pa (Fig. 3, panels (a) and (b)) which are insensitive to extinction. The ring shows low line ratio values of for both H2/Br and [Fe ii] m/Pa. The H2/Br has the highest values () at the nucleus and in the western inner ISM region. The [Fe ii]/Pa is also the highest in the latter. The gray regions correspond to spaxels where at least one of the two lines in the ratio has a signal-to-noise ratio (SNR) lower than 2. In the inner-ISM region, the low SNR spaxels are attributed to Pa and Br non-detections.
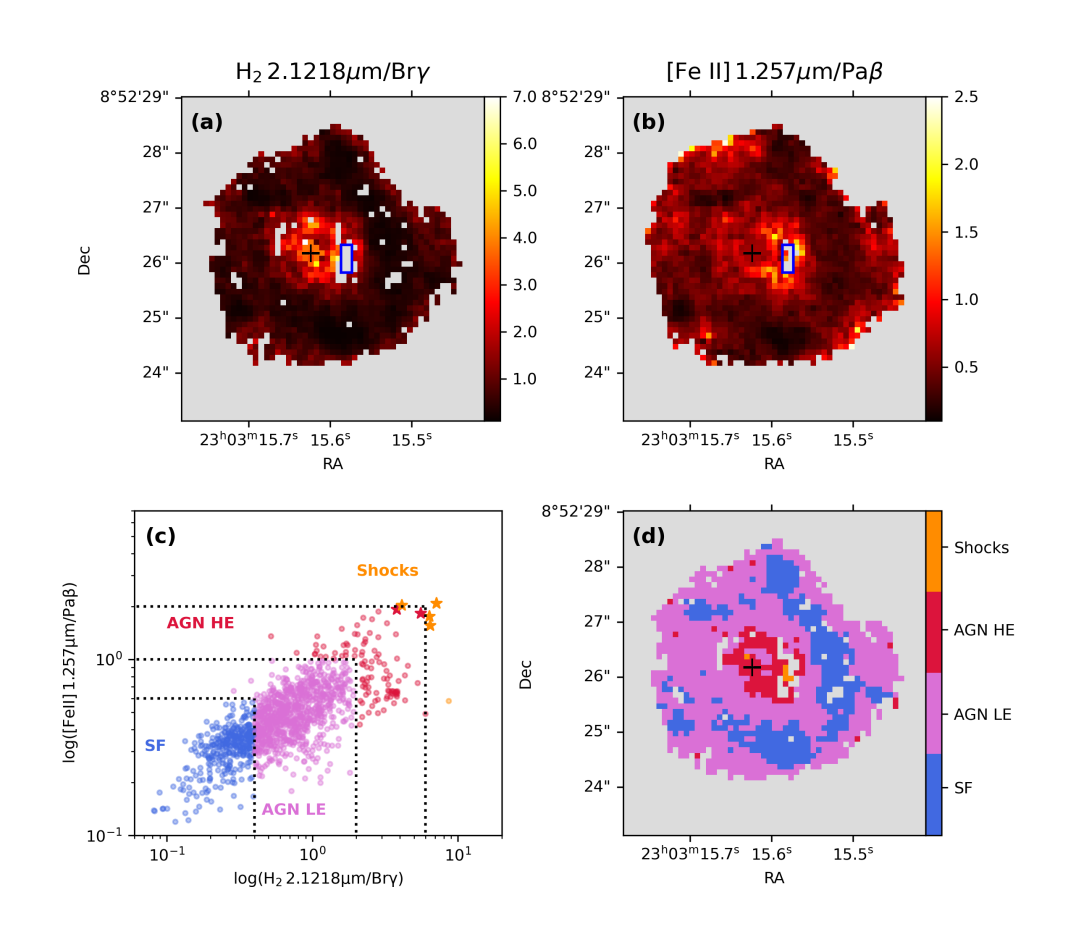
The excitation diagram (Figure 3 (c)) shows data points based on the emission line ratios presented in panels (a) and (b). To distinguish among the different mechanisms that regulate these line ratios, we use the thresholds derived by Riffel et al. (2013), and color-code the spaxels depending on their location on the excitation diagram (panel (d)). These boundaries are derived from analyzing single-slit spectra of galaxies previously classified as starbursts, AGN hosts, or shock-dominated sources such as LINERS. The division between AGN low excitation (LE) and AGN high excitation (HE) is motivated by allowing for a finer sampling of the AGN influence on spatial scales. We use [Fe ii] m / Pa and H2 m / Br as adopted by Riffel et al. (2021b) which are arbitrary.
Since the recombination lines have low fluxes at the inner-ISM region and the H2 is detected at the same region, we expect high line ratios in the western part of the nucleus. The blue box overlaid in the line ratio maps indicates the region where we extracted average spectra for the G140H and G235H gratings. From these spectra, we obtain upper limits for the Br and Pa emission lines. The ratios are then obtained using the flux per spaxel from our H2 and [Fe ii] maps and are plotted on the excitation diagram as stars indicating they are lower limits on the H2 2.12m/Br ratio.
Applying the color-coding from the excitation diagram to the excitation map (Figure 3 panel (d)), we find that the spaxels with the largest flux ratios are consistent with photoionization by the AGN. A small number of spaxels may be shock excited. The inner ISM region has line ratios consistent excitation by the AGN radiation field and by shocks. With the exception of the starforming ring itself, the bulk of the ISM probed by the NIRSpec IFS is photoionized by the AGN.
3.2 Velocity and velocity dispersion
In the [Fe ii] m, Pa and H2 m velocity fields (middle row of Figure 2), rotation is the dominant feature, with amplitudes of up to 150 km s-1. The rotating disk of hot H2 we measure was first detected with adaptive optics spectroscopy on the Keck telescope (Hicks & Malkan, 2008). That study found similar rotation velocities to what we see: 100 km s-1 or more out to a radius of about , almost reaching the starburst ring. Small-scale kinematic features are also observed as excess blueshifts to the southeast and redshifts to the northwest of the nucleus. The velocity field for Pa (not presented here) shows very similar kinematics and gas distribution as those of Pa, although with a lower SNR.
The velocity dispersion maps show some interesting features previously seen at lower resolution in the MIRI-MRS data (U et al., 2022). The ring and outer parts have low dispersion values ( km s-1) indicating that they are dominated by rotation. In the inner ISM region, we see differences between the gas species. The [Fe ii] velocity dispersion map shows an arc-shaped structure with the highest values ( km s-1) to the west of the nucleus. For the Pa we also see arc-shaped structures peaking in two different regions, to the northeast and southwest of the nucleus, with a dual-spiral pattern. Each of the spirals is located ( pc) away from the nucleus. We investigate the nature of this feature in Section 4.2. The H2 velocity dispersion map displays higher values ( km s-1) extending northwest of the nucleus. This feature is also seen in the H2 m velocity dispersion map (not presented here). The fan-shaped feature is consistent with the regions of enhanced H2 dispersion seen with MIRI-MRS (U et al., 2022) but at a higher spatial resolution.
One way of investigating the non-rotational motions is by fitting the velocity fields with a rotating disk model that assumes the gas particles have circular orbits. We adopt the model described by the following equation (Bertola et al., 1991):
where is the systemic velocity of the galaxy, is the distance of each pixel to the center of rotation, is the velocity amplitude, is the position angle of each spaxel, is the PA of the line of the nodes, i.e. the kinematical major axis, and is the inclination of the disk. The parameter is the slope of the rotation curve, varying from 1 for an asymptotically flat rotation curve to 1.5 for a system with finite mass, and is the concentration parameter, the radius where the velocity reaches 70% of the velocity amplitude.
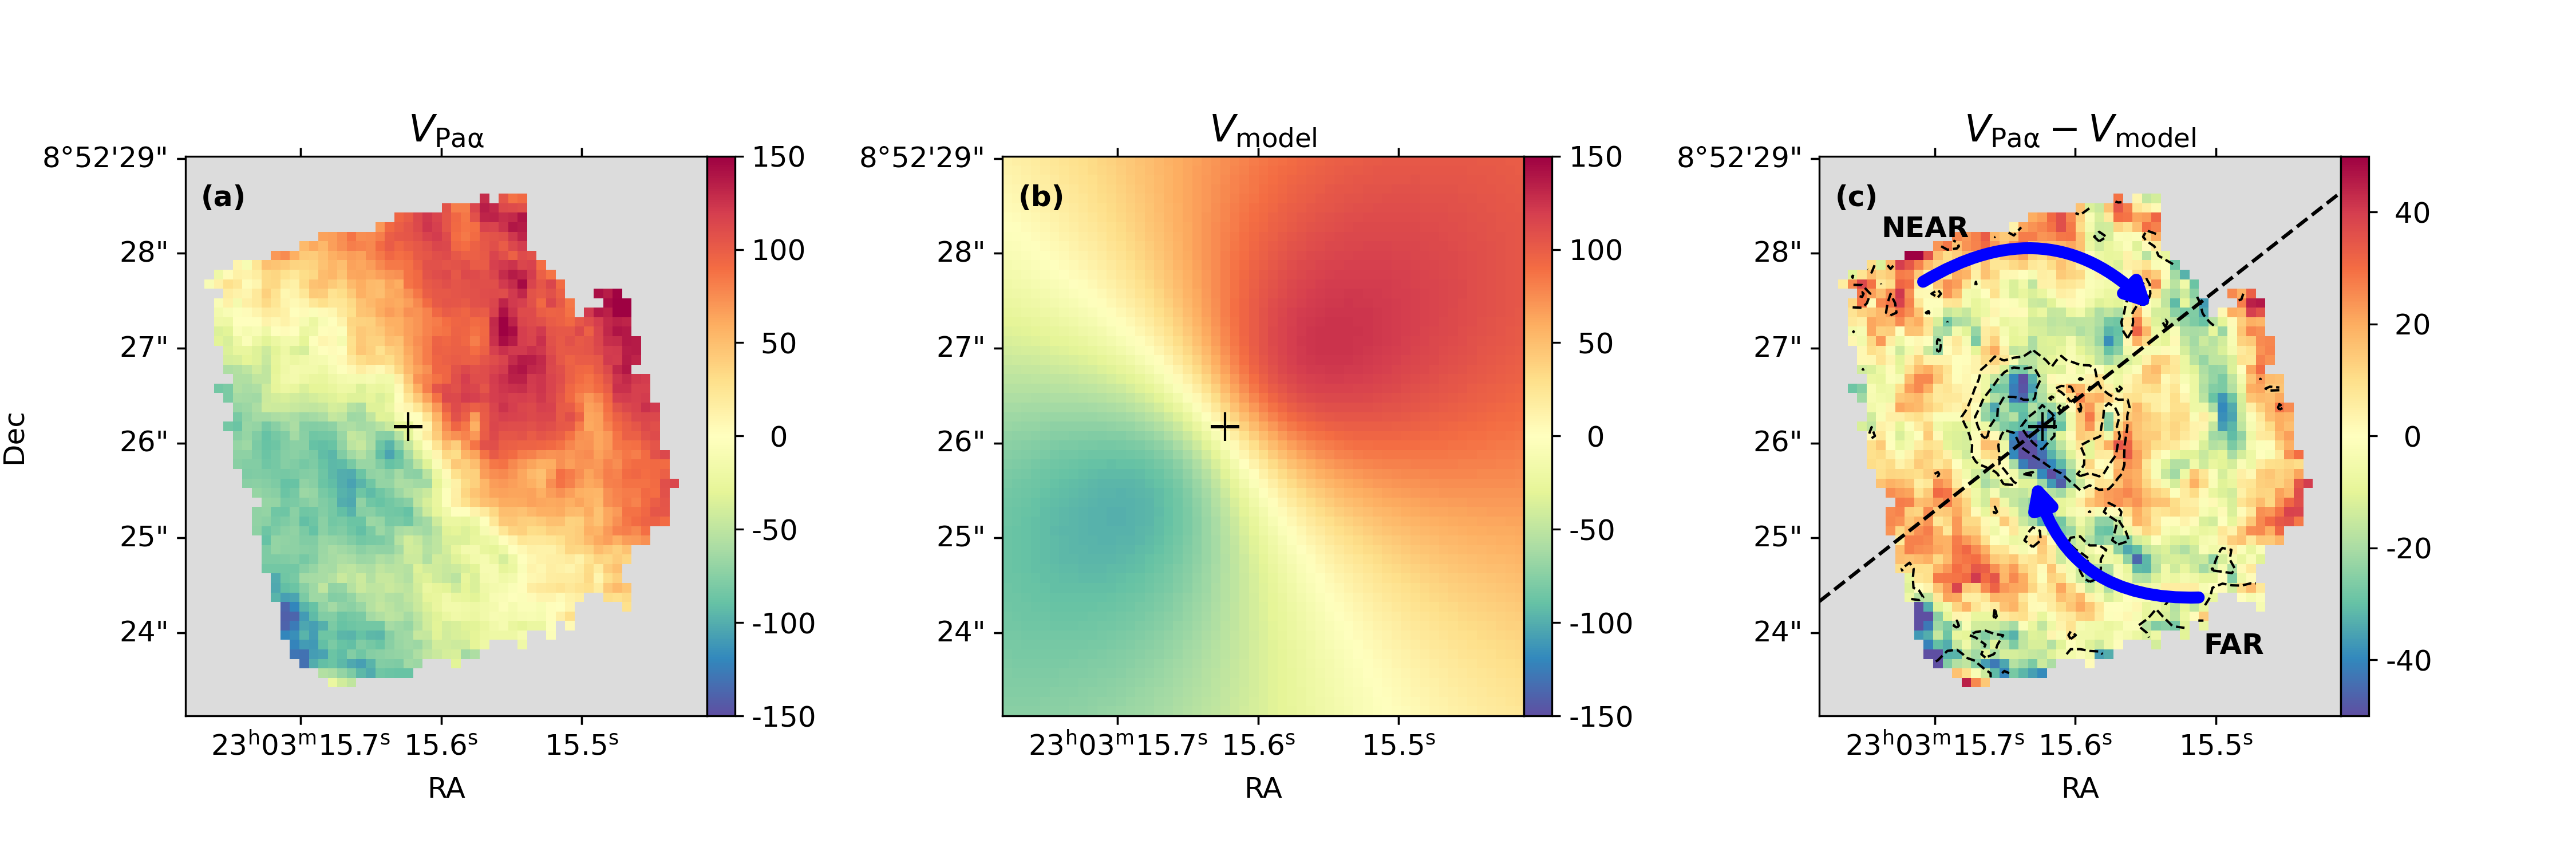
We fit this model to the Pa velocity field as this emission line has the most interesting structure. The fitting is performed using the non-linear least-square minimization routine mpfit2dfun (Markwardt, 2009). The combination of parameters that best describe the velocity field are km s-1, km s-1 and arcsec, and . The position of the center of rotation is adopted as the position of the nucleus, and are fixed during the fitting. Previous studies have estimated similar values for (Davies et al., 2004; Hicks & Malkan, 2008; U et al., 2022) and (Hicks & Malkan, 2008).
Figure 4 shows the modeled velocity field in panel (b), and the residual velocity map, with the position angle of the galaxy’s major kinematic axis marked by the black dashed line, in panel (c). The Near and Far side indicate the orientation of the star-forming ring proposed by U et al. (2022) and by the optical large-scale image of the galaxy. We observe most of the velocity residuals as blueshifts on the far side of the galaxy. Such a configuration may represent streaming motions toward the center.
4 Discussion
4.1 Gas excitation
Emission line diagnostic diagrams are powerful tools to investigate the origin of emission lines in galaxies. In the near-IR, empirical diagrams involving bright lines in the and bands have been analyzed in single-aperture (Larkin et al., 1998; Reunanen et al., 2002; Rodríguez-Ardila et al., 2004, 2005; Riffel et al., 2013) and spatially resolved studies (Colina et al., 2015; U et al., 2019; Riffel et al., 2021a). The H2 can be excited by soft-UV photon absorption (non-thermal) or by collisional excitation (thermal). The thermal processes include shocks (Hollenbach & McKee, 1989; Riffel et al., 2015), and X-ray heating by the AGN radiation field. The [Fe ii] is produced in the partially ionized region that, in AGN hosts, is a byproduct of X-rays or shocks due to the radio jet or gas outflows (Simpson et al., 1996; Forbes & Ward, 1993). Another source of excitation of the [Fe ii] is due to shocks caused by supernovae remnants, especially in star-forming regions (Rosenberg et al., 2012). Previous studies show that there is a correlation between H2/Br and [Fe ii]m/Pa, suggesting that both [Fe ii] and H2 may have a common excitation mechanism (Larkin et al., 1998; Riffel et al., 2013, 2021a). A positive trend is observed in Figure 3 (c), suggesting that in NGC 7469 [Fe ii] and H2 are excited by a common mechanism.
The excitation map (Figure 3 (d)) shows the spatial distribution of the different line ratios. At the location of the ring, the excitation conditions show a discontinuity to the east, where AGN-like excitation dominates. A morphological discontinuity in the ring, at the same location, has previously been claimed as the result of an outflow-excavated ring (García-Bernete et al., 2022). However, we do not see clear velocity signatures consistent with outflowing gas in the spectral transitions we analyze here.
The highest line ratios (color-coded as red and orange) are distributed mostly in the western part of the inner-ISM. These line ratios are indicative of shock-excited gas at the same location as in the MIRI-MRS observations of NGC 7469 (U et al., 2022). The authors linked the shock-excited H2 with the fan-shaped H2 S(5) velocity dispersion map. The lower right panel in Fig. 2 shows a more clumpy structure than in H2 S(5). Shock models suggest that regions with fast motions would be expected in a clumpy turbulent medium (Appleton et al., 2023). Thus, the high-velocity dispersion and the shock-like line ratios are indicators of the same shocked gas structure at the western part of the inner-ISM.
NGC 7469 has a compact radio jet-core structure that extends east-west for 100 pc, which has been resolved with VLBI observations (Lonsdale et al., 2003; Alberdi et al., 2006) and high-resolution VLA observations (Orienti & Prieto, 2010; Song et al., 2022) at multiple frequencies. [Fe ii] is likely excited by shocks due to the interaction of the jet with the ISM in the regions color-coded in orange in Figure 3. However, excitation by the AGN radiation field cannot be ruled out, as the jet is compact and line ratios consistent with excitation by the AGN are observed over all the FoV. The ring does show line ratios typical of star-forming galaxies, where non-thermal processes (UV-fluorescence) might be the mechanism responsible for the H2 excitation. The [Fe ii] emission observed in the SF ring is likely due to shocks caused by supernovae where the dust grains trapping the Fe are destroyed by the supernova remnant shocks (Rosenberg et al., 2012).
4.2 Gas dynamics: inflows and the feedback driving mechanism
In Figure 2, the velocity dispersion of Pa shows a dual spiral pattern, which also appears to exhibit enhanced H2/Br and [Fe ii]/Pa ratios. With optical observations of the AGN host Mrk 590, Raimundo et al. (2019) observe a nuclear dual spiral pattern in the velocity dispersion and flux maps of optical ionized gas emission lines. The authors interpret this pattern as due to a gas inflow to the nucleus of the galaxy. Another example of a nuclear dual spiral is interpreted as a gas inflow in NGC 6951 (Storchi-Bergmann et al., 2007). In the case of NGC 7469, the hypothesis of an inner dual spiral was proposed by Davies et al. (2004) to explain the morphology of the CO(2-1) flux distribution. However, the authors did not find kinematic signatures that could be associated with a gas inflow. In magneto-hydrodynamical simulations, stellar feedback from a star-forming ring provides the fuel for gas inflows that star and sustain the AGN-duty cycle (Clavijo-Bohórquez et al., 2023), which is probably the case in NGC 7469. We investigate possible deviations from pure circular rotation by inspecting the velocity residuals in Figure 4 (c). The residuals are highest ( km s-1) at the location of the nuclear spiral, but patchy residuals that resemble inspiraling patterns in blue and redhifts are also observed along the field of view. We interpret this as a signature of gas inflowing to the nucleus of the galaxy.
If we indeed are observing inspiraling gas, we follow Storchi-Bergmann et al. (2007) and compute the mass inflow rate via
| (1) |
where is the electron density, is the velocity of the inflowing gas, is the area of the cross-section of the spiral arm, is proton mass, is the filling factor and is the number of arms (in our case: ). We estimate the filling factor considering that
| (2) |
where and are the luminosity and emission coefficient of the Pa line (Osterbrock & Ferland, 2006), and is the volume of the emitting region. Assuming a typical density of 500 cm-3 and a temperature of 10,000 K, we determine erg cm-3 s-1. The Pa luminoisity is estimated from the flux map in Fig. 2 as erg s-1. Since most of the Pa emission is associated with the star-forming ring, we assume that half of the line flux comes from the gas inflowing to center as erg s-1. Assuming that the inflowing gas is distributed in a dual-spiral structure where one of the arms can be represented by a cylinder of height and radius , the filling factor is . This value is higher than previously estimated in the nearby Seyfert galaxy NGC 6951 (Storchi-Bergmann et al., 2007). The mass inflow calculation adopts both filling factor values. The velocity is corrected by the inclination of the galaxy (). From the rotation model residuals (Fig. 4, panel (c)) km s-1. We consider two possible inclinations for NGC 7469: derived from the rotation model, and the inclination of the ring (U et al., 2022). The deprojected inflow velocity is km s-1.
Considering all the assumptions mentioned above, the mass inflow rate is M⊙ yr-1. This value is comparable to the mass outflow rate estimated from the coronal emission lines (Müller-Sánchez et al., 2011; Armus et al., 2023, M⊙yr-1). The mass inflow rate is at least one order of magnitude larger than the accretion rate needed to power the AGN ( M⊙yr-1; Armus et al., 2023). Part of the gas mass moving towards the center might not feed to the supermassive black hole and could, in fact, be ejected as part of the outflow.
The recombination lines show a prominent broad component (see the nuclear spectrum in Figure 1). Peterson et al. (2014) have mapped the broad line region (BLR) and measured km s-1 for the H emission line. The initial expectation is that the component observed in NIRSpec corresponds to the unresolved BLR and, for the recombination lines, it has a similar width as in the optical broad lines. However, in Pa, the recombination line with the highest signal-to-noise ratio, this broad has km s-1 and is detected up to radius from the nucleus with SNR. The gas traced by this component is moving at systemic velocity, and there is no indication of a non-Gaussian profile that could be directly linked to a gas outflow. Using the virial theorem and extrapolating the use of the indirect method adopting a virial factor (Woo et al., 2015), we estimate an enclosed mass of M⊙. NGC 7469 hosts a black hole with mass M⊙ (Peterson et al., 2014) which is 4 orders of magnitude smaller than the enclosed mass estimated from the Pa broad component. This, combined with the lack of a clear outflow kinematical signature, suggests that the broad component is due to a turbulent gas built-up in the inner pc of NGC 7469. Previous works have observed gas outflows in highly (Müller-Sánchez et al., 2011; Armus et al., 2023) and moderately (Xu & Wang, 2022) ionized gas in this galaxy and outflows in the recombination lines are expected. The outflow traced by the recombination lines, if present, probably is restricted to the nuclear region, and its signatures are masked by the bright broad/turbulent component.
Despite not directly observing the outflow, inferences about its energetic based on the outflow properties determined by Armus et al. (2023) can still be made. The kinetic power can be determined by , where M⊙yr-1 and km s-1 are estimated from the coronal lines observed by MIRI. Here accounts for the turbulence in the system, adopt as the median value of the velocity dispersion of the H2( km s-1), but also associated with the recombination lines broad component ( km s-1). Considering both velocity dispersion values and the range in the mass outflow rate, erg s-1. In order to determine if the small-scale radio jet-core structure is capable of driving the highly ionized gas outflow, we follow Morganti et al. (2015) and Venturi et al. (2021) and adopted the scaling relations between 1.4 GHz radio luminosity and jet power presented in Bîrzan et al. (2008) and Cavagnolo et al. (2010). The jet component has flux density of 9.4 mJy at 8 GHz (Alberdi et al., 2006), and 1.3 mJy at 33 GHz (Song et al., 2022), which yield a GHz spectral index of and an extrapolated 1.4 GHz flux density of 120 mJy. This value would be lowered to 40 mJy if a nominal synchrotron spectral index of is assumed between 1.4 and 8 GHz. Using the scaling relations, these values correspond to kinetic jet power of erg s-1. As noted in Venturi et al. (2021), jet power may be underestimated by an order of magnitude using the above scaling relations compared to values derived from models of jet-ISM interaction (e.g. Mukherjee et al., 2018). The kinetic power of the outflow is up to an order of magnitude smaller than the jet power. Assuming that the compact radio jet is the sole driver of the outflow in NGC 7469, we obtain a kinetic coupling efficiency of , which is consistent predictions from different theoretical works (Harrison et al., 2018, and references therein)
5 Summary
In this Letter, we report the JWST NIRSpec-IFS observations of NGC 7469. With the superb spatial and spectral resolutions of NIRSpec, it is now possible to study in detail the inner kiloparsec of this galaxy. This allows us to unveil the intricate connection between the feeding, feedback, and gas excitation in the inner kiloparsec of this luminous Sy 1.5 galaxy. Our conclusions are summarized below.
-
•
Enhanced line ratios, consistent with shock-heated gas, are observed mostly in the nuclear region of the galaxy, with the highest line ratios to the west of the nucleus. The presence of a compact ( pc) radio jet (e.g. Lonsdale et al., 2003) indicates that its interaction with the gas in the inner-ISM region may be the cause of the H2 and [Fe ii] gas excitation. The spatially resolved excitation map also reveals diffuse AGN-like excitation over the field of view suggesting that the central source ionizes a significant fraction of the gas in the inner ISM. The highly ionized outflow observed with MIRI (Armus et al., 2023) has a kinetic power of erg s-1. Considering the radio jet east-west alignment, consistent with the location of the outflow (U et al., 2022), and its power of erg s-1, the outflow can be driven by the compact one-sided radio emission.
-
•
NGC 7469 kinematics is dominated by rotation (with amplitudes km s-1 at low-velocity dispersion ( km s-1), especially in the star-forming ring region. We identify a nuclear spiral in NGC 7469 in the Pa velocity dispersion map. We interpret the nuclear spiral and the non-rotational motions (observed after modeling the rotation field) as a gas inflow to the nucleus of the galaxy. We estimate a mass inflow rate of M⊙yr-1 dependent upon the precise geometry and inclination of the disk. This value is up to two orders of magnitude higher than the gas accretion rate needed to power the central AGN but comparable with the mass outflow rate.
-
•
We measure a strong broad component on the Pa emission with a FWHM of about 2000 km s-1. This extended broad component is likely not originating from a canonical BLR and is instead dominated by turbulent gas in the inner 450 pc of the galaxy.
References
- Aalto et al. (2019) Aalto, S., Muller, S., König, S., et al. 2019, A&A, 627, A147, doi: 10.1051/0004-6361/201935480
- Alberdi et al. (2006) Alberdi, A., Colina, L., Torrelles, J. M., et al. 2006, ApJ, 638, 938, doi: 10.1086/498859
- Appleton et al. (2023) Appleton, P. N., Guillard, P., Emonts, B., et al. 2023, arXiv e-prints, arXiv:2301.02928, doi: 10.48550/arXiv.2301.02928
- Armus et al. (2023) Armus, L., Lai, T., U, V., et al. 2023, ApJ, 942, L37, doi: 10.3847/2041-8213/acac66
- Arribas et al. (2014) Arribas, S., Colina, L., Bellocchi, E., Maiolino, R., & Villar-Martín, M. 2014, A&A, 568, A14, doi: 10.1051/0004-6361/201323324
- Astropy Collaboration et al. (2013) Astropy Collaboration, Robitaille, T. P., Tollerud, E. J., et al. 2013, A&A, 558, A33, doi: 10.1051/0004-6361/201322068
- Astropy Collaboration et al. (2018) Astropy Collaboration, Price-Whelan, A. M., Sipőcz, B. M., et al. 2018, AJ, 156, 123, doi: 10.3847/1538-3881/aabc4f
- Astropy Collaboration et al. (2022) Astropy Collaboration, Price-Whelan, A. M., Lim, P. L., et al. 2022, apj, 935, 167, doi: 10.3847/1538-4357/ac7c74
- Barcos-Muñoz et al. (2018) Barcos-Muñoz, L., Aalto, S., Thompson, T. A., et al. 2018, ApJ, 853, L28, doi: 10.3847/2041-8213/aaa28d
- Bertola et al. (1991) Bertola, F., Bettoni, D., Danziger, J., et al. 1991, ApJ, 373, 369, doi: 10.1086/170058
- Bîrzan et al. (2008) Bîrzan, L., McNamara, B. R., Nulsen, P. E. J., Carilli, C. L., & Wise, M. W. 2008, ApJ, 686, 859, doi: 10.1086/591416
- Bohn et al. (2023) Bohn, T., Inami, H., Diaz-Santos, T., et al. 2023, ApJ, 942, L36, doi: 10.3847/2041-8213/acab61
- Böker et al. (2022) Böker, T., Arribas, S., Lützgendorf, N., et al. 2022, A&A, 661, A82, doi: 10.1051/0004-6361/202142589
- Bouchet et al. (2015) Bouchet, P., García-Marín, M., Lagage, P. O., et al. 2015, PASP, 127, 612, doi: 10.1086/682254
- Bushouse et al. (2022) Bushouse, H., Eisenhamer, J., Dencheva, N., et al. 2022, spacetelescope/jwst: JWST 1.6.2, 1.6.2, Zenodo, Zenodo, doi: 10.5281/zenodo.6984366
- Cavagnolo et al. (2010) Cavagnolo, K. W., McNamara, B. R., Nulsen, P. E. J., et al. 2010, ApJ, 720, 1066, doi: 10.1088/0004-637X/720/2/1066
- Clavijo-Bohórquez et al. (2023) Clavijo-Bohórquez, W. E., de Gouveia Dal Pino, E. M., & Melioli, C. 2023, arXiv e-prints, arXiv:2306.11494, doi: 10.48550/arXiv.2306.11494
- Colina et al. (2015) Colina, L., Piqueras López, J., Arribas, S., et al. 2015, A&A, 578, A48, doi: 10.1051/0004-6361/201425567
- Davies et al. (2004) Davies, R. I., Tacconi, L. J., & Genzel, R. 2004, ApJ, 602, 148, doi: 10.1086/380995
- de Vaucouleurs et al. (1991) de Vaucouleurs, G., de Vaucouleurs, A., Corwin, Herold G., J., et al. 1991, Third Reference Catalogue of Bright Galaxies
- Díaz-Santos et al. (2007) Díaz-Santos, T., Alonso-Herrero, A., Colina, L., Ryder, S. D., & Knapen, J. H. 2007, ApJ, 661, 149, doi: 10.1086/513089
- Falstad et al. (2018) Falstad, N., Aalto, S., Mangum, J. G., et al. 2018, A&A, 609, A75, doi: 10.1051/0004-6361/201732088
- Feruglio et al. (2010) Feruglio, C., Maiolino, R., Piconcelli, E., et al. 2010, A&A, 518, L155, doi: 10.1051/0004-6361/201015164
- Forbes & Ward (1993) Forbes, D. A., & Ward, M. J. 1993, ApJ, 416, 150, doi: 10.1086/173221
- García-Bernete et al. (2022) García-Bernete, I., Rigopoulou, D., Alonso-Herrero, A., et al. 2022, A&A, 666, L5, doi: 10.1051/0004-6361/202244806
- González-Alfonso et al. (2021) González-Alfonso, E., Pereira-Santaella, M., Fischer, J., et al. 2021, A&A, 645, A49, doi: 10.1051/0004-6361/202039047
- Harrison et al. (2018) Harrison, C. M., Costa, T., Tadhunter, C. N., et al. 2018, Nature Astronomy, 2, 198, doi: 10.1038/s41550-018-0403-6
- Hekatelyne et al. (2020) Hekatelyne, C., Riffel, R. A., Storchi-Bergmann, T., et al. 2020, MNRAS, 498, 2632, doi: 10.1093/mnras/staa2479
- Hekatelyne et al. (2018) Hekatelyne, C., Riffel, R. A., Sales, D., et al. 2018, MNRAS, 479, 3966, doi: 10.1093/mnras/sty1606
- Hicks & Malkan (2008) Hicks, E. K. S., & Malkan, M. A. 2008, ApJS, 174, 31, doi: 10.1086/521650
- Hollenbach & McKee (1989) Hollenbach, D., & McKee, C. F. 1989, ApJ, 342, 306, doi: 10.1086/167595
- Hunter (2007) Hunter, J. D. 2007, Computing in Science & Engineering, 9, 90, doi: 10.1109/MCSE.2007.55
- Jakobsen et al. (2022) Jakobsen, P., Ferruit, P., Alves de Oliveira, C., et al. 2022, A&A, 661, A80, doi: 10.1051/0004-6361/202142663
- Lai et al. (2022) Lai, T. S. Y., Armus, L., U, V., et al. 2022, ApJ, 941, L36, doi: 10.3847/2041-8213/ac9ebf
- Lai et al. (2023) Lai, T. S. Y., Armus, L., Bianchin, M., et al. 2023, Submitted to ApJL
- Landt et al. (2008) Landt, H., Bentz, M. C., Ward, M. J., et al. 2008, ApJS, 174, 282, doi: 10.1086/522373
- Larkin et al. (1998) Larkin, J. E., Armus, L., Knop, R. A., Soifer, B. T., & Matthews, K. 1998, ApJS, 114, 59, doi: 10.1086/313063
- Lonsdale et al. (2003) Lonsdale, C. J., Lonsdale, C. J., Smith, H. E., & Diamond, P. J. 2003, ApJ, 592, 804, doi: 10.1086/375778
- Lutz et al. (2020) Lutz, D., Sturm, E., Janssen, A., et al. 2020, A&A, 633, A134, doi: 10.1051/0004-6361/201936803
- Markwardt (2009) Markwardt, C. B. 2009, in Astronomical Society of the Pacific Conference Series, Vol. 411, Astronomical Data Analysis Software and Systems XVIII, ed. D. A. Bohlender, D. Durand, & P. Dowler, 251, doi: 10.48550/arXiv.0902.2850
- Medling et al. (2015) Medling, A. M., U, V., Rich, J. A., et al. 2015, MNRAS, 448, 2301, doi: 10.1093/mnras/stv081
- Medling et al. (2019) Medling, A. M., Privon, G. C., Barcos-Muñoz, L., et al. 2019, ApJ, 885, L21, doi: 10.3847/2041-8213/ab4db7
- Morganti et al. (2015) Morganti, R., Oosterloo, T., Oonk, J. B. R., Frieswijk, W., & Tadhunter, C. 2015, A&A, 580, A1, doi: 10.1051/0004-6361/201525860
- Morganti et al. (2016) Morganti, R., Veilleux, S., Oosterloo, T., Teng, S. H., & Rupke, D. 2016, Astronomy & Astrophysics, 593, A30, doi: 10.1051/0004-6361/201628978
- Motter et al. (2021) Motter, J. C., Riffel, R., Ricci, T. V., et al. 2021, MNRAS, 506, 4354, doi: 10.1093/mnras/stab1977
- Mukherjee et al. (2018) Mukherjee, D., Wagner, A. Y., Bicknell, G. V., et al. 2018, MNRAS, 476, 80, doi: 10.1093/mnras/sty067
- Müller-Sánchez et al. (2011) Müller-Sánchez, F., Prieto, M. A., Hicks, E. K. S., et al. 2011, ApJ, 739, 69, doi: 10.1088/0004-637X/739/2/69
- Orienti & Prieto (2010) Orienti, M., & Prieto, M. A. 2010, MNRAS, 401, 2599, doi: 10.1111/j.1365-2966.2009.15837.x
- Osterbrock & Ferland (2006) Osterbrock, D. E., & Ferland, G. J. 2006, Astrophysics of gaseous nebulae and active galactic nuclei
- Ott (2012) Ott, T. 2012, QFitsView: FITS file viewer, Astrophysics Source Code Library, record ascl:1210.019. http://ascl.net/1210.019
- Pereira-Santaella et al. (2020) Pereira-Santaella, M., Colina, L., García-Burillo, S., et al. 2020, A&A, 643, A89, doi: 10.1051/0004-6361/202038838
- Pérez-Torres et al. (2021) Pérez-Torres, M., Mattila, S., Alonso-Herrero, A., Aalto, S., & Efstathiou, A. 2021, A&A Rev., 29, 2, doi: 10.1007/s00159-020-00128-x
- Peterson et al. (2014) Peterson, B. M., Grier, C. J., Horne, K., et al. 2014, ApJ, 795, 149, doi: 10.1088/0004-637X/795/2/149
- Raimundo et al. (2019) Raimundo, S. I., Vestergaard, M., Koay, J. Y., et al. 2019, MNRAS, 486, 123, doi: 10.1093/mnras/stz852
- Reunanen et al. (2002) Reunanen, J., Kotilainen, J. K., & Prieto, M. A. 2002, MNRAS, 331, 154, doi: 10.1046/j.1365-8711.2002.05181.x
- Rich et al. (2014) Rich, J. A., Kewley, L. J., & Dopita, M. A. 2014, ApJ, 781, L12, doi: 10.1088/2041-8205/781/1/L12
- Rich et al. (2015) —. 2015, ApJS, 221, 28, doi: 10.1088/0067-0049/221/2/28
- Rich et al. (2012) Rich, J. A., Torrey, P., Kewley, L. J., Dopita, M. A., & Rupke, D. S. N. 2012, ApJ, 753, 5, doi: 10.1088/0004-637X/753/1/5
- Rieke et al. (2023) Rieke, M. J., Kelly, D. M., Misselt, K., et al. 2023, PASP, 135, 028001, doi: 10.1088/1538-3873/acac53
- Riffel et al. (2013) Riffel, R., Rodríguez-Ardila, A., Aleman, I., et al. 2013, MNRAS, 430, 2002, doi: 10.1093/mnras/stt026
- Riffel et al. (2021a) Riffel, R. A., Bianchin, M., Riffel, R., et al. 2021a, MNRAS, 503, 5161, doi: 10.1093/mnras/stab788
- Riffel et al. (2015) Riffel, R. A., Storchi-Bergmann, T., & Riffel, R. 2015, MNRAS, 451, 3587, doi: 10.1093/mnras/stv1129
- Riffel et al. (2020) Riffel, R. A., Storchi-Bergmann, T., Zakamska, N. L., & Riffel, R. 2020, MNRAS, 496, 4857, doi: 10.1093/mnras/staa1922
- Riffel et al. (2021b) Riffel, R. A., Storchi-Bergmann, T., Riffel, R., et al. 2021b, MNRAS, 504, 3265, doi: 10.1093/mnras/stab998
- Rigby et al. (2023) Rigby, J., Perrin, M., McElwain, M., et al. 2023, PASP, 135, 048001, doi: 10.1088/1538-3873/acb293
- Robleto-Orús et al. (2021) Robleto-Orús, A. C., Torres-Papaqui, J. P., Longinotti, A. L., et al. 2021, ApJ, 906, L6, doi: 10.3847/2041-8213/abd32f
- Rodríguez-Ardila et al. (2004) Rodríguez-Ardila, A., Pastoriza, M. G., Viegas, S., Sigut, T. A. A., & Pradhan, A. K. 2004, A&A, 425, 457, doi: 10.1051/0004-6361:20034285
- Rodríguez-Ardila et al. (2006) Rodríguez-Ardila, A., Prieto, M. A., Viegas, S., & Gruenwald, R. 2006, ApJ, 653, 1098, doi: 10.1086/508864
- Rodríguez-Ardila et al. (2005) Rodríguez-Ardila, A., Riffel, R., & Pastoriza, M. G. 2005, MNRAS, 364, 1041, doi: 10.1111/j.1365-2966.2005.09638.x
- Rosenberg et al. (2012) Rosenberg, M. J. F., van der Werf, P. P., & Israel, F. P. 2012, A&A, 540, A116, doi: 10.1051/0004-6361/201218772
- Rupke & Veilleux (2011) Rupke, D. S. N., & Veilleux, S. 2011, ApJ, 729, L27, doi: 10.1088/2041-8205/729/2/L27
- Ruschel-Dutra & Dall’Agnol De Oliveira (2020) Ruschel-Dutra, D., & Dall’Agnol De Oliveira, B. 2020, danielrd6/ifscube: Modeling, v1.1, Zenodo, Zenodo, doi: 10.5281/zenodo.4065550
- Ruschel-Dutra et al. (2021) Ruschel-Dutra, D., Storchi-Bergmann, T., Schnorr-Müller, A., et al. 2021, MNRAS, 507, 74, doi: 10.1093/mnras/stab2058
- Sanders & Mirabel (1996) Sanders, D. B., & Mirabel, I. F. 1996, ARA&A, 34, 749, doi: 10.1146/annurev.astro.34.1.749
- Simpson et al. (1996) Simpson, C., Forbes, D. A., Baker, A. C., & Ward, M. J. 1996, MNRAS, 283, 777, doi: 10.1093/mnras/283.3.777
- Song et al. (2021) Song, Y., Linden, S. T., Evans, A. S., et al. 2021, ApJ, 916, 73, doi: 10.3847/1538-4357/ac05c2
- Song et al. (2022) —. 2022, ApJ, 940, 52, doi: 10.3847/1538-4357/ac923b
- Storchi-Bergmann et al. (2007) Storchi-Bergmann, T., Dors, Oli L., J., Riffel, R. A., et al. 2007, ApJ, 670, 959, doi: 10.1086/521918
- Su et al. (2023) Su, R., Mahony, E. K., Gu, M., et al. 2023, MNRAS, 520, 5712, doi: 10.1093/mnras/stad370
- U et al. (2013) U, V., Medling, A., Sanders, D., et al. 2013, ApJ, 775, 115, doi: 10.1088/0004-637X/775/2/115
- U et al. (2019) U, V., Medling, A. M., Inami, H., et al. 2019, ApJ, 871, 166, doi: 10.3847/1538-4357/aaf1c2
- U et al. (2022) U, V., Lai, T., Bianchin, M., et al. 2022, ApJ, 940, L5, doi: 10.3847/2041-8213/ac961c
- Veilleux et al. (2017) Veilleux, S., Bolatto, A., Tombesi, F., et al. 2017, ApJ, 843, 18, doi: 10.3847/1538-4357/aa767d
- Venturi et al. (2021) Venturi, G., Cresci, G., Marconi, A., et al. 2021, A&A, 648, A17, doi: 10.1051/0004-6361/202039869
- Virtanen et al. (2020) Virtanen, P., Gommers, R., Oliphant, T. E., et al. 2020, Nature Methods, 17, 261, doi: 10.1038/s41592-019-0686-2
- Woo et al. (2015) Woo, J.-H., Yoon, Y., Park, S., Park, D., & Kim, S. C. 2015, ApJ, 801, 38, doi: 10.1088/0004-637X/801/1/38
- Wylezalek et al. (2022) Wylezalek, D., Vayner, A., Rupke, D. S. N., et al. 2022, ApJ, 940, L7, doi: 10.3847/2041-8213/ac98c3
- Xu et al. (2014) Xu, C. K., Cao, C., Lu, N., et al. 2014, ApJ, 787, 48, doi: 10.1088/0004-637X/787/1/48
- Xu & Wang (2022) Xu, X., & Wang, J. 2022, ApJ, 933, 110, doi: 10.3847/1538-4357/ac7222