Entropy Maximization in Sparse Matrix by Vector Multiplication ()
Abstract.
The peak performance of any SpMV depends primarily on the available memory bandwidth and its effective use. GPUs, ASICs, and new FPGAs have higher and higher bandwidth; however, for large scale and highly sparse matrices, SpMV is still a hard problem because of its random access pattern and workload imbalance. Here, we show how to turn randomness to our advantage. We propose a matrix permutation pre-processing step that aims to maximize the entropy of the distribution of the nonzero elements. We seek any permutation that uniformly distributes the non-zero elements’ distribution, thereby generating a SpMV problem that is amenable to work load balancing or to speed up sort algorithms. We conjecture these permutations would be most effective for matrices with no dense rows or columns and, as in preconditioning, when the matrix is reused. We shall show that entropy maximization is an optimization that any architecture may take advantage although in different ways. Most importantly, any developer can consider and deploy. We shall present cases where we can improve performance by 15% on AMD-based (GPU-CPU) systems.
1. Introduction
To define the scope of our work, the obvious questions to ask are: first, what randomization or entropy maximization is in the context of sparse matrices; second, why would we use it; third, when it does work. We shall provide formal definitions in the following sections. Here briefly, we will permute randomly the rows and columns of a sparse matrix before multiplying it by a dense vector (SpMV) with the aim of speeding this operation (accordingly the input and output vectors will be permuted).
| (1) |
Undoubtedly, this scheme requires some restrictions about the matrix structure: for example, it must have no or few dense columns or rows. In this unfortunate case, a sparse/dense partitioning scheme should be used and different algorithms/hardware could be deployed separately instead. Here suffice to say that the partitioning advantages rely on a clear definition of density. For the remainder of this manuscript, we shall assume the former nonzero structure. We use randomization because it is the poor man’s way for preconditioning SpMV in our context, and we do not mean it in a pejorative sense.
Preconditioning speeds up the convergence rate of an iterative linear solver by linearly transforming the associated matrix into a form that affords a faster reduction of the residual error at every iteration. The cost of this transformation is justified by the runtime reduction it affords. Likewise, we foresee randomization playing a similar role for SpMV in the context of iterative linear solvers and other methods (e.g in convolutions) where the matrix is reused.
Sparse linear algebra and GraphBLAS kernels are memory bound and there is a common thread in the scientific computing community to develop acceleration libraries mostly for multi-core systems. These predominantly include multi-core processors and GPUs. The goal is a balanced work distribution and, when applicable, minimal communication (Kayaaslan et al., 2018; Page and Kogge, 2018). When storage strategy and algorithms must be considered together then GPUs provide the work horse for abundant thrust in research (Anzt et al., 2020). These works aim at optimal solutions and strive for a clear and complete understanding/exploitation of the software-hardware interface; usually the hardware is composed of symmetric computational units. Interestingly, the SpMV’s space and time complexity, which are small, may not warrant more performance because we typically end up utilizing only one-thousandth fraction of the available hardware capacity.
The peak performance of any SpMV accelerator depends primarily on the available memory bandwidth (i.e., DRAM such as DDR or HBM) and the capability of the accelerator to effectively use it. Because SpMV is memory-bound, a more important metric than peak performance alone is the fraction of bandwidth utilized, which captures the overall efficiency of the architecture. GPU platforms exhibit very high bandwidth, see the experimental Section 8: Ellesmere DDR5 224GB/s, Fiji HBM 512GB/s, and Vega 20 HBM 1TB/s. Although utilizing this much bandwidth efficiently is difficult for large scale and highly sparse matrices due to very high random access pattern. Custom architectures based on FPGA or ASIC devices can maximize bandwidth utilization by highly customized data-paths and memory hierarchy designs (Fowers et al., 2014; Grigoras et al., 2016; Zhou et al., 2019). Most of the existing accelerators saturate the relatively low memory bandwidth available on FPGA platforms (less than 80 GB/s) (Nagar and Bakos, 2011; Townsend and Zambreno, 2013; Fowers et al., 2014; Grigoras et al., 2016; Li et al., 2016; Zhou et al., 2019). Modern FPGA platforms have multiple HBM stacks to provide large memory bandwidth. However, there is no implementation (currently available) that saturates all of the available DRAM bandwidth for SpMV kernel on HBM-enabled FPGA platforms. Scalability of accelerator design remains a major concern, and it is an active area of research.
FPGA platforms used in early works exhibit low peak performance due to the scarcity of external memory bandwidth (Kestur et al., 2012; Zhuo and Prasanna, 2005; Fowers et al., 2014). For example, Microsoft’s implementation of SpMV uses an FPGA platform which only has 2 DDR2-400 memory banks with a resulting bandwidth of 6.4 GB/s (Kestur et al., 2012). The accelerator is running at 100 MHz, it reads 64 Bytes of data every cycle, which corresponds to 5 non-zeros at every cycle (a non-zero is about 12 Bytes). At best, the peak performance is 10 double precision operations every cycle at 100 MHz, which is 1 GFLOPS (only). In 2009, Convey systems Inc. released the Convey HC-1 FPGA platform. It has 16 DDR2-677 memories resulting in overall 80 GB/s memory bandwidth (Nagar and Bakos, 2011). The accelerator logic runs at 150 MHz. It consumes 512 Bytes of data every cycle, which corresponds to around 40 non-zeros every cycle. At best, the peak performance is 80 double precision operations every cycle at 150 MHz, which is 12 GFLOPS.
One of the key building blocks for custom architecture solutions is a multi-ported buffer used to storing vector entries (Fowers et al., 2014). During execution, multiple column indices are used as addresses to read corresponding vector entries; we shall provide more details about the application in Section 2. Designing a buffer with a very large number of read ports is challenging. One solution is banking as a mechanism to store partitioned vector entries. Although banking could allow very high throughput indexing unless the same entry is required multiple times and its reads are purely sequential causing loss of bandwidth. For example, hashing techniques and data duplication are possible solutions for this problem. However, another issue arises: When we distribute SpMV computations across -nodes, some of the nodes, say , finish later than the rest because of unbalanced work loads (i.e., number of nonzero element) in row/column major traversal. This is a common phenomena for matrices where few rows or columns are dense. These nodes are referred to as laggard nodes. By applying random permutation of columns/rows, we are attempting to balance the loads across all workers so that there are no laggards. From this hardware vantage point, randomization or maximizing the entropy of the non-zero element distribution is an optimization transform and provides a clear context for our work.
Clearly, accelerating SpMV is a hard many-parameters optimization problem dependent on the choice of algorithm, data structures, and dedicated hardware (CPU, GPUs, FPGA’s, Custom ASIC’s). Rather, our goal is to provide a tool, we may say a naive tool, to help understand how the structure of the matrix may affect the HW-SW solution. For the readers in the field of algorithms, SpMV can be mapped into a sorting algorithm. For example, finding elements and in a sparse matrix requires to find row and then columns and . Sorting is a method to find if an element is in a list with no prior or limited knowledge of its contents. Sorting can be used to prepare the matrix and to find elements in between sparse matrices and sparse vectors. In custom architectures, sorting networks are used to route matrix and vector elements to functional units. In a sense, if one is stuck with a sorting algorithm and a poor distribution, randomization may alter the distribution and throttle performance. Interestingly, the best sorting algorithm is a function of the distribution of the elements (Li et al., 2004; Huang et al., 2009).
We organize this work as follows: In Section 2, we define the matrix by vector operation; in Section 3, we define what we mean by randomization or entropy maximization. We use randomization to create a uniform distribution in Section 5 and measure uniformity by entropy in Section 4. We present how we drive our experiments to show the effects of randomization in Section 6. In the last sections, we present a summary of the results: we present our work loads for the given benchmarks in Section 7, and the complete set of measures for an AMD CPU and GPUs systems in Section 8 .
2. Basic Notations
Let us start by describing the basic notations so we can clear the obvious (or not). A Sparse-matrix by vector multiplication SpMV on an (semi) ring based on the operations is defined as so that where are not represented nor stored. Most of the experimental results in Section 8 are based on the classic addition (+) and multiplication (*) in floating point precision using 64 bits (i.e., double floating point precision) albeit are extensible to other semi-rings. For instance, it is well known that SpMV defined on the semi-ring (min,+) is a kernel in computing an all-pairs shortest paths starting with a graph adjacency matrix, and in using a Boolean algebra we can check if two nodes are connected, which is slightly simpler.
We identify a sparse matrix of size as having non-zero elements, number of non zero nnz. Thus the complexity of is . Also, we must read at least elements and thus the complexity is . We can appreciate that reading the data is as complex as the overall operation. Of course, the definition of sparsity may vary. We represent the matrix by using the coordinate list COO or and the compressed sparse row CSR111a.k.a. Compressed row storage CRS. formats. The COO represents the non-zero of a matrix by a triplet ; very often there are three identical-in-size vectors for the ROW, COLUMN, and VALUE. The COO format takes space and two consecutive elements in the value array are not bound to be neither in the same row nor column. In fact, we know only that .
The CSR format stores elements in the same row and with increasing column values consecutively. There are three arrays V, COL, and ROW. The ROW is sorted in increasing order. Its size is , and is an index in V and COL describing where -th row starts (i.e., if row exists). Accordingly, is stored in . The column indices are stored at and sorted increasingly. The CSR format takes space and a row vector of the matrix can be found in .
The computation is a sequence of scalar products and, using the CSR format, is computed as follows:
The matrix row is contiguous (in memory) and rows are stored in increasing order. However, the access of the dense vector has no particular pattern, well increasing.
The COO format can be endowed with certain properties. For example, we can sort the array by row and add row information to achieve the same properties of CSR. In contrast, transposing a ”sorted” COO matrix simply entails swapping of the arrays ROW and COL. Think about matrix multiply (one of us does constantly). Each scalar product achieves peak performance if the reads of the vector are streamlined as much as possible and so the reads of the vector . If we have multiple cores, each could compute a subset of the and a clean data load balancing can go a long way. If we have few functional units, we would like to have a constant stream of independent and operations but with data already in registers. That is, data pre-fetch will go a long way especially for , which may have an irregular pattern.
3. Randomization and Entropy Maximization
We define Randomization as row or column permutation transform of the matrix (thus a permutation of and ), and we choose these by a pseudo-random process. The obvious question is to as why should we seek randomization transforms? The sparsity of a given matrix has a non-zero element distribution induced by the nature of the original problem or by some imposed ordering on the respective nodes of its associated graph. This distribution may be computationally incompatible with the chosen algorithm or architecture. For instance, it can induce some load imbalance in the computation. We could break this load imbalance by seeking to maximize entropy for this distribution. Our conjecture is that would favor the average case performance rather than the worse case when operating on the ”max-entropy transformed” matrix.
For linear system solvers, if we know the matrix , and we know the architecture, preconditioning (when affordable) is a better solution. If we run experiments long enough, we choose the best permutation(s) for the architecture, permute , and go on testing the next. On one end, preconditioning exerts a full understanding of both the matrix (the problem) and how the final solution will be computed (architecture). On the other end, the simplicity of a random permutation requires no information about the matrix, the vector, and the architecture. Such a simplicity can be exploited directly in Hardware. We are after an understanding when randomization is just enough: We seek to let the hardware do its best with the least effort, or at least with the appearance to be effortless.
Interestingly, this work stems from a sincere surprise about randomization efficacy and its application on custom SpMV. Here, we wish to study this problem systematically so that to help future hardware designs. Intuitively, if we can achieve a uniform distribution of the rows of matrix we can have provable expectation of its load balancing across multiple cores. If we have a uniform distribution of accesses on we could exploit column load balancing and exploit better sorting algorithms: In practice, the reading of can be reduced to a sorting, and there we know that different sparsity may require different algorithms. This may be a lot to unpack but it translates to a better performance of the sequential algorithm without changing the algorithm or to improved bandwidth utilization.
We will show that (different) randomness affects architectures and algorithms differently, making randomization a suitable optimization transform especially when the application and hardware are at odds: Hardware (unless programmable) is difficult to change and the matrix sparsity is simple to change. We want to show that there is a randomness hierarchy that we can distinguish as global and local. There are simple-to-find cases where the sparsity breaks randomness optimization. For instance, matrices with dense rows or columns are better partitioned into sparse and dense components and operated on separately.
4. Entropy
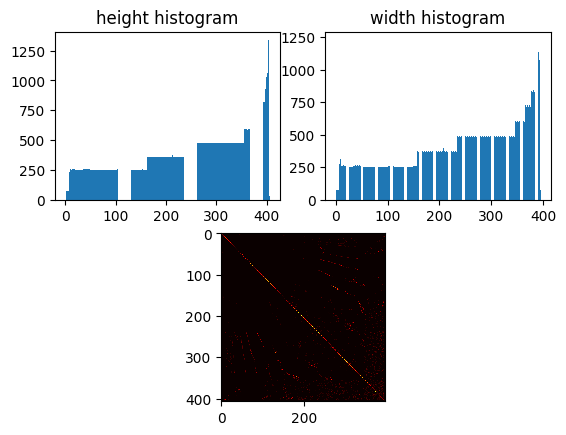
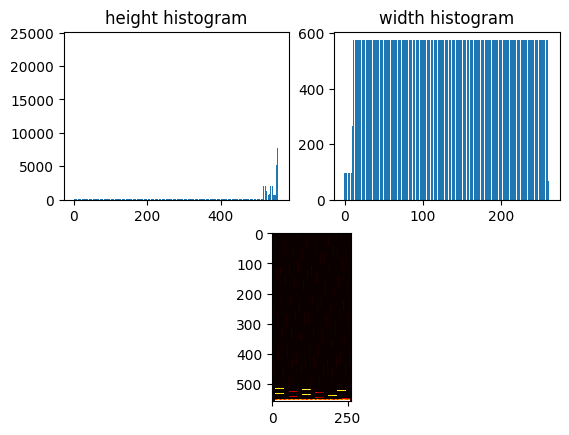
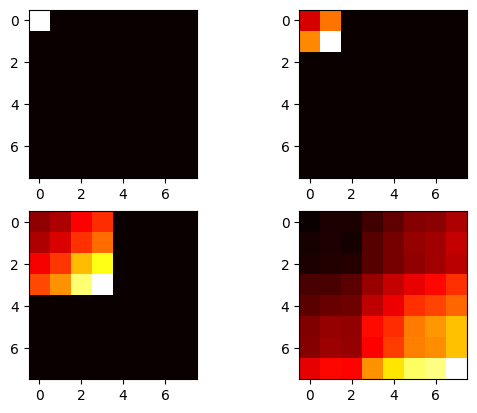
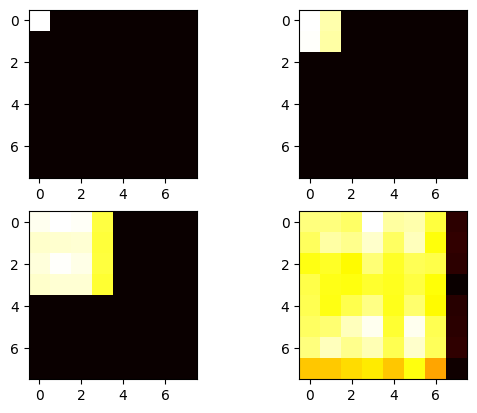
Patterns in sparse matrices are often visually pleasing, see Figure 1 where we present the height histogram, the width histograms, and a two-dimensional histogram as heat map. We will let someone else using AI picture classification. Intuitively, we would like to express a measure of uniform distribution and here we apply the basics: Entropy. Given an histogram , we define and thus we have a probability distribution function . The information of bin is defined as . If we say that the stochastic variable has PDF than the entropy of is defined as.
| (2) |
The maximum entropy is when ; that is, we are observing a uniform distributed event. Our randomization should aim at higher entropy numbers. The entropy for matrix LP OSA 07 is 8.41 and for OPF 3754 is 8.39. We use the entropy specified in the Scipy stats module. A single number is concise and satisfying. If you are pondering why they are so close contrary to their sparsity we discuss this next.
5. Uniform distribution
We know that we should not compare the entropy numbers of two matrices because entropy does not use any information about the order of the buckets, it uses only their probabilities. By construction, the matrices are quite different in sparsity and in shapes, however their entropy numbers are close. Two matrices with the same number of non-zeros, spaced well enough in the proper number of bin, will have the same entropy. To appreciate their different sparsity, we should compare their entropy distributions by Jensen-Shannon measure (D’Alberto et al., 2012) or we could use cumulative distribution function (CDF) measures, which imply an order. Here, we use a representation of a hierarchical 2D-entropy, see Figure 2, where the entropy is split into 2x2, 4x4 and 8x8 (or fewer if the distribution is not square). We have hierarchical entropy heat maps.
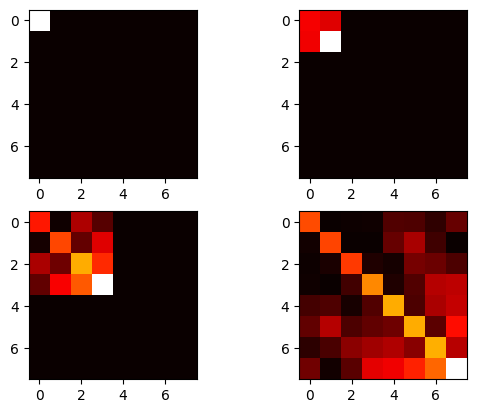
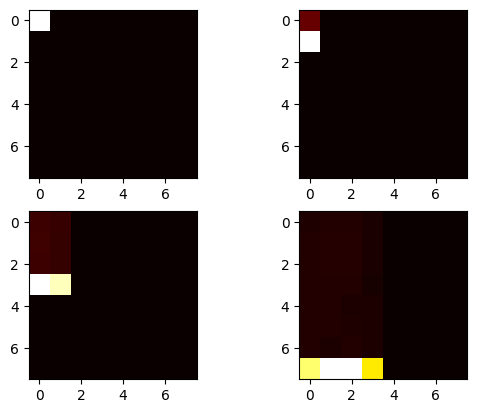
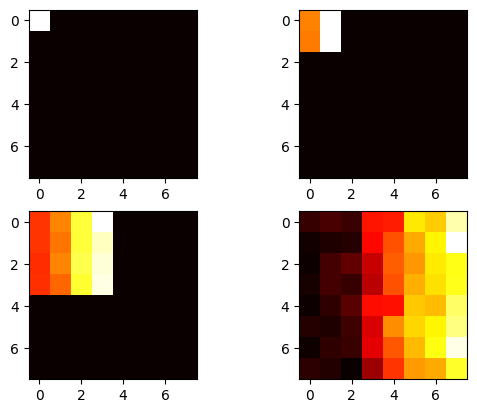
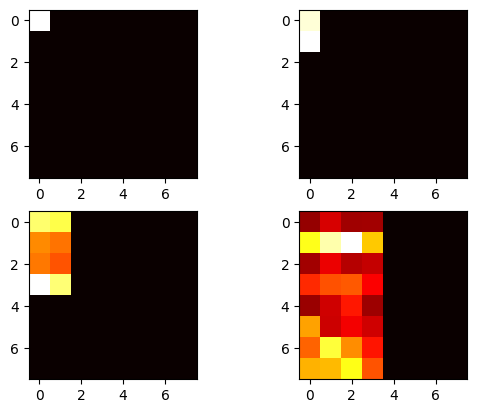
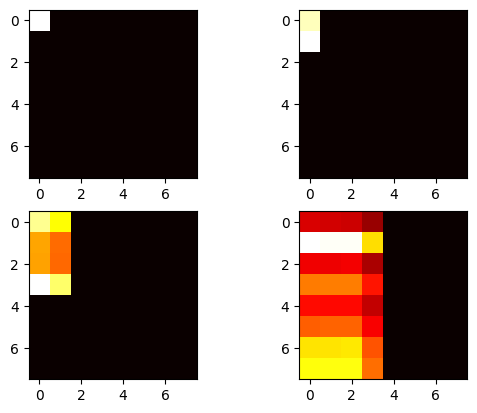
We can see that even a small 2D-entropy matrix summarizes the nature of the original matrix because it has spatial information. In this work, the entropy matrix is used mostly for visualization purpose more than for comparison purpose. Of course, we can appreciate how the matrix LP OSA 07 has a few very heavy rows and they are clustered. This matrix will help us showing how randomization need some tips. Now we apply row and column random permutation once by row and one by column: Figure 3: OPF has now entropy 11.27 and LP 9.26. The numerical difference is significant. The good news is that for entropy, being an expectation, we can use simple techniques like bootstrap to show that the difference is significant or we have shown that Jensen-Shannon can be used and a significance level is available. What we like to see is the the hierarchical entropy heat map is becoming more uniform for at least one of the matrix.
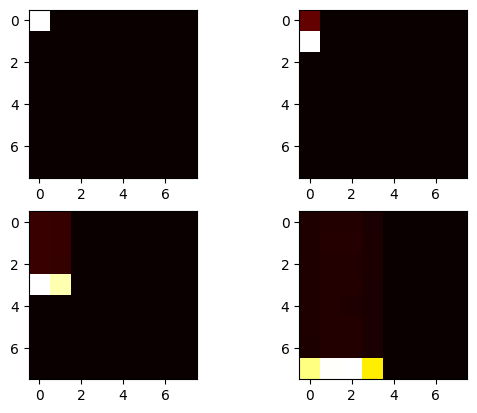
In practice, permutations need some help especially for relatively large matrices. As you can see, the permutation affects locally the matrix. Of course, it depends on the implementation of the random permutation, we use numpy for this. It is reasonable that a slightly modified version of the original is still a random selection and unfortunately they seem too likely in practice. We need to compensate or help the randomization. If we are able to identify the row and column that divide high and low density, we could use them as pivot for a shuffle like in a quick-sort algorithm. We could apply a sorting algorithm but its complexity will the same of SpMV. We use a gradients operations to choose the element with maximum steepness, Figure 4 and 5.
LP achieves entropy 8.67 and 9.58 and OPF achieves 10.47 and 11.40.
If the goal is to achieve a uniformly sparse matrix, it seems that we have the tools to compute and to measure such a sparsity. We admit that we do not try to find the best permutation. But our real goal is to create a work bench where randomization can be tested on different architectures and different algorithms. A randomization with a measurable uniform distribution is preferable than just random. We are interested to find out when random is enough or not enough. Also, consider that to achieve a uniform distribution, we do not need a random transformation and any permutation balancing the number of non-zero is possible, but for now not looked for.
6. Measuring the randomization effects
Whether or not this ever applied to the reader, when we have timed algorithms (i.e., measure execution time), we came to expect variation. The introduction of randomization may hide behind the ever present variance, after all these are algorithms on small inputs: small error can be comparable to the overall execution time. Here, we must address this concern even before describing the experiments.
First, we execute every algorithm between 1000 and 5000 times. The time of each experiment is in the seconds, providing a granularity for which we are confident the measuring time error is under control. Thus, for each experiment we provide an average execution time: we measure the time and we divide by the number of trials. Cold starts, the first iteration, are still accounted. To make the measure portable across platform we present GFLOPS, that is, Giga () floating operations per second: divided by the average time in seconds.
Then we repeat the same experiment 32 times. Permutations in numpy Python uses a seed that is time sensitive: thus every experiment is independent from the previous. The number 32 is an old statistic trick and it is a minimum number of independent trials to approximate a normal distribution. In practice, they are not but the number is sufficient for most of the cases and it is an excellent starting point.
A short hand legend: Reg is the regular matrix without any permutation; R stands for random Row permutation; G-R stands for gradient-based row shuffle and random row permutation; G-C stands for gradient-based column shuffle and random column permutation; R-C stands for random row and column permutation. This legend is used in the pictures to be concise, in the tables in the following sections, we use a verbose description. We shall clarify the gradient based approach in the experimental results section 8. Intuitively, we help the random permutation by a quick targeting of high and low volume of the histogram (and thus the matrix).
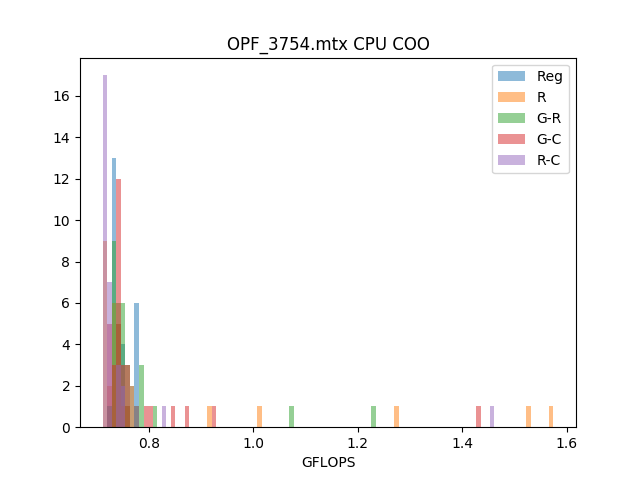
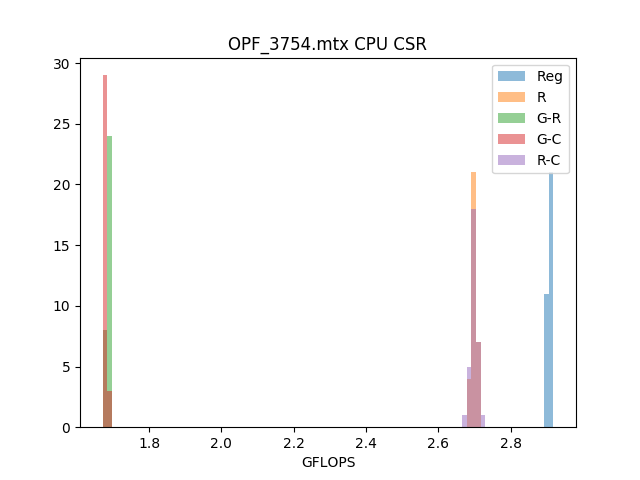
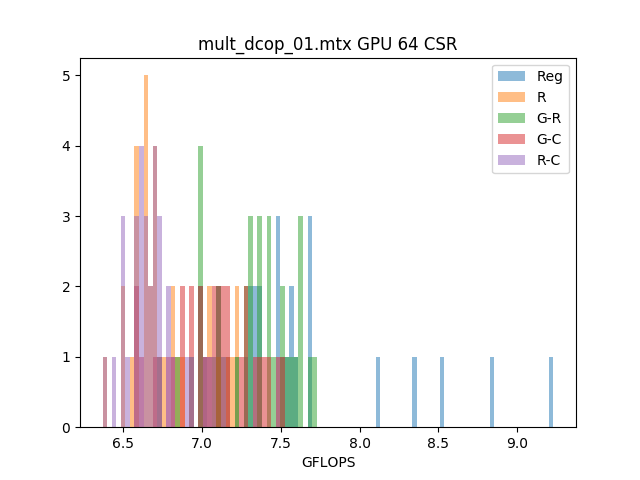
In Figure 6, we show two plots respectively of the CPU performance using COO and CSR SpMV algorithms for the matrix OPF 3754. The figure represents histograms: The is GFLOPS and the label is the number of counts. Thus we show what is the performance distribution of an algorithm. We can see that the CSR algorithms are consistent and the Regular (i.e., the original) has always the best performance. Also the variance of the computation time is small and the shape is approximately Gaussian. Different story for the COO, the permutations introduce long tails, thus performance advantage.
If we take the original matrix and split into parts having the same number of rows, and execute them in parallel using different cores, we can see in Figure 7 that randomization is quite useful.
In Figure 8, 9 and 10, randomization is harmful to the GPU implementation. The OPF 375 matrix is mostly diagonal, thus the vector is read in close quarters, randomization breaks it. If the load balance is fixed (i.e., by dividing the matrix by row and in equal row), randomization is beneficial.
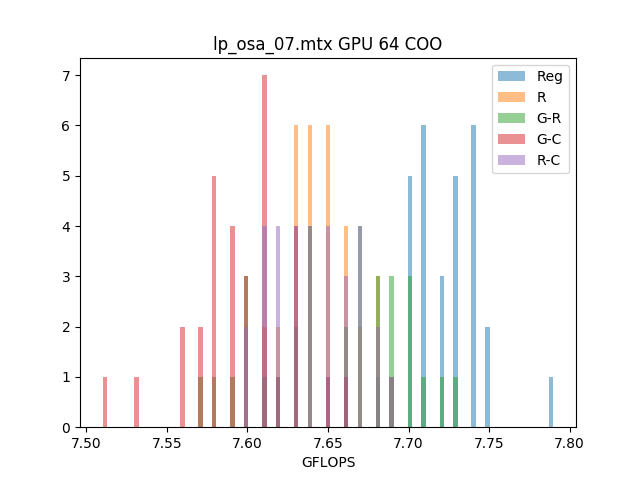
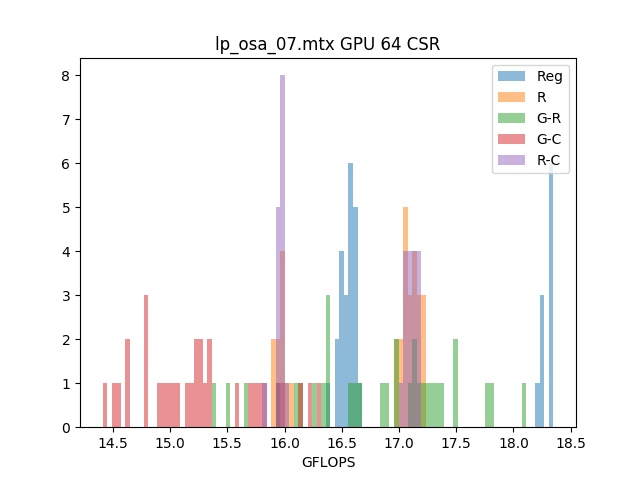
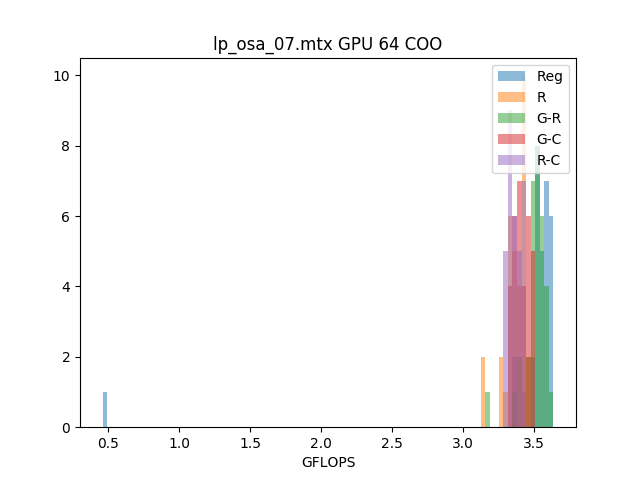
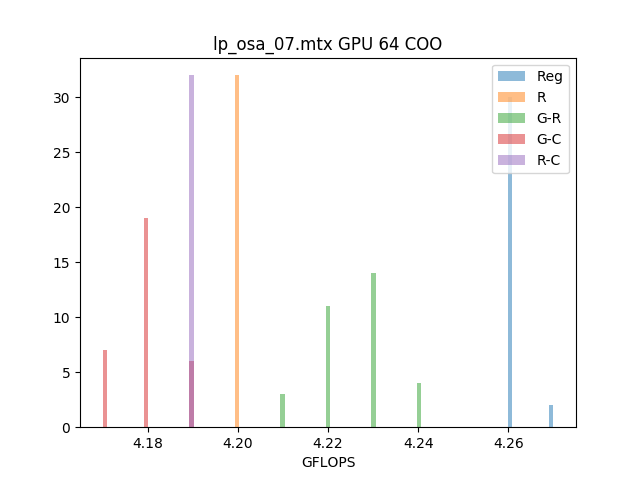
For matrix LP OSA 07, randomization helps clearly only for CPU CSR as we show in Figure 11. In Figure 12, 13, and 14, we can see that randomization is harmful but for one GPU, we can show that a single exception is possible (40% improvement).

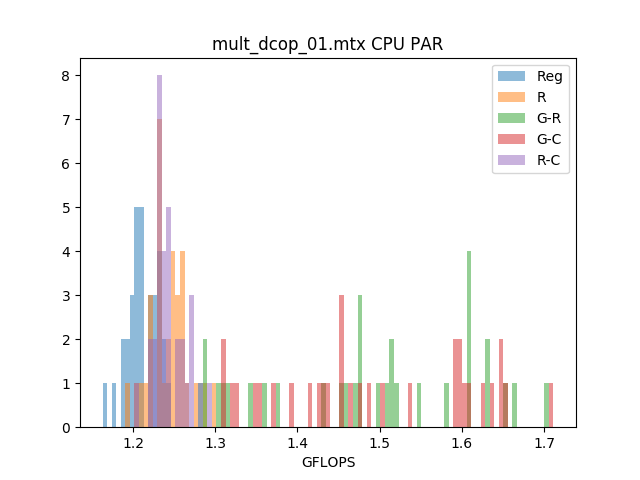
An example, the matrix MULT DCOP 01, is where randomization is useful for the CPU, GPU, and the parallel version Figure 15, 16 - 19 and the gains can be up to 10-15%. Consider, we can achieve these improvements without any insights to the architecture, the algorithms and their relationships.
What does it mean when randomization does not work? The matrices we use in this work are not chosen randomly (pun not intended), they are the matrices that are difficult to handle in our custom SpMV engines using a combination of sorting networks and systolic arrays. If randomization does not work in our simplified work bench, will not work in our specialized architecture because the reorganization of the matrix or the input and output vector does not have the necessary parallelism, data locality, and data streaming. We need to do something else. In this case disrupting the memory pattern is not sufficient. Thus, if we cannot beat the pattern, we must exploit it, well not in this work.
7. Workloads
In the previous sections, we defined what we mean for randomization and we present our tools of tricks for the measure of the effects of randomization. Here we describe the work loads, the applications, we use to test the effects of the randomization.
7.1. Python COO and CSR algorithms
The simplicity to compute the SpMV by the code in Python is very rewarding. By change of the matrix storage format, , we have a different algorithm. The performance exploitation is moved to the lower level. The CSR implementation is often two times faster but there are edge cases where the COO and COO with randomization can go beyond and be surprisingly better: MUL DCOP 03 is an example where COO can do well.
Intuitively, Randomization can affect the performance because the basic implementation is a sorting algorithm and it is a fixed algorithm. There are many sorting algorithms and each can be optimal for a different initial distribution. If we knew what is the sorting algorithm we could tailor the input distribution. Here we just play with it.
In Section 8, we present all the results for CPU and GPUS. Keep in mind that these problems are hard, in the sense they do not have fancy performance sheets (these architectures can achieve Tera FLOPs sustained performance for dense computations). If we go through diligently, we can see that there is a 15x performance difference between the single thread CPU and Vega 20 GPU (i.e, 3 vs 40 GFLOPS).
7.2. Parallel CSR using up to 16 cores
Python provides the concept of Pool to exploit a naive parallel computation. We notice that work given to a Pool is split accordingly to the number of elements to separate HW cores. We also noticed that the work load move from a core to another, thus not ideal. Also we notice that Pool introduce a noticeable overhead: a Pool of 1, never achieves the performance of the single thread . Using Pool allows us to investigate how a naive row partitioning without counting can scale up with number of cores. We tested by splitting the rows to 1–16 cores evenly (one thread per core) and we present the performance for only the best configuration. The randomization goal is to distribute the work uniformly: a balanced work distribution avoid the unfortunate case where a single core does all the work. We are pleased by the simplicity of the benchmark and we know we can do better.
7.3. GPU COO and CSR algorithms
In this work, we use AMD GPUs and rocSPARSE is their current software. The software has a few glitches but overall can be used for different generation of AMD GPUs. We use the COO and CSR algorithms and we provide performance measure for double precision only. The ideas of using different GPUs: it is important to verify that the randomization can be applied independently of the HW. We are not here to compare performance across GPUs and CPUs. Often the limitation is the software, how the software can exploit the hardware or how the software will make easy to use a specific GPU. For example, the Fiji architecture is clearly superior to the Ellesmere, however the latter have better support and the system overall is more stable and user friendly.
The performance of the CSR algorithm is about two times faster than the COO. Most of the algorithms count the number of sparse elements in a row and thus they can decide the work load partition accordingly. Counting give you an edge but without changing the order of the computation there could be cases where the work load is not balanced and a little randomization could help and it does.
7.4. Randomization sometimes works
For the majority of the cases we investigated and reported in the following sections, Randomization does not work. However, there are cases where randomization does work and does work for different algorithms and architectures. If you are in the business of preconditioning, permutations are pretty cheap. If you can find a good one just consider like a preconditioning matrix, which it is.
This shows also that HW has to be more conscious, well the HW designer should, and accept that there are options at software level, at matrix level and beyond.
8. Experimental Results
The main hardware setup is a AMD Threadripper with 16 cores. We have three Radeon GPUs: Vega 20 7nm, Pro 2xFiji, and Pro 2xEllesmere.
Vega 20 can deliver 3.5TFLOPS in double precision and it has 1TB/s HBM memory. Each Fiji provides 0.5 TFLOPS in double precision and has 512GB/s HBM, the card has two chips. The Ellesmere provides 0.3TFLOPS in double precision and has 224GB/s DDR5, the card has two chips. In the performance plots presented earlier and in the following, you will notice that the performance gap between these GPUs is not so marked. We can safely state that and
There are 4 basic randomization formats:
-
•
Random Row Permutation, we take the original matrix and permute the rows.
-
•
Random Row and Column Permutation, we take the original matrix and permute the rows and the columns.
-
•
Gradient based row permutation, we compute the row histogram and we compute the gradient: . We find a single point where the gradient is maximum, this is the pivot for a shuffle like a magician would shuffle a deck of cards. Then we permute the two parts randomly.
-
•
Gradient based row and column permutation, As above but also for the columns.
For large matrices (large number of columns and rows) a permutation tends to be a close variation of the original, still a random permutation. The gradient allows us to describe two areas of the original matrix where there is a clear and de-marked density variation: for example, there are two uniform distributed sub matrices but one denser than the other. A shuffle redistributes every other sample/card to different parts and these can be permuted locally.
We report in the following the performance results GFLOPS, we introduce a following the best performance. This is tedious to read and, we assure, to write. The code and the results are available as software repository. Remember each experiment is based on 32 different runs and thus we report maximum, minimum, and mean as a summary. We use the symbol H for entropy.
9. Vega VII and ThreadRipper
mult_dcop_03.mtx
Regular
CPU COO min 0.728 max 0.880 mean 0.757
CPU CSR min 1.563 max 1.581 mean 1.577
GPU 64 COO min 8.540 max* 8.670 mean 8.619
CSR min 18.320 max 18.930 mean 18.620
CPU PAR min 1.170 max 1.269 mean 1.226
H min 9.689 max 9.689 mean 9.689
Row-Premute
CPU COO min 0.710 max 0.845 mean 0.724
CPU CSR min 1.549 max* 1.597 mean 1.589
GPU 64 COO min 8.360 max 8.540 mean 8.442
CSR min 16.260 max 16.780 mean 16.551
CPU PAR min 1.205 max 1.319 mean 1.263
H min 10.737 max 10.742 mean 10.740
Row-Gradient
CPU COO min 0.706 max 1.603 mean 0.806
CPU CSR min 1.493 max 1.534 mean 1.528
GPU 64 COO min 8.430 max 8.610 mean 8.527
CSR min 17.070 max*18.970 mean 18.115
CPU PAR min 1.331 max 1.695 mean 1.513
H min 10.576 max 10.585 mean 10.580
Column-Gradient
CPU COO min 0.694 max* 1.632 mean 0.797
CPU CSR min 1.491 max 1.534 mean 1.529
GPU 64 COO min 8.350 max 8.520 mean 8.429
CSR min 15.970 max 18.180 mean 17.124
CPU PAR min 1.321 max* 1.728 mean 1.514
H min 10.826 max*10.840 mean 10.833
Row-Column-Permute
CPU COO min 0.688 max 0.757 mean 0.696
CPU CSR min 1.490 max 1.595 mean 1.584
GPU 64 COO min 8.380 max 8.500 mean 8.445
CSR min 16.230 max 16.780 mean 16.513
CPU PAR min 1.192 max 1.274 mean 1.237
H min 10.737 max 10.742 mean 10.740
mult_dcop_01.mtx
Regular
CPU COO min 0.710 max 1.453 mean 0.761
CPU CSR min 1.561 max 1.581 mean 1.578
GPU 64 COO min 8.520 max 8.670 mean 8.597
CSR min 18.320 max 18.870 mean 18.636
CPU PAR min 1.163 max 1.246 mean 1.212
H min 9.689 max 9.689 mean 9.689
Row-Premute
CPU COO min 0.699 max 1.305 mean 0.745
CPU CSR min 1.585 max 1.597 mean 1.590
GPU 64 COO min 8.360 max 8.520 mean 8.446
CSR min 16.260 max 16.780 mean 16.528
CPU PAR min 1.192 max 1.298 mean 1.242
H min 10.738 max 10.742 mean 10.740
Row-Gradient
CPU COO min 0.709 max* 1.656 mean 0.819
CPU CSR min 1.527 max 1.535 mean 1.530
GPU 64 COO min 8.450 max* 8.680 mean 8.527
CSR min 16.520 max*19.480 mean 17.984
CPU PAR min 1.280 max 1.704 mean 1.485
H min 10.572 max 10.585 mean 10.581
Column-Gradient
CPU COO min 0.698 max 1.042 mean 0.737
CPU CSR min 1.458 max 1.536 mean 1.528
GPU 64 COO min 8.340 max 8.600 mean 8.443
CSR min 16.360 max 18.450 mean 17.247
CPU PAR min 1.307 max* 1.712 mean 1.494
H min 10.823 max*10.841 mean 10.835
Row-Column-Permute
CPU COO min 0.683 max 1.247 mean 0.749
CPU CSR min 1.583 max* 1.595 mean 1.590
GPU 64 COO min 8.370 max 8.500 mean 8.435
CSR min 16.250 max 16.780 mean 16.518
CPU PAR min 1.206 max 1.291 mean 1.243
H min 10.738 max 10.742 mean 10.740
mult_dcop_02.mtx
Regular
CPU COO min 1.615 max* 1.677 mean 1.652
CPU CSR min 1.539 max 1.579 mean 1.575
GPU 64 COO min 8.530 max* 8.700 mean 8.614
CSR min 18.290 max 18.890 mean 18.597
CPU PAR min 1.120 max 1.248 mean 1.211
H min 9.689 max 9.689 mean 9.689
Row-Premute
CPU COO min 0.684 max 0.780 mean 0.705
CPU CSR min 1.558 max* 1.596 mean 1.588
GPU 64 COO min 8.360 max 8.490 mean 8.433
CSR min 16.240 max 16.750 mean 16.552
CPU PAR min 1.182 max 1.277 mean 1.242
H min 10.737 max 10.742 mean 10.740
Row-Gradient
CPU COO min 0.704 max 1.373 mean 0.790
CPU CSR min 1.518 max 1.535 mean 1.529
GPU 64 COO min 8.420 max 8.590 mean 8.517
CSR min 16.680 max*19.550 mean 17.907
CPU PAR min 1.328 max* 1.713 mean 1.484
H min 10.572 max 10.585 mean 10.581
Column-Gradient
CPU COO min 0.697 max 1.460 mean 0.742
CPU CSR min 1.517 max 1.534 mean 1.527
GPU 64 COO min 8.330 max 8.490 mean 8.420
CSR min 16.020 max 18.390 mean 17.303
CPU PAR min 1.321 max 1.709 mean 1.557
H min 10.823 max*10.843 mean 10.835
Row-Column-Permute
CPU COO min 0.691 max 0.746 mean 0.698
CPU CSR min 1.568 max 1.595 mean 1.587
GPU 64 COO min 8.350 max 8.500 mean 8.436
CSR min 16.250 max 16.780 mean 16.517
CPU PAR min 1.187 max 1.280 mean 1.228
H min 10.739 max 10.743 mean 10.740
lp_fit2d.mtx
Regular
CPU COO min 0.774 max 0.804 mean 0.793
CPU CSR min 2.538 max 2.550 mean 2.547
GPU 64 COO min 7.060 max 7.170 mean 7.101
CSR min 15.650 max*18.700 mean 18.031
CPU PAR min 1.537 max 1.645 mean 1.590
H min 11.109 max 11.109 mean 11.109
Row-Premute
CPU COO min 0.740 max 0.776 mean 0.746
CPU CSR min 3.302 max* 3.328 mean 3.317
GPU 64 COO min 7.040 max* 7.180 mean 7.098
CSR min 15.690 max 18.580 mean 16.732
CPU PAR min 1.327 max 1.482 mean 1.422
H min 11.098 max 11.105 mean 11.101
Row-Gradient
CPU COO min 0.739 max* 2.092 mean 1.091
CPU CSR min 2.539 max 2.546 mean 2.543
GPU 64 COO min 7.040 max 7.150 mean 7.100
CSR min 15.520 max 18.560 mean 17.547
CPU PAR min 1.401 max 1.661 mean 1.525
H min 11.109 max 11.109 mean 11.109
Column-Gradient
CPU COO min 0.726 max 2.065 mean 1.011
CPU CSR min 2.539 max 2.550 mean 2.546
GPU 64 COO min 6.800 max 7.140 mean 7.080
CSR min 15.480 max 18.560 mean 16.866
CPU PAR min 1.391 max* 1.737 mean 1.563
H min 11.329 max 11.333 mean 11.331
Row-Column-Permute
CPU COO min 0.746 max 0.782 mean 0.754
CPU CSR min 3.310 max 3.324 mean 3.318
GPU 64 COO min 7.030 max 7.160 mean 7.100
CSR min 15.730 max 18.530 mean 17.362
CPU PAR min 1.340 max 1.451 mean 1.401
H min 11.099 max 11.104 mean 11.102
bloweya.mtx
Regular
CPU COO min 0.727 max* 1.815 mean 0.892
CPU CSR min 2.867 max* 2.936 mean 2.917
GPU 64 COO min 0.000 max 0.000 mean 0.000
CSR min 0.000 max 0.000 mean 0.000
CPU PAR min 1.680 max* 1.751 mean 1.719
H min 7.205 max 7.205 mean 7.205
Row-Premute
CPU COO min 0.678 max 1.483 mean 0.746
CPU CSR min 2.311 max 2.326 mean 2.320
GPU 64 COO min 6.840 max* 7.270 mean 6.930
CSR min 15.650 max 16.800 mean 16.233
CPU PAR min 1.649 max 1.730 mean 1.682
H min 11.026 max 11.031 mean 11.029
Row-Gradient
CPU COO min 0.708 max 1.209 mean 0.779
CPU CSR min 1.648 max 1.735 mean 1.709
GPU 64 COO min 6.920 max 7.080 mean 7.015
CSR min 16.950 max 19.500 mean 17.794
CPU PAR min 1.497 max 1.743 mean 1.608
H min 10.298 max 10.304 mean 10.301
Column-Gradient
CPU COO min 0.709 max 1.536 mean 0.817
CPU CSR min 1.705 max 1.753 mean 1.735
GPU 64 COO min 6.800 max 7.120 mean 6.865
CSR min 15.480 max*17.710 mean 16.470
CPU PAR min 1.446 max 1.718 mean 1.591
H min 10.880 max 10.886 mean 10.883
Row-Column-Permute
CPU COO min 0.670 max 1.024 mean 0.706
CPU CSR min 2.199 max 2.340 mean 2.326
GPU 64 COO min 6.880 max 6.980 mean 6.933
CSR min 15.610 max 16.900 mean 16.227
CPU PAR min 1.598 max 1.668 mean 1.632
H min 11.025 max*11.032 mean 11.029
lp_osa_07.mtx
Regular
CPU COO min 0.715 max 1.798 mean 0.885
CPU CSR min 2.495 max 2.551 mean 2.547
GPU 64 COO min 7.650 max* 7.790 mean 7.718
CSR min 16.390 max*18.350 mean 17.093
CPU PAR min 0.963 max 1.012 mean 0.995
H min 8.412 max 8.412 mean 8.412
Row-Premute
CPU COO min 0.720 max* 2.078 mean 1.104
CPU CSR min 2.656 max* 2.679 mean 2.669
GPU 64 COO min 7.610 max 7.690 mean 7.647
CSR min 15.910 max 17.210 mean 16.750
CPU PAR min 0.890 max 0.940 mean 0.918
H min 9.255 max 9.258 mean 9.256
Row-Gradient
CPU COO min 0.725 max 2.078 mean 1.041
CPU CSR min 2.487 max 2.502 mean 2.495
GPU 64 COO min 7.570 max 7.730 mean 7.655
CSR min 15.370 max 18.100 mean 16.803
CPU PAR min 1.435 max 1.796 mean 1.592
H min 8.637 max 8.678 mean 8.672
Column-Gradient
CPU COO min 0.724 max 1.990 mean 1.000
CPU CSR min 2.425 max 2.477 mean 2.448
GPU 64 COO min 7.510 max 7.660 mean 7.596
CSR min 14.410 max 16.290 mean 15.267
CPU PAR min 1.238 max 1.774 mean 1.534
H min 9.447 max* 9.603 mean 9.576
Row-Column-Permute
CPU COO min 0.738 max 1.950 mean 1.071
CPU CSR min 2.522 max 2.709 mean 2.675
GPU 64 COO min 7.600 max 7.690 mean 7.641
CSR min 15.820 max 17.190 mean 16.572
CPU PAR min 0.891 max 0.944 mean 0.924
H min 9.255 max 9.258 mean 9.256
ex19.mtx
Regular
CPU COO min 0.732 max* 1.837 mean 1.076
CPU CSR min 2.563 max* 2.586 mean 2.577
GPU 64 COO min 11.340 max*11.860 mean 11.441
CSR min 36.010 max*40.960 mean 38.048
CPU PAR min 2.019 max 2.204 mean 2.130
H min 8.228 max 8.228 mean 8.228
Row-Premute
CPU COO min 0.718 max 0.751 mean 0.732
CPU CSR min 2.488 max 2.507 mean 2.498
GPU 64 COO min 10.810 max 11.090 mean 10.949
CSR min 24.860 max 26.410 mean 25.527
CPU PAR min 1.978 max 2.290 mean 2.135
H min 11.836 max 11.840 mean 11.838
Row-Gradient
CPU COO min 0.722 max 1.794 mean 0.769
CPU CSR min 2.407 max 2.421 mean 2.416
GPU 64 COO min 11.210 max 11.480 mean 11.317
CSR min 31.920 max 34.690 mean 33.246
CPU PAR min 2.184 max* 2.302 mean 2.232
H min 10.742 max 10.757 mean 10.748
Column-Gradient
CPU COO min 0.720 max 0.916 mean 0.742
CPU CSR min 2.395 max 2.410 mean 2.402
GPU 64 COO min 10.840 max 11.070 mean 10.946
CSR min 24.340 max 26.140 mean 25.393
CPU PAR min 2.184 max 2.272 mean 2.223
H min 11.873 max 11.882 mean 11.878
Row-Column-Permute
CPU COO min 0.707 max 0.748 mean 0.714
CPU CSR min 2.458 max 2.511 mean 2.506
GPU 64 COO min 10.880 max 11.070 mean 10.957
CSR min 24.890 max 26.490 mean 25.642
CPU PAR min 2.209 max 2.282 mean 2.240
H min 11.834 max*11.840 mean 11.838
brainpc2.mtx
Regular
CPU COO min 0.732 max 0.751 mean 0.744
CPU CSR min 2.885 max* 2.916 mean 2.909
GPU 64 COO min 0.000 max 0.000 mean 0.000
CSR min 0.000 max 0.000 mean 0.000
CPU PAR min 1.276 max 1.299 mean 1.286
H min 7.478 max 7.478 mean 7.478
Row-Premute
CPU COO min 0.727 max 0.855 mean 0.736
CPU CSR min 2.385 max 2.411 mean 2.397
GPU 64 COO min 8.120 max 8.410 mean 8.206
CSR min 18.670 max 19.960 mean 19.536
CPU PAR min 1.293 max 1.340 mean 1.314
H min 9.809 max 9.813 mean 9.811
Row-Gradient
CPU COO min 0.696 max* 1.546 mean 0.785
CPU CSR min 1.361 max 1.420 mean 1.411
GPU 64 COO min 8.190 max* 8.550 mean 8.302
CSR min 18.700 max*21.000 mean 19.890
CPU PAR min 1.435 max 1.666 mean 1.549
H min 9.721 max 9.727 mean 9.723
Column-Gradient
CPU COO min 0.698 max 1.467 mean 0.746
CPU CSR min 1.377 max 1.423 mean 1.414
GPU 64 COO min 8.110 max 8.290 mean 8.187
CSR min 18.090 max 20.190 mean 19.217
CPU PAR min 1.345 max* 1.681 mean 1.518
H min 10.369 max*10.372 mean 10.370
Row-Column-Permute
CPU COO min 0.698 max 1.390 mean 0.788
CPU CSR min 2.387 max 2.410 mean 2.399
GPU 64 COO min 8.120 max 8.260 mean 8.191
CSR min 18.530 max 19.960 mean 19.307
CPU PAR min 1.295 max 1.347 mean 1.319
H min 9.809 max 9.813 mean 9.811
shermanACb.mtx
Regular
CPU COO min 0.712 max 1.201 mean 0.756
CPU CSR min 1.558 max 1.601 mean 1.596
GPU 64 COO min 7.080 max* 7.370 mean 7.184
CSR min 17.580 max*19.480 mean 18.770
CPU PAR min 1.286 max 1.511 mean 1.447
H min 8.600 max 8.600 mean 8.600
Row-Premute
CPU COO min 0.689 max 0.890 mean 0.704
CPU CSR min 1.600 max 1.630 mean 1.618
GPU 64 COO min 7.000 max 7.180 mean 7.061
CSR min 15.760 max 17.240 mean 16.625
CPU PAR min 1.296 max 1.419 mean 1.365
H min 10.376 max 10.380 mean 10.379
Row-Gradient
CPU COO min 0.704 max 1.615 mean 0.806
CPU CSR min 1.355 max 1.370 mean 1.362
GPU 64 COO min 7.020 max 7.160 mean 7.083
CSR min 0.000 max 16.290 mean 15.076
CPU PAR min 1.256 max 1.520 mean 1.405
H min 9.915 max 9.925 mean 9.921
Column-Gradient
CPU COO min 0.702 max* 1.626 mean 0.844
CPU CSR min 1.327 max 1.374 mean 1.364
GPU 64 COO min 6.920 max 7.210 mean 7.030
CSR min 0.000 max 15.260 mean 14.279
CPU PAR min 1.283 max* 1.531 mean 1.385
H min 10.572 max 10.595 mean 10.590
Row-Column-Permute
CPU COO min 0.707 max 1.532 mean 0.924
CPU CSR min 1.606 max* 1.634 mean 1.624
GPU 64 COO min 6.970 max 7.110 mean 7.045
CSR min 15.850 max 17.310 mean 16.783
CPU PAR min 1.286 max 1.406 mean 1.357
H min 10.377 max 10.382 mean 10.379
cvxqp3.mtx
Regular
CPU COO min 0.697 max 0.720 mean 0.712
CPU CSR min 2.624 max* 2.643 mean 2.638
GPU 64 COO min 6.060 max* 6.220 mean 6.121
CSR min 19.450 max*22.710 mean 21.277
CPU PAR min 1.733 max* 1.860 mean 1.804
H min 8.646 max 8.646 mean 8.646
Row-Premute
CPU COO min 0.695 max* 1.577 mean 0.894
CPU CSR min 2.452 max 2.471 mean 2.464
GPU 64 COO min 5.870 max 6.060 mean 5.930
CSR min 17.510 max 19.130 mean 18.516
CPU PAR min 1.723 max 1.833 mean 1.774
H min 11.028 max 11.033 mean 11.030
Row-Gradient
CPU COO min 0.693 max 1.523 mean 0.788
CPU CSR min 1.287 max 1.305 mean 1.296
GPU 64 COO min 5.920 max 6.000 mean 5.962
CSR min 16.810 max 18.410 mean 17.561
CPU PAR min 1.378 max 1.485 mean 1.429
H min 11.061 max 11.069 mean 11.064
Column-Gradient
CPU COO min 0.693 max 1.521 mean 0.772
CPU CSR min 1.291 max 1.302 mean 1.297
GPU 64 COO min 5.900 max 6.060 mean 5.960
CSR min 16.620 max 18.330 mean 17.592
CPU PAR min 1.372 max 1.464 mean 1.409
H min 11.127 max*11.135 mean 11.130
Row-Column-Permute
CPU COO min 0.704 max 1.503 mean 0.875
CPU CSR min 2.447 max 2.468 mean 2.459
GPU 64 COO min 5.880 max 5.980 mean 5.931
CSR min 17.550 max 19.140 mean 18.227
CPU PAR min 1.639 max 1.743 mean 1.704
H min 11.028 max 11.035 mean 11.030
case9.mtx
Regular
CPU COO min 0.721 max* 1.800 mean 1.177
CPU CSR min 3.021 max* 3.046 mean 3.036
GPU 64 COO min 0.000 max 0.000 mean 0.000
CSR min 0.000 max 0.000 mean 0.000
CPU PAR min 1.508 max 1.605 mean 1.573
H min 7.380 max 7.380 mean 7.380
Row-Premute
CPU COO min 0.724 max 1.100 mean 0.765
CPU CSR min 2.581 max* 2.626 mean 2.609
GPU 64 COO min 7.170 max 7.340 mean 7.253
CSR min 17.360 max 18.500 mean 18.014
CPU PAR min 1.494 max* 1.607 mean 1.558
H min 10.043 max 10.047 mean 10.044
Row-Gradient
CPU COO min 0.716 max 1.701 mean 0.804
CPU CSR min 1.824 max 1.840 mean 1.832
GPU 64 COO min 7.220 max* 7.510 mean 7.303
CSR min 17.540 max*20.710 mean 19.302
CPU PAR min 1.384 max 1.593 mean 1.526
H min 9.681 max 9.706 mean 9.694
Column-Gradient
CPU COO min 0.711 max 1.029 mean 0.746
CPU CSR min 1.817 max 1.834 mean 1.827
GPU 64 COO min 7.110 max 7.270 mean 7.193
CSR min 16.530 max 18.590 mean 17.574
CPU PAR min 1.390 max 1.574 mean 1.511
H min 10.612 max*10.659 mean 10.634
Row-Column-Permute
CPU COO min 0.719 max 1.391 mean 0.756
CPU CSR min 2.546 max 2.625 mean 2.611
GPU 64 COO min 7.190 max 7.320 mean 7.248
CSR min 17.500 max 18.640 mean 18.040
CPU PAR min 1.465 max 1.573 mean 1.533
H min 10.041 max 10.046 mean 10.044
TSOPF_FS_b9_c6.mtx
Regular
CPU COO min 0.705 max 0.734 mean 0.718
CPU CSR min 3.028 max* 3.052 mean 3.045
GPU 64 COO min 0.000 max 0.000 mean 0.000
CSR min 0.000 max 0.000 mean 0.000
CPU PAR min 1.528 max* 1.602 mean 1.568
H min 7.380 max 7.380 mean 7.380
Row-Premute
CPU COO min 0.733 max 1.640 mean 0.777
CPU CSR min 2.450 max 2.543 mean 2.525
GPU 64 COO min 7.200 max 7.320 mean 7.268
CSR min 17.420 max 18.540 mean 18.102
CPU PAR min 1.474 max 1.595 mean 1.546
H min 10.042 max 10.046 mean 10.044
Row-Gradient
CPU COO min 0.712 max 0.926 mean 0.750
CPU CSR min 1.819 max 1.846 mean 1.832
GPU 64 COO min 7.210 max* 7.370 mean 7.298
CSR min 17.550 max*20.740 mean 19.089
CPU PAR min 1.256 max 1.554 mean 1.495
H min 9.666 max 9.704 mean 9.690
Column-Gradient
CPU COO min 0.710 max* 1.690 mean 0.791
CPU CSR min 1.813 max 1.836 mean 1.830
GPU 64 COO min 7.130 max 7.310 mean 7.211
CSR min 16.550 max 18.690 mean 17.617
CPU PAR min 1.385 max 1.539 mean 1.506
H min 10.611 max*10.659 mean 10.634
Row-Column-Permute
CPU COO min 0.709 max 1.531 mean 0.963
CPU CSR min 2.506 max 2.648 mean 2.622
GPU 64 COO min 7.140 max 7.330 mean 7.244
CSR min 17.410 max 18.520 mean 18.148
CPU PAR min 1.466 max 1.574 mean 1.528
H min 10.041 max 10.046 mean 10.044
OPF_6000.mtx
Regular
CPU COO min 0.714 max 0.731 mean 0.720
CPU CSR min 2.667 max* 2.770 mean 2.720
GPU 64 COO min 12.310 max*12.550 mean 12.425
CSR min 39.860 max*43.770 mean 42.075
CPU PAR min 1.735 max 1.945 mean 1.845
H min 8.799 max 8.799 mean 8.799
Row-Premute
CPU COO min 0.689 max 0.710 mean 0.695
CPU CSR min 2.358 max 2.413 mean 2.392
GPU 64 COO min 11.430 max 11.770 mean 11.549
CSR min 24.470 max 25.580 mean 24.785
CPU PAR min 1.758 max 1.896 mean 1.829
H min 11.872 max 11.877 mean 11.875
Row-Gradient
CPU COO min 0.716 max 0.775 mean 0.739
CPU CSR min 1.651 max 1.689 mean 1.675
GPU 64 COO min 12.100 max 12.410 mean 12.205
CSR min 31.670 max 34.910 mean 33.370
CPU PAR min 2.079 max* 2.286 mean 2.207
H min 11.111 max 11.116 mean 11.113
Column-Gradient
CPU COO min 0.715 max* 1.021 mean 0.743
CPU CSR min 1.655 max 1.674 mean 1.666
GPU 64 COO min 11.340 max 11.560 mean 11.463
CSR min 23.770 max 25.470 mean 24.489
CPU PAR min 2.056 max 2.172 mean 2.118
H min 12.040 max*12.047 mean 12.043
Row-Column-Permute
CPU COO min 0.677 max 0.785 mean 0.687
CPU CSR min 2.325 max 2.434 mean 2.369
GPU 64 COO min 11.450 max 11.650 mean 11.538
CSR min 24.330 max 25.560 mean 25.008
CPU PAR min 1.631 max 1.776 mean 1.709
H min 11.873 max 11.877 mean 11.875
OPF_3754.mtx
Regular
CPU COO min 0.726 max 0.774 mean 0.747
CPU CSR min 2.898 max* 2.919 mean 2.908
GPU 64 COO min 7.680 max* 7.820 mean 7.766
CSR min 25.070 max*29.030 mean 26.756
CPU PAR min 1.437 max 1.508 mean 1.471
H min 8.393 max 8.393 mean 8.393
Row-Premute
CPU COO min 0.714 max* 1.574 mean 0.817
CPU CSR min 2.686 max 2.711 mean 2.699
GPU 64 COO min 7.410 max 7.570 mean 7.484
CSR min 19.600 max 21.190 mean 20.307
CPU PAR min 1.443 max 1.505 mean 1.469
H min 11.267 max 11.272 mean 11.269
Row-Gradient
CPU COO min 0.723 max 1.232 mean 0.775
CPU CSR min 1.672 max 1.691 mean 1.685
GPU 64 COO min 7.600 max 7.760 mean 7.716
CSR min 23.160 max 25.590 mean 24.304
CPU PAR min 1.675 max* 1.736 mean 1.703
H min 10.463 max 10.472 mean 10.468
Column-Gradient
CPU COO min 0.726 max 1.431 mean 0.778
CPU CSR min 1.671 max 1.685 mean 1.679
GPU 64 COO min 7.410 max 7.530 mean 7.467
CSR min 18.140 max 20.350 mean 19.315
CPU PAR min 1.650 max 1.736 mean 1.699
H min 11.393 max*11.401 mean 11.397
Row-Column-Permute
CPU COO min 0.711 max 1.458 mean 0.751
CPU CSR min 2.678 max 2.717 mean 2.700
GPU 64 COO min 7.400 max 7.540 mean 7.471
CSR min 19.560 max 21.150 mean 20.453
CPU PAR min 1.440 max 1.499 mean 1.467
H min 11.266 max 11.272 mean 11.269
c-47.mtx
Regular
CPU COO min 0.754 max* 1.829 mean 1.204
CPU CSR min 2.610 max* 2.624 mean 2.618
GPU 64 COO min 9.530 max* 9.870 mean 9.640
CSR min 23.990 max*25.910 mean 24.992
CPU PAR min 1.311 max 1.380 mean 1.357
H min 8.364 max 8.364 mean 8.364
Row-Premute
CPU COO min 0.740 max 0.885 mean 0.755
CPU CSR min 2.574 max 2.611 mean 2.597
GPU 64 COO min 9.320 max 9.510 mean 9.397
CSR min 19.960 max 21.190 mean 20.696
CPU PAR min 1.303 max 1.371 mean 1.345
H min 10.059 max 10.062 mean 10.061
Row-Gradient
CPU COO min 0.723 max 0.984 mean 0.753
CPU CSR min 1.781 max 1.809 mean 1.803
GPU 64 COO min 9.380 max 9.660 mean 9.464
CSR min 15.770 max 19.090 mean 18.037
CPU PAR min 1.775 max* 1.924 mean 1.868
H min 10.205 max 10.233 mean 10.219
Column-Gradient
CPU COO min 0.715 max 0.926 mean 0.757
CPU CSR min 1.729 max 1.802 mean 1.791
GPU 64 COO min 9.080 max 9.270 mean 9.158
CSR min 13.980 max 15.780 mean 14.938
CPU PAR min 1.751 max 1.906 mean 1.846
H min 11.213 max*11.232 mean 11.222
Row-Column-Permute
CPU COO min 0.732 max 1.598 mean 0.785
CPU CSR min 2.594 max 2.602 mean 2.599
GPU 64 COO min 9.340 max 9.460 mean 9.394
CSR min 19.950 max 21.500 mean 20.544
CPU PAR min 1.326 max 1.374 mean 1.354
H min 10.059 max 10.062 mean 10.061
mhd4800a.mtx
Regular
CPU COO min 0.759 max 0.795 mean 0.780
CPU CSR min 2.479 max* 2.565 mean 2.557
GPU 64 COO min 5.490 max* 5.650 mean 5.552
CSR min 16.700 max 19.460 mean 18.004
CPU PAR min 1.456 max* 1.523 mean 1.492
H min 7.132 max 7.132 mean 7.132
Row-Premute
CPU COO min 0.695 max 0.943 mean 0.726
CPU CSR min 2.480 max 2.488 mean 2.485
GPU 64 COO min 5.410 max 5.490 mean 5.453
CSR min 15.700 max 17.520 mean 16.678
CPU PAR min 1.422 max 1.514 mean 1.474
H min 10.959 max 10.966 mean 10.963
Row-Gradient
CPU COO min 0.723 max* 2.029 mean 0.990
CPU CSR min 2.411 max 2.427 mean 2.421
GPU 64 COO min 5.490 max 5.560 mean 5.534
CSR min 16.350 max*19.560 mean 17.784
CPU PAR min 1.441 max 1.509 mean 1.477
H min 9.512 max 9.526 mean 9.520
Column-Gradient
CPU COO min 0.721 max 1.802 mean 0.871
CPU CSR min 2.393 max 2.408 mean 2.404
GPU 64 COO min 5.410 max 5.480 mean 5.453
CSR min 15.680 max 17.870 mean 16.540
CPU PAR min 1.429 max 1.488 mean 1.468
H min 10.931 max 10.945 mean 10.938
Row-Column-Permute
CPU COO min 0.728 max 1.646 mean 1.037
CPU CSR min 2.472 max 2.488 mean 2.480
GPU 64 COO min 5.410 max 5.480 mean 5.449
CSR min 15.760 max 17.560 mean 16.654
CPU PAR min 1.428 max 1.513 mean 1.474
H min 10.959 max*10.967 mean 10.963
gen4.mtx
Regular
CPU COO min 0.737 max 1.977 mean 1.431
CPU CSR min 2.674 max 2.688 mean 2.681
GPU 64 COO min 5.900 max 6.000 mean 5.954
CSR min 13.650 max 15.410 mean 14.657
CPU PAR min 1.468 max 1.521 mean 1.491
H min 9.234 max 9.234 mean 9.234
Row-Premute
CPU COO min 0.740 max* 2.048 mean 1.121
CPU CSR min 2.777 max 2.798 mean 2.790
GPU 64 COO min 5.910 max 5.970 mean 5.944
CSR min 13.700 max 15.370 mean 14.541
CPU PAR min 1.468 max 1.546 mean 1.502
H min 10.250 max 10.255 mean 10.252
Row-Gradient
CPU COO min 0.740 max 1.790 mean 0.994
CPU CSR min 2.663 max 2.682 mean 2.674
GPU 64 COO min 5.890 max* 6.160 mean 5.946
CSR min 13.780 max*17.520 mean 15.601
CPU PAR min 1.479 max* 1.619 mean 1.569
H min 9.939 max 9.955 mean 9.948
Column-Gradient
CPU COO min 0.743 max 1.991 mean 0.981
CPU CSR min 2.620 max 2.654 mean 2.646
GPU 64 COO min 5.840 max 5.910 mean 5.885
CSR min 13.130 max 17.040 mean 15.008
CPU PAR min 1.477 max 1.607 mean 1.559
H min 10.858 max*10.876 mean 10.864
Row-Column-Permute
CPU COO min 0.742 max 2.010 mean 1.124
CPU CSR min 2.789 max* 2.800 mean 2.795
GPU 64 COO min 5.900 max 5.980 mean 5.941
CSR min 13.640 max 15.410 mean 14.556
CPU PAR min 1.462 max 1.540 mean 1.504
H min 10.250 max 10.253 mean 10.252
Maragal_6.mtx
Regular
CPU COO min 0.725 max 0.741 mean 0.729
CPU CSR min 2.345 max 2.409 mean 2.372
GPU 64 COO min 18.200 max 18.770 mean 18.357
CSR min 38.310 max*40.240 mean 39.477
CPU PAR min 0.789 max 0.813 mean 0.797
H min 9.930 max 9.930 mean 9.930
Row-Premute
CPU COO min 0.709 max 0.779 mean 0.715
CPU CSR min 2.675 max 2.715 mean 2.696
GPU 64 COO min 17.810 max 18.030 mean 17.935
CSR min 29.650 max 30.580 mean 30.109
CPU PAR min 0.857 max 0.940 mean 0.904
H min 10.777 max 10.779 mean 10.778
Row-Gradient
CPU COO min 0.710 max* 1.566 mean 0.755
CPU CSR min 2.042 max 2.159 mean 2.120
GPU 64 COO min 18.460 max*18.960 mean 18.665
CSR min 25.650 max 27.330 mean 26.549
CPU PAR min 2.257 max 2.612 mean 2.416
H min 11.251 max 11.301 mean 11.285
Column-Gradient
CPU COO min 0.711 max 0.743 mean 0.725
CPU CSR min 2.036 max 2.161 mean 2.110
GPU 64 COO min 17.840 max 18.860 mean 18.149
CSR min 19.410 max 20.690 mean 20.066
CPU PAR min 2.174 max* 2.546 mean 2.349
H min 12.011 max*12.072 mean 12.052
Row-Column-Permute
CPU COO min 0.712 max 0.971 mean 0.737
CPU CSR min 2.732 max* 2.751 mean 2.743
GPU 64 COO min 17.720 max 18.070 mean 17.911
CSR min 29.600 max 30.500 mean 29.961
CPU PAR min 0.827 max 0.954 mean 0.913
H min 10.776 max 10.778 mean 10.777
aft01.mtx
Regular
CPU COO min 0.735 max* 2.079 mean 1.069
CPU CSR min 3.132 max* 3.154 mean 3.145
GPU 64 COO min 6.390 max* 6.610 mean 6.457
CSR min 19.990 max*23.250 mean 21.820
CPU PAR min 1.746 max* 1.865 mean 1.812
H min 7.811 max 7.811 mean 7.811
Row-Premute
CPU COO min 0.714 max 1.648 mean 0.840
CPU CSR min 2.864 max 2.892 mean 2.883
GPU 64 COO min 6.280 max 6.380 mean 6.329
CSR min 17.980 max 19.700 mean 19.105
CPU PAR min 1.729 max 1.850 mean 1.782
H min 11.162 max 11.168 mean 11.165
Row-Gradient
CPU COO min 0.735 max 1.806 mean 0.878
CPU CSR min 2.706 max 2.744 mean 2.726
GPU 64 COO min 6.390 max 6.500 mean 6.433
CSR min 19.780 max 22.870 mean 20.936
CPU PAR min 1.710 max 1.865 mean 1.785
H min 10.251 max 10.267 mean 10.257
Column-Gradient
CPU COO min 0.728 max 1.792 mean 0.986
CPU CSR min 2.521 max 2.720 mean 2.703
GPU 64 COO min 6.280 max 6.370 mean 6.327
CSR min 18.000 max 19.720 mean 19.040
CPU PAR min 1.649 max 1.741 mean 1.702
H min 11.113 max 11.121 mean 11.117
Row-Column-Permute
CPU COO min 0.714 max 1.525 mean 0.957
CPU CSR min 2.876 max 2.892 mean 2.884
GPU 64 COO min 6.280 max 6.370 mean 6.322
CSR min 17.960 max 19.670 mean 18.670
CPU PAR min 1.667 max 1.754 mean 1.710
H min 11.162 max*11.168 mean 11.165
TSOPF_RS_b39_c7.mtx
Regular
CPU COO min 0.771 max 0.793 mean 0.780
CPU CSR min 3.219 max* 3.232 mean 3.227
GPU 64 COO min 11.070 max*11.200 mean 11.142
CSR min 37.050 max*42.100 mean 39.040
CPU PAR min 1.910 max 2.027 mean 1.982
H min 7.304 max 7.304 mean 7.304
Row-Premute
CPU COO min 0.701 max 0.722 mean 0.707
CPU CSR min 2.931 max 2.952 mean 2.942
GPU 64 COO min 10.860 max 11.030 mean 10.928
CSR min 28.730 max 30.880 mean 29.483
CPU PAR min 1.760 max 1.922 mean 1.851
H min 10.537 max 10.541 mean 10.539
Row-Gradient
CPU COO min 0.747 max 0.808 mean 0.757
CPU CSR min 2.606 max 2.648 mean 2.624
GPU 64 COO min 10.850 max 11.120 mean 10.999
CSR min 33.910 max 37.600 mean 35.909
CPU PAR min 2.154 max* 2.245 mean 2.203
H min 9.636 max 9.646 mean 9.642
Column-Gradient
CPU COO min 0.718 max* 1.693 mean 0.802
CPU CSR min 2.502 max 2.585 mean 2.547
GPU 64 COO min 10.700 max 10.990 mean 10.804
CSR min 27.230 max 29.380 mean 28.488
CPU PAR min 2.128 max 2.227 mean 2.172
H min 11.131 max*11.222 mean 11.208
Row-Column-Permute
CPU COO min 0.709 max 0.726 mean 0.716
CPU CSR min 2.917 max 2.958 mean 2.940
GPU 64 COO min 10.840 max 11.030 mean 10.930
CSR min 28.780 max 30.810 mean 29.578
CPU PAR min 1.757 max 1.834 mean 1.792
H min 10.537 max 10.540 mean 10.539
10. Ellesmere
aft01.mtx
Regular
GPU 64 COO min 4.080 max* 4.280 mean 4.186
CSR min 9.660 max*12.660 mean 11.485
H min 7.811 max 7.811 mean 7.811
Row-Premute
GPU 64 COO min 3.860 max 4.090 mean 4.001
CSR min 9.520 max 10.340 mean 9.936
H min 11.161 max 11.167 mean 11.165
Row-Gradient
GPU 64 COO min 4.010 max 4.240 mean 4.135
CSR min 5.890 max 11.350 mean 6.882
H min 10.246 max 10.262 mean 10.256
Column-Gradient
GPU 64 COO min 3.850 max 4.100 mean 4.012
CSR min 5.460 max 8.790 mean 6.005
H min 11.112 max 11.122 mean 11.117
Row-Column-Permute
GPU 64 COO min 3.850 max 4.080 mean 3.990
CSR min 5.420 max 6.760 mean 5.977
H min 11.162 max*11.169 mean 11.165
bloweya.mtx
Regular
GPU 64 COO min 0.000 max 0.000 mean 0.000
CSR min 0.000 max 0.000 mean 0.000
H min 7.205 max 7.205 mean 7.205
Row-Premute
GPU 64 COO min 3.800 max 3.940 mean 3.875
CSR min 3.710 max 4.570 mean 4.399
H min 11.025 max 11.031 mean 11.028
Row-Gradient
GPU 64 COO min 3.800 max* 4.120 mean 3.962
CSR min 4.340 max* 4.670 mean 4.546
H min 10.296 max 10.307 mean 10.300
Column-Gradient
GPU 64 COO min 3.880 max 4.100 mean 3.978
CSR min 4.240 max 4.570 mean 4.412
H min 10.881 max 10.886 mean 10.883
Row-Column-Permute
GPU 64 COO min 3.800 max 3.980 mean 3.885
CSR min 4.130 max 4.540 mean 4.399
H min 11.025 max*11.033 mean 11.029
brainpc2.mtx
Regular
GPU 64 COO min 0.000 max 0.000 mean 0.000
CSR min 0.000 max 0.000 mean 0.000
H min 7.478 max 7.478 mean 7.478
Row-Premute
GPU 64 COO min 3.840 max* 6.750 mean 4.110
CSR min 4.260 max* 4.500 mean 4.437
H min 9.809 max 9.813 mean 9.811
Row-Gradient
GPU 64 COO min 0.640 max 4.030 mean 3.864
CSR min 4.270 max 4.470 mean 4.383
H min 9.722 max 9.727 mean 9.724
Column-Gradient
GPU 64 COO min 0.640 max 4.070 mean 3.898
CSR min 4.230 max 4.500 mean 4.386
H min 10.368 max*10.372 mean 10.370
Row-Column-Permute
GPU 64 COO min 3.980 max 4.110 mean 4.027
CSR min 4.320 max 4.490 mean 4.437
H min 9.809 max 9.813 mean 9.811
c-47.mtx
Regular
GPU 64 COO min 3.980 max* 4.080 mean 4.026
CSR min 4.760 max 4.850 mean 4.812
H min 8.364 max 8.364 mean 8.364
Row-Premute
GPU 64 COO min 3.880 max 4.010 mean 3.942
CSR min 4.040 max 4.900 mean 4.807
H min 10.059 max 10.063 mean 10.061
Row-Gradient
GPU 64 COO min 3.900 max 4.050 mean 3.976
CSR min 4.380 max 4.740 mean 4.630
H min 10.201 max 10.228 mean 10.214
Column-Gradient
GPU 64 COO min 3.860 max 3.990 mean 3.936
CSR min 4.350 max 4.610 mean 4.525
H min 11.204 max*11.241 mean 11.222
Row-Column-Permute
GPU 64 COO min 3.890 max 4.020 mean 3.953
CSR min 4.490 max* 4.920 mean 4.840
H min 10.058 max 10.063 mean 10.061
case9.mtx
Regular
GPU 64 COO min 0.000 max 0.000 mean 0.000
CSR min 0.000 max 0.000 mean 0.000
H min 7.380 max 7.380 mean 7.380
Row-Premute
GPU 64 COO min 4.820 max 4.940 mean 4.859
CSR min 5.080 max 6.520 mean 6.342
H min 10.042 max 10.047 mean 10.044
Row-Gradient
GPU 64 COO min 4.810 max* 4.940 mean 4.876
CSR min 6.100 max* 6.560 mean 6.307
H min 9.681 max 9.704 mean 9.694
Column-Gradient
GPU 64 COO min 4.810 max 4.930 mean 4.869
CSR min 4.820 max 6.460 mean 6.208
H min 10.554 max*10.661 mean 10.638
Row-Column-Permute
GPU 64 COO min 4.810 max 4.940 mean 4.864
CSR min 5.930 max 6.520 mean 6.379
H min 10.041 max 10.047 mean 10.044
cvxqp3.mtx
Regular
GPU 64 COO min 3.350 max* 3.590 mean 3.483
CSR min 5.430 max* 9.260 mean 8.333
H min 8.646 max 8.646 mean 8.646
Row-Premute
GPU 64 COO min 3.230 max 3.480 mean 3.371
CSR min 7.560 max 8.220 mean 7.900
H min 11.027 max 11.033 mean 11.030
Row-Gradient
GPU 64 COO min 3.240 max 3.510 mean 3.396
CSR min 6.990 max 7.890 mean 7.574
H min 11.060 max 11.069 mean 11.064
Column-Gradient
GPU 64 COO min 3.240 max 3.480 mean 3.374
CSR min 6.980 max 7.900 mean 7.557
H min 11.126 max*11.134 mean 11.130
Row-Column-Permute
GPU 64 COO min 3.110 max 3.470 mean 3.365
CSR min 4.810 max 8.210 mean 7.742
H min 11.026 max 11.032 mean 11.030
ex19.mtx
Regular
GPU 64 COO min 2.450 max* 2.610 mean 2.564
CSR min 4.490 max 4.760 mean 4.714
H min 8.228 max 8.228 mean 8.228
Row-Premute
GPU 64 COO min 2.000 max 2.040 mean 2.021
CSR min 4.640 max 4.780 mean 4.733
H min 11.835 max 11.840 mean 11.838
Row-Gradient
GPU 64 COO min 2.240 max 2.390 mean 2.329
CSR min 4.570 max* 4.850 mean 4.807
H min 10.742 max 10.752 mean 10.747
Column-Gradient
GPU 64 COO min 2.010 max 2.050 mean 2.034
CSR min 4.570 max 4.760 mean 4.701
H min 11.872 max*11.881 mean 11.878
Row-Column-Permute
GPU 64 COO min 2.000 max 2.040 mean 2.023
CSR min 0.770 max 4.780 mean 4.594
H min 11.835 max 11.840 mean 11.838
gen4.mtx
Regular
GPU 64 COO min 4.880 max 4.980 mean 4.900
CSR min 10.020 max*11.300 mean 10.716
H min 9.234 max 9.234 mean 9.234
Row-Premute
GPU 64 COO min 4.860 max 4.930 mean 4.890
CSR min 0.330 max 11.200 mean 10.038
H min 10.249 max 10.254 mean 10.252
Row-Gradient
GPU 64 COO min 4.860 max* 4.990 mean 4.908
CSR min 9.160 max 11.240 mean 10.435
H min 9.939 max 9.961 mean 9.947
Column-Gradient
GPU 64 COO min 4.780 max 4.880 mean 4.816
CSR min 7.770 max 10.570 mean 9.407
H min 10.851 max*10.876 mean 10.864
Row-Column-Permute
GPU 64 COO min 4.850 max 4.950 mean 4.886
CSR min 10.220 max 11.280 mean 10.748
H min 10.250 max 10.255 mean 10.252
lp_fit2d.mtx
Regular
GPU 64 COO min 4.360 max* 4.640 mean 4.515
CSR min 10.080 max 10.900 mean 10.491
H min 11.109 max 11.109 mean 11.109
Row-Premute
GPU 64 COO min 4.170 max 4.630 mean 4.476
CSR min 0.910 max 10.910 mean 10.257
H min 11.098 max 11.104 mean 11.101
Row-Gradient
GPU 64 COO min 4.370 max 4.630 mean 4.529
CSR min 10.030 max 10.970 mean 10.624
H min 11.109 max 11.109 mean 11.109
Column-Gradient
GPU 64 COO min 4.250 max 4.640 mean 4.499
CSR min 8.510 max*11.010 mean 10.505
H min 11.328 max*11.333 mean 11.331
Row-Column-Permute
GPU 64 COO min 4.350 max 4.640 mean 4.511
CSR min 10.040 max 10.790 mean 10.468
H min 11.097 max 11.106 mean 11.101
lp_osa_07.mtx
Regular
GPU 64 COO min 0.460 max* 3.640 mean 3.456
CSR min 5.570 max* 8.530 mean 8.106
H min 8.412 max 8.412 mean 8.412
Row-Premute
GPU 64 COO min 3.140 max 3.450 mean 3.367
CSR min 7.600 max 8.070 mean 7.853
H min 9.255 max 9.258 mean 9.256
Row-Gradient
GPU 64 COO min 3.190 max 3.610 mean 3.509
CSR min 0.000 max 8.260 mean 7.597
H min 8.583 max 8.678 mean 8.670
Column-Gradient
GPU 64 COO min 3.330 max 3.500 mean 3.416
CSR min 6.730 max 7.540 mean 7.199
H min 9.542 max* 9.604 mean 9.581
Row-Column-Permute
GPU 64 COO min 3.290 max 3.430 mean 3.365
CSR min 7.390 max 8.060 mean 7.832
H min 9.255 max 9.258 mean 9.256
Maragal_6.mtx
Regular
GPU 64 COO min 4.160 max 4.310 mean 4.217
CSR min 4.940 max 4.960 mean 4.956
H min 9.930 max 9.930 mean 9.930
Row-Premute
GPU 64 COO min 4.220 max 4.240 mean 4.225
CSR min 4.750 max*13.040 mean 5.133
H min 10.776 max 10.778 mean 10.777
Row-Gradient
GPU 64 COO min 4.180 max* 4.450 mean 4.245
CSR min 4.880 max 4.940 mean 4.915
H min 11.259 max*11.302 mean 11.281
Column-Gradient
GPU 64 COO min 4.200 max 4.250 mean 4.236
CSR min 4.800 max 4.890 mean 4.859
H min 12.022 max 12.073 mean 12.051
Row-Column-Permute
GPU 64 COO min 4.210 max 4.230 mean 4.222
CSR min 4.860 max 4.890 mean 4.887
H min 10.776 max 10.778 mean 10.778
mhd4800a.mtx
Regular
GPU 64 COO min 4.570 max* 4.710 mean 4.608
CSR min 12.690 max*13.940 mean 13.369
H min 7.132 max 7.132 mean 7.132
Row-Premute
GPU 64 COO min 4.420 max 4.520 mean 4.445
CSR min 10.520 max 10.880 mean 10.696
H min 10.960 max*10.968 mean 10.963
Row-Gradient
GPU 64 COO min 4.570 max 4.690 mean 4.605
CSR min 4.550 max 13.350 mean 12.479
H min 9.508 max 9.527 mean 9.520
Column-Gradient
GPU 64 COO min 4.430 max 4.530 mean 4.461
CSR min 10.250 max 10.940 mean 10.603
H min 10.934 max 10.945 mean 10.939
Row-Column-Permute
GPU 64 COO min 4.420 max 4.520 mean 4.450
CSR min 7.380 max 10.900 mean 10.598
H min 10.959 max 10.967 mean 10.963
mult_dcop_01.mtx
Regular
GPU 64 COO min 3.420 max 3.630 mean 3.555
CSR min 3.650 max 4.090 mean 3.814
H min 9.689 max 9.689 mean 9.689
Row-Premute
GPU 64 COO min 3.450 max 3.580 mean 3.521
CSR min 3.610 max 4.150 mean 3.785
H min 10.738 max 10.742 mean 10.740
Row-Gradient
GPU 64 COO min 3.510 max* 3.660 mean 3.579
CSR min 3.650 max 4.160 mean 3.806
H min 10.576 max 10.585 mean 10.580
Column-Gradient
GPU 64 COO min 3.460 max 3.650 mean 3.584
CSR min 3.660 max* 4.240 mean 3.799
H min 10.826 max*10.842 mean 10.836
Row-Column-Permute
GPU 64 COO min 3.470 max 3.580 mean 3.532
CSR min 3.600 max 3.980 mean 3.743
H min 10.738 max 10.742 mean 10.740
mult_dcop_02.mtx
Regular
GPU 64 COO min 3.390 max 3.660 mean 3.585
CSR min 0.960 max 4.330 mean 4.162
H min 9.689 max 9.689 mean 9.689
Row-Premute
GPU 64 COO min 3.310 max 3.600 mean 3.488
CSR min 0.620 max 4.290 mean 4.132
H min 10.738 max 10.743 mean 10.740
Row-Gradient
GPU 64 COO min 3.310 max* 3.670 mean 3.593
CSR min 4.130 max* 4.430 mean 4.331
H min 10.576 max 10.584 mean 10.580
Column-Gradient
GPU 64 COO min 0.550 max 3.660 mean 3.486
CSR min 3.890 max 4.410 mean 4.275
H min 10.831 max*10.843 mean 10.836
Row-Column-Permute
GPU 64 COO min 3.470 max 3.590 mean 3.542
CSR min 4.190 max 4.290 mean 4.242
H min 10.738 max 10.742 mean 10.740
mult_dcop_03.mtx
Regular
GPU 64 COO min 3.360 max* 3.660 mean 3.550
CSR min 3.650 max 4.090 mean 3.813
H min 9.689 max 9.689 mean 9.689
Row-Premute
GPU 64 COO min 3.450 max 3.580 mean 3.521
CSR min 3.610 max 4.160 mean 3.784
H min 10.738 max 10.743 mean 10.740
Row-Gradient
GPU 64 COO min 3.470 max 3.660 mean 3.572
CSR min 3.640 max 4.190 mean 3.809
H min 10.572 max 10.584 mean 10.580
Column-Gradient
GPU 64 COO min 3.430 max 3.650 mean 3.562
CSR min 3.670 max* 4.290 mean 3.793
H min 10.828 max*10.840 mean 10.834
Row-Column-Permute
GPU 64 COO min 3.370 max 3.610 mean 3.502
CSR min 3.610 max 3.970 mean 3.744
H min 10.738 max 10.741 mean 10.740
OPF_3754.mtx
Regular
GPU 64 COO min 4.700 max* 4.930 mean 4.842
CSR min 6.230 max* 6.600 mean 6.411
H min 8.393 max 8.393 mean 8.393
Row-Premute
GPU 64 COO min 4.620 max 4.890 mean 4.787
CSR min 5.780 max 6.310 mean 6.192
H min 11.265 max 11.272 mean 11.269
Row-Gradient
GPU 64 COO min 4.570 max 4.870 mean 4.776
CSR min 5.770 max 6.510 mean 6.302
H min 10.464 max 10.473 mean 10.468
Column-Gradient
GPU 64 COO min 4.580 max 4.870 mean 4.756
CSR min 5.630 max 6.180 mean 6.055
H min 11.394 max*11.401 mean 11.397
Row-Column-Permute
GPU 64 COO min 4.610 max 4.900 mean 4.780
CSR min 5.010 max 6.300 mean 6.113
H min 11.268 max 11.272 mean 11.270
OPF_6000.mtx
Regular
GPU 64 COO min 3.780 max* 3.920 mean 3.864
CSR min 4.270 max 4.360 mean 4.332
H min 8.799 max 8.799 mean 8.799
Row-Premute
GPU 64 COO min 3.770 max 3.870 mean 3.821
CSR min 3.970 max*11.050 mean 4.439
H min 11.872 max 11.877 mean 11.875
Row-Gradient
GPU 64 COO min 3.700 max 3.870 mean 3.795
CSR min 4.330 max 4.440 mean 4.403
H min 11.109 max 11.116 mean 11.113
Column-Gradient
GPU 64 COO min 3.690 max 3.870 mean 3.804
CSR min 4.260 max 4.340 mean 4.308
H min 12.041 max*12.045 mean 12.043
Row-Column-Permute
GPU 64 COO min 3.780 max 3.860 mean 3.819
CSR min 4.090 max 4.290 mean 4.259
H min 11.873 max 11.877 mean 11.876
shermanACb.mtx
Regular
GPU 64 COO min 2.920 max* 3.140 mean 3.048
CSR min 5.550 max 5.980 mean 5.803
H min 8.600 max 8.600 mean 8.600
Row-Premute
GPU 64 COO min 2.760 max 3.020 mean 2.898
CSR min 2.660 max 5.830 mean 5.632
H min 10.377 max 10.381 mean 10.379
Row-Gradient
GPU 64 COO min 2.800 max 3.040 mean 2.944
CSR min 5.330 max* 6.020 mean 5.742
H min 9.919 max 9.925 mean 9.922
Column-Gradient
GPU 64 COO min 2.720 max 3.010 mean 2.926
CSR min 0.000 max 5.840 mean 5.513
H min 10.587 max*10.596 mean 10.591
Row-Column-Permute
GPU 64 COO min 2.780 max 3.030 mean 2.939
CSR min 4.860 max 5.810 mean 5.667
H min 10.376 max 10.382 mean 10.379
TSOPF_FS_b9_c6.mtx
Regular
GPU 64 COO min 0.000 max 0.000 mean 0.000
CSR min 0.000 max 0.000 mean 0.000
H min 7.380 max 7.380 mean 7.380
Row-Premute
GPU 64 COO min 4.540 max 4.940 mean 4.874
CSR min 6.280 max 6.520 mean 6.403
H min 10.042 max 10.047 mean 10.044
Row-Gradient
GPU 64 COO min 4.830 max 4.930 mean 4.875
CSR min 5.790 max* 6.560 mean 6.289
H min 9.675 max 9.706 mean 9.692
Column-Gradient
GPU 64 COO min 4.790 max* 4.960 mean 4.880
CSR min 5.760 max 6.450 mean 6.204
H min 10.601 max*10.661 mean 10.626
Row-Column-Permute
GPU 64 COO min 4.330 max 4.950 mean 4.845
CSR min 5.740 max 6.500 mean 6.375
H min 10.041 max 10.046 mean 10.044
TSOPF_RS_b39_c7.mtx
Regular
GPU 64 COO min 4.300 max* 4.430 mean 4.364
CSR min 4.480 max 4.750 mean 4.716
H min 7.304 max 7.304 mean 7.304
Row-Premute
GPU 64 COO min 4.260 max 4.400 mean 4.353
CSR min 4.490 max 4.770 mean 4.734
H min 10.536 max 10.541 mean 10.539
Row-Gradient
GPU 64 COO min 3.970 max 4.420 mean 4.338
CSR min 4.620 max* 4.820 mean 4.789
H min 9.638 max 9.644 mean 9.641
Column-Gradient
GPU 64 COO min 4.240 max 4.430 mean 4.368
CSR min 4.710 max 4.770 mean 4.736
H min 11.129 max*11.222 mean 11.205
Row-Column-Permute
GPU 64 COO min 4.260 max 4.410 mean 4.359
CSR min 4.660 max 4.760 mean 4.738
H min 10.537 max 10.541 mean 10.539
11. Fiji
mult_dcop_03.mtx
Regular
GPU 64 COO min 5.140 max* 5.140 mean 5.140
CSR min 10.340 max*10.390 mean 10.365
H min 9.689 max 9.689 mean 9.689
Row-Premute
GPU 64 COO min 4.970 max 4.990 mean 4.980
CSR min 9.420 max 9.430 mean 9.425
H min 10.739 max 10.739 mean 10.739
Row-Gradient
GPU 64 COO min 5.080 max 5.090 mean 5.085
CSR min 9.720 max 10.300 mean 10.010
H min 10.579 max 10.582 mean 10.580
Column-Gradient
GPU 64 COO min 5.030 max 5.120 mean 5.075
CSR min 9.330 max 9.770 mean 9.550
H min 10.835 max*10.838 mean 10.836
Row-Column-Permute
GPU 64 COO min 5.000 max 5.010 mean 5.005
CSR min 7.580 max 9.460 mean 8.520
H min 10.739 max 10.741 mean 10.740
mult_dcop_03.mtx
Regular
GPU 64 COO min 5.130 max* 5.220 mean 5.142
CSR min 7.250 max* 9.320 mean 7.722
H min 9.689 max 9.689 mean 9.689
Row-Premute
GPU 64 COO min 4.980 max 5.030 mean 4.999
CSR min 6.460 max 8.470 mean 6.950
H min 10.738 max 10.742 mean 10.740
Row-Gradient
GPU 64 COO min 5.070 max 5.140 mean 5.088
CSR min 6.780 max 8.700 mean 7.268
H min 10.572 max 10.584 mean 10.580
Column-Gradient
GPU 64 COO min 4.980 max 5.030 mean 5.010
CSR min 6.390 max 7.640 mean 6.982
H min 10.825 max*10.845 mean 10.836
Row-Column-Permute
GPU 64 COO min 4.990 max 5.010 mean 4.997
CSR min 6.300 max 7.160 mean 6.636
H min 10.738 max 10.743 mean 10.740
mult_dcop_01.mtx
Regular
GPU 64 COO min 5.120 max* 5.140 mean 5.134
CSR min 6.990 max* 9.230 mean 7.546
H min 9.689 max 9.689 mean 9.689
Row-Premute
GPU 64 COO min 4.990 max 5.020 mean 5.004
CSR min 6.370 max 7.220 mean 6.771
H min 10.738 max 10.743 mean 10.740
Row-Gradient
GPU 64 COO min 5.060 max 5.100 mean 5.082
CSR min 6.730 max 7.720 mean 7.317
H min 10.574 max 10.585 mean 10.580
Column-Gradient
GPU 64 COO min 4.980 max 5.100 mean 5.012
CSR min 6.580 max 7.510 mean 7.054
H min 10.828 max*10.842 mean 10.835
Row-Column-Permute
GPU 64 COO min 4.970 max 5.000 mean 4.986
CSR min 6.390 max 7.050 mean 6.677
H min 10.738 max 10.742 mean 10.740
mult_dcop_02.mtx
Regular
GPU 64 COO min 5.120 max 5.140 mean 5.133
CSR min 6.950 max 7.590 mean 7.336
H min 9.689 max 9.689 mean 9.689
Row-Premute
GPU 64 COO min 4.970 max 4.990 mean 4.984
CSR min 6.440 max 7.110 mean 6.719
H min 10.738 max 10.742 mean 10.740
Row-Gradient
GPU 64 COO min 5.070 max* 5.150 mean 5.086
CSR min 6.650 max* 7.930 mean 7.304
H min 10.574 max 10.587 mean 10.580
Column-Gradient
GPU 64 COO min 4.980 max 5.040 mean 5.012
CSR min 6.520 max 7.650 mean 7.139
H min 10.829 max*10.846 mean 10.836
Row-Column-Permute
GPU 64 COO min 4.970 max 5.050 mean 4.983
CSR min 6.440 max 7.380 mean 6.779
H min 10.738 max 10.743 mean 10.740
lp_fit2d.mtx
Regular
GPU 64 COO min 3.960 max 3.960 mean 3.960
CSR min 6.360 max 7.450 mean 6.711
H min 11.109 max 11.109 mean 11.109
Row-Premute
GPU 64 COO min 3.950 max* 3.980 mean 3.953
CSR min 6.330 max 7.400 mean 6.661
H min 11.098 max 11.104 mean 11.101
Row-Gradient
GPU 64 COO min 3.960 max 3.980 mean 3.961
CSR min 6.270 max*10.770 mean 7.017
H min 11.109 max 11.109 mean 11.109
Column-Gradient
GPU 64 COO min 3.940 max 3.960 mean 3.950
CSR min 6.270 max 7.370 mean 6.696
H min 11.329 max*11.334 mean 11.331
Row-Column-Permute
GPU 64 COO min 3.950 max 3.960 mean 3.952
CSR min 6.180 max 7.420 mean 6.641
H min 11.098 max 11.105 mean 11.101
bloweya.mtx
Regular
GPU 64 COO min 0.000 max 0.000 mean 0.000
CSR min 0.000 max 0.000 mean 0.000
H min 7.205 max 7.205 mean 7.205
Row-Premute
GPU 64 COO min 4.020 max 4.030 mean 4.023
CSR min 6.070 max 6.750 mean 6.340
H min 11.025 max 11.031 mean 11.028
Row-Gradient
GPU 64 COO min 4.090 max* 4.160 mean 4.111
CSR min 5.980 max* 7.370 mean 6.678
H min 10.295 max 10.304 mean 10.300
Column-Gradient
GPU 64 COO min 3.980 max 4.010 mean 3.995
CSR min 5.880 max 6.780 mean 6.295
H min 10.881 max*10.887 mean 10.883
Row-Column-Permute
GPU 64 COO min 4.020 max 4.030 mean 4.023
CSR min 5.970 max 6.420 mean 6.183
H min 11.025 max 11.033 mean 11.028
lp_osa_07.mtx
Regular
GPU 64 COO min 4.260 max* 4.270 mean 4.261
CSR min 6.440 max 7.640 mean 6.863
H min 8.412 max 8.412 mean 8.412
Row-Premute
GPU 64 COO min 4.200 max 4.200 mean 4.200
CSR min 6.020 max 7.030 mean 6.418
H min 9.255 max 9.257 mean 9.256
Row-Gradient
GPU 64 COO min 4.210 max 4.240 mean 4.226
CSR min 6.070 max*10.050 mean 6.498
H min 8.607 max 8.678 mean 8.671
Column-Gradient
GPU 64 COO min 4.170 max 4.190 mean 4.180
CSR min 5.610 max 7.300 mean 5.988
H min 9.534 max* 9.601 mean 9.585
Row-Column-Permute
GPU 64 COO min 4.190 max 4.190 mean 4.190
CSR min 6.070 max 7.000 mean 6.386
H min 9.255 max 9.257 mean 9.256
ex19.mtx
Regular
GPU 64 COO min 6.140 max* 6.180 mean 6.159
CSR min 12.780 max*14.400 mean 13.328
H min 8.228 max 8.228 mean 8.228
Row-Premute
GPU 64 COO min 5.820 max 5.850 mean 5.833
CSR min 9.870 max 11.070 mean 10.372
H min 11.836 max 11.840 mean 11.838
Row-Gradient
GPU 64 COO min 6.070 max 6.120 mean 6.104
CSR min 11.290 max 12.760 mean 12.088
H min 10.743 max 10.752 mean 10.748
Column-Gradient
GPU 64 COO min 5.760 max 5.840 mean 5.813
CSR min 9.710 max 14.220 mean 10.376
H min 11.873 max*11.882 mean 11.878
Row-Column-Permute
GPU 64 COO min 5.810 max 5.860 mean 5.838
CSR min 9.920 max 10.820 mean 10.240
H min 11.836 max 11.841 mean 11.838
brainpc2.mtx
Regular
GPU 64 COO min 0.000 max 0.000 mean 0.000
CSR min 0.000 max 0.000 mean 0.000
H min 7.478 max 7.478 mean 7.478
Row-Premute
GPU 64 COO min 4.760 max 4.790 mean 4.773
CSR min 6.930 max 7.780 mean 7.310
H min 9.810 max 9.813 mean 9.811
Row-Gradient
GPU 64 COO min 4.820 max* 4.840 mean 4.831
CSR min 7.220 max 8.290 mean 7.583
H min 9.721 max 9.725 mean 9.723
Column-Gradient
GPU 64 COO min 4.760 max 4.820 mean 4.779
CSR min 6.870 max* 8.300 mean 7.393
H min 10.368 max*10.373 mean 10.370
Row-Column-Permute
GPU 64 COO min 4.750 max 4.780 mean 4.765
CSR min 6.940 max 7.580 mean 7.298
H min 9.809 max 9.814 mean 9.811
shermanACb.mtx
Regular
GPU 64 COO min 4.090 max* 4.130 mean 4.112
CSR min 6.320 max* 7.200 mean 6.779
H min 8.600 max 8.600 mean 8.600
Row-Premute
GPU 64 COO min 4.020 max 4.050 mean 4.036
CSR min 5.670 max 6.460 mean 6.014
H min 10.376 max 10.382 mean 10.379
Row-Gradient
GPU 64 COO min 4.050 max 4.100 mean 4.074
CSR min 5.580 max 6.420 mean 5.996
H min 9.918 max 9.924 mean 9.921
Column-Gradient
GPU 64 COO min 4.010 max 4.080 mean 4.033
CSR min 0.000 max 6.320 mean 5.527
H min 10.543 max*10.595 mean 10.589
Row-Column-Permute
GPU 64 COO min 4.020 max 4.050 mean 4.036
CSR min 5.670 max 6.510 mean 6.092
H min 10.377 max 10.381 mean 10.379
cvxqp3.mtx
Regular
GPU 64 COO min 3.500 max* 3.540 mean 3.501
CSR min 11.860 max*13.100 mean 12.694
H min 8.646 max 8.646 mean 8.646
Row-Premute
GPU 64 COO min 3.360 max 3.370 mean 3.365
CSR min 6.210 max 7.610 mean 6.631
H min 11.027 max 11.032 mean 11.030
Row-Gradient
GPU 64 COO min 3.370 max 3.380 mean 3.376
CSR min 6.170 max 7.070 mean 6.499
H min 11.059 max 11.068 mean 11.064
Column-Gradient
GPU 64 COO min 3.350 max 3.390 mean 3.371
CSR min 6.150 max 7.180 mean 6.531
H min 11.125 max*11.133 mean 11.130
Row-Column-Permute
GPU 64 COO min 3.350 max 3.380 mean 3.364
CSR min 6.040 max 7.440 mean 6.603
H min 11.028 max 11.033 mean 11.030
case9.mtx
Regular
GPU 64 COO min 0.000 max 0.000 mean 0.000
CSR min 0.000 max 0.000 mean 0.000
H min 7.380 max 7.380 mean 7.380
Row-Premute
GPU 64 COO min 4.130 max 4.170 mean 4.134
CSR min 6.180 max* 9.200 mean 6.796
H min 10.041 max 10.046 mean 10.044
Row-Gradient
GPU 64 COO min 4.150 max* 4.220 mean 4.163
CSR min 6.410 max 7.500 mean 6.816
H min 9.682 max 9.706 mean 9.693
Column-Gradient
GPU 64 COO min 4.080 max 4.110 mean 4.096
CSR min 6.020 max 7.220 mean 6.309
H min 10.597 max*10.658 mean 10.631
Row-Column-Permute
GPU 64 COO min 4.120 max 4.140 mean 4.130
CSR min 6.210 max 7.200 mean 6.609
H min 10.041 max 10.046 mean 10.044
TSOPF_FS_b9_c6.mtx
Regular
GPU 64 COO min 0.000 max 0.000 mean 0.000
CSR min 0.000 max 0.000 mean 0.000
H min 7.380 max 7.380 mean 7.380
Row-Premute
GPU 64 COO min 4.120 max 4.140 mean 4.129
CSR min 6.170 max 7.160 mean 6.664
H min 10.041 max 10.045 mean 10.043
Row-Gradient
GPU 64 COO min 4.150 max* 4.180 mean 4.162
CSR min 6.420 max 7.360 mean 6.723
H min 9.682 max 9.706 mean 9.693
Column-Gradient
GPU 64 COO min 4.080 max 4.120 mean 4.096
CSR min 5.880 max 7.090 mean 6.403
H min 10.611 max*10.660 mean 10.637
Row-Column-Permute
GPU 64 COO min 4.130 max 4.140 mean 4.130
CSR min 6.330 max* 7.390 mean 6.695
H min 10.042 max 10.047 mean 10.044
OPF_6000.mtx
Regular
GPU 64 COO min 7.270 max* 7.370 mean 7.293
CSR min 12.890 max*14.500 mean 13.566
H min 8.799 max 8.799 mean 8.799
Row-Premute
GPU 64 COO min 6.640 max 6.720 mean 6.678
CSR min 9.680 max 11.600 mean 10.040
H min 11.873 max 11.877 mean 11.875
Row-Gradient
GPU 64 COO min 7.090 max 7.140 mean 7.122
CSR min 11.250 max 13.030 mean 12.142
H min 11.110 max 11.117 mean 11.114
Column-Gradient
GPU 64 COO min 6.590 max 6.710 mean 6.644
CSR min 9.400 max 13.140 mean 9.991
H min 12.040 max*12.046 mean 12.043
Row-Column-Permute
GPU 64 COO min 6.640 max 6.710 mean 6.679
CSR min 9.690 max 10.740 mean 10.050
H min 11.874 max 11.877 mean 11.875
OPF_3754.mtx
Regular
GPU 64 COO min 4.430 max* 4.450 mean 4.443
CSR min 9.710 max*13.000 mean 11.377
H min 8.393 max 8.393 mean 8.393
Row-Premute
GPU 64 COO min 4.230 max 4.250 mean 4.240
CSR min 7.430 max 8.750 mean 7.986
H min 11.266 max 11.272 mean 11.269
Row-Gradient
GPU 64 COO min 4.370 max 4.420 mean 4.382
CSR min 8.160 max 9.470 mean 8.682
H min 10.462 max 10.473 mean 10.468
Column-Gradient
GPU 64 COO min 4.210 max 4.240 mean 4.227
CSR min 7.160 max 8.080 mean 7.595
H min 11.394 max*11.401 mean 11.398
Row-Column-Permute
GPU 64 COO min 4.230 max 4.250 mean 4.243
CSR min 7.230 max 8.940 mean 8.056
H min 11.264 max 11.271 mean 11.269
c-47.mtx
Regular
GPU 64 COO min 5.320 max* 5.340 mean 5.329
CSR min 8.890 max* 9.590 mean 9.249
H min 8.364 max 8.364 mean 8.364
Row-Premute
GPU 64 COO min 5.240 max 5.250 mean 5.241
CSR min 7.790 max 8.890 mean 8.214
H min 10.059 max 10.063 mean 10.061
Row-Gradient
GPU 64 COO min 5.230 max 5.260 mean 5.242
CSR min 7.080 max 8.050 mean 7.673
H min 10.206 max 10.226 mean 10.218
Column-Gradient
GPU 64 COO min 5.080 max 5.120 mean 5.105
CSR min 5.780 max 6.970 mean 6.359
H min 11.205 max*11.233 mean 11.222
Row-Column-Permute
GPU 64 COO min 5.220 max 5.250 mean 5.227
CSR min 7.860 max 8.710 mean 8.247
H min 10.059 max 10.064 mean 10.061
mhd4800a.mtx
Regular
GPU 64 COO min 3.090 max* 3.100 mean 3.098
CSR min 11.570 max*12.290 mean 12.092
H min 7.132 max 7.132 mean 7.132
Row-Premute
GPU 64 COO min 3.020 max 3.020 mean 3.020
CSR min 5.560 max 7.270 mean 6.007
H min 10.959 max*10.968 mean 10.963
Row-Gradient
GPU 64 COO min 3.080 max 3.100 mean 3.088
CSR min 10.250 max 12.150 mean 11.340
H min 9.509 max 9.528 mean 9.520
Column-Gradient
GPU 64 COO min 3.020 max 3.050 mean 3.026
CSR min 5.530 max 10.580 mean 6.432
H min 10.933 max 10.946 mean 10.939
Row-Column-Permute
GPU 64 COO min 3.020 max 3.020 mean 3.020
CSR min 5.510 max 6.830 mean 6.136
H min 10.959 max 10.967 mean 10.963
gen4.mtx
Regular
GPU 64 COO min 3.300 max* 3.320 mean 3.308
CSR min 5.250 max 6.340 mean 5.705
H min 9.234 max 9.234 mean 9.234
Row-Premute
GPU 64 COO min 3.290 max 3.310 mean 3.299
CSR min 5.190 max 7.420 mean 5.683
H min 10.249 max 10.254 mean 10.252
Row-Gradient
GPU 64 COO min 3.300 max 3.310 mean 3.301
CSR min 5.370 max 6.310 mean 5.659
H min 9.934 max 9.958 mean 9.948
Column-Gradient
GPU 64 COO min 3.240 max 3.260 mean 3.249
CSR min 5.090 max* 8.660 mean 5.546
H min 10.853 max*10.873 mean 10.864
Row-Column-Permute
GPU 64 COO min 3.290 max 3.320 mean 3.296
CSR min 5.190 max 7.550 mean 5.659
H min 10.249 max 10.255 mean 10.252
Maragal_6.mtx
Regular
GPU 64 COO min 10.580 max 10.620 mean 10.599
CSR min 15.620 max*16.470 mean 15.832
H min 9.930 max 9.930 mean 9.930
Row-Premute
GPU 64 COO min 10.340 max 10.430 mean 10.362
CSR min 12.880 max 13.340 mean 13.057
H min 10.777 max 10.778 mean 10.777
Row-Gradient
GPU 64 COO min 10.650 max*10.740 mean 10.688
CSR min 12.310 max 13.670 mean 12.562
H min 11.247 max 11.300 mean 11.281
Column-Gradient
GPU 64 COO min 10.340 max 10.440 mean 10.398
CSR min 9.480 max 10.110 mean 9.782
H min 12.023 max*12.069 mean 12.047
Row-Column-Permute
GPU 64 COO min 10.330 max 10.380 mean 10.356
CSR min 12.840 max 13.530 mean 13.119
H min 10.776 max 10.778 mean 10.777
aft01.mtx
Regular
GPU 64 COO min 3.680 max* 3.690 mean 3.688
CSR min 13.860 max*14.830 mean 14.560
H min 7.811 max 7.811 mean 7.811
Row-Premute
GPU 64 COO min 3.510 max 3.530 mean 3.513
CSR min 6.420 max 10.520 mean 7.265
H min 11.161 max*11.170 mean 11.165
Row-Gradient
GPU 64 COO min 3.630 max 3.670 mean 3.643
CSR min 10.760 max 13.510 mean 12.199
H min 10.248 max 10.265 mean 10.258
Column-Gradient
GPU 64 COO min 3.510 max 3.520 mean 3.519
CSR min 6.490 max 11.230 mean 7.645
H min 11.112 max 11.121 mean 11.117
Row-Column-Permute
GPU 64 COO min 3.510 max 3.540 mean 3.515
CSR min 6.510 max 11.650 mean 7.311
H min 11.161 max 11.168 mean 11.165
TSOPF_RS_b39_c7.mtx
Regular
GPU 64 COO min 5.970 max* 6.010 mean 5.988
CSR min 12.470 max*21.120 mean 13.816
H min 7.304 max 7.304 mean 7.304
Row-Premute
GPU 64 COO min 5.840 max 5.870 mean 5.856
CSR min 10.780 max 15.810 mean 11.425
H min 10.537 max 10.540 mean 10.539
Row-Gradient
GPU 64 COO min 5.950 max 6.000 mean 5.975
CSR min 11.520 max 17.250 mean 12.799
H min 9.638 max 9.646 mean 9.641
Column-Gradient
GPU 64 COO min 5.790 max 5.860 mean 5.827
CSR min 10.500 max 14.080 mean 11.237
H min 11.128 max*11.223 mean 11.209
Row-Column-Permute
GPU 64 COO min 5.850 max 5.870 mean 5.855
CSR min 10.790 max 15.250 mean 11.718
H min 10.537 max 10.541 mean 10.539
mult_dcop_03.mtx
Regular
GPU 64 COO min 5.130 max* 5.220 mean 5.142
CSR min 7.250 max* 9.320 mean 7.722
H min 9.689 max 9.689 mean 9.689
Row-Premute
GPU 64 COO min 4.980 max 5.030 mean 4.999
CSR min 6.460 max 8.470 mean 6.950
H min 10.738 max 10.742 mean 10.740
Row-Gradient
GPU 64 COO min 5.070 max 5.140 mean 5.088
CSR min 6.780 max 8.700 mean 7.268
H min 10.572 max 10.584 mean 10.580
Column-Gradient
GPU 64 COO min 4.980 max 5.030 mean 5.010
CSR min 6.390 max 7.640 mean 6.982
H min 10.825 max*10.845 mean 10.836
Row-Column-Permute
GPU 64 COO min 4.990 max 5.010 mean 4.997
CSR min 6.300 max 7.160 mean 6.636
H min 10.738 max 10.743 mean 10.740
References
- (1)
- Anzt et al. (2020) Hartwig Anzt, Terry Cojean, Chen Yen-Chen, Jack J. Dongarra, Goran Flegar, Pratik Nayak, Stanimire Tomov, Yuhsiang M. Tsai, and Weichung Wang. 2020. Load-balancing Sparse Matrix Vector Product Kernels on GPUs. ACM Trans. Parallel Comput. 7, 1 (2020), 2:1–2:26. https://doi.org/10.1145/3380930
- D’Alberto et al. (2012) Paolo D’Alberto, Chris Drome, and Ali Dasdan. 2012. Non-Parametric Methods Applied to the N-Sample Series Comparison. arXiv:stat.CO/1205.1880
- Fowers et al. (2014) Jeremy Fowers, Kalin Ovtcharov, Karin Strauss, Eric S Chung, and Greg Stitt. 2014. A high memory bandwidth fpga accelerator for sparse matrix-vector multiplication. In IEEE Symposium on FPGAs for Custom Computing Machines (FCCM). IEEE, 36–43.
- Grigoras et al. (2016) Paul Grigoras, Pavel Burovskiy, and Wayne Luk. 2016. CASK: Open-Source Custom Architectures for Sparse Kernels. In Proceedings of the International Symposium on Field Programmable Gate Arrays (FPGA). ACM, 179–184.
- Huang et al. (2009) B. Huang, J. Gao, and X. Li. 2009. An Empirically Optimized Radix Sort for GPU. In 2009 IEEE International Symposium on Parallel and Distributed Processing with Applications. 234–241.
- Kayaaslan et al. (2018) Enver Kayaaslan, Cevdet Aykanat, and Bora Uçar. 2018. 1.5D Parallel Sparse Matrix-Vector Multiply. SIAM J. Scientific Computing 40, 1 (2018). https://doi.org/10.1137/16M1105591
- Kestur et al. (2012) Srinidhi Kestur, John D Davis, and Eric S Chung. 2012. Towards a universal FPGA matrix-vector multiplication architecture. In IEEE Symposium on FPGAs for Custom Computing Machines (FCCM). IEEE, 9–16.
- Li et al. (2016) Sicheng Li, Yandan Wang, Wujie Wen, Yu Wang, Yiran Chen, and Hai Li. 2016. A data locality-aware design framework for reconfigurable sparse matrix-vector multiplication kernel. In Proceedings of the International Conference on Computer-Aided Design (ICCAD). IEEE, 1–6.
- Li et al. (2004) X. Li, M. J. Garzaran, and D. Padua. 2004. A dynamically tuned sorting library. In International Symposium on Code Generation and Optimization, 2004. CGO 2004. 111–122.
- Nagar and Bakos (2011) Krishna K Nagar and Jason D Bakos. 2011. A sparse matrix personality for the convey HC-1. In IEEE Symposium on FPGAs for Custom Computing Machines (FCCM). IEEE, 1–8.
- Page and Kogge (2018) Brian A. Page and Peter M. Kogge. 2018. Scalability of Hybrid Sparse Matrix Dense Vector (SpMV) Multiplication. In 2018 International Conference on High Performance Computing & Simulation, HPCS 2018, Orleans, France, July 16-20, 2018. IEEE, 406–414. https://doi.org/10.1109/HPCS.2018.00072
- Townsend and Zambreno (2013) Kevin Townsend and Joseph Zambreno. 2013. Reduce, reuse, recycle (r 3): A design methodology for sparse matrix vector multiplication on reconfigurable platforms. In Proceedings of the International Conference on Application-Specific Systems, Architectures and Processors (ASAP). IEEE, 185–191.
- Zhou et al. (2019) Shijie Zhou, Rajgopal Kannan, Viktor K Prasanna, Guna Seetharaman, and Qing Wu. 2019. HitGraph: High-throughput Graph Processing Framework on FPGA. IEEE Transactions on Parallel and Distributed Systems 30, 10 (2019), 2249–2264.
- Zhuo and Prasanna (2005) Ling Zhuo and Viktor K Prasanna. 2005. Sparse matrix-vector multiplication on FPGAs. In Proceedings of the International Symposium on Field Programmable Gate Arrays (FPGA). ACM, 63–74.