Non-Equilibrium Nature of Fracture Determines the Crack Paths
Abstract
A high-fidelity neural network-based force field, NN-F3, is developed to cover the strain states up to material failure and the non-equilibrium, intermediate nature of fracture. Simulations of fracture in 2D crystals using NN-F3 reveal spatial complexities from lattice-scale kinks to sample-scale patterns. We find that the fracture resistance cannot be quantified by the energy densities of relaxed edges as in the literature. Instead, the fracture patterns, critical stress intensity factors at the kinks, and energy densities of edges in the intermediate, unrelaxed states offer reasonable measures for the fracture toughness and its anisotropy.
Fracture is a catastrophic process in nature and engineering, which leaves facets and kinks along the crack paths. In 2D crystals such as graphene and h-BN, different types of edges can be cleaved by fracture, including zigzag (Z), armchair (A), and mixed zigzag-armchair or chiral (C) edges (Fig. 1a). The relative stabilities of graphene edge structures were explored experimentally through the abundance of edges created by various techniques such as fracture [1], mechanical exfoliation [2], and irradiation [3]. Most observations show almost the same probabilities of zigzag and armchair edges [4, 5, 6], while a few of them report either zigzag or armchair direction is preferred over the other [3, 7, 8, 2, 9]. These facts suggest that the stabilities of zigzag and armchair edges could be quite close, which contradicts theoretical predictions from first-principles calculations. Ground-state calculations based on the density functional theory (DFT) show that electronic and structural relaxation of the armchair edge of graphene significantly reduces its energy density, , which becomes lower than that of the zigzag edge, [10, 11, 12, 13, 14, 15, 16]. The disagreement between theory and experiment remains unsolved for more than a decade.
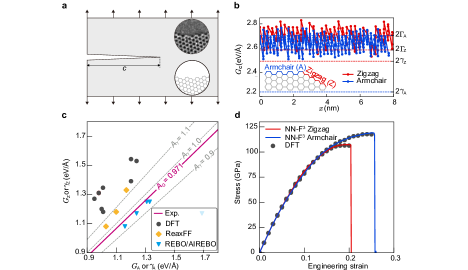
The selection of crack paths during fracture is closely related to the relative stability of edges. Under the framework of fracture mechanics, the crack driving force can be measured by the energy release rate (ERR), , while the energy cost to activate the fracture is defined as the fracture toughness, [21]. The value of is difficult to determine by theory due to the non-equilibrium nature of fracture and thus commonly measured by experiments [21]. In theoretical studies, the fracture resistance is usually approximated by the surface or edge energy densities as (Fig. 1b) [22, 21, 23, 18]. The directional dependence of , which defines the relative stability of different edges, is expected to align with that of [24, 1].
By analyzing the crack path under specific loading conditions, the relative stability or the anisotropy of fracture can be deduced. The anisotropy in and of crystals with a honeycomb lattice such as graphene can be quantified by the ratios between their values at post-fracture zigzag (Z) and armchair (A) edges, , and [14], respectively [4, 5, 6]. Recently, direct tensile tests of monolayer graphene and peeling tests of highly-oriented pyrolytic graphite (HOPG), although unable to resolve the atomic-scale edge structures, conclude weak anisotropies ( [1] and [2]) from the overall orientation of cracks.
Energy densities of edges cleaved by fracture cannot be directly measured in experiments, and the use of theoretically calculated as the fracture toughness remains questionable. In fact, experimentally measured fracture toughness is usually much higher than the value of even for brittle crystals where plastic dissipation is absent [23, 18, 25, 26] (Fig. 1b). Large-scale molecular dynamics (MD) simulations may help address the issue if provided with force fields of high accuracy and low cost. Empirical force fields (FFs) reported in the literature cannot capture the non-equilibrium nature and high, non-uniform lattice distortion at the crack front [27, 14, 19, 9, 18, 16, 20, 28]. The values of calculated using Stillinger-Weber or Tersoff potentials are the same as the bond-cutting estimation, , and do not correctly capture the bonding characteristics of materials [29, 28]. By including the chemistry of interatomic bonding, the adaptive intermolecular reactive empirical bond order (AIREBO) predicts [14, 18, 16], while the reactive force field (ReaxFF) yields opposite results, [19, 9, 20] (Fig. 1c). Compared with the experimental measurements [1, 2], DFT calculations predict a relatively strong anisotropy with , where electronic and structural relaxation of the edges are taken into account [10, 11, 12, 13, 14, 15, 16] [17]. The DFT predictions are also quantitatively different from the AIREBO and ReaxFF results. Recently, the implementation of neural network-based force fields [30] shows the capability to resolve the accuracy-cost dilemma and led to significant progress in several fields [31, 32, 33, 34]. However, the lack of a reasonable description of the non-equilibrium nature and exploration of the full space of strain states leaves the atomistic approach to fracture still immature.
Here we develop a neural network-based force field for fracture (NN-F3) for 2D crystals including graphene and h-BN based on first-principles calculations and an active-learning framework [30]. The tensorial nature of strain states and the undercoordination nature of cleavaged edges [14] demand a large training set of DFT data and are addressed by an active-learning workflow [35]. Our training sets for NN-F3 include structures with strained lattices (the uniaxial strain in the range of along different lattice directions), cleaved edges (zigzag and armchair segments as well as the kinks between them), and cracks ( datasets in total). The Deep Potential Smooth Edition (DeepPot-SE) model [36, 37] is used to train NN-F3, the performance of which is validated by reporting mean absolute errors (MAEs) of the energies per atom, the edge energy densities, and the interatomic forces below , and , respectively. The relative error (RE) in the stress-strain relations is under (Fig. 1d). The workflow thus assures an accurate description of the crack-tip processes [17].

Fracture Anisotropy of Graphene- The fracture of graphene is explored by quasi-static uniaxial tension using the Large-scale Atomic/Molecular Massively Parallel Simulator (LAMMPS) [38, 17]. In order to host relatively long cracks, wide samples () are constructed (Fig. 2). One atom at the left edge is removed to initialize the crack. Periodic boundary conditions (PBCs) are enforced along the tensile direction. The span is in the range of (and to see the size dependence) to accommodate different lattice orientations (, measured from the zigzag motif, Fig. 2a, b).
MD simulation results show that the cracks are straight at the sample scale (Figs. 3) [17]. Their overall orientations are denoted by (measured from the zigzag motif, see Fig. 2a). However, the cracks may deflect at the lattice scale, leaving kinks between the zigzag and armchair segments behind (Fig. 2c). The relations between and are summarized in Fig. 2b, which can be classified into three regimes. For or , the crack advances along the zigzag () or armchair () direction, respectively. For , the crack advances between them (). Cleavage of zigzag edges dominates if the loading direction is uniformly sampled, which is attributed to the fact of [17]. This finding conforms with the observations in the peeling experiments of HOPG where the polycrystalline texture is randomly oriented [2]. However, the energy densities of relaxed edge obtained from DFT calculations display an opposite trend of [10, 11, 12, 13, 14, 15, 16, 17]. This inconsistency indicates that fails to correctly characterize the anisotropy in fracture resistance.
The crack driving force under uniaxial tensile stress is [17]. Following the criterion of maximum ERR (MERR), the crack will advance in the direction with . In the honeycomb lattice of graphene, the cleaved edges consist of zigzag and armchair segments, and the value of can be estimated as the average value of and weighted by their lengths [2, 14], that is
| (1) |
This result presumes that the formation and interaction energies of lattice kinks are negligible in comparison with the edge energies [14, 39]. The direction of crack propagation, , can thus be obtained from the lattice orientation, , by finding the minimum of that satisfies , that is
| (2) |
The predictions using and fit the simulation results for smaller and larger than the critical value of (Fig. 2b), respectively. At , the numbers of zigzag and armchair segments are the same along the edge (Fig. 2c). The smaller values of at may be attributed to the asymmetry between the A and B sites at the armchair edges (Fig. 2d), which can elevate the fracture toughness and promote deflection. Similar effects of the edge asymmetry on crack deflection and toughening were also observed in h-BN [23, 17] and [27].
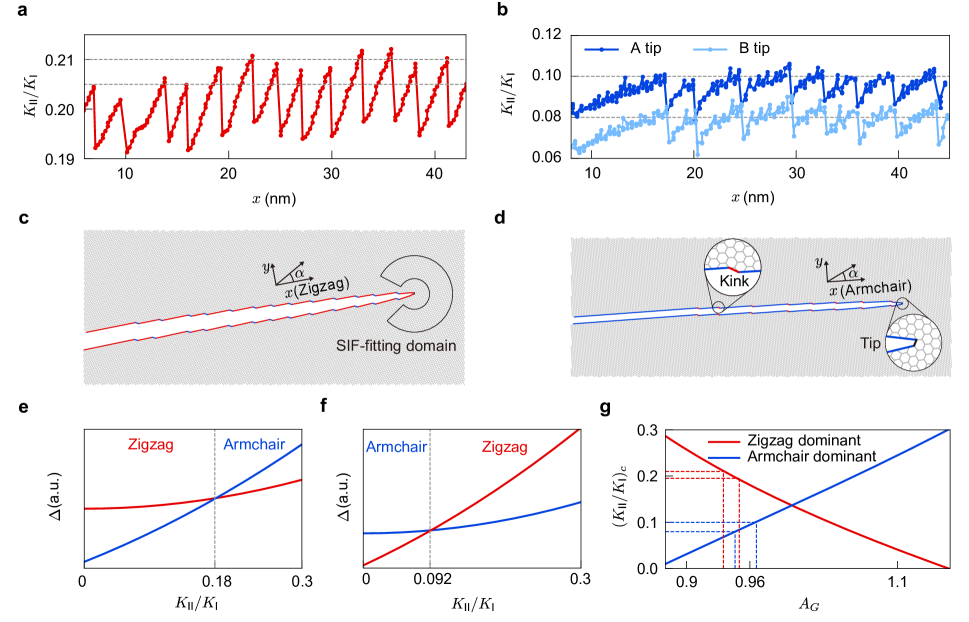
Origin of Edge Kinks- The high-fidelity NN-F3 allows us to explore the edge structures at the atomic level. Zigzag and armchair segments as well as lattice kinks connecting them can be resolved at length scales where fracture mechanics can be applied for analysis. Large-scale MD simulations excluding the size effects show periodic crack patterns [17] , and highlight the advantages of NN-F3 in offering high accuracy at the first-principles level and low computation cost that allows direct simulations up to the experimental scale [17, 1] The criterion of MERR [40, 24, 1] suggests that the direction of a propagating crack defined in the local coordinate system (Fig. 3c and 3d) is
| (3) |
where is evaluated by the SIFs in the tensile and shear modes ( and , respectively) as the out-of-plane displacement is ignored [20]. The values of and can be determined by fitting the crack-tip displacement field with the Williams power expansion [41, 17].
For loading conditions with crack directions not aligning with the zigzag or armchair motifs, we find that the presence of a mode-II feature could deflect the mode-I crack [21, 1]. The effect can be measured by the ratio extracted from MD simulations. Two representative examples are shown in Figs. 3c and 3d, where the cleaved edges are dominated by the zigzag and armchair segments, respectively. The value of oscillates as the crack propagates (Figs. 3a and 3b), indicating that the deflection is activated as the ratio approaches the threshold values . The threshold depends on the loading conditions and lattice orientations and is higher for cracks advancing in the zigzag direction than that along the armchair ones. The asymmetry between the A and B sites of the armchair edge further breaks the symmetry (Fig. 2d) and yields two thresholds (Fig. 3b), which confirms the effect of edge asymmetry on (Fig. 2b).
To estimate the values of and their relations with , a dimensionless quantity is introduced based on Eq. 3 as [17]
| (4) |
The direction of cracks determined from and follows the armchair or zigzag motifs ( or ) due to the discrete nature of lattices. The relations between and in the armchair- and zigzag-dominated regimes with are summarized in Figs. 3e and 3f, where the thresholds are identified as and , respectively. Alternatively, the values of can be obtained from that is directly determined by experiments or simulations (Fig. 3g and Table 1). The results show that the value of does not match the anisotropy measured from the energies of relaxed edges in direct NN-F3 or DFT calculations, (Figs. 1c) [17].
| # kinks | |||
|---|---|---|---|
| 8 | |||
| 13 | |||
| 2 |
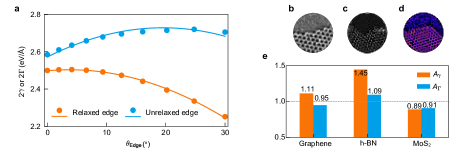
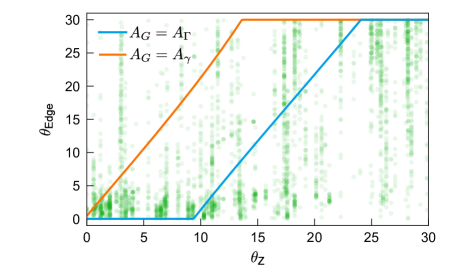
Energy Densities of Unrelaxed Edges- The mismatch between and implies that the anisotropy in the edge energies density fails to capture the atomistic kinetics of fracture, which selects the crack path. Since the work of fracture should not depend on posterior edge relaxation processes after the event of cleavage, the energy densities of unrelaxed edges, , are calculated using NN-F3 or DFT calculations and compared to for relaxed edges. The results, , suggest a weak anisotropy in the fracture toughness, agreeing well with the experimental evidence [2, 1] and the simulation results (Fig. 4a). The values of and also conform qualitatively well with and , respectively, by ignoring the lattice-trapping effects (Fig. 1b). We investigate several measures of fracture energies [17], and conclude that the energy density of unrelaxed edges, , can be a good indicator of fracture resistance. The consistency between and indicates that characterizes the non-equilibrium nature of the fracture. Specifically, for , the value fitted from relation matches well with (Fig. 2b). For , the fitting result of is slightly smaller than , which is attributed to the nature of asymmetric fracture where cracks advancing along the armchair motif prefer to deflect into the zigzag directions (Fig. 3b). The relations between and summarized in Fig. 5 show that predictions by assuming do not prefer zigzag edges, while the results using confirm the experimental results [2]. We also find that the energy densities of unrelaxed edges are very close to the measured fracture toughness () (Figs. 1b, 2b and 3), although the strain states at the crack tip are different from that in lattice decohesion [43].
Conclusion- Using a high-fidelity neural network-based force field developed in this work, we find that the kinetics of fracture is much determined by the intermediate, unrelaxed states of the crack tip. The energy density of relaxed edges widely used in the literature fails to offer a reasonable measure of fracture toughness. Instead, the relation, , and offer reasonable measures of the fracture anisotropy, that are, , , and (for graphene), respectively. The first two measures can be obtained from experiments or simulations with the atomic-level resolution, while the third one can be considered as material parameters and determined by first-principles calculations. This work highlights the multiscale and non-equilibrium nature of the fracture and the theory and methodology developed for graphene are extended to other 2D crystals such as h-BN and MoS2 (Figs. 4b-4e) [17].
This study was supported by the National Natural Science Foundation of China through grants 11825203, 11832010, 11921002, and 52090032. The computation was performed on the Explorer 100 cluster system of the Tsinghua National Laboratory for Information Science and Technology.
References
- Feng et al. [2022] S. Feng, K. Cao, Y. Gao, Y. Han, Z. Liu, Y. Lu, and Z. Xu, Experimentally measuring weak fracture toughness anisotropy in graphene, Commun. Mater. 3, 28 (2022).
- Qu et al. [2022] C. Qu, D. Shi, L. Chen, Z. Wu, J. Wang, S. Shi, E. Gao, Z. Xu, and Q. Zheng, Anisotropic fracture of graphene revealed by surface steps on graphite, Phys. Rev. Lett. 129, 026101 (2022).
- Fujihara et al. [2015] M. Fujihara, R. Inoue, R. Kurita, T. Taniuchi, Y. Motoyui, S. Shin, F. Komori, Y. Maniwa, H. Shinohara, Y. Miyata, and et al., Selective formation of zigzag edges in graphene cracks, ACS Nano 9, 9027 (2015).
- Kim et al. [2013] K. Kim, S. Coh, C. Kisielowski, M. F. Crommie, S. G. Louie, M. L. Cohen, and A. Zettl, Atomically perfect torn graphene edges and their reversible reconstruction, Nat. Commun. 4, 2723 (2013).
- Neubeck et al. [2010] S. Neubeck, Y. M. You, Z. H. Ni, P. Blake, Z. X. Shen, A. K. Geim, and K. S. Novoselov, Direct determination of the crystallographic orientation of graphene edges by atomic resolution imaging, Appl. Phys. Lett. 97, 053110 (2010).
- Jia et al. [2009] X. Jia, M. Hofmann, V. Meunier, B. G. Sumpter, J. Campos-Delgado, J. M. Romo-Herrera, H. Son, Y.-P. Hsieh, A. Reina, J. Kong, and et al., Controlled formation of sharp zigzag and armchair edges in graphitic nanoribbons, Science 323, 1701 (2009).
- Shi et al. [2020] L.-J. Shi, L.-Z. Yang, J.-Q. Deng, L.-H. Tong, Q. Wu, L. Zhang, L. Zhang, L.-J. Yin, and Z. Qin, Constructing graphene nanostructures with zigzag edge terminations by controllable STM tearing and folding, Carbon 165, 169 (2020).
- Girit et al. [2009] Ç. O. Girit, J. C. Meyer, R. Erni, M. D. Rossell, C. Kisielowski, L. Yang, C.-H. Park, M. Crommie, M. L. Cohen, S. G. Louie, et al., Graphene at the edge: Stability and dynamics, Science 323, 1705 (2009).
- Kim et al. [2012] K. Kim, V. I. Artyukhov, W. Regan, Y. Liu, M. F. Crommie, B. I. Yakobson, and A. Zettl, Ripping graphene: Preferred directions, Nano Lett. 12, 293 (2012).
- Jun [2008] S. Jun, Density-functional study of edge stress in graphene, Phys. Rev. B 78, 073405 (2008).
- Koskinen et al. [2008] P. Koskinen, S. Malola, and H. Häkkinen, Self-passivating edge reconstructions of graphene, Phys. Rev. Lett. 101, 115502 (2008).
- Huang et al. [2009] B. Huang, M. Liu, N. Su, J. Wu, W. Duan, B.-l. Gu, and F. Liu, Quantum manifestations of graphene edge stress and edge instability: A first-principles study, Phys. Rev. Lett. 102, 166404 (2009).
- Gan and Srolovitz [2010] C. K. Gan and D. J. Srolovitz, First-principles study of graphene edge properties and flake shapes, Phys. Rev. B 81, 125445 (2010).
- Liu et al. [2010] Y. Liu, A. Dobrinsky, and B. I. Yakobson, Graphene edge from armchair to zigzag: The origins of nanotube chirality?, Phys. Rev. Lett. 105, 235502 (2010).
- Gao et al. [2011] J. Gao, J. Yip, J. Zhao, B. I. Yakobson, and F. Ding, Graphene nucleation on transition metal surface: Structure transformation and role of the metal step edge, J. Am. Chem. Soc. 133, 5009 (2011).
- Yin et al. [2015] H. Yin, H. J. Qi, F. Fan, T. Zhu, B. Wang, and Y. Wei, Griffith criterion for brittle fracture in graphene, Nano Lett. 15, 1918 (2015).
- [17] See Supplemental Material at http://link.aps.org/ supplemental/10.1103/PhysRevLett.xxx.xxxxxx, which includes detailed methods, derivations of the theoretical model, supplemental figures and tables, datasets and Refs.[38, 35, 37, 44, 45, 46, 41, 1, 40, 47, 48, 49, 50, 51, 9, 12, 18, 42, 14, 11, 13, 52, 53, 54, 55, 56, 57, 58, 59, 60].
- Zhang et al. [2014] P. Zhang, L. Ma, F. Fan, Z. Zeng, C. Peng, P. E. Loya, Z. Liu, Y. Gong, J. Zhang, X. Zhang, and et al., Fracture toughness of graphene, Nat. Commun. 5, 3782 (2014).
- Sen et al. [2010] D. Sen, K. S. Novoselov, P. M. Reis, and M. J. Buehler, Tearing graphene sheets from adhesive substrates produces tapered nanoribbons, Small 6, 1108 (2010).
- Song et al. [2017] Z. Song, Y. Ni, and Z. Xu, Geometrical distortion leads to Griffith strength reduction in graphene membranes, Extreme Mech. Lett. 14, 31 (2017).
- Lawn [1993] B. R. Lawn, Fracture of Brittle Solids (Cambridge University Press, 1993).
- Griffith [1921] A. A. Griffith, VI. The phenomena of rupture and flow in solids, Philos. Trans. R. Soc. A 221, 163 (1921).
- Yang et al. [2021] Y. Yang, Z. Song, G. Lu, Q. Zhang, B. Zhang, B. Ni, C. Wang, X. Li, L. Gu, X. Xie, and et al., Intrinsic toughening and stable crack propagation in hexagonal boron nitride, Nature 594, 57 (2021).
- Takei et al. [2013] A. Takei, B. Roman, J. Bico, E. Hamm, and F. Melo, Forbidden directions for the fracture of thin anisotropic sheets: An analogy with the Wulff plot, Phys. Rev. Lett. 110, 144301 (2013).
- DelRio et al. [2015] F. W. DelRio, R. F. Cook, and B. L. Boyce, Fracture strength of micro-and nano-scale silicon components, Appl. Phys. Rev. 2, 021303 (2015).
- DelRio et al. [2022] F. W. DelRio, S. J. Grutzik, W. M. Mook, S. M. Dickens, P. G. Kotula, E. D. Hintsala, D. D. Stauffer, and B. L. Boyce, Eliciting stable nanoscale fracture in single-crystal silicon, Mater. Res. Lett. 10, 728 (2022).
- Jung et al. [2019] G. S. Jung, S. Wang, Z. Qin, S. Zhou, M. Danaie, A. I. Kirkland, M. J. Buehler, and J. H. Warner, Anisotropic fracture dynamics due to local lattice distortions, ACS Nano 13, 5693 (2019).
- Zhang et al. [2022] X. Zhang, H. Nguyen, X. Zhang, P. M. Ajayan, J. Wen, and H. D. Espinosa, Atomistic measurement and modeling of intrinsic fracture toughness of two-dimensional materials, Proc. Natl. Acad. Sci. 119, e2206756119 (2022).
- Hossain et al. [2018] M. Z. Hossain, T. Ahmed, B. Silverman, M. S. Khawaja, J. Calderon, A. Rutten, and S. Tse, Anisotropic toughness and strength in graphene and its atomistic origin, J. Mech. Phys. Solids 110, 118 (2018).
- Friederich et al. [2021] P. Friederich, F. Häse, J. Proppe, and A. Aspuru-Guzik, Machine-learned potentials for next-generation matter simulations, Nat. Mater. 20, 750 (2021).
- Galib and Limmer [2021] M. Galib and D. T. Limmer, Reactive uptake of by atmospheric aerosol is dominated by interfacial processes, Science 371, 921 (2021).
- Font-Clos et al. [2022] F. Font-Clos, M. Zanchi, S. Hiemer, S. Bonfanti, R. Guerra, M. Zaiser, and S. Zapperi, Predicting the failure of two-dimensional silica glasses, Nat. Commun. 13, 2820 (2022).
- Li and Ding [2022] P. Li and F. Ding, Origin of the herringbone reconstruction of Au (111) surface at the atomic scale, Science Advances 8, eabq2900 (2022).
- Hedman et al. [2023] D. Hedman, B. McLean, C. Bichara, S. Maruyama, J. A. Larsson, and F. Ding, Dynamics of growing carbon nanotube interfaces probed by machine learning-enabled molecular simulations, arXiv preprint arXiv:2302.09542 10.48550/arXiv.2302.09542 (2023).
- Zhang et al. [2020] Y. Zhang, H. Wang, W. Chen, J. Zeng, L. Zhang, H. Wang, and W. E, DP-GEN: A concurrent learning platform for the generation of reliable deep learning based potential energy models, Comput. Phys. Commun. 253, 107206 (2020).
- Zhang et al. [2018] L. Zhang, J. Han, H. Wang, W. Saidi, R. Car, et al., End-to-end symmetry preserving inter-atomic potential energy model for finite and extended systems, Adv. Neural Inf. Process. Syst. 31 (2018).
- Wang et al. [2018] H. Wang, L. Zhang, J. Han, and W. E, DeePMD-kit: A deep learning package for many-body potential energy representation and molecular dynamics, Comput. Phys. Commun. 228, 178 (2018).
- Thompson et al. [2022] A. P. Thompson, H. M. Aktulga, R. Berger, D. S. Bolintineanu, W. M. Brown, P. S. Crozier, P. J. in’t Veld, A. Kohlmeyer, S. G. Moore, T. D. Nguyen, et al., LAMMPS: A flexible simulation tool for particle-based materials modeling at the atomic, meso, and continuum scales, Comput. Phys. Commun. 271, 108171 (2022).
- Lee et al. [2023] W. Lee, D. Hedman, J. Dong, L. Zhang, Z. Lee, S. Y. Kim, and F. Ding, Importance of kink energy in calculating the formation energy of a graphene edge, Phys. Rev. B 107, 245420 (2023).
- Nuismer [1975] R. Nuismer, An energy release rate criterion for mixed mode fracture, Int. J. Fract. 11, 245 (1975).
- Williams [1957] M. L. Williams, On the stress distribution at the base of a stationary crack, J. Appl. Mech. 24, 109 (1957).
- Wang et al. [2016] S. Wang, Z. Qin, G. S. Jung, F. J. Martin-Martinez, K. Zhang, M. J. Buehler, and J. H. Warner, Atomically sharp crack tips in monolayer MoS2 and their enhanced toughness by vacancy defects, ACS Nano 10, 9831 (2016).
- Van der Ven and Ceder [2004] A. Van der Ven and G. Ceder, The thermodynamics of decohesion, Acta Mater. 52, 1223 (2004).
- Tada et al. [2000] H. Tada, P. C. Paris, and G. R. Irwin, The Stress Analysis of Cracks Handbook, Third Edition (ASME Press, 2000).
- Ayatollahi and Nejati [2011] M. Ayatollahi and M. Nejati, An over-deterministic method for calculation of coefficients of crack tip asymptotic field from finite element analysis, Fatigue Fract. Eng. Mater. Struct. 34, 159 (2011).
- Wilson et al. [2019] M. A. Wilson, S. J. Grutzik, and M. Chandross, Continuum stress intensity factors from atomistic fracture simulations, Comput. Methods Appl. Mech. Engrg. 354, 732 (2019).
- Soler et al. [2002] J. M. Soler, E. Artacho, J. D. Gale, A. García, J. Junquera, P. Ordejón, and D. Sánchez-Portal, The SIESTA method for ab initio order- materials simulation, J. Phys. Condens. Matter. 14, 2745 (2002).
- Perdew et al. [1996] J. P. Perdew, K. Burke, and M. Ernzerhof, Generalized gradient approximation made simple, Phys. Rev. Lett. 77, 3865 (1996).
- Troullier and Martins [1991] N. Troullier and J. L. Martins, Efficient pseudopotentials for plane-wave calculations, Phys. Rev. B 43, 1993 (1991).
- Kresse and Furthmüller [1996] G. Kresse and J. Furthmüller, Efficient iterative schemes for ab initio total-energy calculations using a plane-wave basis set, Phys. Rev. B 54, 11169 (1996).
- Blöchl [1994] P. E. Blöchl, Projector augmented-wave method, Phys. Rev. B 50, 17953 (1994).
- Addou et al. [2018] R. Addou, C. M. Smyth, J.-Y. Noh, Y.-C. Lin, Y. Pan, S. M. Eichfeld, S. Fölsch, J. A. Robinson, K. Cho, R. M. Feenstra, et al., One dimensional metallic edges in atomically thin WSe2 induced by air exposure, 2D Mater. 5, 025017 (2018).
- Xiao et al. [2016] S.-L. Xiao, W.-Z. Yu, and S.-P. Gao, Edge preference and band gap characters of MoS2 and WS2 nanoribbons, Surf. Sci. 653, 107 (2016).
- Lee et al. [2017] Y. Lee, J.-Y. Yoon, D. Scullion, J. Jang, E. J. Santos, H. Y. Jeong, and K. Kim, Atomic-scale imaging of few-layer black phosphorus and its reconstructed edge, J. Phys. D: Appl. Phys. 50, 084003 (2017).
- Aghaei et al. [2016] S. Aghaei, M. Monshi, and I. Calizo, A theoretical study of gas adsorption on silicene nanoribbons and its application in a highly sensitive molecule sensor, RSC Adv. 6, 94417 (2016).
- Zhou et al. [2013] W. Zhou, X. Zou, S. Najmaei, Z. Liu, Y. Shi, J. Kong, J. Lou, P. M. Ajayan, B. I. Yakobson, and J.-C. Idrobo, Intrinsic structural defects in monolayer molybdenum disulfide, Nano Lett. 13, 2615 (2013).
- Yang et al. [2017] Y. Yang, X. Li, M. Wen, E. Hacopian, W. Chen, Y. Gong, J. Zhang, B. Li, W. Zhou, P. M. Ajayan, et al., Brittle fracture of 2D MoSe2, Adv. Mater. 29, 1604201 (2017).
- Hoogenboom [2021] B. W. Hoogenboom, Stretching the resolution limit of atomic force microscopy, Nat. Struct. Mol. Biol. 28, 629 (2021).
- Tsuno [1993] K. Tsuno, Resolution limit of a transmission electron microscope with an uncorrected conventional magnetic objective lens, Ultramicroscopy 50, 245 (1993).
- Shi et al. [2023] P. Shi, S. Feng, and Z. Xu, Non-equilibrium nature of fracture determines the crack path, Materials Cloud Archive 2023.X, 10.24435/materialscloud:rd-0e (2023).