circumstellar matter — ISM: molecules — radio lines: stars — stars: AGB and post-AGB
A 3 mm Molecular Line Survey toward The C-star Envelope CIT 6
Abstract
We present an unbiased molecular line survey toward the carbon-rich circumstellar envelope CIT 6 carried out between 90 and 116 GHz with the Arizona Radio Observatory 12 m telescope. A total of 42 lines assigned to 10 molecular species and 4 isotopologues are detected. Despite the absence of any newly identified circumstellar molecules, several transitions are freshly reported for this object. This work is a complement to our previous line survey toward CIT 6 in the frequency ranges of 36–49 GHz and 131–268 GHz. Based on the measurements and in combination with previously published data, we perform a rotation-diagram analysis to determine the column densities, excitation temperatures, and fractional abundances of the molecules. The excitation temperature varies along the radius. The abundance pattern of CIT 6 is broadly consistent with that of the prototype C-star IRC+10216 at the specified detection sensitivity, indicating that the molecular richness in IRC+10216 cannot be attributed to an interpretation of unusual chemistry. Nevertheless, subtle distinctions between the two C-stars are found. The higher abundance of carbon-chain molecules and lower 12C/13C ratio in CIT 6 compared to IRC+10216 imply that the former is more massive or in a more evolved phase than the latter.
1 Introduction
When low- to intermediate-mass stars leave the main sequence and evolve to the asymptotic giant branch (AGB) phase, the products of nucleosynthesis are dredged up and ejected into the interstellar space, forming circumstellar envelopes (CSEs) (see e.g. Herwig, 2005). The proto-planetary nebula (PPN) and planetary nebula (PN) phases follow the AGB phase in the CSE evolution. The physical characteristics of the CSE, such as temperature, density, radiation fields, and wind velocity, may drastically alter throughout the mass loss of the central star and the envelop expansion, leading to complicated circumstellar chemistry. CSEs can therefore act as an unconventional chemical laboratory (see e.g. Ziurys, 2006). According to their C/O abundance ratio, AGB CSEs can be categorized into C-rich (C/O 1), O-rich (C/O 1), and S type (C/O 1) (see e.g. Höfner & Olofsson, 2018). An O-rich CSE can be progressively transformed to an S-type and C-rich one through the third dredge-up, after which diverse carbon-bearing compounds manifest. More than 80 different molecular species have so far been detected in CSEs (McGuire, 2018, 2022; Pardo et al., 2022). To better understand the chemical development of CSEs, we need to identify and analyze the lines from various molecular species in evolved stars at different phases. However, existing investigations have mostly concentrated on a small number of prominent molecules (e.g., Takano et al., 1992; Hrivnak & Bieging, 2005; Agúndez et al., 2014; Kawaguchi et al., 2007; Shinnaga et al., 2017; Bublitz et al., 2019; Aoki et al., 2022). To this end, we have been working on a long-term project that involves wide-band systematic, unbiased spectral line surveys of a large sample of the CSEs surrounding evolved stars. This effort will give us an unbiased perspective on the circumstellar chemistry (see Cernicharo et al., 2011, for a thorough review). The present work is part of our series studies of gas-phase molecular species in CSEs (He et al., 2008; Zhang et al., 2008, 2009a, 2009b, 2013, 2020; Chau et al., 2012; Qiu et al., 2022, 2023).
The majority of line surveys have been focused on the prototype C-rich CSE IRC+10216 due to its closeness to the Earth (110–135 pc, Groenewegen et al. 1998) and significant mass loss (3.25 10-5 yr-1, Crosas & Menten 1997). Previous observations of IRC+10216 revealed unparalleled chemical complexity (e.g. Cernicharo et al., 2000; Agúndez et al., 2008), and more faint molecules are constantly have been found by deeper line surveys (Pardo et al., 2022). IRC+10216 has become a common reference for research on circumstellar chemistry; however, it is crucial to determine whether it genuinely shares chemical characteristics with other C-rich stars. This issue has to be resolved by doing line surveys toward more C-rich CSEs.
CIT 6, also named RW LMi, GL 1403, IRC+30219, or IRAS 10131+3049, is the second bright C-rich star after IRC+10216, making it a superb line survey target. In contrast to IRC+10216, unbiased line survey toward CIT 6 is rather scarce (see table A 3 mm Molecular Line Survey toward The C-star Envelope CIT 6). CIT 6 is optically dim but infrared dazzling due to being shrouded in a thick dust envelope (Ulrich et al., 1966). It has a variable star with a pulsation period of about 640 days, similar to IRC+10216, which has a variable period of about 630 days (Woods et al., 2003b). However, the distance of CIT 6 was determined to be 400 50 pc according to Cohen & Hitchon (1996), which is further away than the distance of IRC+10216. There are studies showing that CIT 6 seems to be slightly more evolved than IRC+10216 (e.g. Fukasaku et al., 1994; Zhang et al., 2009a).
Our earlier line surveys demonstrate that the chemical makeup of CIT 6 and IRC+10216 is strikingly comparable (Zhang et al., 2009a; Chau et al., 2012). This essay can be used in conjunction with these publications. Section 2 describes the observations and data reductions. Section 3 describes the identifications and abundance. Section 4 discusses the implication of our findings for circumstellar chemistry. Section 5 finally provides a brief summary of this investigation.
2 Observation and data reduction
The = 3 mm observations were made in 2015 between mid-May and early June using the Arizona Radio Observatory (ARO) 12 m telescope on Kitt Peak, southwest of Tucson, Arizona, in beam switching mode with an azimuthal beam-throw of about 2. In 2013, a 12-meter prototype antenna for the Atacama Large Millimeter-submillimeter Array (ALMA) was installed at Kitt Peak to replace the deteriorating ARO 12-meter dish antenna. The on-source integration time can be cut in half to achieve the same spectrum sensitivity thanks to the increased sensitivity of the new antenna. The receivers were set to operate in single sideband (SSB) dual polarization mode with a typical rejection ratio of about 20 dB during the observations. The spectrometer back ends were equipped with two 256-channel filter banks (FBs) with a channel width of 1 MHz and a 3072-channel millimeter autocorrelator (MAC) with a channel width of 195 kHz. The equipment settings closely resembled those in He et al. (2008) and Zhang et al. (2009a), and thus the systematic errors could be reduced when comparing these spectra. For the sky conditions and the frequency range, the system temperature () was typically between 100 and 250 K. At each frequency setting, the on-source integration time took roughly 30 minutes. Pointing calibrations were carried out around every two hours by using accessible planets.
Data reduction was conducted using the CLASS package in Grenoble Image and Line Data Analysis Software (GILDAS) distributed by Institut de Radioastronomie Millimétrique (IRAM). After identifying and eliminating the faulty scans that were severely impacted by bandpass anomalies, we co-added the individual scans to generate the spectra. A low-order polynomial was applied to fit the baseline of the spectra. The complete spectra derived from the current observations are displayed in figure 1 with strong lines marked.
The antenna temperatures () of the line-free regions of the co-added spectra have a typical root mean square (RMS) level of 10 mK at a spectral resolution of 600 kHz. can be converted into the main beam temperature by , where is the main beam efficiency employed as 0.95 (as calculated by extrapolating the experimental data provided by ARO).
3 Results
3.1 Line identification and measurement
Line identifications are based on the Spalatalogue database for astronomical spectroscopy111https://splatalogue.online, which contains data from Jet Propulsion Laboratory Catalogue (Pickett et al., 1998), Cologne database for molecular spectroscopy (Müller et al., 2001, 2005), and National Institute of Standards and Technology (NIST) Recommended Rest Frequencies for Observed Interstellar Molecular Microwave Transitions (Lovas, 2004). We identified 42 emission lines that belong to 10 molecular species and four isotopologues. No circumstellar molecules are newly identified. We detect all strong lines reported in IRC+10216 within the same frequency coverage. No lines invisible in IRC+10216 are discovered in CIT 6. To our knowledge, 20 lines are discovered in this source for the first time. Figure 2 shows the complete zoom-in spectra, which have been smoothed among four neighboring channels for ease of viewing. The line profiles and fittings are displayed in figure 3. Table A 3 mm Molecular Line Survey toward The C-star Envelope CIT 6 lists the measurements of the detected lines, where the lines that are recently or previously discovered in this object are also indicated. The noise level nearby each line is listed in the 4th column of table A 3 mm Molecular Line Survey toward The C-star Envelope CIT 6. We discover three unidentified (U) emission features, as listed in table A 3 mm Molecular Line Survey toward The C-star Envelope CIT 6. There are no records of any of these U lines in the NIST database. The line number per unit frequency interval is about 1.7 GHz-1, which is comparable with those of our earlier observations of CIT 6 (see table A 3 mm Molecular Line Survey toward The C-star Envelope CIT 6).
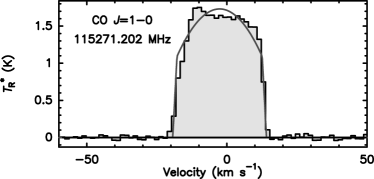
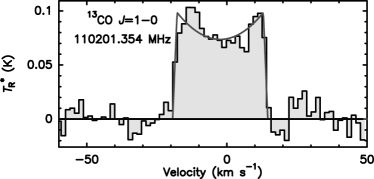
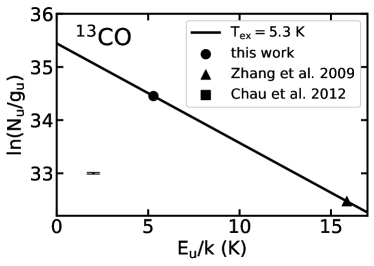
CO. The transitions of CO and its isotopologue 13CO are shown in figure 3. The CO line exhibits an optically thick parabolic profile, while the 13CO line has a double-peaked profile and thus is optically thin. The two lines have also been detected by Kahane et al. (1992) using the IRAM 30m telescope, who report the velocity-integrated intensities of 176 and 8.5 K km s-1 for the CO and 13CO lines, respectively. When the beam dilution effect is taken into account, our results are consistent with their measurements, therefore we do not observe a substantial change in the intensities of the two lines over the previous 30 years.
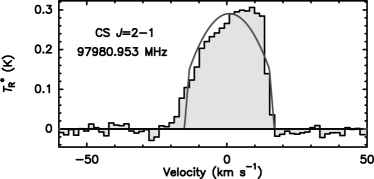
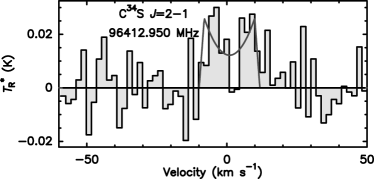
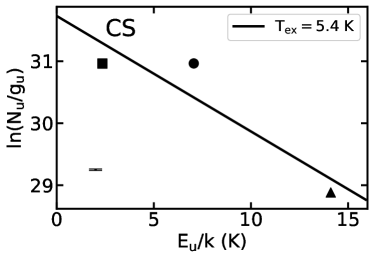
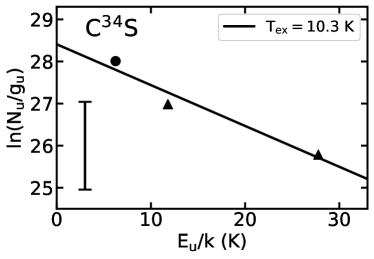
CS. The transitions of CS and its isotopologue C34S are detected, as shown in figure 4. Since the line profile of CS transition has a parabolic shape and the C34S line appears a double-peaked shape, the former line is optically thick, and the latter is optically thin. The CS line had been detected by Woods et al. (2003b) using the Onsala Space Observatory (OSO) 20 m telescope, while the C34S line is a new detection. Less than 1/20 of the CS emission line’s intensity is found in the C34S emission line. After taking the impact of the different beam sizes into account, the observed intensity of the CS line is reasonably consistent with that reported by Woods et al. (2003b).
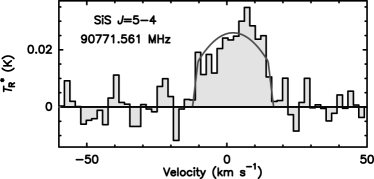
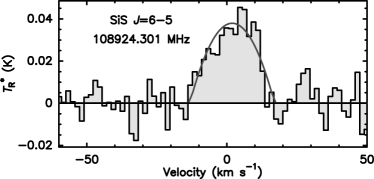
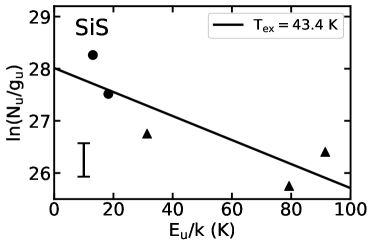
SiS. The and transitions of SiS are detected in this survey, as shown in figure 5. Both lines have been detected by Henkel et al. (1985) and Woods et al. (2003b) with the NRAO 11 m, Bell Laboratories 7 m, and OSO 20 m telescopes. The integrated intensity ratio between the and lines is 1.3, which is substantially lower than the value of 6.1 reported by Woods et al. (2003b). Using the Plateau de Bure IRAM (PdBI) interferometer, Lindqvist et al. (2000) carried out a spatially resolved observation in the SiS line, which displays a somewhat different profile from our observations. This is presumably because the interferometer observation poorly samples the extended emission regions. The SiS line has also been detected by Schöier et al. (2007) with the OSO 20 m telescope. Their measurement of integrated intensity matches ours within a 16% error.
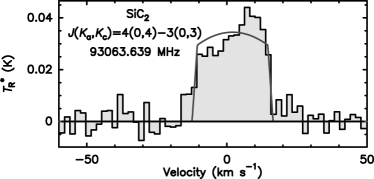
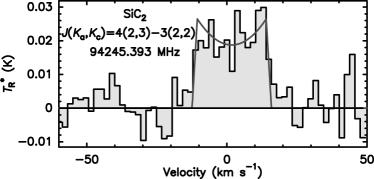
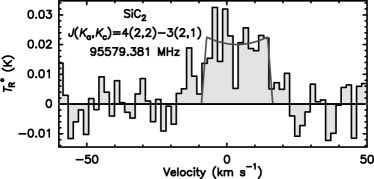
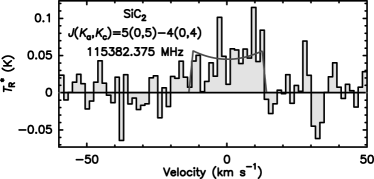
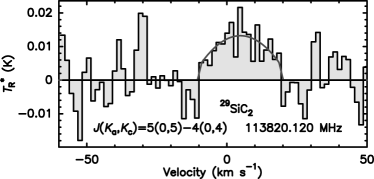
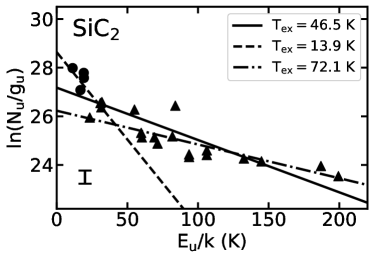
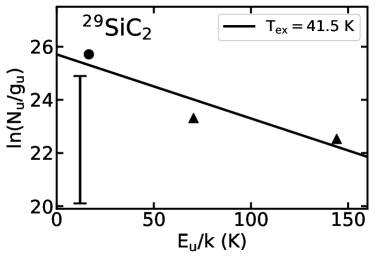
SiC2. The , , , and transitions of SiC2 are detected, as shown in figure 6. The average width of the four SiC2 lines is 26.0 0.4 km s-1. The 29SiC2 line is marginally detected with a signal level of 2. Its velocity-integrated intensity is about 4.3 times lower than the intensity of the main line. Its width of 29.0 3.2 km s-1 is comparable with those of the main lines, and thus we consider it as a positive detection. With the exception of the SiC2 transition, which has been discovered by Woods et al. (2003b) using the OSO 20 m telescope, we do not find any earlier report on the detection of the other four SiC2 lines.
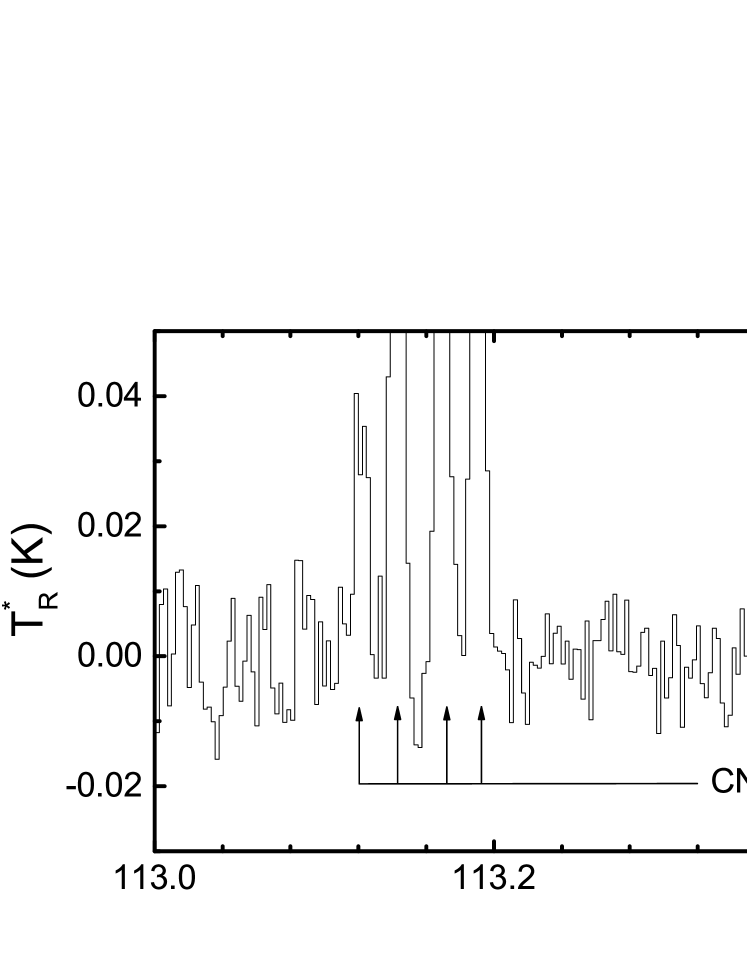
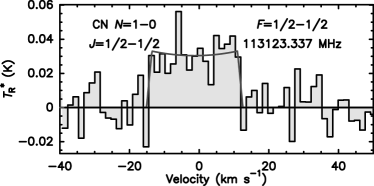
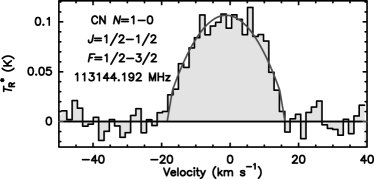
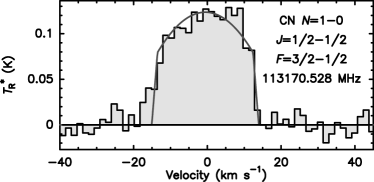
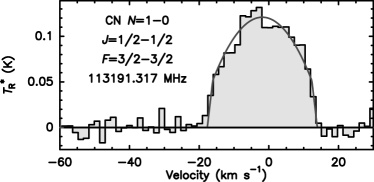
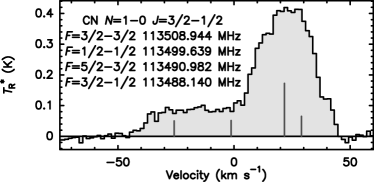
CN. There are nine fine structures of the CN transition lying in the frequency coverage of our observations. Except for the weak component at 113.5 GHz, all are visible, as shown in figure 7. The integrated intensities are consistent with those reported by Milam et al. (2009).
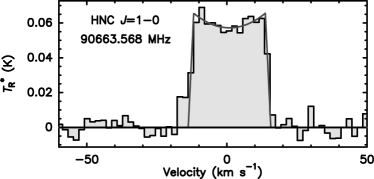
HNC. The HNC transition is detected with a line width of 27.5 0.3 km s-1,as shown in figure 8. The integrated intensity of this line is in agreement with that reported by Woods et al. (2003b) using the OSO 20 m telescope.
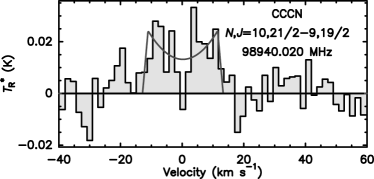
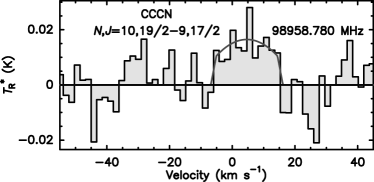
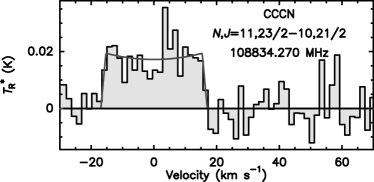
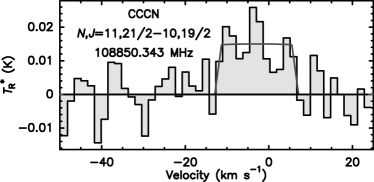
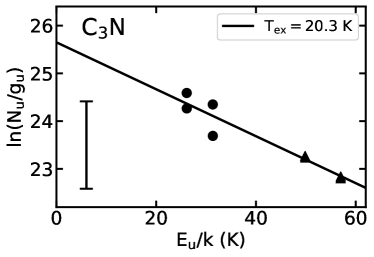
C3N. Four C3N transitions are definitely detected, as shown in figure 9. The and transitions have been detected by Woods et al. (2003b) using the OSO 20 m telescope, while the and transitions are new detection for CIT 6.
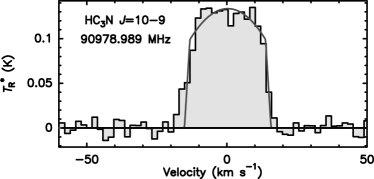
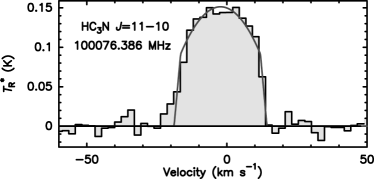
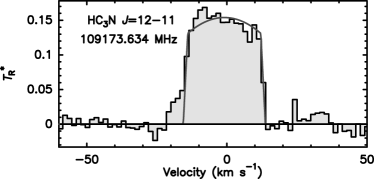
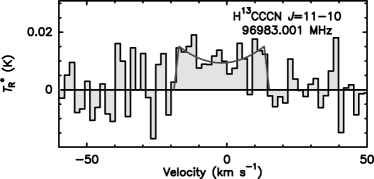
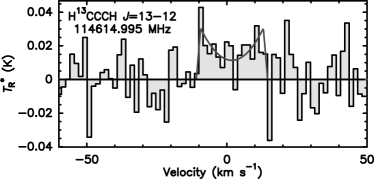
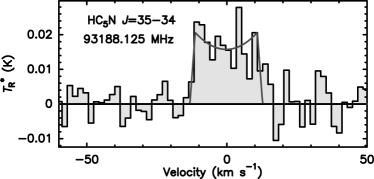
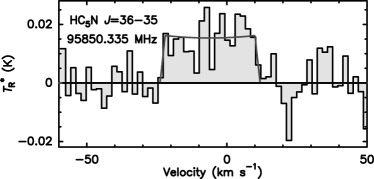
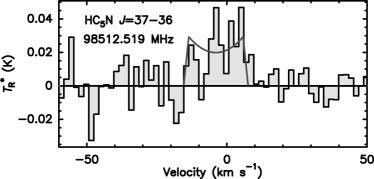
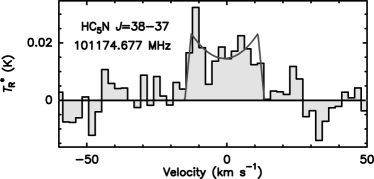
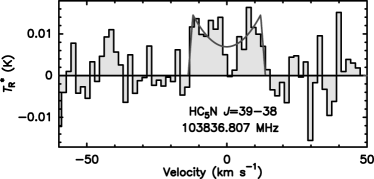
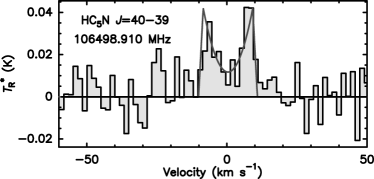
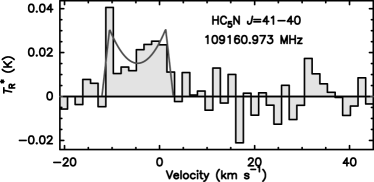
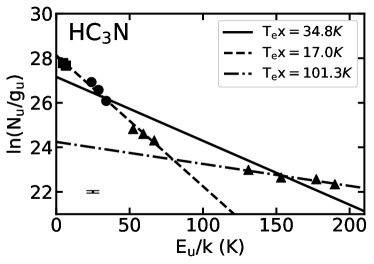
HC3N. The HC3N , , and are detected, as shown in figure 10. The and lines have been observed by Jewell & Snyder (1982) and Jewell & Snyder (1984), respectively. The H13CCCN and lines are marginally detected with a signal-to-noise ratio of about 1.5.
3.2 Rotation-diagram analysis and fractional abundances
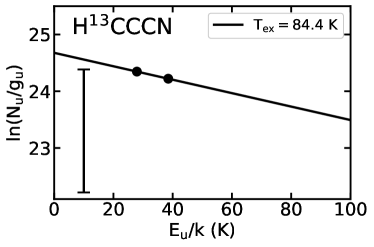
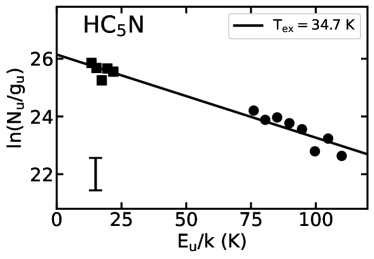
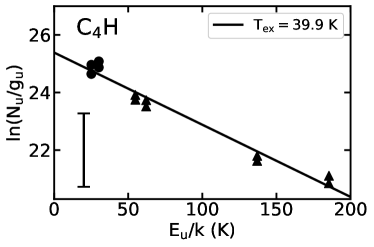
Using the traditional “rotation-diagram” method, we determine the excitation (rotational) temperatures () and the column densities () of the molecular species identified in recent observations. This method makes the assumption that the emission lines are optically thin and the level populations are in thermodynamical equilibrium (LTE). A line’s integrated intensity and the energy of the transition to the upper level () satisfy the expression
| (1) |
where and are the population and degeneracy of the upper level, the rest frequency of the line, the line strength multiplied by the square of the dipole moment, and Q() the rotational partition function, The source brightness temperature is obtained after correcting for the beam-dilution effect,
| (2) |
where is the half-power beam width (HPBW = 55–90 corresponding to 115–90 GHz). We simply assume that the source size () is 20, in line with the assumptions made in Zhang et al. (2009a) and Chau et al. (2012). Equation 1 implies a linear relation between and and that and can be derived by fitting a straight line to observational values. Linearity may deviate due to the non-thermal excitation process or misidentification. The rotation diagrams, which were constructed by combining the observations of this work and our earlier researches (Zhang et al., 2009a; Chau et al., 2012), are shown in figure 13.
The fractional abundances of molecular X with respect to H2 are determined using the same method in Olofsson (1997) with the expression of
| (3) |
where is the CSE’s expansion velocity in km s-1 taken from the measured line width, the distance is in pc (400 pc, Cohen & Hitchon, 1996), is in the scale of K km s-1, and the H2 mass loss rate is 3.2 10-6 yr-1 (Zhang et al., 2009a). is the Einstein’s A-coefficient in . is the energy of the lower level. The limits of the integration are given in , where the inner and outer boundaries are taken from Woods et al. (2003b) and vary depending on the type of molecule.
The results are summarized in table A 3 mm Molecular Line Survey toward The C-star Envelope CIT 6, which demonstrates a good degree of agreement with the earlier findings.
3.3 Isotopic ratios
Isotopic abundance ratios reveal the nucleosynthesis and mixing processes of the star. Based on the fractional abundances, we compute the isotopic ratios (or their lower limits) of carbon, silicon, and sulfur in CIT 6, as presented in table A 3 mm Molecular Line Survey toward The C-star Envelope CIT 6. For comparison, we also list the results of CIT 6 from our earlier work (Zhang et al., 2009a) and the values of IRC+10216 (Cernicharo et al., 2000; Zhang et al., 2017), CRL 2688 (Qiu et al., 2022), and the Sun (Lodders, 2003).
One of the most useful tracers of the relative degree of primary and secondary processing of stellar nucleosynthesis is the 12C/13C ratio, which is the most studied isotope ratio in evolved stars (Herwig, 2005). During the red giant phase, the 12C/13C ratio drops as 13C, a by-product of the CNO cycle, is brought to the surface of the star by the “first dredge-up”. In the AGB phase, the main product of the 3 process, 12C, is continuously transported to the surface with the periodic “third dredge-up”, and thus the 12C/13C ratio gradually increases (e.g. Milam et al., 2009). However, extensive observations show that the 12C/13C ratios in CSEs are far lower than those predicted by standard stellar models (e.g. Charbonnel & Do Nascimento, 1998). This is attributed to an extra mixing process known as “cool bottom processing” (Charbonnel, 1995), which may reduce the 12C/13C ratio of a low-mass AGB star to roughly 4 (Boothroyd & Sackmann, 1999; Sackmann & Boothroyd, 1999). For massive AGB stars (4 ), a hot bottom burning process occurs, bringing the 12C/13C ratio to an equilibrium value of approximately 3.5 (Frost et al., 1998). The optically-thin line of HC3N detected suggests a 12C/13C ratio of 17.8 5.5, which is in good agreement with the results of 25 10 and 12.1 1.3 obtained by Sopka et al. (1989) and Zhang et al. (2009a), respectively. CIT 6 and IRC+10216 have lower 12C/13C ratios compared to the solar value, which is an indication of the drudge-up process of AGB stars. The fact that CIT 6 has a lower 12C/13C ratio than IRC+10216 suggests that it is either more massive or more evolved.
The elements in the third row of the periodic table, including Si and S, are barely affected by the nucleosynthesis process of AGB stars. According to Cernicharo et al. (2000), the isotopic ratios of Si and S in IRC+10216 are roughly the same as the solar values. Our results show a 28SiC2/29SiC2 ratio of , which is in good accord with the prior value of Zhang et al. (2009a) but is lower than the solar value. This probably indicates that SiC2 has undertaken a chemical fractionation. We obtain a C32S/C34S ratio of 20.4 4.8, which is in accordance with the solar S isotopic ratio.
4 Discussion
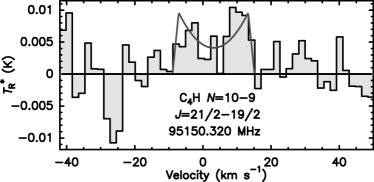
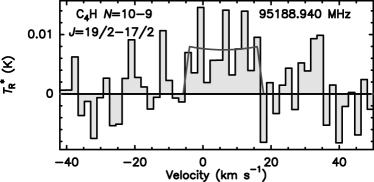
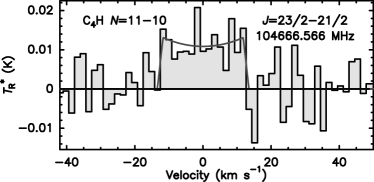
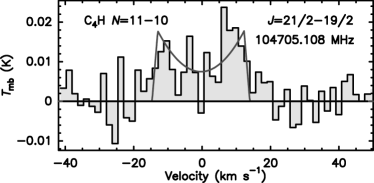
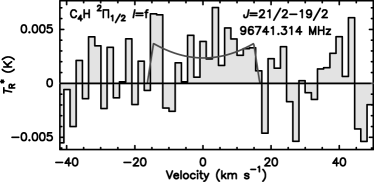
Similarly to IRC+10216, the spectrum of CIT 6 is characterized by abundant linear carbon-bearing compounds, such as CO, CS, SiC2, CN, HNC, C3N, HC3N, HC5N, and C4H. As shown in figure 13, the data points of HC3N and SiC2 do not follow a linear relationship with the lower- and higher- transitions denoting lower and higher excitation temperatures, respectively. This clearly indicates a stratified temperature structure. Presumably, the circumstellar temperature decreases with increasing radius. Table A 3 mm Molecular Line Survey toward The C-star Envelope CIT 6 shows a rough trend that the higher- transitions have narrower line widths. This is consistent with the idea that the higher- transitions primarily arise from the inner layer and and tend to be spatially unresolved.
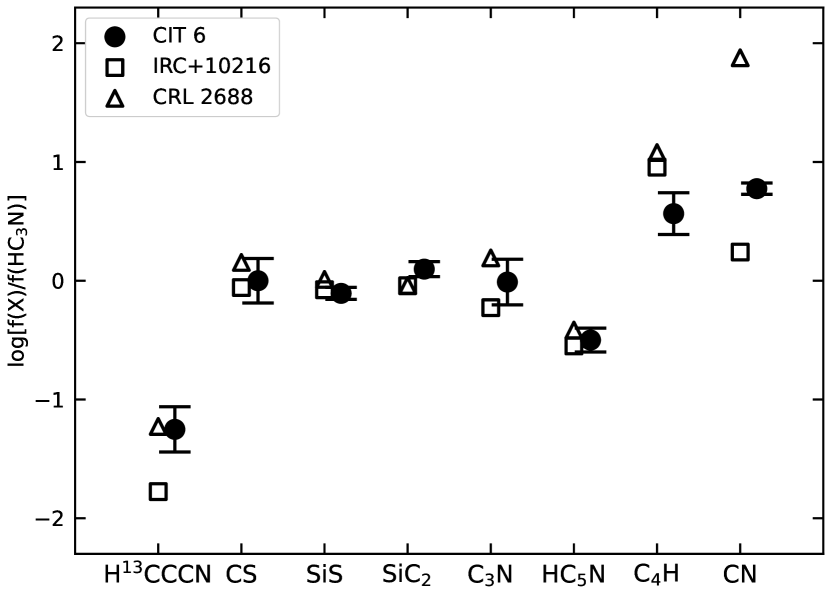
In figure 14, we compare the fractional abundances relative to HC3N for CIT 6, IRC+10216, and CRL 2688. CRL 2688 is a PPN that has just finished the AGB phase. Although the abundance patterns of the three sources are generally similar, the molecular abundances in CIT 6 are typically between those in IRC+10216 and CRL 2688, despite the three sources having generally similar patterns of molecular abundance. This likely indicates an evolutionary consequence from IRC+10216 through CIT 6 to CRL 2688.
The abundance of C4H is an exception: it is significantly lower in CIT 6 than those in IRC+10216 and CRL 2688. The amount of C4H in IRC+10216 is found to be five times more abundant than predicted by photochemical models (Dayal & Bieging, 1993). The enhancement of C4H in CRL 2688 has been discovered by Lucas et al. (1986). This molecule in CRL 2688 appears to dominantly be located in cold regions, with low- transitions being enhanced and high- transitions being strongly suppressed (Zhang et al., 2013). A speculative conjecture is that C4H is destructed during the expansion of AGB envelope but can be synthesized again in cold regions.
The most striking difference between the abundance patterns is the abundance of CN. The apparent augmentation of CN in CIT 6 over IRC+10216 can be attributed to the increasing photodissociation by interstellar radiation field via the reaction although other routes cannot be ruled out. Because the PPN has a hotter central star emitting more intense ultraviolet photons, CRL 2688 exhibits substantially more plentiful CN than CIT 6, and IRC+10216. CN might be enhanced even further when the CSE transitions into the PN phase. This has been verified through the observations of NGC 7027 (Zhang et al., 2008).
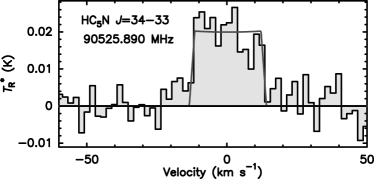
On the other hand, CN can be reprocessed to produce cyanogenic polynylene molecules (HC2n-1N, n 1), which are of astronomical interest due to their large dipole moments. In line with earlier results (Woods et al., 2003b; Zhang et al., 2009a; Chau et al., 2012), we find that the fractional abundances of HC3N and HC5N in CIT 6 are larger than those in IRC+10216. This is in accordance with the idea that cyanopolyynes are formed from CN, and it suggests that the longer cyanopolyyne molecules are then synthesized in a sequential fashion.
5 Summary
In this paper, we present an unbiased line survey toward CIT 6 at the 3 mm band with frequency coverage of 90–116 GHz. The spectral data can be taken as a supplement to our prior investigations on the molecular species in CIT 6. Forty-two emission lines belonging to 10 molecular species and four isotopologues are detected; to our knowledge, some of these lines are seen in this object for the first time. Three lines remain unidentified.
Given our detection limit and frequency coverage, there is not much of a chemical difference between IRC+10216 and CIT 6. We determine the column densities and fractional abundances of the molecules in CIT 6. The outcomes match our earlier results from observations made at different wavelength windows quite well. The temperature of the envelope is stratified. Through a comparison between the molecular abundances of different CSEs, we infer that CIT 6 is at an evolutionary stage between IRC+10216 and CRL 2688.
Funding
The work was supported by the National Science Foundation of China (NSFC, Grant Nos. 11973099 and 12003080) and the science research grants from the China Manned Space Project (NO. CMS-CSST-2021-A09 and CMS-CSST-2021-A10). JJQ is supported by the Guangdong Basic and Applied Basic Research Foundation (No. 2019A1515110588) and the Fundamental Research Funds for the Central Universities (Sun Yat-sen University, No. 22qntd3101).
YZ thanks Xinjiang Uygur Autonomous Region of China for support from the Tianchi Talent Program. XL acknowledges support from the Xinjiang Tianchi project (2019).
References
- Agúndez et al. (2014) Agúndez, M., Cernicharo, J., Decin, L., et al. 2014, ApJ, 790, L27.
- Agúndez et al. (2008) Agúndez, M., Cernicharo, J., Pardo, J. R., et al. 2008, Ap&SS, 313, 229.
- Aoki et al. (2022) Aoki, W., Beers, T. C., Honda, S., et al. 2022, PASJ, 74, 273.
- Bachiller et al. (1988) Bachiller, R., Gomez-Gonzalez, J., Bujarrabal, V., et al. 1988, A&A, 196, L5
- Bachiller et al. (1997) Bachiller, R., Fuente, A., Bujarrabal, V., et al. 1997, A&A, 319, 235
- Boothroyd & Sackmann (1999) Boothroyd, A. I. & Sackmann, I.-J. 1999, ApJ, 510, 232.
- Bublitz et al. (2019) Bublitz, J., Kastner, J. H., Santander-García, M., et al. 2019, A&A, 625, A101.
- Bujarrabal et al. (1994) Bujarrabal, V., Fuente, A., & Omont, A. 1994, A&A, 285, 247
- Bujarrabal et al. (1994) Bujarrabal, V., Fuente, A., & Omont, A. 1994, ApJ, 421, L47.
- Cernicharo et al. (2000) Cernicharo, J., Guélin, M., & Kahane, C. 2000, A&AS, 142, 181.
- Cernicharo et al. (2011) Cernicharo, J., Agúndez, M., & Guélin, M. 2011, in The Molecular Universe, eds. J. Cernicharo, & R. Bachiller (Cambridge University Press: Cambridge), 280, 237.
- Charbonnel (1995) Charbonnel, C. 1995, ApJ, 453, L41.
- Charbonnel & Do Nascimento (1998) Charbonnel, C. & Do Nascimento, J. D. 1998, A&A, 336, 915.
- Chau et al. (2012) Chau, W., Zhang, Y., Nakashima, J.-. ichi ., et al. 2012, ApJ, 760, 66.
- Cohen & Hitchon (1996) Cohen, M. & Hitchon, K. 1996, AJ, 111, 962.
- Crosas & Menten (1997) Crosas, M. & Menten, K. M. 1997, ApJ, 483, 913.
- Dayal & Bieging (1993) Dayal, A. & Bieging, J. H. 1993, ApJ, 407, L37.
- Frost et al. (1998) Frost, C. A., Cannon, R. C., Lattanzio, J. C., et al. 1998, A&A, 332, L17.
- Fukasaku et al. (1994) Fukasaku, S., Hirahara, Y., Masuda, A., et al. 1994, ApJ, 437, 410.
- Gong et al. (2015) Gong, Y., Henkel, C., Spezzano, S., et al. 2015, A&A, 574, A56.
- Groenewegen et al. (1996) Groenewegen, M. A. T., Baas, F., de Jong, T., et al. 1996, A&A, 306, 241
- Groenewegen et al. (1998) Groenewegen, M. A. T., van der Veen, W. E. C. J., & Matthews, H. E. 1998, A&A, 338, 491.
- He et al. (2008) He, J. H., Dinh-V-Trung, Kwok, S., et al. 2008, ApJS, 177, 275.
- Henkel et al. (1985) Henkel, C., Matthews, H. E., Morris, M., et al. 1985, A&A, 147, 143
- Herwig (2005) Herwig, F. 2005, ARA&A, 43, 435.
- Hrivnak & Bieging (2005) Hrivnak, B. J. & Bieging, J. H. 2005, ApJ, 624, 331.
- Höfner & Olofsson (2018) Höfner, S. & Olofsson, H. 2018, A&A Rev., 26, 1.
- Jewell & Snyder (1982) Jewell, P. R. & Snyder, L. E. 1982, ApJ, 255, L69.
- Jewell & Snyder (1984) Jewell, P. R. & Snyder, L. E. 1984, ApJ, 278, 176.
- Kahane et al. (1992) Kahane, C., Cernicharo, J., Gomez-Gonzalez, J., et al. 1992, A&A, 256, 235
- Kawaguchi et al. (2007) Kawaguchi, K., Fujimori, R., Aimi, S., et al. 2007, PASJ, 59, L47.
- Knapp & Chang (1985) Knapp, G. R. & Chang, K. M. 1985, ApJ, 293, 281.
- Knapp & Morris (1985) Knapp, G. R. & Morris, M. 1985, ApJ, 292, 640.
- Lindqvist et al. (2000) Lindqvist, M., Schöier, F. L., Lucas, R., et al. 2000, A&A, 361, 1036
- Lodders (2003) Lodders, K. 2003, ApJ, 591, 1220.
- Lovas (2004) Lovas, F. J. 2004, Journal of Physical and Chemical Reference Data,(AIP Publishing), 33, 177.
- Lucas & Guélin (1999) Lucas, R. & Guélin, M. 1999, Asymptotic Giant Branch Stars, 191, 305
- Lucas et al. (1986) Lucas, R., Omont, A., Guilloteau, S., et al. 1986, A&A, 154, L12
- Margulis et al. (1990) Margulis, M., van Blerkom, D. J., Snell, R. L., et al. 1990, ApJ, 361, 673.
- McGuire (2018) McGuire, B. A. 2018, ApJS, 239, 17.
- McGuire (2022) McGuire, B. A. 2022, ApJS, 259, 30.
- Meixner et al. (1998) Meixner, M., Campbell, M. T., Welch, W. J., et al. 1998, ApJ, 509, 392.
- Milam et al. (2009) Milam, S. N., Woolf, N. J., & Ziurys, L. M. 2009, ApJ, 690, 837.
- Müller et al. (2001) Müller, H. S. P., Thorwirth, S., Roth, D. A., et al. 2001, A&A, 370, L49.
- Müller et al. (2005) Müller, H. S. P., Schlöder, F., Stutzki, J., et al. 2005, Journal of Molecular Structure, 742, 215.
- Neri et al. (1998) Neri, R., Kahane, C., Lucas, R., et al. 1998, A&AS, 130, 1. doi:10.1051/aas:1998213
- Nyman et al. (1992) Nyman, L.-A., Booth, R. S., Carlstrom, U., et al. 1992, A&AS, 93, 121
- Olofsson & Rydbeck (1984) Olofsson, H. & Rydbeck, G. 1984, A&A, 136, 17
- Olofsson (1997) Olofsson, H. 1997, IAU Symposium, 178, 457
- Olofsson et al. (1998) Olofsson, H., Lindqvist, M., Nyman, L.-A., et al. 1998, A&A, 329, 1059
- Pardo et al. (2005) Pardo, J. R., Cernicharo, J., & Goicoechea, J. R. 2005, ApJ, 628, 275.
- Pardo et al. (2022) Pardo, J. R., Cernicharo, J., Tercero, B., et al. 2022, A&A, 658, A39.
- Pei & Chen (1997) Pei, C. C. & Chen, Y. F. 1997, Publications of the Purple Mountain Observatory, 16, 226
- Pickett et al. (1998) Pickett, H. M., Poynter, R. L., Cohen, E. A., et al. 1998, J. Quant. Spec. Radiat. Transf., 60, 883.
- Qiu et al. (2022) Qiu, J.-J., Zhang, Y., Zhang, J.-S., et al. 2022, ApJS, 259, 56.
- Qiu et al. (2023) Qiu, J.-J., Zhang, Y., Nakashima, J.-. ichi ., et al. 2023, A&A, 669, A121.
- Ramstedt & Olofsson (2014) Ramstedt, S. & Olofsson, H. 2014, A&A, 566, A145.
- Ramstedt et al. (2008) Ramstedt, S., Schöier, F. L., Olofsson, H., et al. 2008, A&A, 487, 645.
- Sackmann & Boothroyd (1999) Sackmann, I.-J. & Boothroyd, A. I. 1999, ApJ, 510, 217.
- Sahai et al. (1984) Sahai, R., Wootten, A., & Clegg, R. E. S. 1984, ApJ, 284, 144.
- Sahai (1990) Sahai, R. 1990, ApJ, 362, 652. doi:10.1086/169303
- Schöier et al. (2002) Schöier, F. L., Ryde, N., & Olofsson, H. 2002, A&A, 391, 577.
- Schöier et al. (2007) Schöier, F. L., Bast, J., Olofsson, H., et al. 2007, A&A, 473, 871.
- Schöier & Olofsson (2001) Schöier, F. L. & Olofsson, H. 2001, A&A, 368, 969.
- Shinnaga et al. (2017) Shinnaga, H., Claussen, M. J., Yamamoto, S., et al. 2017, PASJ, 69, L10.
- Sopka et al. (1989) Sopka, R. J., Olofsson, H., Johansson, L. E. B., et al. 1989, A&A, 210, 78
- Takano et al. (1992) Takano, S., Saito, S., & Tsuji, T. 1992, PASJ, 44, 469
- Thronson & Mozurkewich (1983) Thronson, H. A. & Mozurkewich, D. 1983, ApJ, 271, 611.
- Ulrich et al. (1966) Ulrich, B. T., Neugebauer, G., McCammon, D., et al. 1966, ApJ, 146, 288.
- Woods et al. (2003a) Woods, P. M., Millar, T. J., Herbst, E., et al. 2003a, A&A, 402, 189.
- Woods et al. (2003b) Woods, P. M., Schöier, F. L., Nyman, L.-Å., et al. 2003b, A&A, 402, 617.
- Zhang et al. (2017) Zhang, X.-Y., Zhu, Q.-F., Li, J., et al. 2017, A&A, 606, A74.
- Zhang et al. (2020) Zhang, Y., Chau, W., Nakashima, J.-. ichi ., et al. 2020, PASJ, 72, 46.
- Zhang et al. (2009a) Zhang, Y., Kwok, S., & Dinh-V-Trung 2009a, ApJ, 691, 1660.
- Zhang et al. (2009b) Zhang, Y., Kwok, S., & Nakashima, J. 2009b, ApJ, 700, 1262.
- Zhang et al. (2008) Zhang, Y., Kwok, S., & Dinh-V-Trung 2008, ApJ, 678, 328.
- Zhang et al. (2013) Zhang, Y., Kwok, S., Nakashima, J. et al. 2013, ApJ, 773, 71.
- Ziurys (2006) Ziurys, L. M. 2006, PNAS, 103, 12274.
- Zuckerman & Dyck (1989) Zuckerman, B. & Dyck, H. M. 1989, A&A, 209, 119
- Zuckerman (1981) Zuckerman, B. 1981, AJ, 86, 84.


*8c
Molecular transitions and measurements.
Frequency Species Transition rms Reference
(MHz) (upper-lower) (mK) (K) (K km s-1) (km s-1)
\endfirsthead
Frequency Species Transition rms d Mark
(MHz) (upper-lower) (mK) (K) (K km s-1) (km s-1)
\endhead
Notes
(N) Transitions that are newly detected toward this source.
(B) Blended fine-structure lines, where the total intensity is given.
Transitions reported in the references that are denoted by the numbers:
(1) Zuckerman (1981); (2) Olofsson & Rydbeck (1984); (3) Knapp & Morris (1985);
(4) Bachiller et al. (1988); (5) Zuckerman & Dyck (1989); (6) Sahai (1990);
(7) Margulis et al. (1990); (8) Nyman et al.(1992); (9) Pei & Chen (1997);
(10) Meixner et al. (1998); (11) Neri et al. (1998); (12) Olofsson et al. (1998);
(13) Schöier & Olofsson (2001); (14) Schöier et al. (2002); (15) Ramstedt et al. (2008);
(16) Milam et al. (2009); (17) Thronson & Mozurkewich (1983); (18) Sopka et al. (1989);
(19) Kahane et al. (1992); (20) Groenewegen et al. 1996; (21) Woods et al.( 2003b);
(22) Knapp & Chang (1985); (23) Ramstedt & Olofsson (2014); (24)Jewell & Snyder (1984);
(25) Sahai et al. (1984); (26) Henkel et al. (1985); (27) Schöier et al. (2007);
(28) Bujarrabal et al. (1994); (29) Bujarrabal et al. (1994); (30) Lindqvist et al. (2000);
(31) Jewell & Snyder (1982); (32) Bachiller et al. (1997); (33) Fukasaku et al. (1994).
\endlastfoot115271.2 CO 2.5 1.731 47.801 0.200 16.0 0.1 (1)-(21)
110201.4 13CO 1.1 0.074 2.681 0.082 16.2 0.1 (17)-(23)
97981.0 CS 2.5 0.291 7.229 0.138 15.2 0.2 (12), (21), (24)
96413.0 C34S 9.7 0.012 0.352 0.062 9.9 0.5 N
90771.6 SiS 5.2 0.026 0.592 0.036 13.5 0.9 (12), (21), (26)-(30)
108924.3 SiS 7.7 0.038 0.766 0.061 14.9 1.4 (21), (25), (26)
93063.6 SiC2 3.9 0.035 0.886 0.032 13.8 0.2 N
94245.4 SiC2 5.9 0.019 0.576 0.041 13.2 0.3 N
95579.4 SiC2 6.7 0.020 0.496 0.047 11.8 0.4 N
115382.4 SiC2 2.5 0.045 1.279 0.159 12.8 0.3 (21)
113820.1 29SiC2 7.9 0.013 0.300 0.050 14.5 1.6 N
113123.3 CN 1.1 0.030 0.819 0.074 13.1 0.8 (32)
113144.2 CN 1.1 0.107 2.598 0.080 16.4 0.6 (32)
113170.5 CN 10.0 0.124 2.940 0.085 13.7 0.2 (32)
113191.3 CN 8.4 0.121 2.857 0.058 15.0 0.3 (32)
113488.1 CN 1.1 0.415 16.041 … B, (16), (21), (32)
113491.0 CN … … … …
113499.6 CN … … … …
113508.9 CN … … … …
90663.5 HNC 4.4 0.057 1.654 0.043 13.8 0.2 (18), (21), (28)-(30)
98940.0 C3N 7.8 0.013 0.428 0.055 12.2 0.4 N
98958.8 C3N 8.6 0.016 0.279 0.115 10.6 1.7 N
108834.3 C3N 7.1 0.017 0.584 0.052 16.2 0.4 (21), (26)
108853.0 C3N 6.8 0.015 0.276 0.039 9.2 0.7 (21), (26)
90979.0 HC3N 7.0 0.134 3.466 0.076 14.5 0.2 (18), (21), (24), (28)-(31)
100076.4 HC3N 8.6 0.151 3.945 0.084 15.4 0.2 N
109173.6 HC3N 1.0 0.154 4.026 0.096 13.8 0.1 (24)
96983.0 H13CCCN 8.5 0.009 0.371 0.062 16.1 0.7 N
114615.0 H13CCCN 1.5 0.011 0.448 0.097 12.0 0.5 N
90525.9 HC5N 4.3 0.020 0.510 0.033 12.8 0.4 (21), (30)
93188.1 HC5N 4.8 0.016 0.425 0.035 12.0 0.3 N
95850.3 HC5N 7.1 0.015 0.532 0.059 16.9 0.6 N
98512.5 HC5N 1.1 0.020 0.502 0.076 10.6 0.7 N
101174.7 HC5N 6.0 0.015 0.471 0.047 13.0 0.5 N
103836.8 HC5N 5.9 0.007 0.254 0.040 12.9 0.5 N
106498.9 HC5N 9.6 0.012 0.459 0.059 9.7 0.3 N
109161.0 HC5N 8.1 0.015 0.294 0.038 6.7 0.0 N
95150.3 C4H 4.0 0.005 0.139 0.028 12.9 0.9 (21), (33)
95188.9 C4H 5.0 0.008 0.173 0.032 10.9 0.2 (21), (33)
96741.3 C4H =1, , , =f 3.1 0.002 0.081 0.022 14.2 0.2 N
104666.6 C4H 6.2 0.011 0.292 0.040 12.6 0.0 N
104705.1 C4H 5.0 0.007 0.307 0.034 13.4 0.3 N
Unidentified lines. Frequency rms d (MHz) (mK) (K) (K km s-1) (km s-1) 95658 6.5 0.008 98107 4.9 0.005 112822 7.1 0.046
Excitation temperatures, column densities, and fractional abundances with respect to H2.a
Species
(K)
(cm-2)
This work
Z09b
C12c
This work
Z09
C12
This Work
Z09
C12
CO
5.4
…
…
2.95(17)
1.63(17)
…
9.67(-4)
…
…
13CO
5.3
…
…
2.47(16)
1.35(16)
…
7.50(-5)
…
…
CS
5.4
…
…
2.96(14)
1.72(14)
…
1.98(-6)
2.0(-6)
7.0(-6)
C34S
10.3
…
…
2.02(13)
2.58(13)
…
9.71(-8)
3.0(-7)
…
SiS
43.4
29.6
…
1.46(14)
2.96(14)
…
1.55(-6)
3.4(-6)
…
SiC2
13.9
57.6
…
9.08(13)
1.53(14)
…
2.48(-6)
2.4(-6)
…
29SiC2
41.5
…
…
4.41(13)
2.26(13)
…
4.89(-7)
3.6(-7)
…
CN
4.2
…
…
1.56(15)
1.22(15)
…
1.18(-5)
2.6(-5)
…
C3N
20.3
…
…
6.11(13)
2.16(13)
…
1.93(-6)
1.9(-6)
…
HC3N
17.0
41.0
11.8
1.28(14)
7.69(13)
3.3(14)
1.98(-6)
1.3(-6)
7(-6)
H13CCCN
84.4
…
…
2.08(13)
…
…
1.11(-7)
…
…
HC5N
34.7
…
20
1.21(14)
…
1.3(14)
6.27(-7)
…
2.6(-6)
C4H
39.9
53.9
…
7.43(13)
3.04(14)
…
7.27(-6)
4.0 (-6)
…
{tabnote}
ax(y) represents .
bZ09 refers to Zhang et al. (2009a).
cC12 refers to Chau et al. (2012).
Isotopic abundance ratios.
Isotopic Ratio
CIT 6
IRC+10216
CRL 2688b
Solarc
Sepcies
This work
Z09a
12C/13C
12CO/13CO
12.9 0.5
12.1 1.3
…
14.1
89
H12CCCN/H13CCCN
17.8 5.5
…
59.6d
17.2
…
28Si/29Si
28SiC2/29SiC2
5.1 1.5
6.7 3.1
…
26.8
19.6
32S/34S
C32S/C34S
20.4 4.8
6.7 1.2
20.4e
9.5
22.5
{tabnote}
aZ09 refers to Zhang et al. 2009a.
bFrom Qiu et al. (2022).
cFrom Lodders (2003).
dFrom Zhang et al. (2017).
eFrom Cernicharo et al. (2000).