A JWST/MIRI and NIRCam Analysis of the Young Stellar Object Population in the Spitzer I region of NGC 6822
Abstract
We present an imaging survey of the Spitzer I star-forming region in NGC 6822 conducted with the NIRCam and MIRI instruments onboard JWST. Located at a distance of 490 kpc, NGC 6822 is the nearest non-interacting low-metallicity (0.2 ) dwarf galaxy. It hosts some of the brightest known HII regions in the local universe, including recently discovered sites of highly-embedded active star formation. Of these, Spitzer I is the youngest and most active, and houses 90 color-selected candidate young stellar objects (YSOs) identified from Spitzer Space Telescope observations. We revisit the YSO population of Spitzer I with these new JWST observations. By analyzing color-magnitude diagrams (CMDs) constructed with NIRCam and MIRI data, we establish color selection criteria and construct spectral energy distributions (SEDs) to identify candidate YSOs and characterize the full population of young stars, from the most embedded phase to the more evolved stages. In this way, we have identified 129 YSOs in Spitzer I. Comparing to previous Spitzer studies of the NGC 6822 YSO population, we find that the YSOs we identify are fainter and less massive, indicating that the improved resolution of JWST allows us to resolve previously blended sources into individual stars.
1 Introduction
NGC 6822 is an isolated dwarf irregular galaxy located in the Local Group at a distance of kpc (Sibbons et al., 2015), with a metallicity comparable to that of the Small Magellanic Cloud (0.2 Z⊙; García-Rojas et al., 2016). It is characterized by a central bar, oriented in a north-south direction, that contains most of the young stellar content of the galaxy (Schruba et al., 2017), an H I disk that extends well beyond the optical extent (de Blok & Walter, 2000, 2006), and several prominent HII regions and OB associations (Efremova et al., 2011; Rubin et al., 2016). These HII regions are among the most massive and brightest known in the local universe (Hubble, 1925) and span a range of evolutionary stages (Schruba et al., 2017; Jones et al., 2019).
The best-known HII regions (i.e., Hubble I/III, V, and X along the northern part of the galaxy, and Hubble IV in the south) have been studied in detail through numerous multi-wavelength observations: ultraviolet (UV; Efremova et al., 2011), H (Kennicutt, 1979; Hodge et al., 1988; Massey et al., 2007), near- and mid-infrared (IR; Cannon et al., 2006), far-IR (Gallagher et al., 1991; Israel et al., 1996), and molecular gas (Israel et al., 2003; Schruba et al., 2017). These studies show that the Hubble regions host massive young stellar objects (YSOs) and are actively forming stars, with an average star formation rate (SFR) of M⊙ yr-1 over the past 10 Myr. In addition, these star-forming regions appear to exist at varying evolutionary stages from one another, based on differing measured star-formation rates (SFRs) and demographics of young and pre-main sequence (PMS) stars (Jones et al., 2019; Kinson et al., 2021). These star-formation properties make NGC 6822 a useful system for understanding extragalactic activity and evolution in the early universe (e.g., Lee et al., 2005; Hunter & Kaufman, 2007; Rubin et al., 2016).
Observations in the IR provide a window into the earliest phases of formation for super star clusters (SSCs), which possess 105 M⊙ of stars and are thought to be precursors to globular clusters. The recent discovery of the proto-SSC candidate Spitzer I, as well as the embedded star-forming regions Spitzer II and III, provide further evidence for the existence of new massive star formation in NGC 6822 (Jones et al., 2019; Hirschauer et al., 2020). Compared to the optically-identified Hubble regions, the IR-detected star-forming clusters were found to be younger, with many more early-stage YSOs as determined by spectral energy distribution (SED) analysis. Furthermore, because they possess a higher level of IR flux than H, their star-formation activity is expected to be increasing (Jones et al., 2019). These characteristics place Spitzer I among other SSCs, including Westerlund I in the Milky Way, which possesses at least 200 massive stars (Clark et al., 2005), and R136 in the 30 Doradus region of the Large Magellanic Cloud (LMC), home to dozens of O3 stars, including several with masses 120 M⊙, within only two parsecs from the center of the cluster (Hunter et al., 1995). With JWST observations of these SSCs, as well as a forthcoming JWST program (Nayak et al., in prep.) to observe the proto-SSC candidate H72.97-69.39 in the N79 region of the LMC (Ochsendorf et al., 2017; Nayak et al., 2019; Andersen et al., 2021), it becomes possible to perform comparative analyses of the characteristics of SSCs across a range of evolutionary stage, environment, and level of chemical enrichment.
Detailed study of the populations of young stars in these regions will allow for a more complete understanding of the physical mechanisms governing star formation in environments typical of the early universe. Photometry in the IR traces the beginnings of stellar lifetimes: YSOs are birthed in active star-forming regions and exhibit strong IR-excess as light is absorbed and re-emitted by cool, dusty envelopes and accretion disks. With Spitzer photometry, the massive stars (8 ) and star clusters that are accessible account for only one in every ten thousand, and because YSOs progress rapidly through their evolutionary stages, observations are quite rare. Jones et al. (2019) determined a population of massive YSOs in Spitzer I of 90 sources, nearly twice as many as were found in the next-most massive star-forming regions Hubble IV and V (53 sources each), while Kinson et al. (2021) found 139 candidate YSOs within the same region by applying machine learning (ML) techniques to the same dataset. Because it is impossible to conduct such resolved studies for the earliest galaxies, nearby regions with comparable metallicities offer the best laboratories for study. Harnessing the high sensitivity afforded by JWST (Gardner et al., 2023; Rigby et al., 2023), our observing program provides a census of young stars down to a stellar mass of 1 , allowing for a more complete understanding of star formation in environments analogous to the early universe.
In this work, we present JWST observations of the central stellar bar of NGC 6822 taken with the Near-Infrared Camera (NIRCam; Rieke et al., 2005, 2023) and Mid-Infrared Instrument (MIRI; Rieke et al., 2015; Wright et al., 2023), which provide unprecedented detail of the stellar populations and interstellar medium (ISM) from the near- to mid-IR. We will focus on the young stellar population of the Spitzer I region, while an accompanying paper will discuss the NGC 6822 program as a whole, including the parallel fields, and the evolved star population (Nally et al. in prep.). In §2 we describe the observing program, observational setup, and data processing, in §3 we present color images of Spitzer I and our methods for selecting YSOs, in §4 we compare our results to previous estimates of the YSO population in Spitzer I and YSO studies in other nearby low-metallicity star-forming regions, and finally in §5 we summarize our findings and discuss future work on studying NGC 6822 and the Spitzer I candidate proto-SSC.
2 Observations
We present here observations of NGC 6822 taken with the NIRCam and MIRI instruments onboard JWST as part of the GTO program ID:1234 (PI: M. Meixner). Observations with NIRCam were taken on 2022 September 4 for a cumulative 4.80 hours with the F115W and F200W short wavelength (SW) filters and F356W and F444W long wavelength (LW) filters using both the A and B modules. These filters were selected in an effort to match existing stellar populations work employing standard Johnson J and Ks (SW) as well as Spitzer IRAC 3.6 and 4.5 m (LW) filters, respectively. The observations were taken with the fullbox 4tight primary dither pattern and a 10.0% overlap in rows and columns to ensure no gaps are present in the 21 NIRCam mosaic. We also employed a three-point standard subpixel dither pattern to sample the point-spread function (PSF). We used the bright2 readout pattern, one integration per exposure with seven groups per integration, and 12 dithers in an effort to optimize S/N (following known best practices at the time of planning) for a total of 1,803 sec integration time per filter. The NIRCam mosaics are centered at RA19:44:56.1990, Dec14:47:51.29 and cover an area of arcmin2.
We processed the NIRCam observations using the JWST pipeline (version 1.9.6) with the jwst_1075.pmap context. This makes use of the latest on-sky derived photometric zero-points (Gordon et al., 2022; Boyer et al., 2022) that were implemented in 2022 October as part of jwst_0989.pmap in the Operational Pipeline Calibration Reference Data System (CRDS) version 11.16.20. We applied an additional correction to the level 2 calibrated frames from Image2Pipeline (*_cal.fits files) in order to correct for striping from 1/f noise using the python routine image1overf.py111https://github.com/chriswillott/jwst.git. We then combined these corrected level 2 frames with Image3Pipeline, creating mosaics for each of our four filters that are aligned to the GAIA-DR3 WCS frame using the JWST/Hubble Alignment Tool (JHAT; Rest, 2023). For additional details pertaining to the NIRCam image processing, see the overview paper (Nally et al., in prep.).
Our MIRI observations consist of a mosaic, where five of the tiles were observed on 2022 September 4 and the final tile was observed on 2022 September 15 for a total of 15.12 hours. Observations were taken using the F770W, F1000W, F1500W, and F2100W filters, selected based on predictions of fluxes for relevant stellar populations by Jones et al. (2017), with the cycling dither pattern using four positions. We used the fastr1 readout pattern with numbers for groups per integration and integrations per exposure determined for each filter using the exposure time calculator (ETC) and applying recommended best practices for maximizing S/N while avoiding saturation (see Nally et al. in prep. for additional details). The MIRI mosaics are centered at RA19:44:58.0949, Dec14:48:20.620 and cover an area of arcmin2.
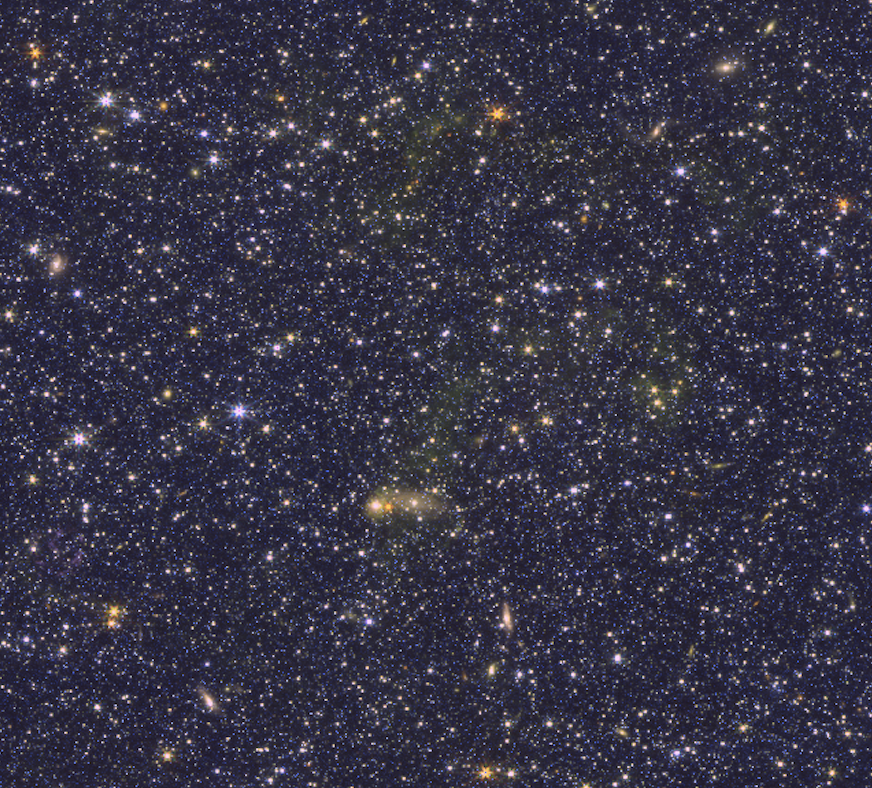
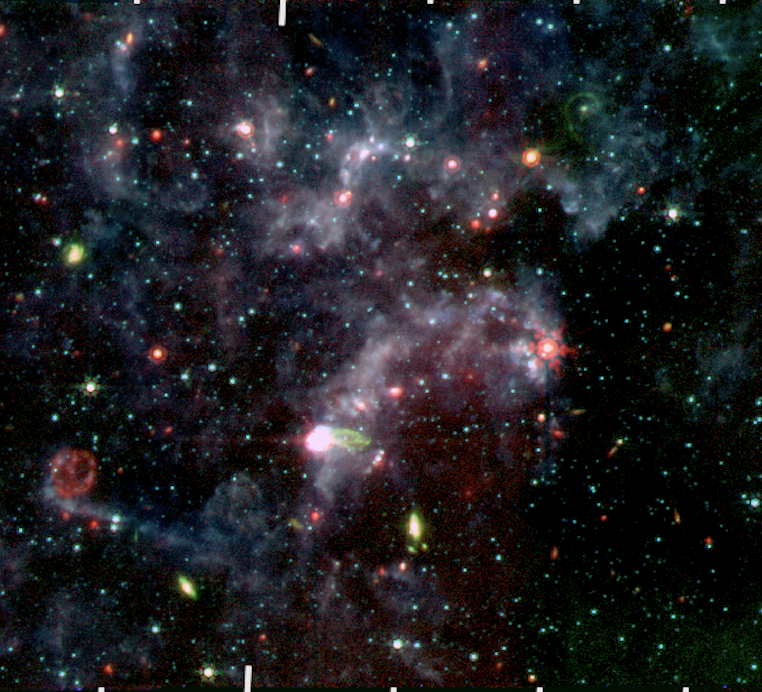
We created calibrated MIRI mosaics using JWST pipeline version 1.9.5 with CRDS version 11.16.21 and context jwst_1084.pmap. Each of the raw MIRI ramp files was processed through Dectector1Pipeline and the output through Image2Pipeline with default parameters to produce flux-calibrated dither images across all filters. We used the tweakreg step on the resulting files to determine and apply an astrometric correction to all dithers in each mosaic tile individually to align to Gaia DR2. Since no dedicated background observations were taken, we generated backgrounds from Visits 001 and 005 of Observation 007, i.e., the two tiles at the mosaic edges, as these are least affected by real diffuse emission in NGC 6822. A detailed description of the background treatment is presented in Nally et al. (in prep). We constructed mosaics from the background subtracted images for each filter using the Image3Pipeline with the tweakreg step switched off as the astrometric correction was already applied. We present in Figure 1 multi-color images of the NIRCam and MIRI mosaics zoomed onto the Spitzer I region.
To build a photometric catalog of sources in our observations, we employ a mix of aperture and PSF photometry. For both instruments, we first perform single-frame aperture photometry using the starbugii tool (Nally & Jones, 2022) which has been developed and optimized for JWST NIRCam and MIRI observations in crowded fields with complex backgrounds. We perform source detection on the individual Gaia-aligned level 2 frames. For each wavelength band, we match detections between dithers. In NIRCam, where our dither mode results in three or more overlapping exposures for a given pointing, we require that a detection be matched in two or more exposures to be included in our catalog. In MIRI, because our dither mode results in four or more overlapping exposures for a given pointing, we require sources to be detected in at least three frames. Sources not meeting these thresholds are discarded, thus cleaning the catalogue of most detector artifacts, stray cosmic rays, and snowballs. To limit the effects of crowding, we take a consistent tight aperture radius of 1.5 pixels and a sky annulus radius 3-4.5 pixels across all NIRCam bands. For MIRI, we adjust this aperture radius to 2.5 pixels for F770W and F1000W, and to 3.0 pixels for the F1500W and F2100W bands, and calculate backgrounds using annuli of 4-5.5 and 4.5-6 pixels respectively. We then apply the latest aperture corrections from CRDS jwst_miri_apcorr_0005.fits jwst_nircam_apcorr_0004.fits. Background galaxy contaminants are removed with cuts on the geometric parameters of each source generated by starbugii using limits of sharpness 0.4-0.9 and roundness for NIRCam.
For our NIRCam observations, we additionally perform PSF-photometry, again using starbugii. This routine creates a background image by masking sources detected in the aperture photometry step. The resulting image represents diffuse nebulous emission and is subtracted from the original frames. Using webbpsf (Perrin et al., 2014) version 1.1.1, we generate a 5″ radius PSF for each subarray of the NIRCam detectors. We then run starbugii’s PSF fitting routine on the clean, background subtracted image, using the source positions detected during the aperture photometry. This routine fits both a flux and position, allowing the centroid to be kept free within 0.1″ of the initial position. In cases where this is exceeded, the flux is refit using the coordinates of the initial detection. We use our aperture photometry catalog to apply a necessary zero-point correction to the PSF photometry measurements. We select sources in our aperture catalog of intermediate magnitude with reliable S/N ratios and match these aperture detected sources to their PSF counterparts. This process is expounded upon in detail in (Nally & Jones, 2022) and (Nally et al. in prep). We then derive the instrumental zero-point from the median photometric difference in both catalogs and apply these corrections to each NIRCam filter. Current MIRI PSFs simulated from by webbpsf lack the cruciform component which results in poor PSF fitting, thus in this work we build our catalog using aperture photometry only for MIRI bands.
We convert our photometry catalog, which is generated in units of AB magnitudes by starbugii, into units of Vega magnitudes for easier comparison with previous work. For this conversion we employ the CRDS jwst_nircam_abvegaoffset_0001.asdf and jwst_miri_abvegaoffset_0001.asdf. We apply a final foreground reddening correction to our NIRCam photometry. We adopt a value of (Tantalo et al., 2022) and to apply the extinction curve of Cardelli et al. (1989). At mid-infrared wavelengths, such foreground reddening is negligible, thus we apply no additional corrections to out MIRI photometry.
| Color Selection | Number of Sources |
|---|---|
| F770WF1500W and | 38 |
| F1000WF1500W and | 29 |
| F356WF770W and | 154 |
| F444WF770W and | 145 |
| and and | 780a |
| and and | 750b |
Note. — aHere y corresponds to the F444W magnitude, and x corresponds to the F115WF444W color. bHere y corresponds to the F356W magnitude, and x corresponds to the F115WF356W color.
3 Results
3.1 Images
In the left panel of Figure 1, we show a NIRCam three-color image of Spitzer I, combining the F115W filter in blue, the F356W filter in green, and the F444W in red, while the right panel shows a MIRI three-color image combining F770W in blue, F1000W in green, and F2100W in red. At the shorter NIRCam wavelengths, Spitzer I resembles a densely populated star field and little diffuse and extended emission is visible. We see only in the F356W filter (green) some very faint diffuse emission which appears to track that which is seen in the MIRI images. The F356W filter is broad and overlaps with the F335M filter which traces the 3.3 µm polycyclic aromatic hydrocarbon (PAH) feature (Sandstrom et al., 2023). The 3.3 µm emission feature is thought to be the result of a CH stretching vibration mode in small, neutral PAHs (Schutte et al., 1993; van Diedenhoven et al., 2004) excited by UV photons. As Spitzer I is a very active star-forming region (Jones et al., 2019; Hirschauer et al., 2020; Kinson et al., 2021), the faint emission we see in the F356W filter may be associated with PAHs. A number of resolved background galaxies are also visible in the NIRCam image, most notably what appears to be a spiral galaxy close to the center.
In contrast to the abundance of stars we see in the NIRCam images, MIRI provides us with a different, complementary perspective of Spitzer I (Figure 1, right panel). We observe widespread, diffuse emission in the F770W filter (blue). This band traces the 7.7 µm PAH feature, which originates from the CC stretching vibrational modes of larger, positively-charged molecules. Several features stand out in the F1000W filter, which traces warm dust from silicates, such as the spiral galaxy we observe in NIRCam close to the center of the image. Interestingly, we see in the top right corner of the MIRI image a point-like source with a pinwheel-like “tail”. The pinwheel structure resembles that of the Wolf-Rayet (WR) star WR 104, which hosts an OB companion (see Figure 1 of Tuthill et al., 1999). The collision of stellar winds produces dust (see also Lau et al., 2022) that is then radially swept by the WR wind into a stream that follows an Archimedian spiral. However, there are currently only four known WR stars in NGC 6822, none of which fall in our MIRI field-of-view (Massey et al., 1987), and the large angular size of this object at the distance of NGC 6822 makes this unlikely. Another possibility is that this may be a supernova remnant (SNR) superimposed on a background galaxy, or it may simply be a background galaxy.
In the MIRI F2100W filter, we observe diffuse emission associated with some of the F770W emission; however, we also see a bubble structure toward the lower left of the image that is not visible in other filters in this data set. This corresponds to SNR Ho 12 which was first identified by Hodge (1977). Kong et al. (2004) perform a multi-wavelength analysis of this SNR, with X-ray, optical, and radio observations, and estimate the age of Ho 12 to be years. SNR Ho 12 will be investigated further using these MIRI observations in an upcoming work (Kavanagh et al. in prep.).
JWST has revealed the structure of the Spitzer I star-forming region in exceptional detail, and in the following sections, we will investigate color-magnitude diagrams (CMDs) and SEDs of sources in this region extracted with starbugii (Nally & Jones, 2022).
3.2 YSO Selection
3.2.1 Color Magnitude Diagrams
As Spitzer I is likely the youngest and most active star-forming region in NGC 6822, we combine NIRCam and MIRI photometry to identify its YSO population, from the most embedded sources to those that are approaching the main sequence. In their earliest stages, protostars are associated with a dusty, infalling envelope and an accretion disk. As the protostar evolves, the disk and circumstellar envelope disperse, revealing the young star (Robitaille et al., 2006). Throughout this evolution, YSOs are seen at mid-IR wavelengths in their embedded phase, and emerge at shorter wavelengths when their disks and circumstellar dust dissipate or become optically thin.
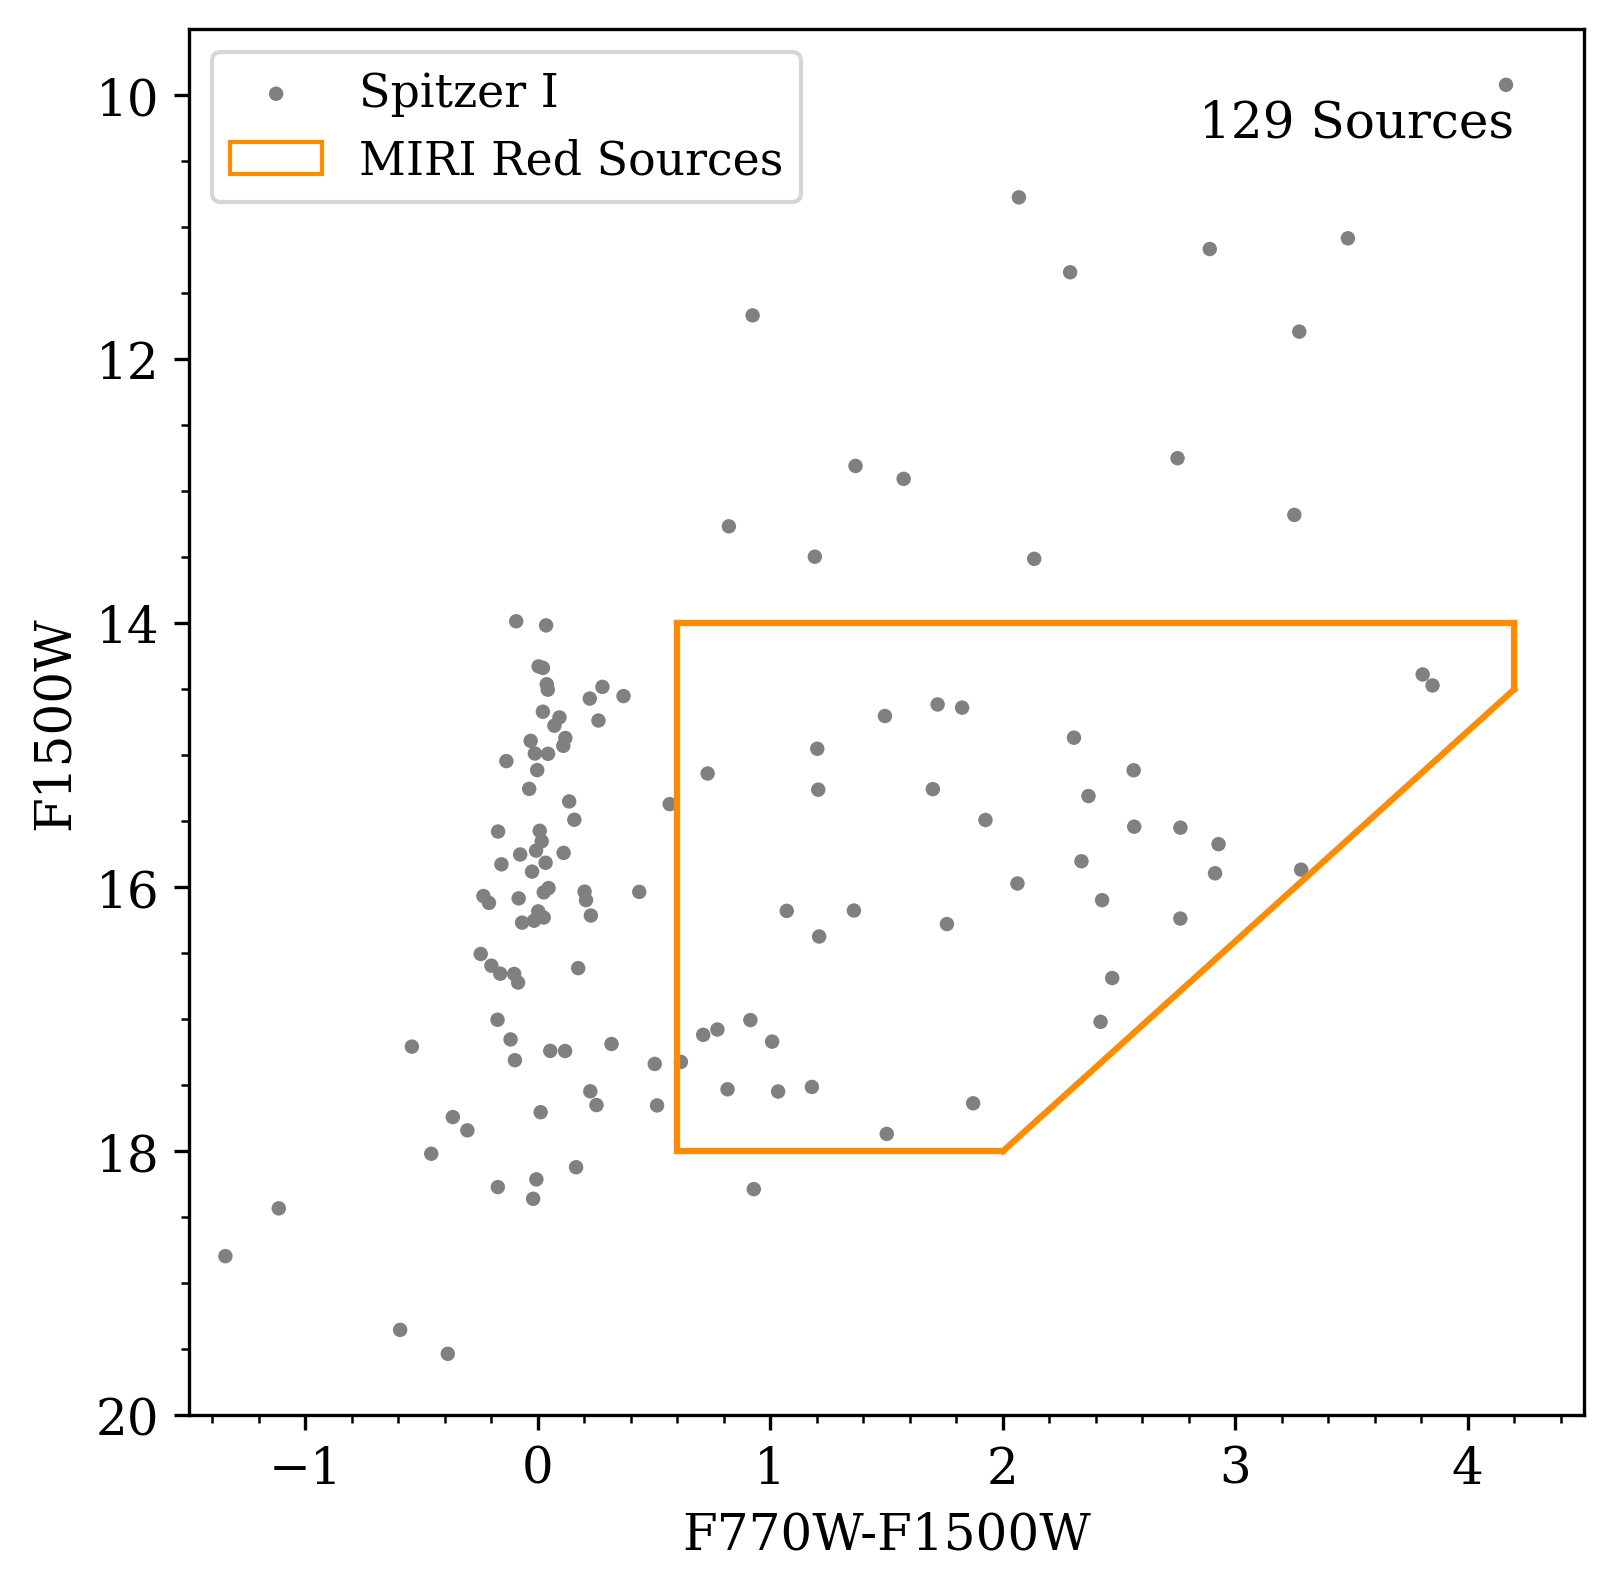
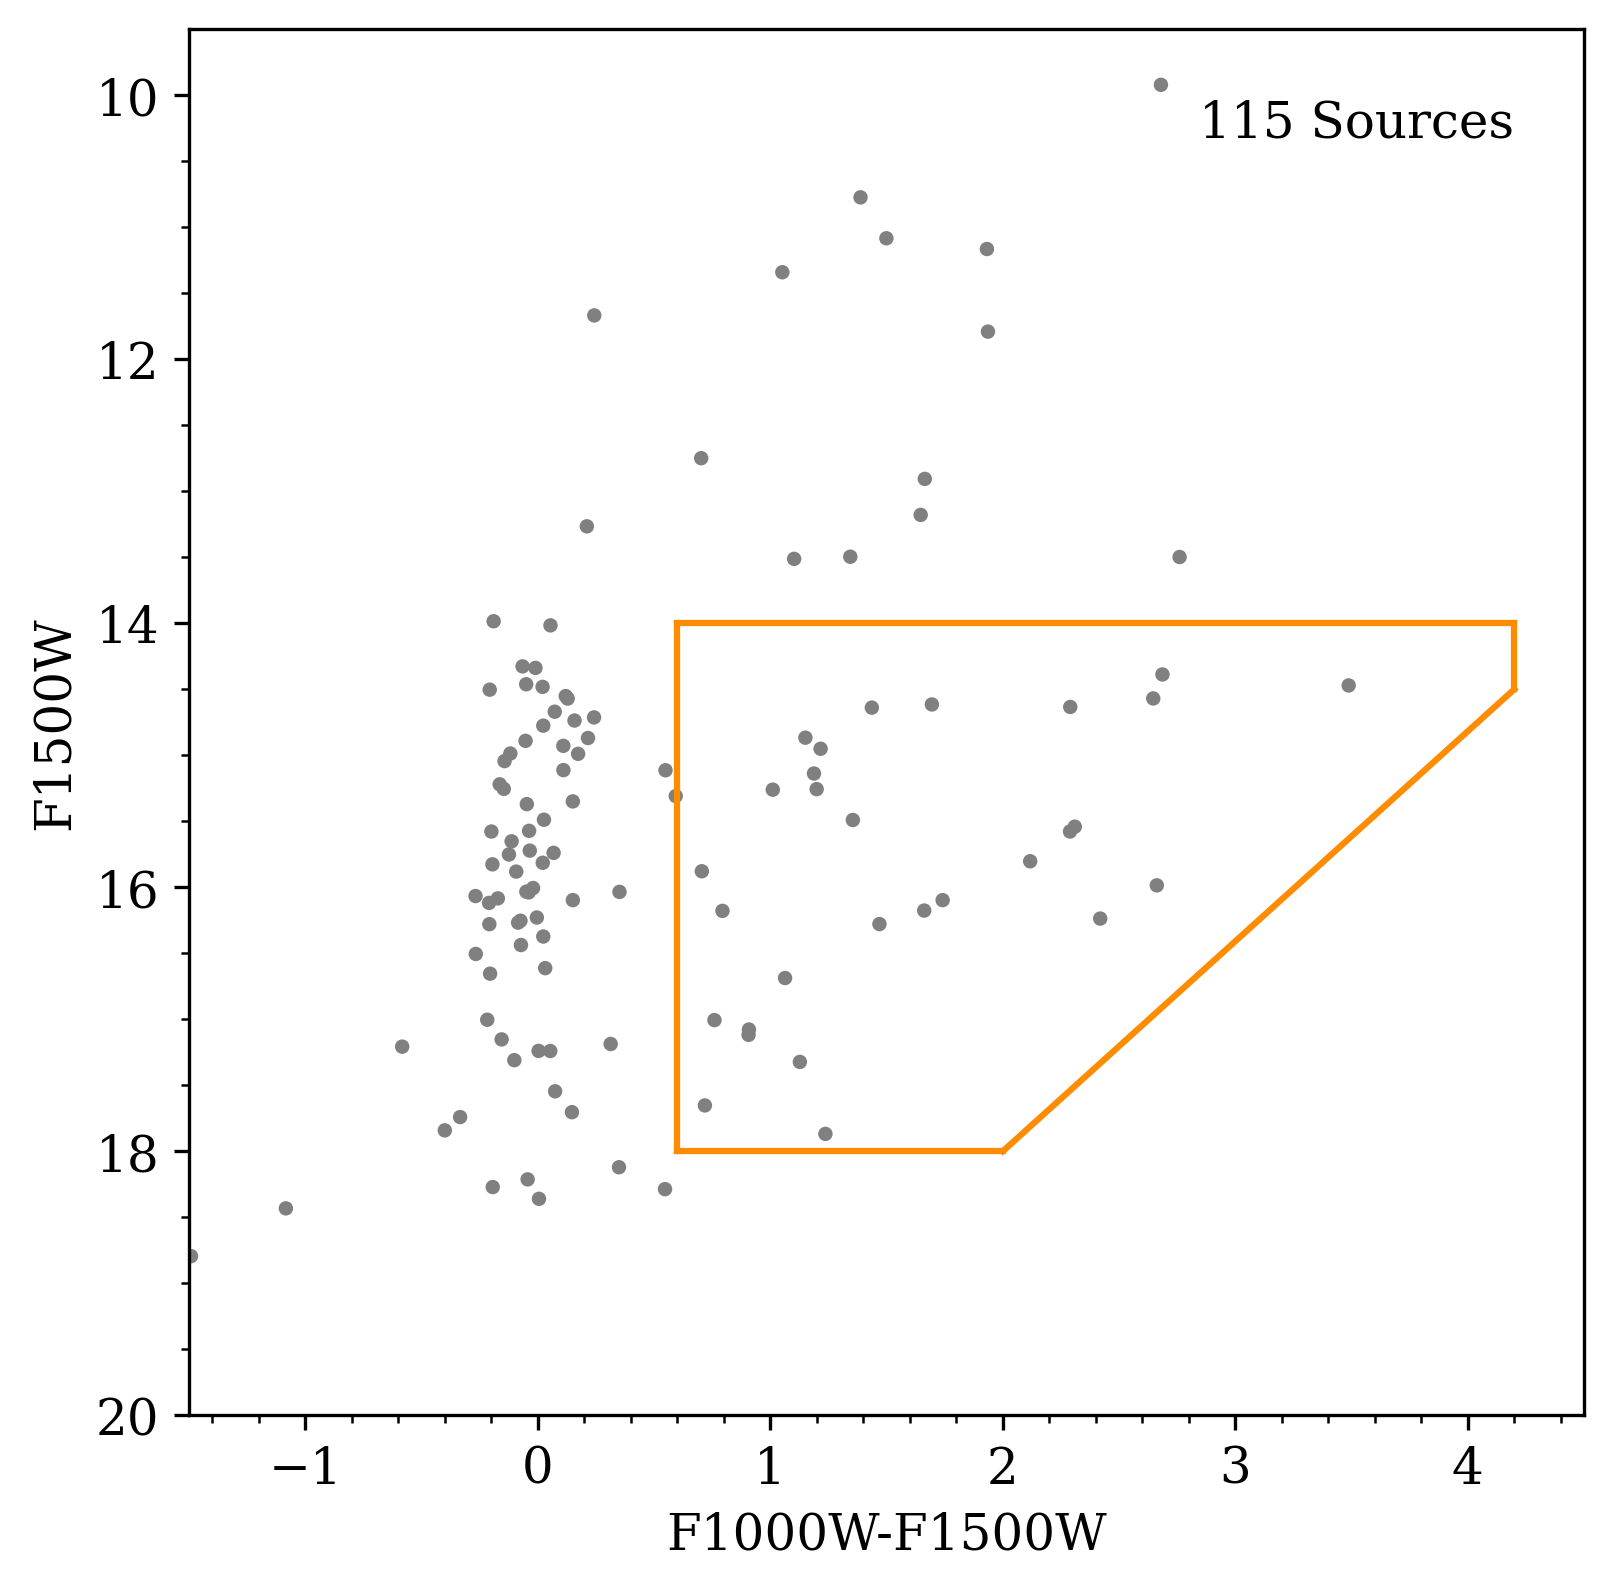
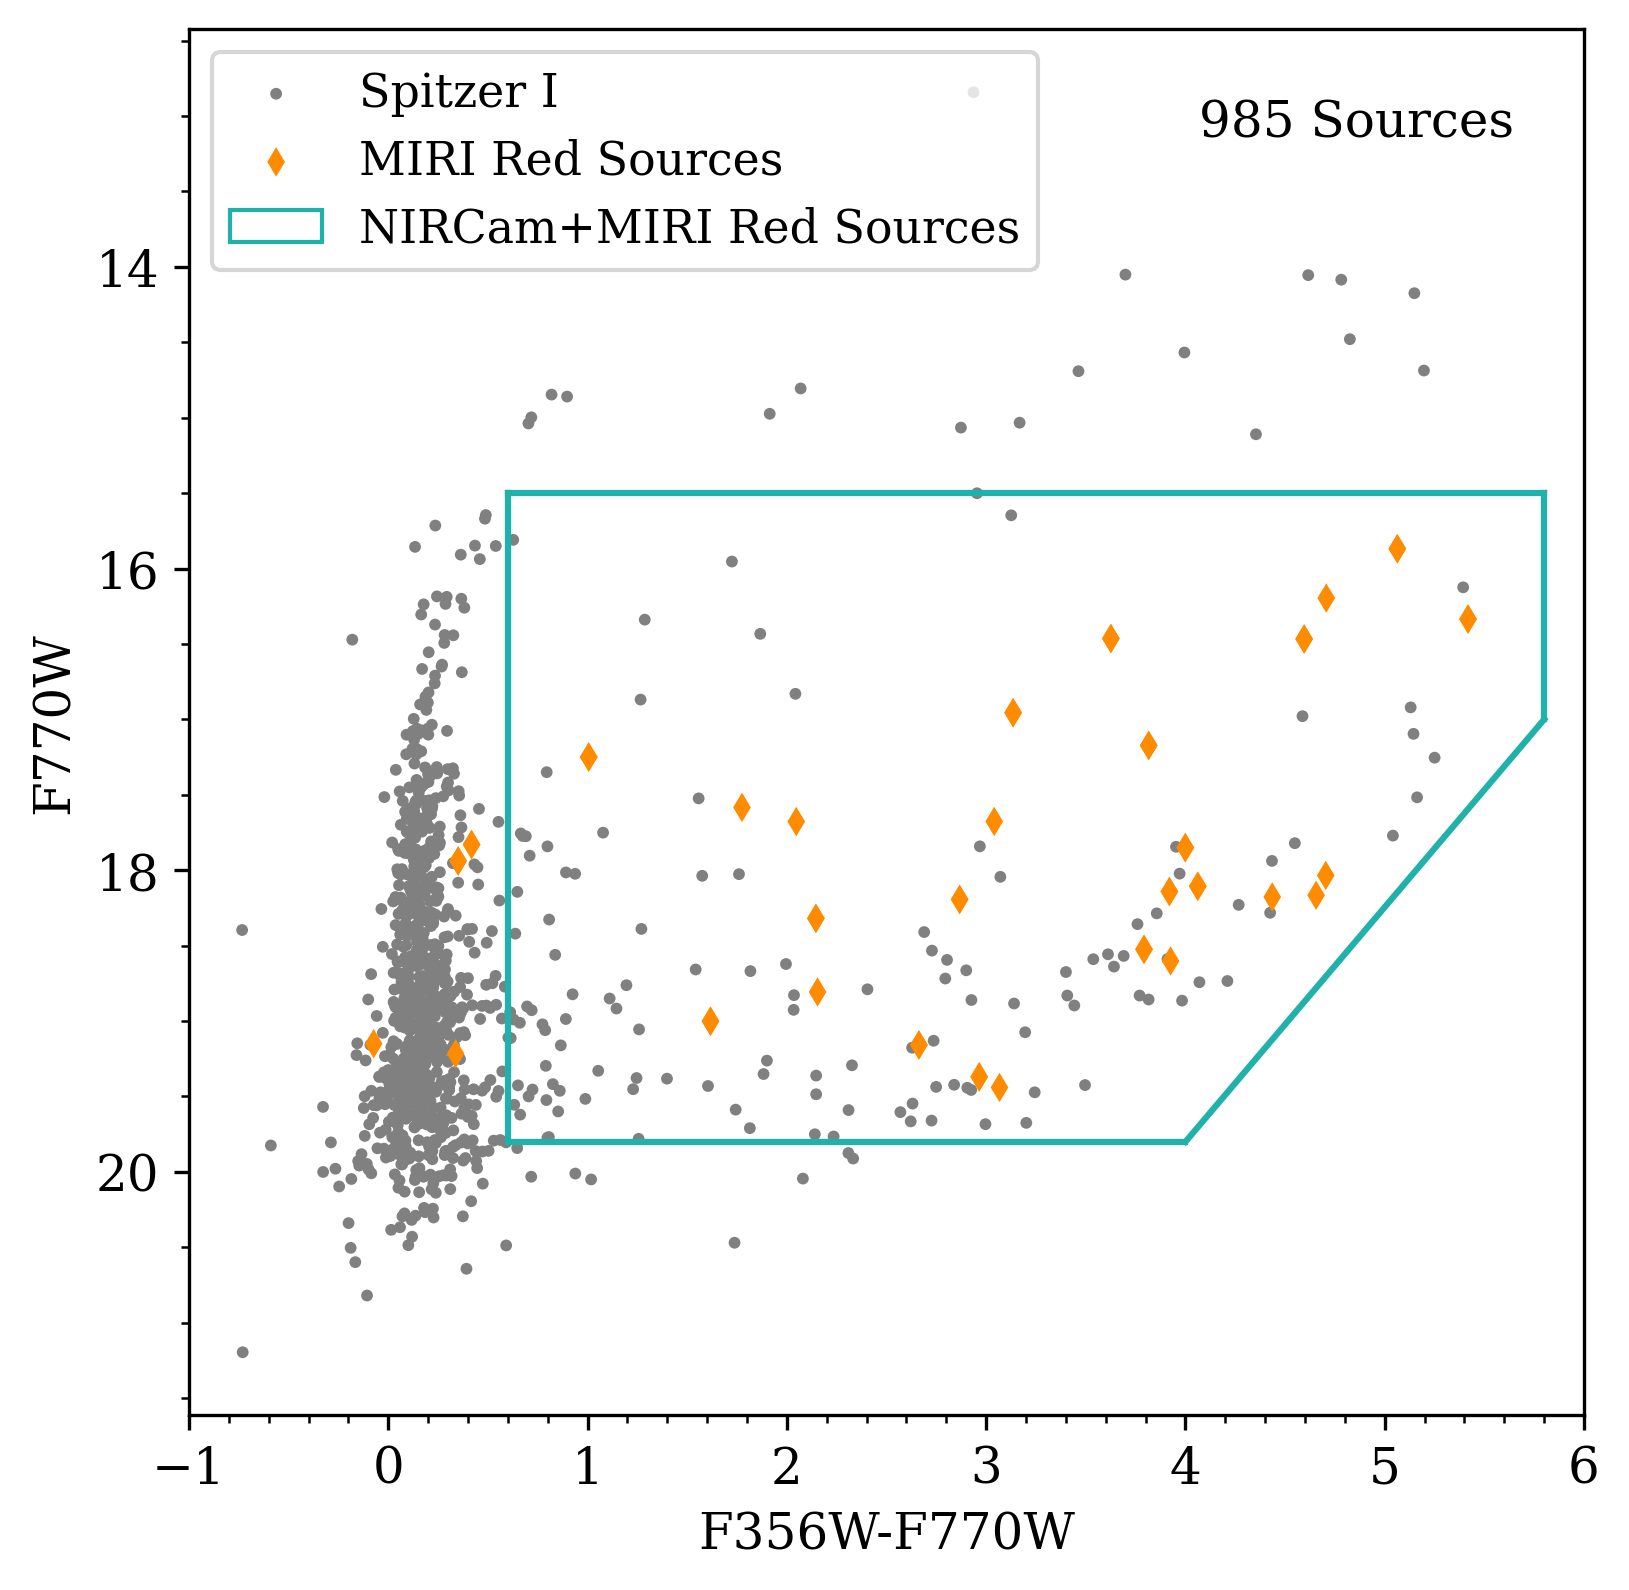
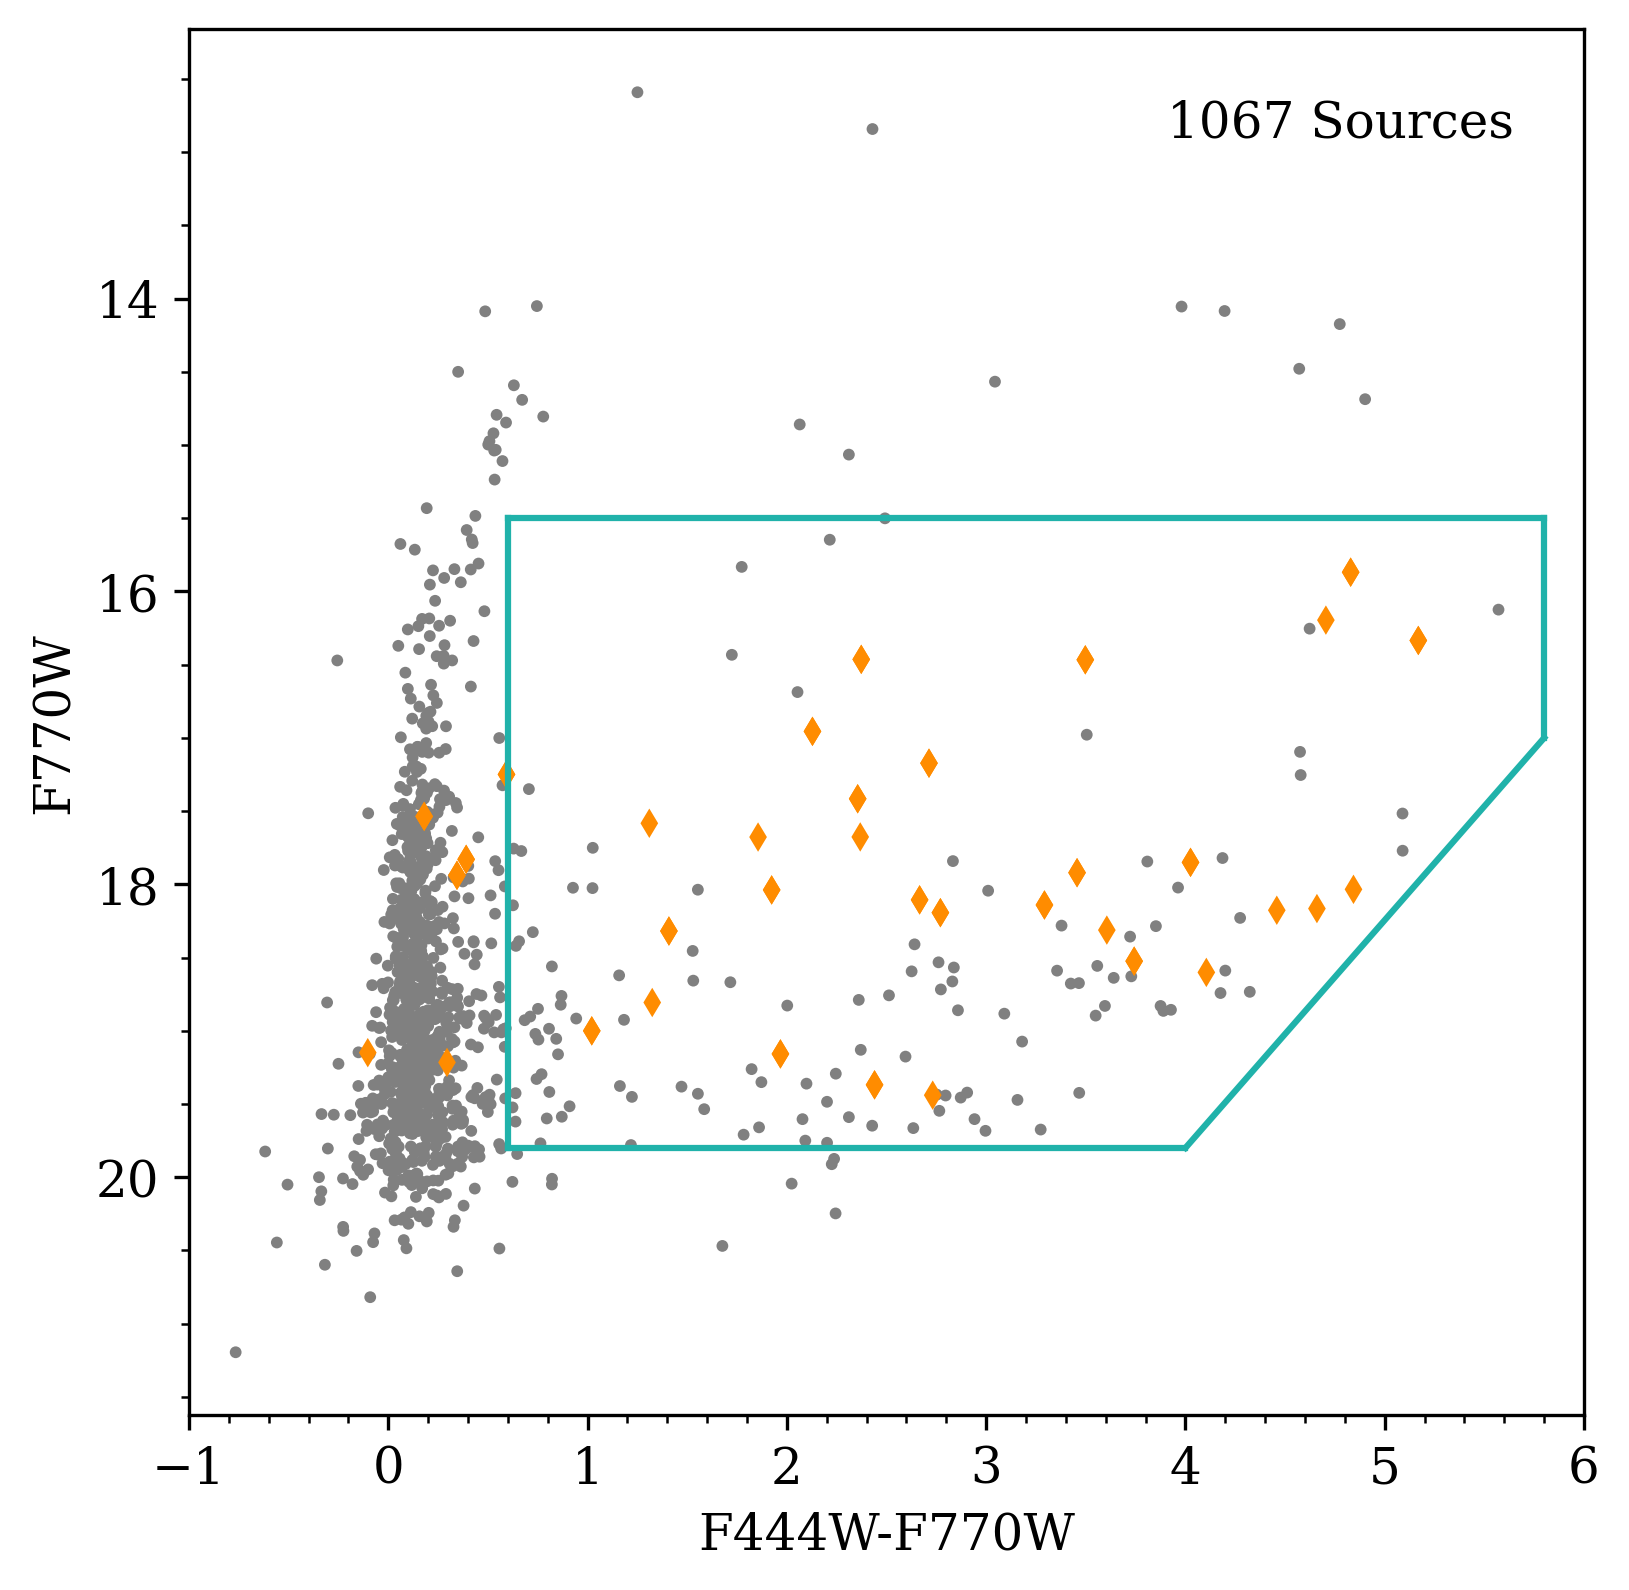
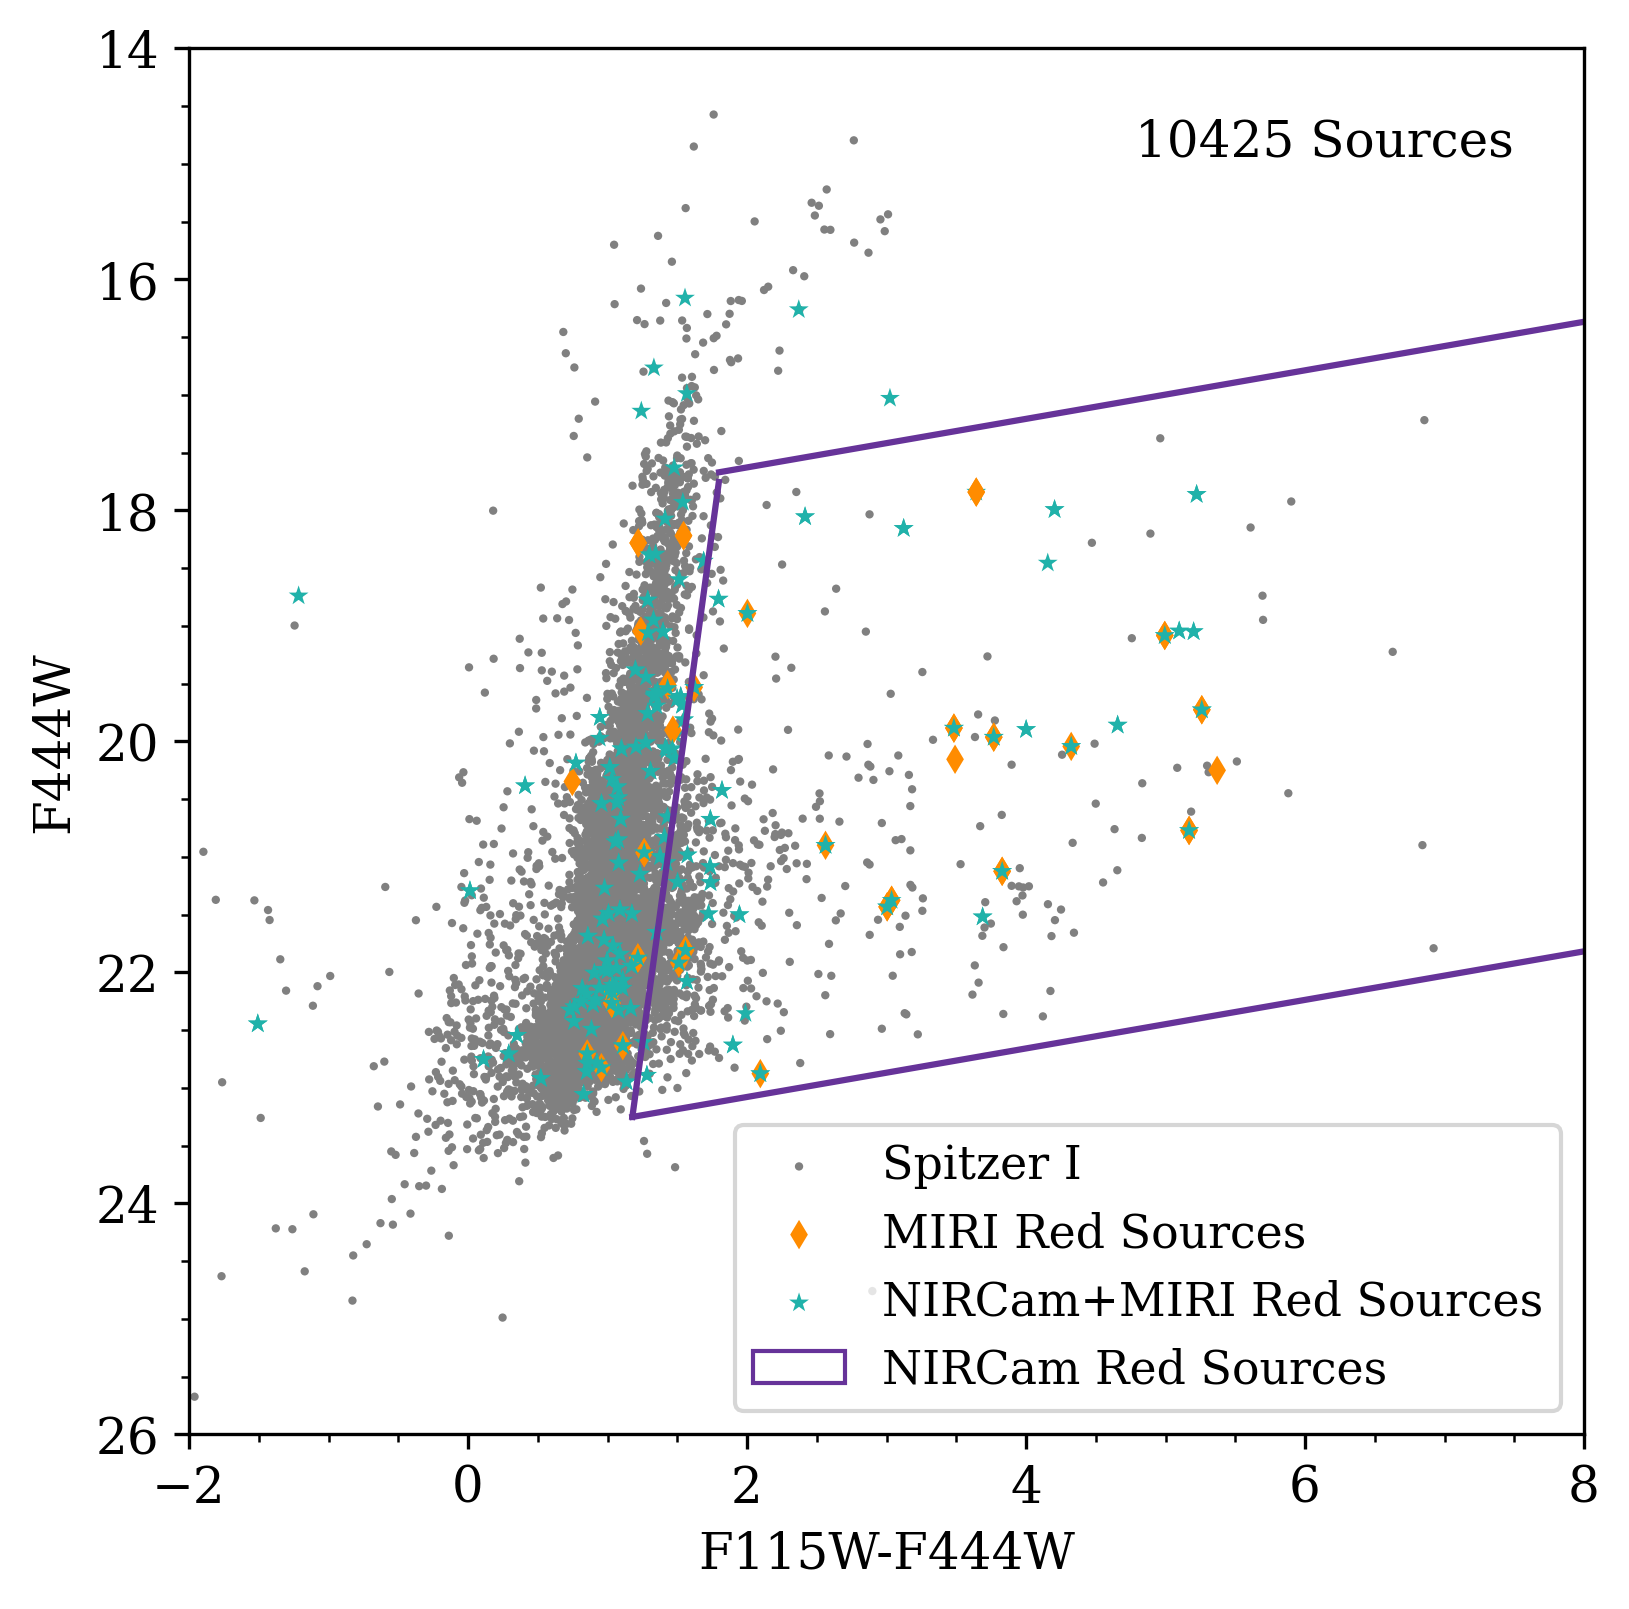
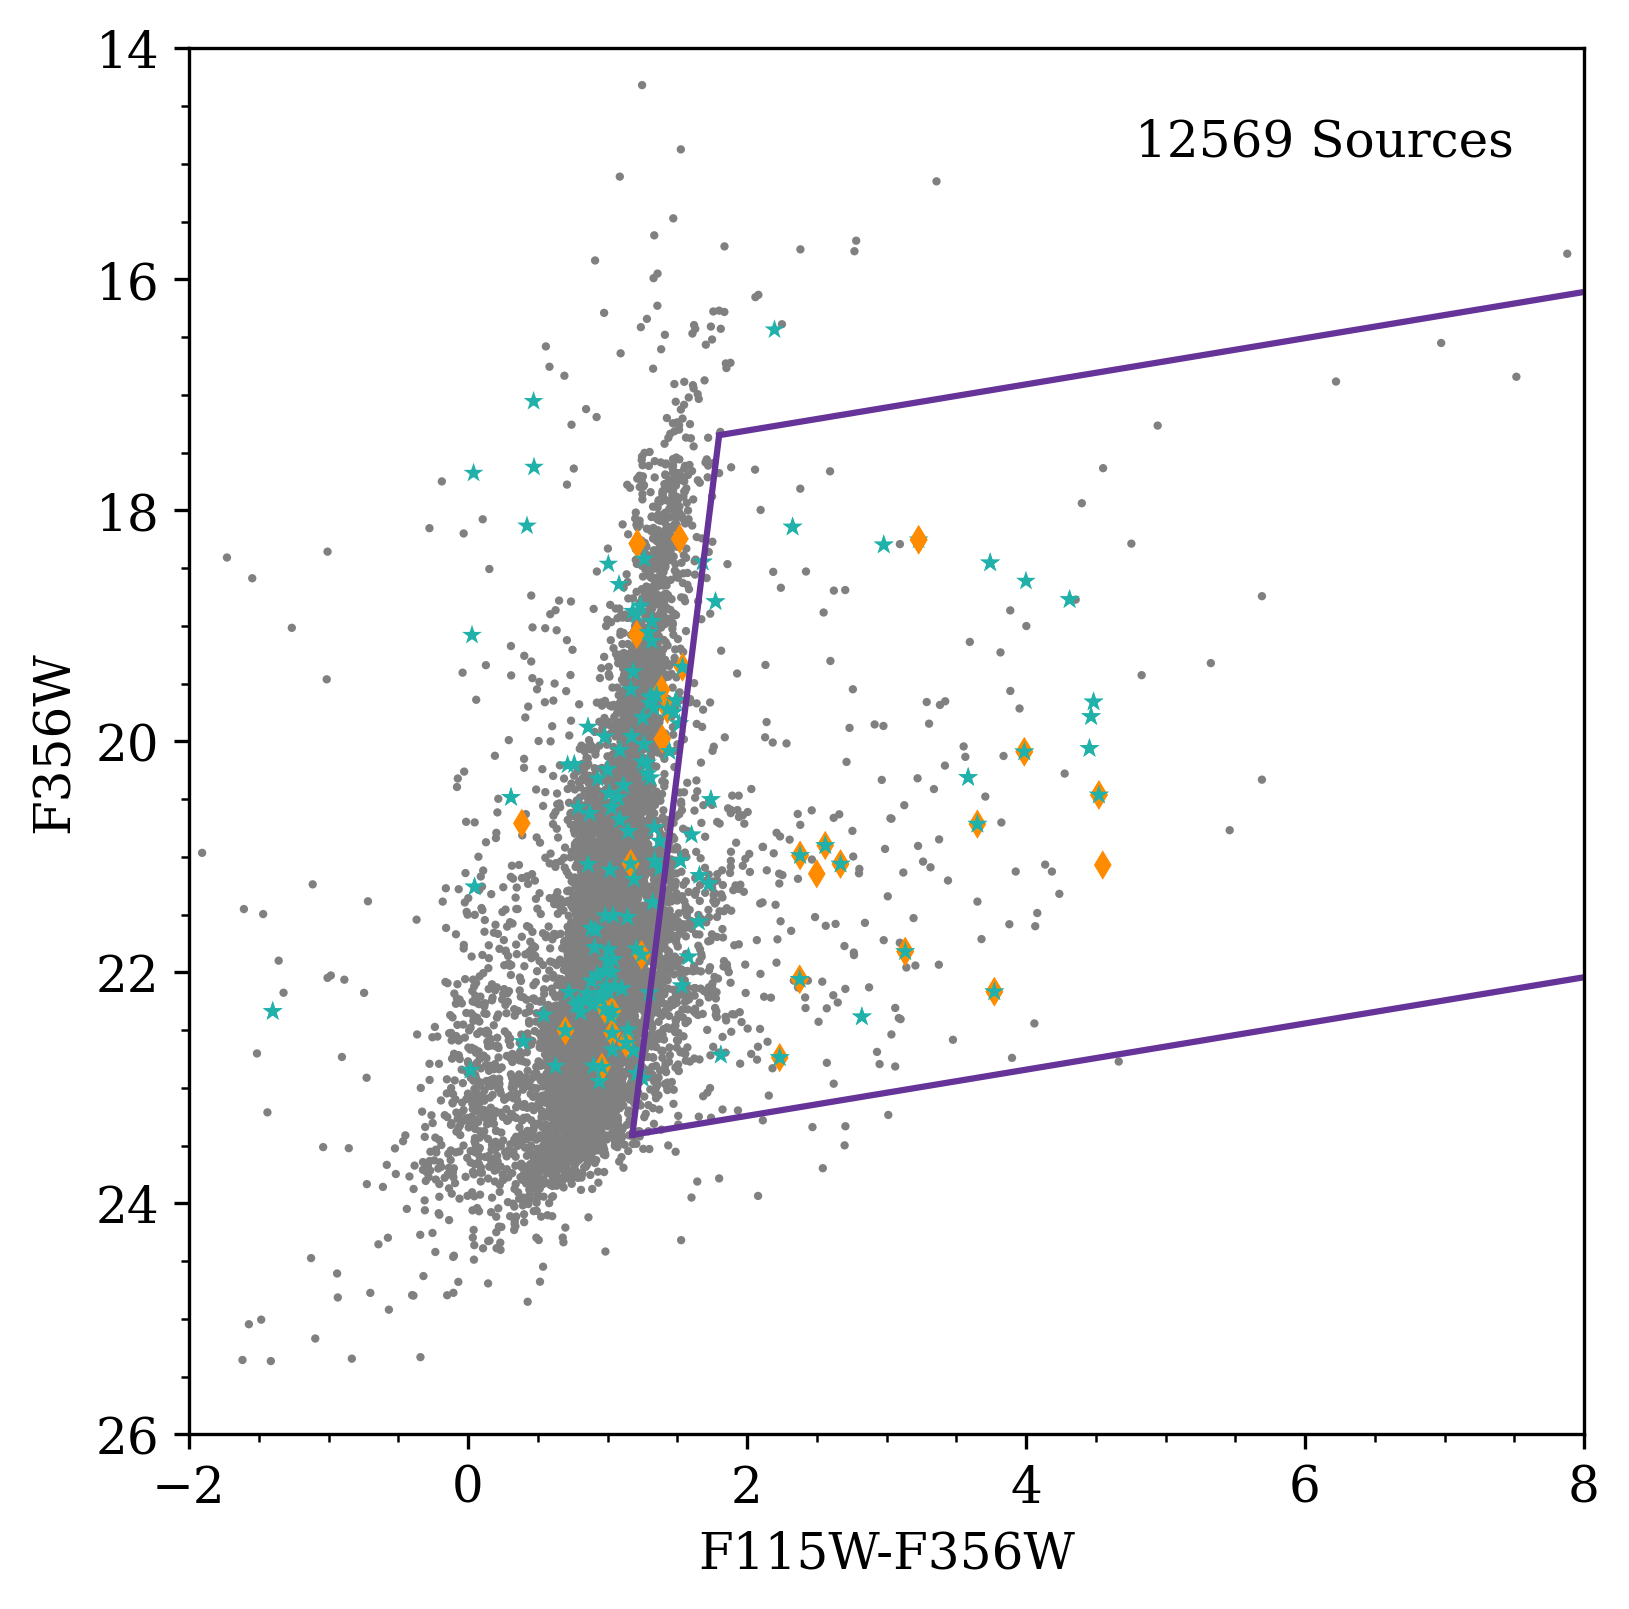
Past studies have relied on Spitzer IRAC and MIPS colors to select regions of color-magnitude space that are likely to be dominated by YSOs (see, e.g., Whitney et al., 2008; Sewiło et al., 2013; Jones et al., 2019, for the LMC, SMC, and NGC 6822 respectively). In order to identify YSOs in Spitzer I and characterize their SEDs across a range of evolutionary stages, we have constructed six CMDs from which we define provisional color cuts: We use F1500W versus F1000W-F1500W and F1500W versus F770WF1500W to identify the most embedded sources, F770W versus F444WF770W and F770W versus F356WF770W to identify sources that are emerging from their circumstellar envelopes, and F444W versus F115WF444W and F356W versus F115WF356W to identify the most evolved YSOs with optically-thin or no disks. We present these CMDs in Figure 2.
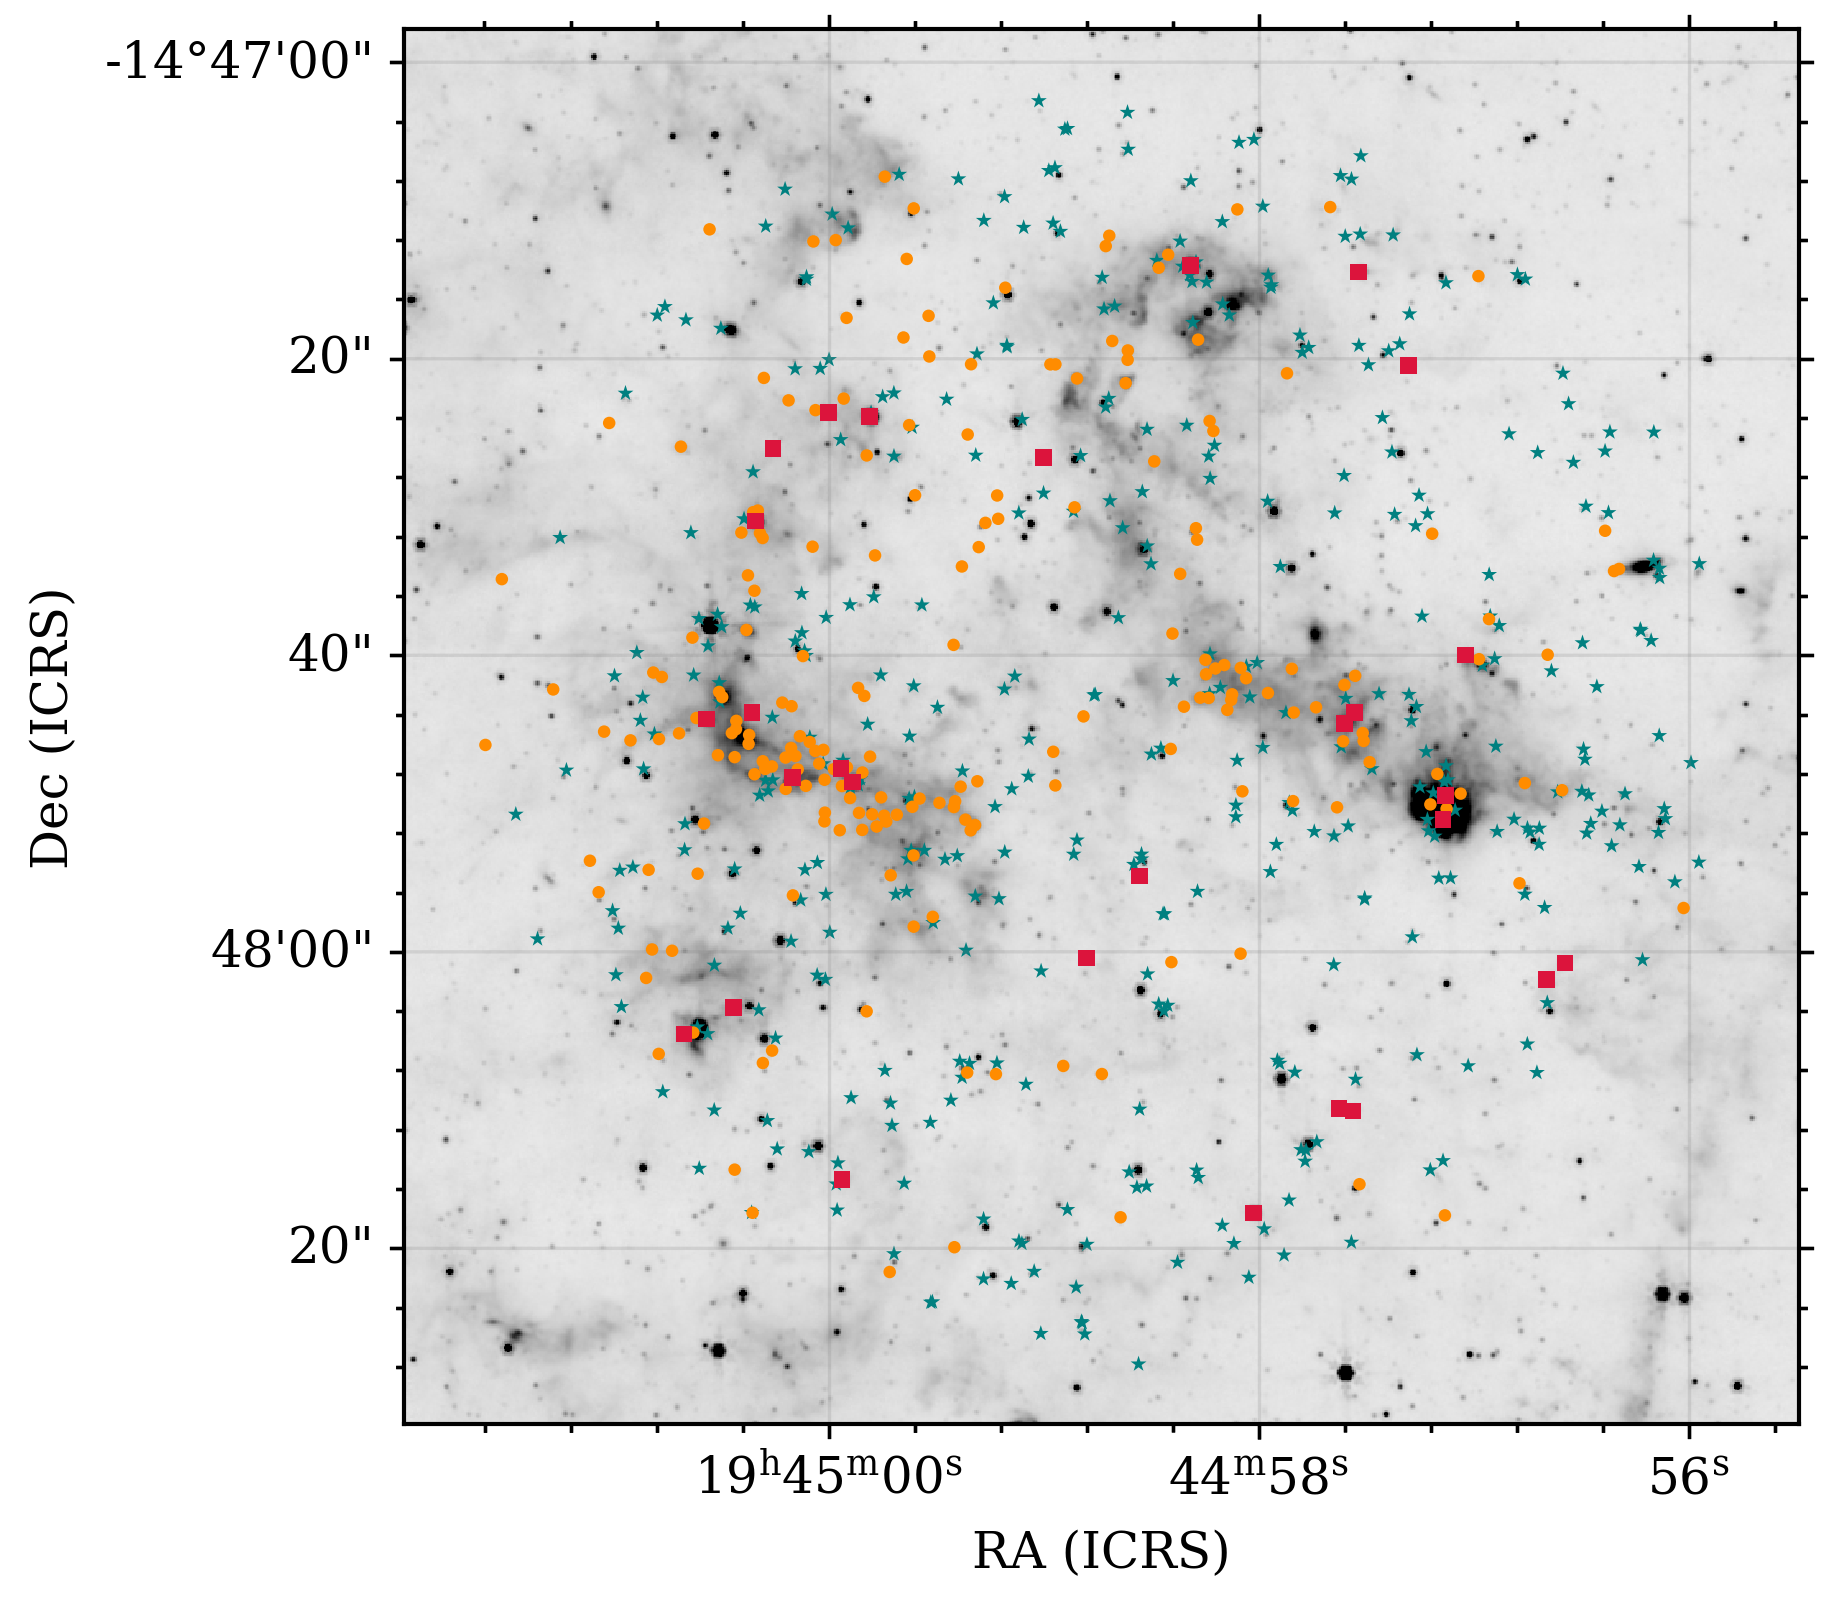
We define the Spitzer I star-forming region with a circular aperture of radius 46″ (109 pc) centered at RA 19:44:59.0160 and Dec 14:47:40.920 (this is the same definition of Spitzer I as in Jones et al., 2019). There are 71,195 sources in this region (Nally et al. in prep.) and after applying the color cuts we define in Table 1, 1,274 of these are classified as “red” sources. We show the spatial distribution of the subset of sources that are classified as YSOs or YSO candidates over the MIRI F770W image in Figure 3 (see Section 3.2.2). Here, the red squares represent objects that show an IR excess in four to six colors, orange circles are objects that show an IR excess in two to three colors, and teal stars are objects that possess an IR excess in only one color. We observe red sources distributed throughout the Spitzer I region; however, there are clear overdensities of sources associated with the two prominent filaments that characterize the morphology of Spitzer I at the longer MIRI wavelengths.
| Source | RA | Dec. | ||||
|---|---|---|---|---|---|---|
| (J2000) | (J2000) | [R⊙] | [K] | [L⊙] | [M⊙] | |
| 1 | 296.2357315 | -14.80020774 | 9.38 | 7219 | 216 | 4.64 |
| 4 | 296.2380947 | -14.79751884 | 33.01 | 8087 | 4208 | 10.85 |
| 5 | 296.2417682 | -14.80489326 | 73.23 | 3381 | 633 | 6.31 |
| 6 | 296.2450078 | -14.80011861 | 99.46 | 3108 | 833 | 6.83 |
| 7 | 296.2528028 | -14.80153774 | 49.17 | 2743 | 124 | 3.96 |
| 8 | 296.2518381 | -14.80104333 | 9.74 | 7056 | 212 | 4.62 |
| 9 | 296.2514835 | -14.79551891 | 7.55 | 7861 | 196 | 4.52 |
| 10 | 296.2376577 | -14.79443789 | 82.56 | 2126 | 126 | 3.98 |
| 12 | 296.2397253 | -14.78726164 | 21.76 | 6287 | 668 | 6.41 |
| 13 | 296.2398122 | -14.79551639 | 49.58 | 4562 | 961 | 7.12 |
| 14 | 296.2429828 | -14.78714408 | 20.46 | 13650 | 13120 | 15.02 |
| 15 | 296.2492044 | -14.78996949 | 47.36 | 5125 | 1397 | 7.92 |
| 16 | 296.2514153 | -14.79192801 | 78.23 | 4338 | 1957 | 8.72 |
| 17 | 296.2506962 | -14.79673471 | 31.68 | 3596 | 151 | 4.20 |
Note. — The 14 sources listed here correspond to the sources shown in Figure 5. The full table is available online.
3.2.2 YSO Spectral Energy Distribution Fitting
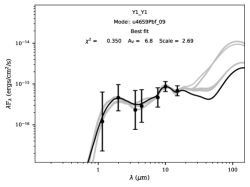
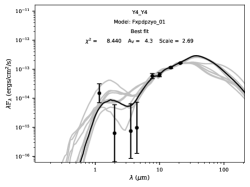
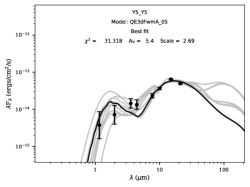
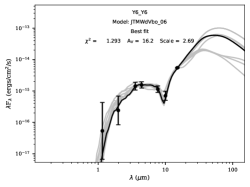
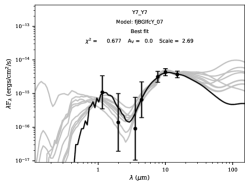
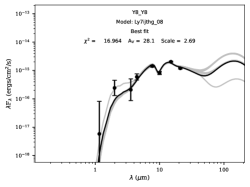
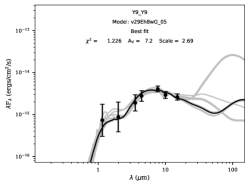
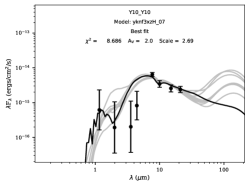
It is important to note that selecting red sources via CMD color cuts is prone to contamination from evolved stars and background galaxies. The MIRI filters in this case are crucial to mitigate the contamination from evolved stars (Jones et al., 2017). However, as the sensitivity limit at longer wavelengths decreases, the source counts at subsequently longer wavelength MIRI filters decreases as well. This limits the number of sources where we can use long baseline MIRI colors to minimize the contamination from evolved stars. To clean our red source catalog and identify the YSOs and YSO candidates, we produce and visually inspect the SEDs for each of the 1,274 red objects. In addition, we visually inspect zoom-in cutout regions centered on the RA and Dec coordinates of each source. In doing this, we identify extended sources that resemble background galaxies and remove them from our YSO candidate list. Similarly, we identify and remove sources whose SEDs show decreasing flux with increasing wavelength, consistent with evolved stars. Finally, we additionally fit every SED with the “spbhmi” YSO model SEDs222https://zenodo.org/record/166732 from Robitaille (2017) with the SED Fitter tool (Robitaille et al., 2007). To do this, we first acquire the JWST filter transmission curves and convolve the YSO model SEDs with the JWST filters. We define the NIRCam and MIRI filters using the Filter class in the SED fitter, and use the convolve_model_dir function to perform the convolution of the YSO model SEDs with the JWST filters. We note that the JWST transmission curves are provided as a function of increasing wavelength, while the Filter class requires frequency in ascending order, thus the wavelength and throughput arrays must be reversed.
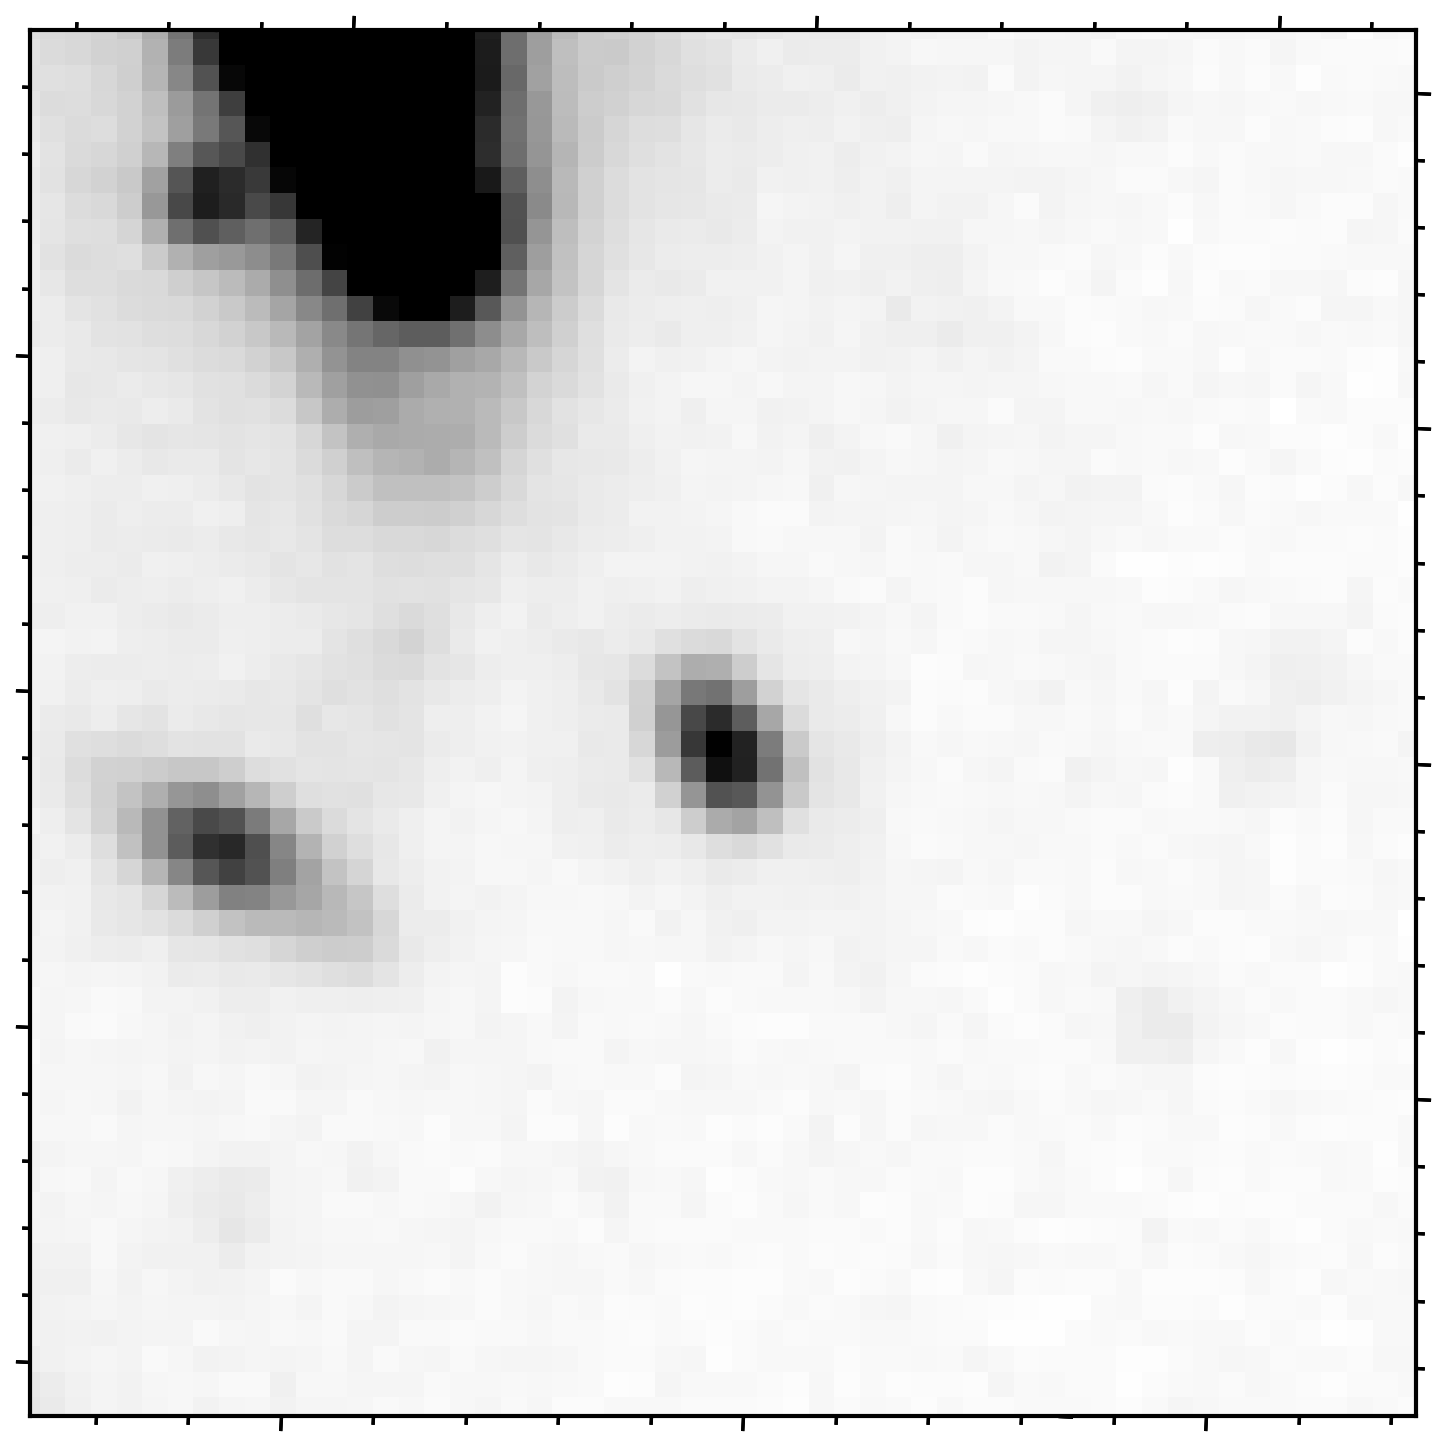
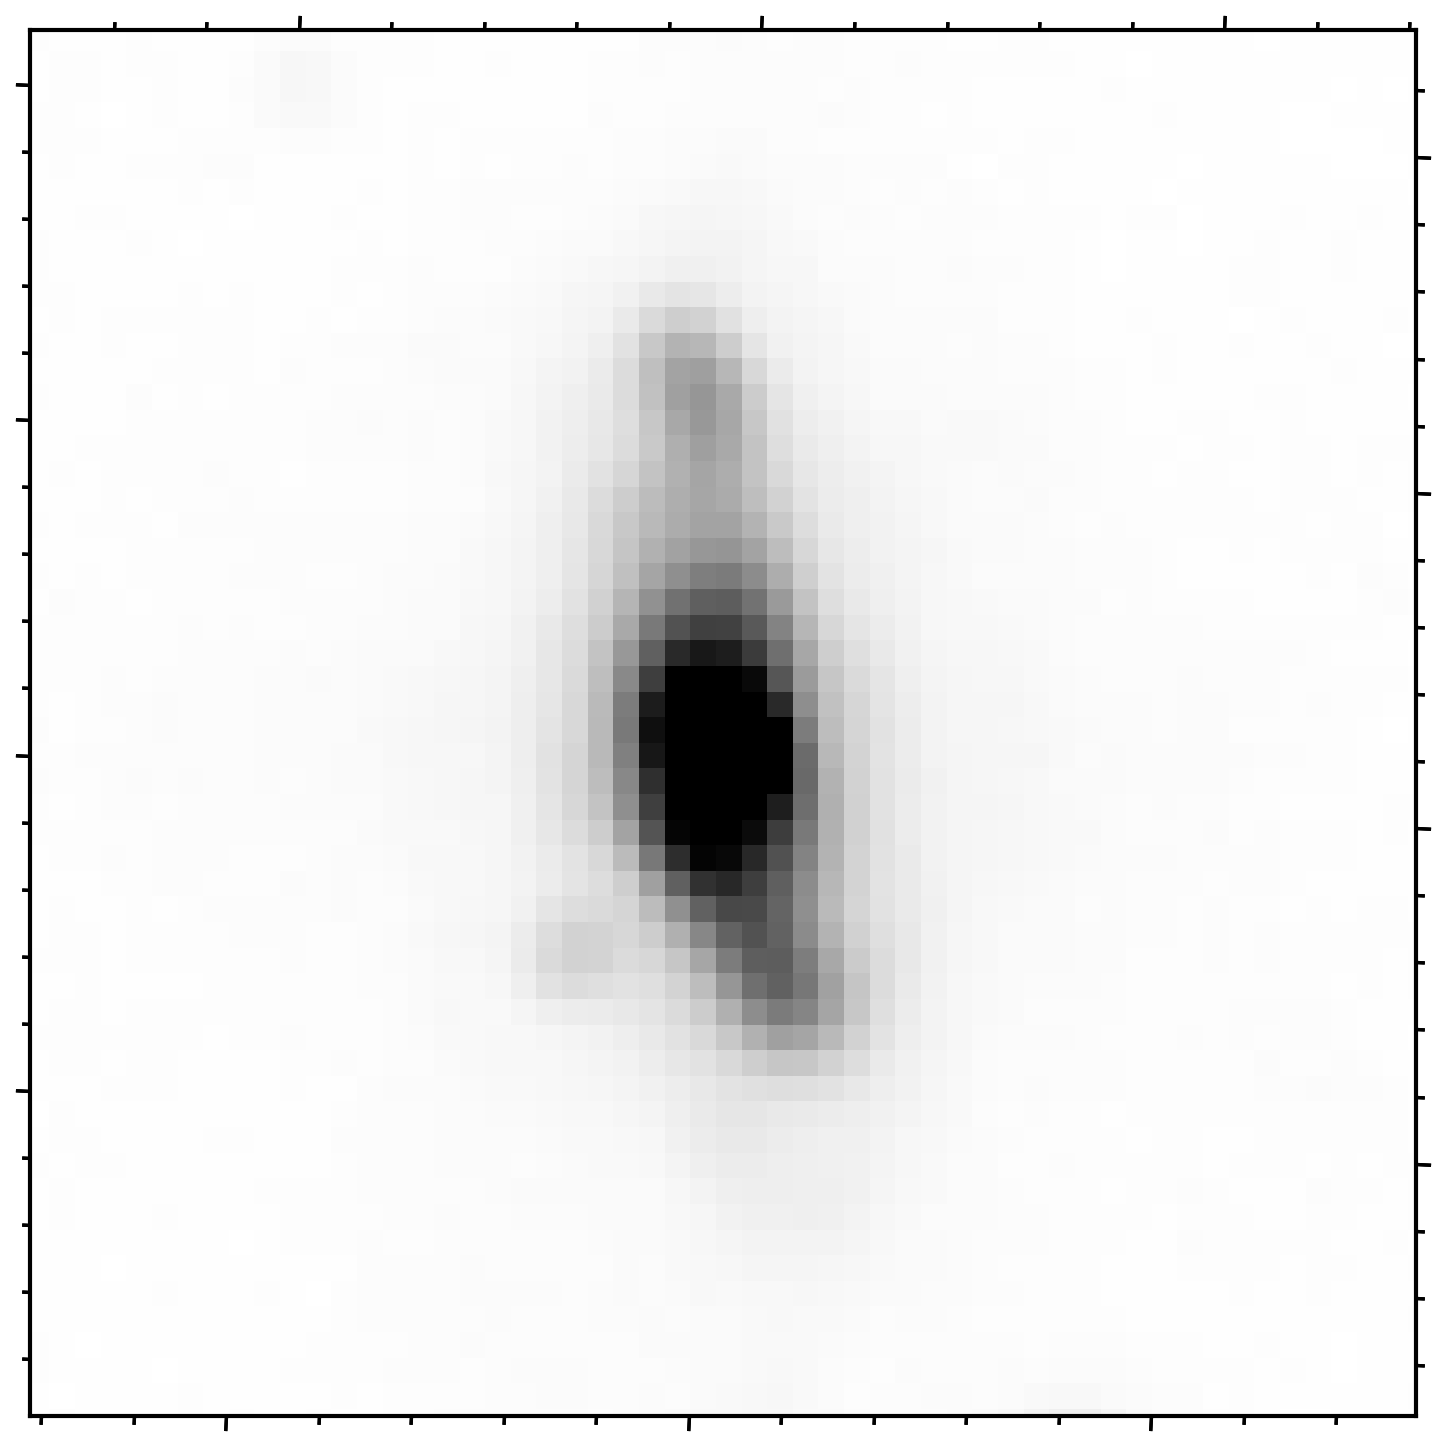
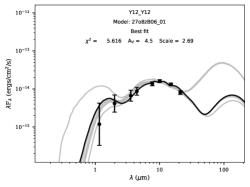
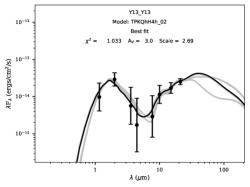
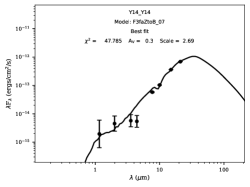
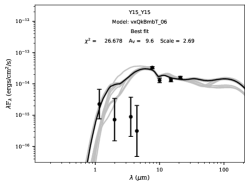
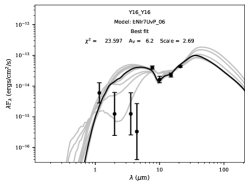
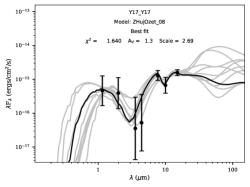
After fitting the Robitaille (2017) YSO model SEDs to all 1,274 objects in our red source catalog, we use the following criteria to separate YSOs and YSO candidates from contaminating evolved stars and background galaxies: (1) a source that appears point-like in all images and is well-fit (reduced ; as was done in Nayak et al., 2023) by a model YSO SED is classified as a YSO; (2) point-like sources with poorer SED fits (; similar to Jones et al., 2019) are classified as YSO candidates; (3) point-like sources with SEDs that drop off at longer wavelengths and are very poorly fit by the YSO model SEDs (reduced ) are classified as evolved stars; (4) extended sources are classified as background galaxies; and (5) all other sources that do not fit into the previous categories are left unclassified; these tend to be sources with too few photometric parameters for establishing a robust classification.
Of the 1,274 red sources we select from the CMDs, 17 objects satisfy all six color criteria that we describe in Table 1. These 17 sources have photometry in all NIRCam and MIRI filters in this program, except for seven which have no matched detections in the longest wavelength filter, F2100W. Visual inspection of the images of these 17 sources in all available filters reveals that three are background galaxies; we show these in Figure 4. The remaining 14 sources are well fit by YSO SEDs; we show these in Figure 5. There are six objects within our red source list that satisfy five out of the six color criteria we impose in Table 1; one is identified as a background galaxy, two are identified as evolved stars, and three are identified as YSOs. There are 29 sources that pass four of our six color criteria: We identify 14 as evolved stars, seven as YSOs, four as YSO candidates, and the remaining four sources are unclassified. There are 12 sources that pass three of our color cuts; one is classified as a background galaxy, one is classified as an evolved star, three are classified as YSOs, and seven are classified as YSO candidates. There are 496 sources that pass two color cuts; 293 are classified as evolved stars, 34 are classified as YSOs, 161 are classified as YSO candidates, and the remaining sources are unclassified. Finally, there are 714 sources that pass one color cut; 327 of these are classified as evolved stars, 68 are classified as YSOs, 312 are classified as YSO candidates, and the remaining sources are unclassified. We list the properties of 14 YSOs that satisfy all six color criteria in Table 2, while a machine-readable version of the entire catalog will be available online.
4 Discussion
4.1 Comparison of Spitzer-Identified YSOs to JWST
Recently, Jones et al. (2019) studied the population of massive YSOs in NGC 6822 using archival IRAC and MIPS observations from the Spitzer Space Telescope. With CMD cuts and SED fitting, they identified 105 high-confidence and 88 medium-confidence YSOs associated with seven high-mass star-forming regions. These include Hubble I/III, IV, V, and X, but also the discovery of three new embedded high-mass star-forming regions: Spitzer I, II, and III. Of all star-forming regions in NGC 6822, Spitzer I hosts the greatest number of YSOs (90; see Table 9 in Jones et al., 2019). It is bright at IR wavelengths of 8 and 24 µm, but faint in H and UV emission, suggesting that Spitzer I may be the youngest and most actively star-forming region in NGC 6822. Furthermore, the high IR flux which traces embedded star formation, compared to H or UV which trace star formation over the lifetimes of O- and B-type stars, suggests that its star-formation activity may not have yet reached its peak (as is seen in the proto-SSC H72.97–69.39; Ochsendorf et al., 2017).
A subsequent study by Hirschauer et al. (2020), which investigates new methods for establishing color cuts through implementation of kernel density estimate techniques, employed the same archival Spitzer IRAC and MIPS data to confirm the large presence of YSOs in Spitzer I. Furthermore, they postulated that this region may be a proto-SSC ( M⊙). SSCs represent an extreme mode of star formation where the stellar surface densities exceed those of HII regions and OB associations (Nayak et al., 2019) by orders of magnitude and the star formation efficiencies are high (see, e.g., Turner et al., 2015; Oey et al., 2017). Within extragalactic members of the Local Group, the R136 cluster in the LMC’s 30 Doradus region is the best-studied SSC (see, e.g., Chevance et al., 2020; Wong et al., 2022). SSCs are also observed in the central starburst of NGC 253 (Leroy et al., 2018; Levy et al., 2021), M82 (Smith et al., 2006), and NGC 4945 (Emig et al., 2020). Recent work has also revealed a proto-SSC (H72.97-69.39) in the largest of the three molecular clouds in the N79 region of the LMC (Ochsendorf et al., 2017; Nayak et al., 2019).
Using a supervised machine learning approach, Kinson et al. (2021) trained a probabilistic random forest classifier to re-investigate the YSO population within the star-forming bar of NGC 6822. Applying this method to the archival Spitzer IRAC and MIPS data, the authors identified 199 new YSOs, and confirmed the YSO nature of 125 out of the 277 literature YSO candidates from Jones et al. (2019) and Hirschauer et al. (2020). They also definitively classified 82 of the 277 literature candidates as non-YSOs. Thus, their final catalog consists of 324 sources across the seven Hubble and Spitzer regions (Hubble I/III, IV, V, and X, and Spitzer I, II, and III), and four new sites of star formation that they identified through their work (BHD 9/10, 18, 27, and HIV-N). Of these 324 sources, Kinson et al. (2021) identified 90 YSOs and 49 YSO candidates within Spitzer I (see their Table 4).
As Jones et al. (2019) discuss (see their Section 2.3), the limited resolution of Spitzer can confuse color selections, and sources that are identified as YSO candidates from these data likely correspond to multiple objects rather than individual ones. To illustrate, the FWHM of Spitzer at 3.6 and 24 µm is 1.7″ and 6″ respectively; these correspond to 4 and 14.2 pc at the distance of NGC 6822 (490 kpc). With the resolution of JWST, we are now able to revisit previously-identified YSOs and YSO candidates and investigate to what extent these limitations affected earlier studies.
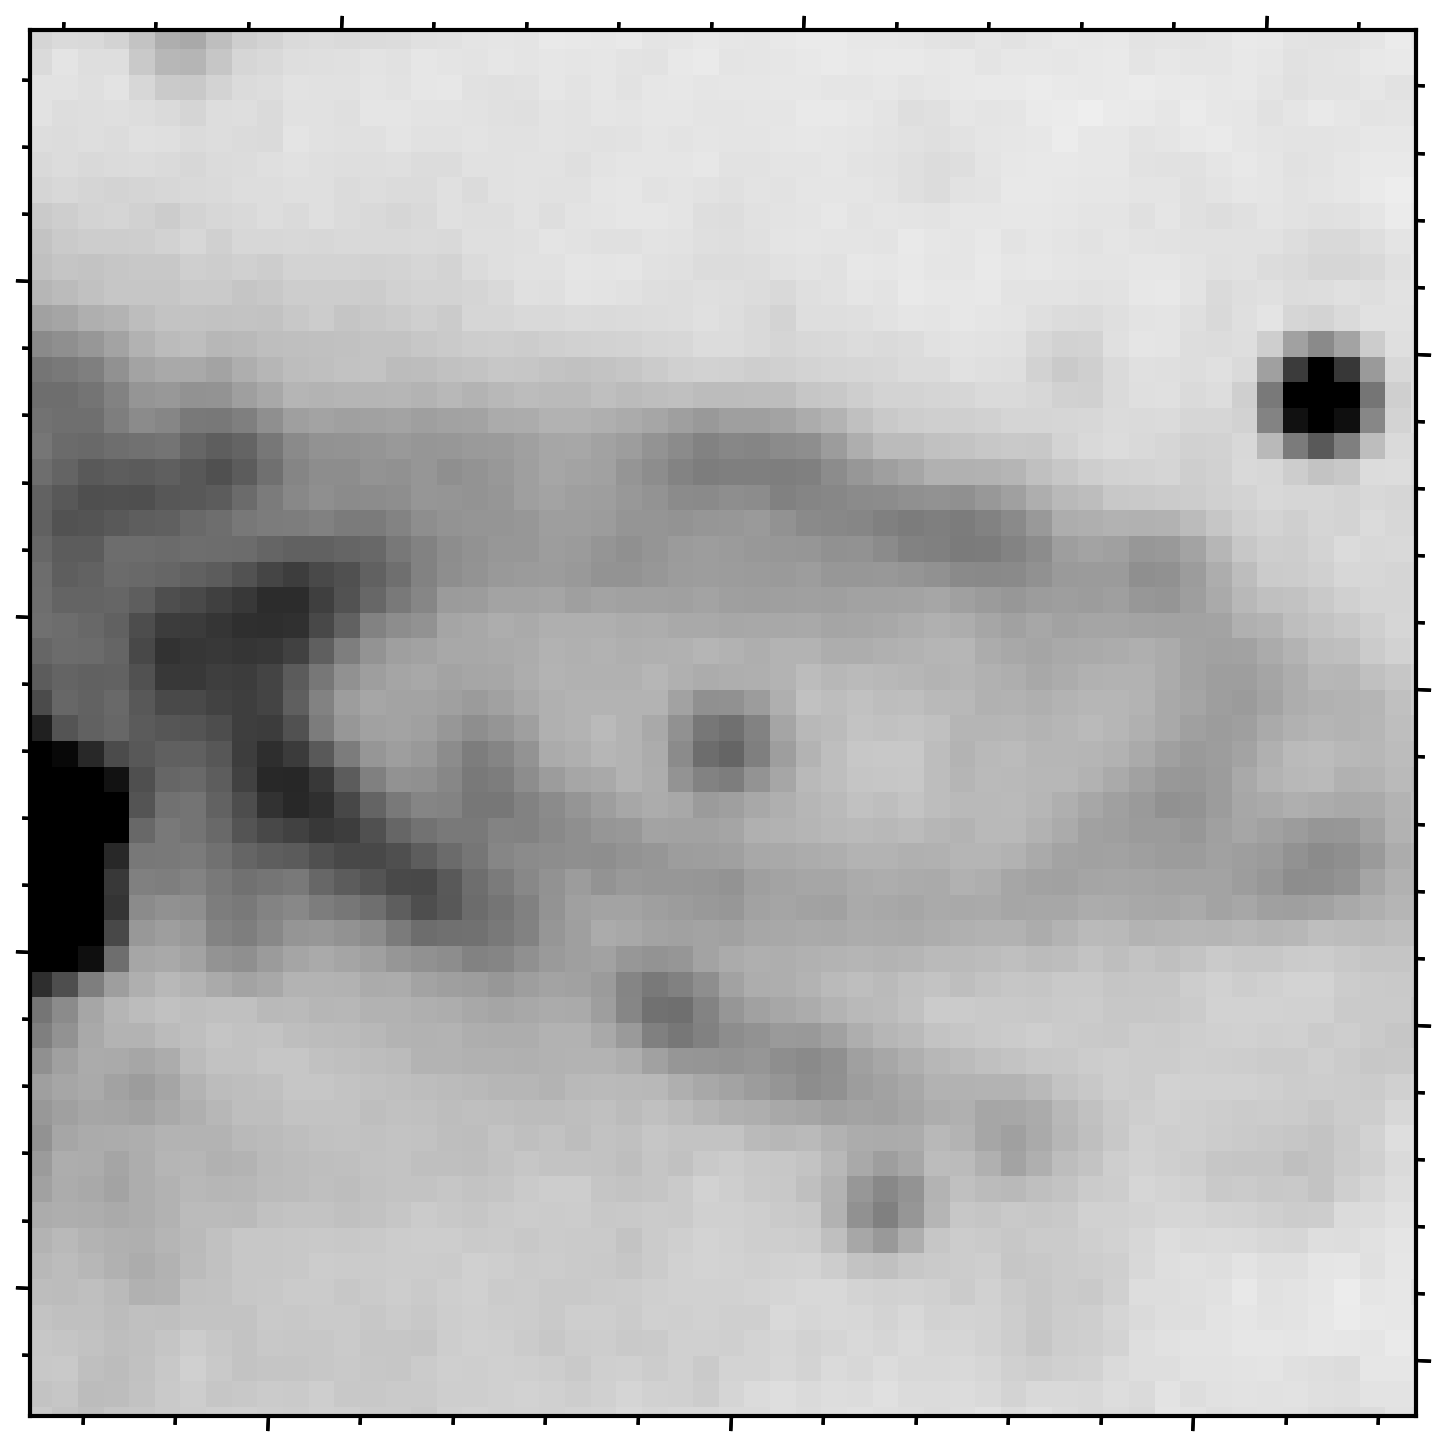
We first compare our catalog of red sources to the work of Kinson et al. (2021)333The catalog associated with this work is available at Kinson et al. (2022). We match every Spitzer I YSO and YSO candidate from Kinson et al. (2021) to all objects in our red source catalog using a 1″ matching radius. We find that 66 YSOs and YSO candidates from Kinson et al. (2021) have at least one match in our JWST red source catalog. One of these 66 sources corresponds to the background galaxy we show in the rightmost panel of Figure 4. This source was used in the YSO training set in Kinson et al. (2021), was identified as a YSO in Jones et al. (2019), passed all six of our JWST color cuts, and was considered a high-reliability YSO. This illustrates the need for high-resolution imaging to remove background galaxy contaminants. We find that 45 of the 66 sources matched to our red source catalog are classified as YSOs or YSO candidates, 18 are matched to sources that appear to be evolved stars, while the final two matched sources are unclassifiable due to too few photometric detections. We also find that several of the sources classified as YSOs or YSO candidates in Kinson et al. (2021) correspond to multiple JWST sources within the 1″ matching radius. We show an example of this in Figure 6: The cyan diamond corresponds to the RA and Dec. coordinates of the source from the Kinson et al. (2021) catalog, the teal stars correspond to sources we classify as evolved stars, and the orange circles are sources that we classify as YSOs. These seven objects from our red source catalog lie within 1″ of the Kinson et al. (2021) source and would have all been blended in the Spitzer IRAC and MIPS photometry.
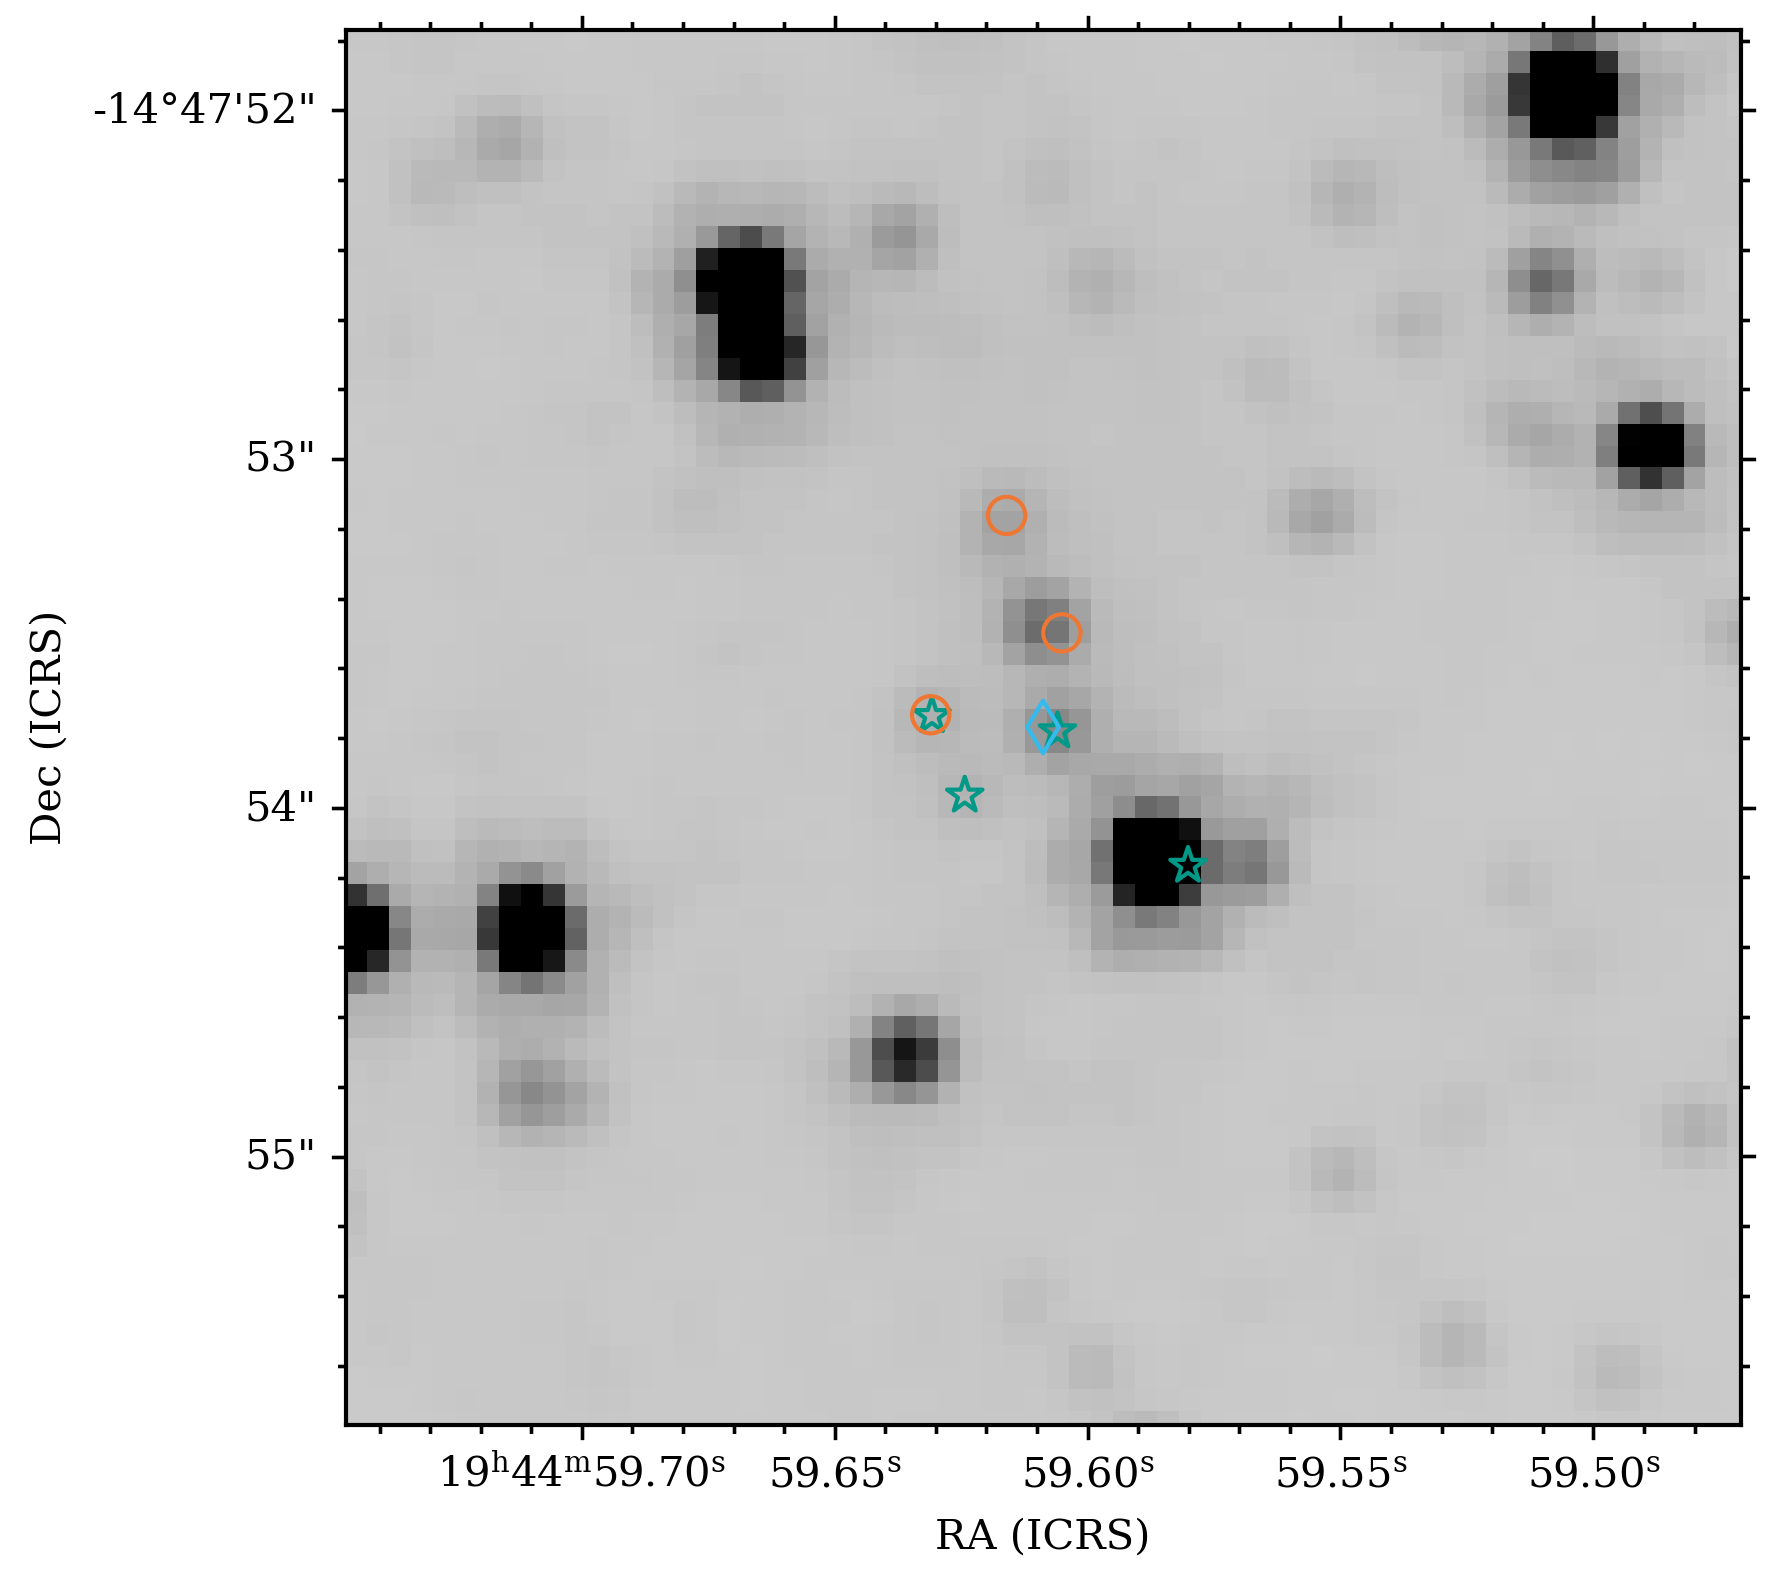
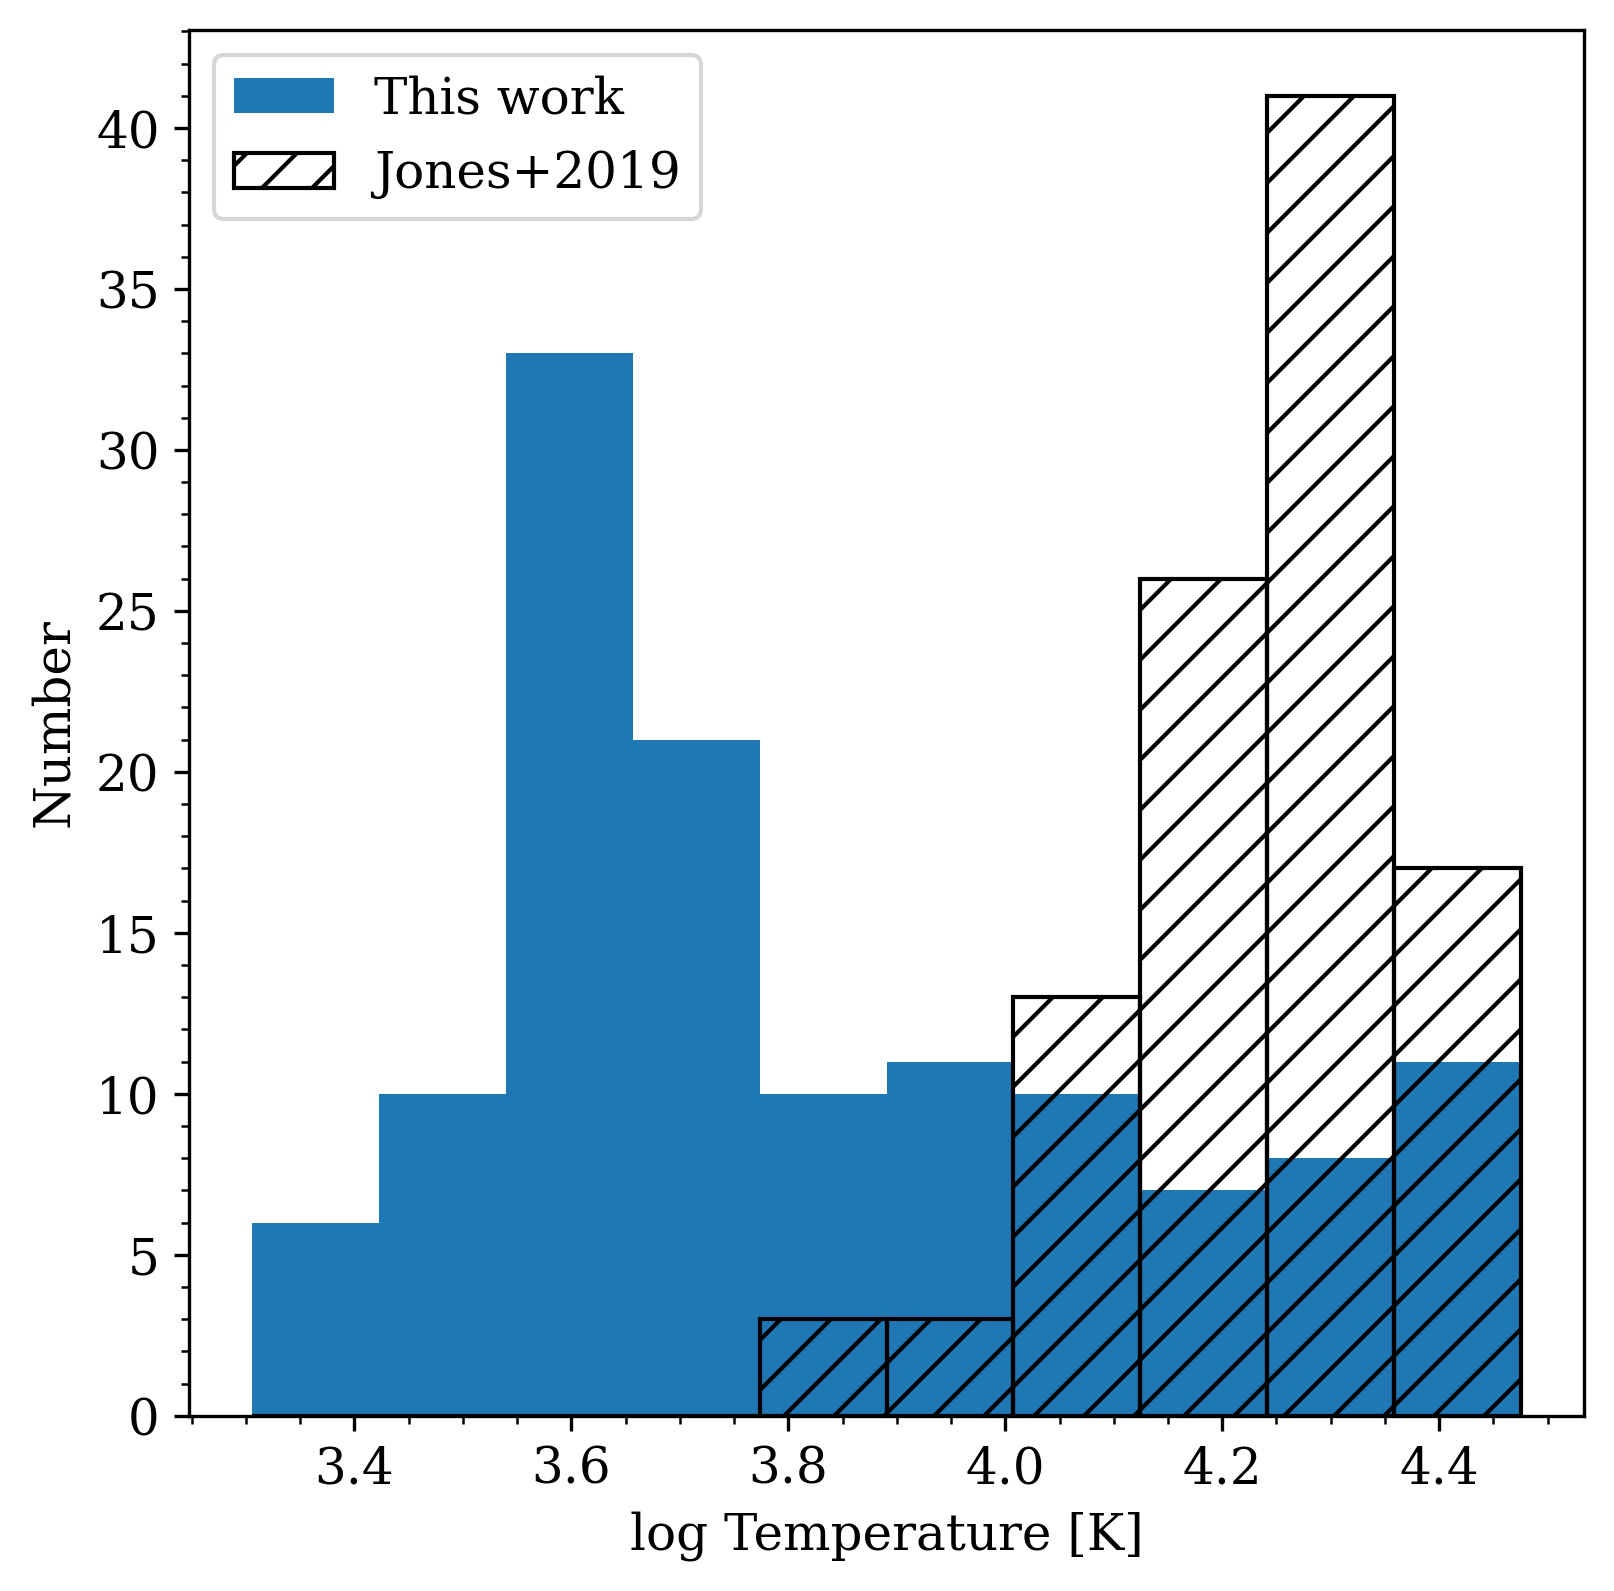
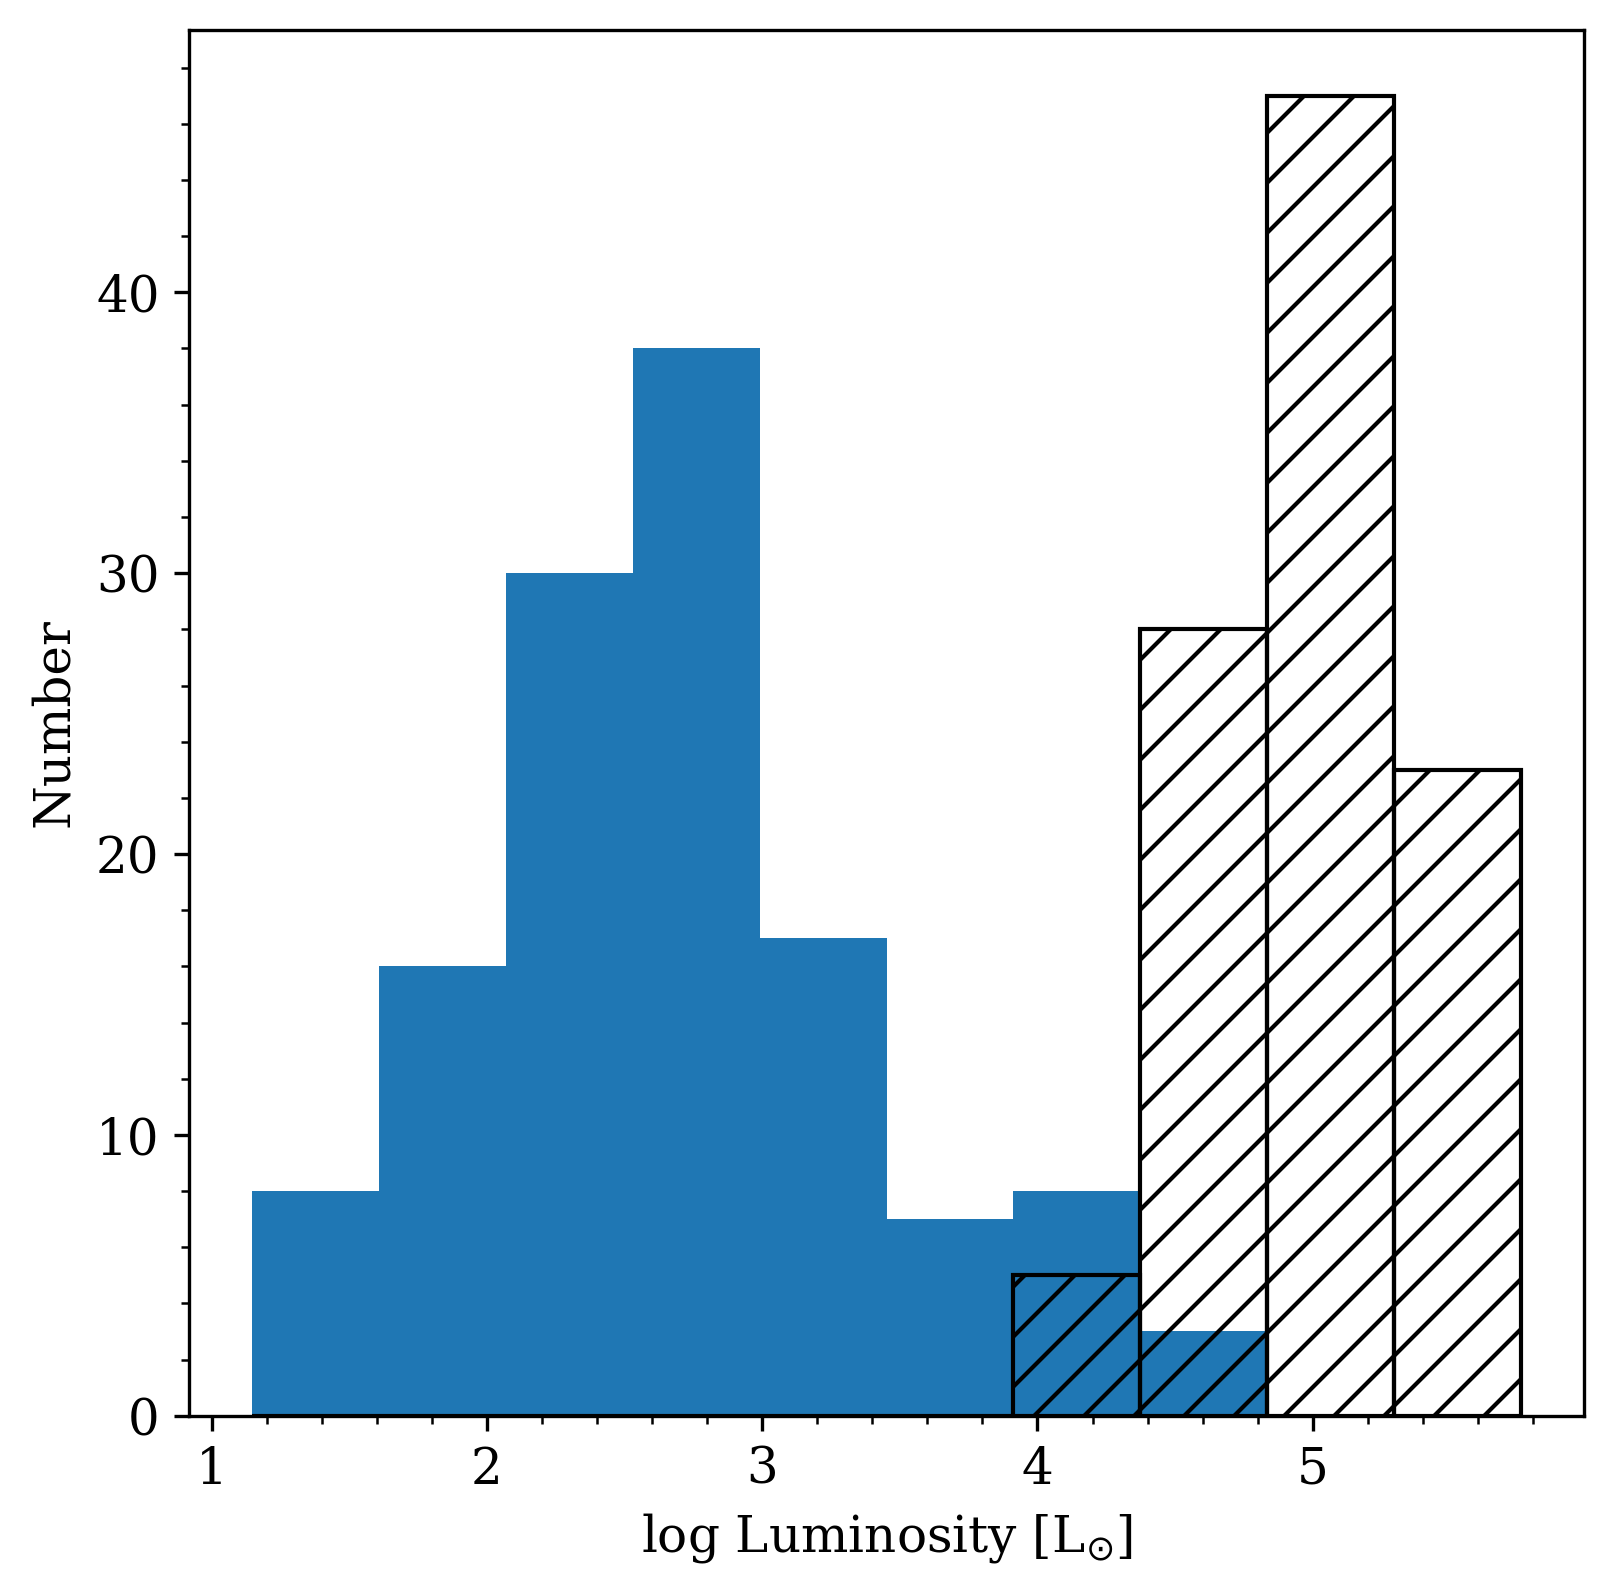
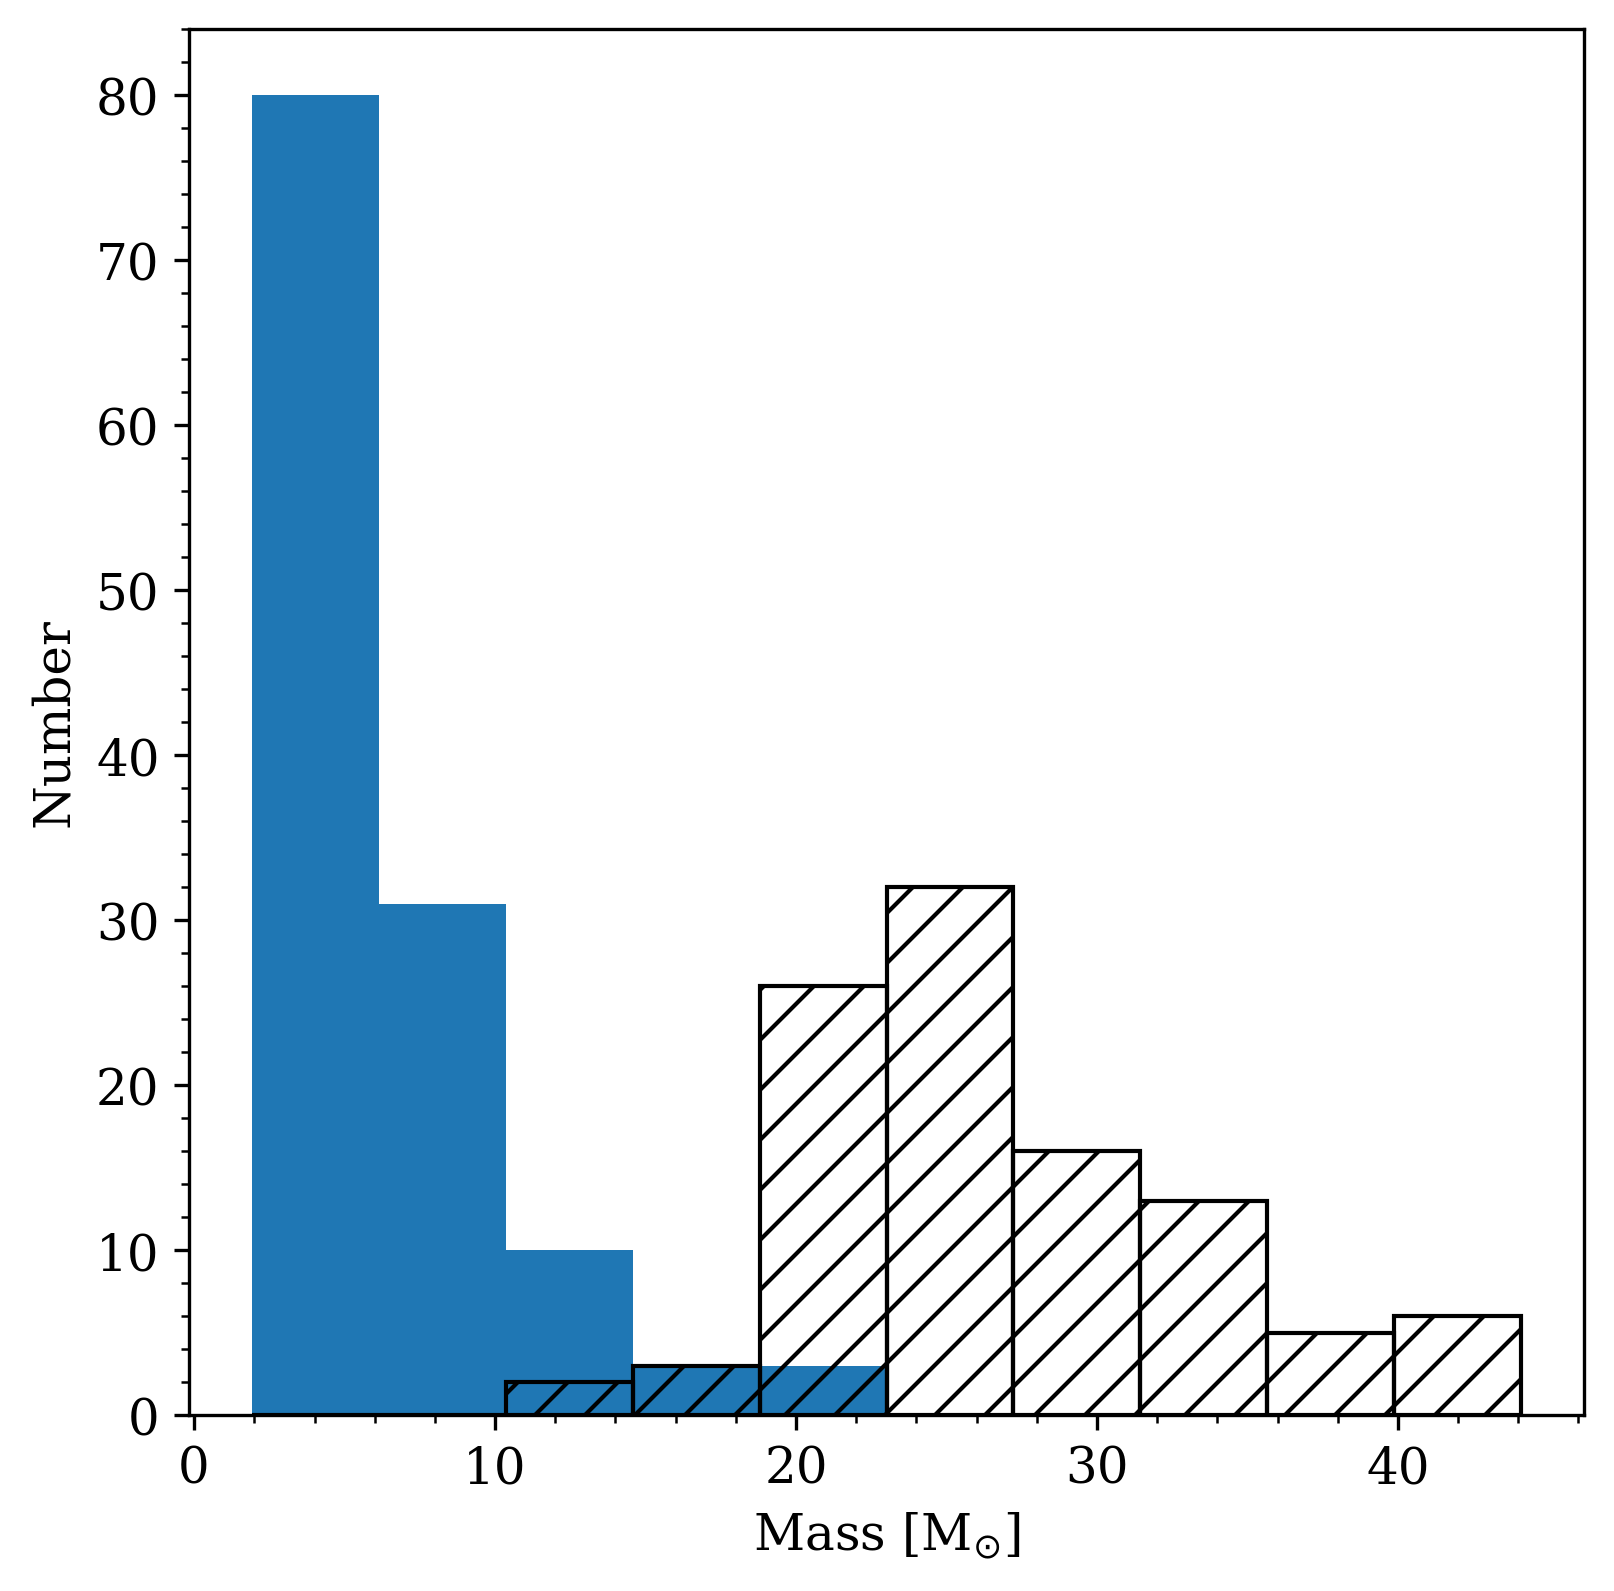
Figure 7 shows how this blending of sources in Spitzer observations affects the YSO properties that are subsequently extracted from SED fitting. The blue histograms in Figure 7 show the temperature, luminosity, and mass distribution of YSOs identified in this work, as determined from the best-fit Robitaille (2017) YSO SED models. The black histograms in Figure 7 show the temperature, luminosity, and mass distribution of sources within Spitzer I from Jones et al. (2019) determined in the same way. The YSOs in this work have a median temperature of K, median luminosity of , and a median mass of M⊙ (where the upper and lower uncertainties correspond to the 84.1 and 15.9 percentiles determined from cumulative distribution functions). The YSO candidates in Jones et al. (2019) have a median temperature that is 3.4 times greater ( K), median luminosity that is 200 times greater (), and a median mass that is 4.5 times greater ( M⊙) than what is presented in this work. The Spitzer data are limited by flux enhancements due to source confusion, because star-forming regions are crowded as is evident in NGC 6822 from the NIRCam three-color image in Figure 1. Our results suggest that crowding and source blending are potentially a significant limitation of previous studies.
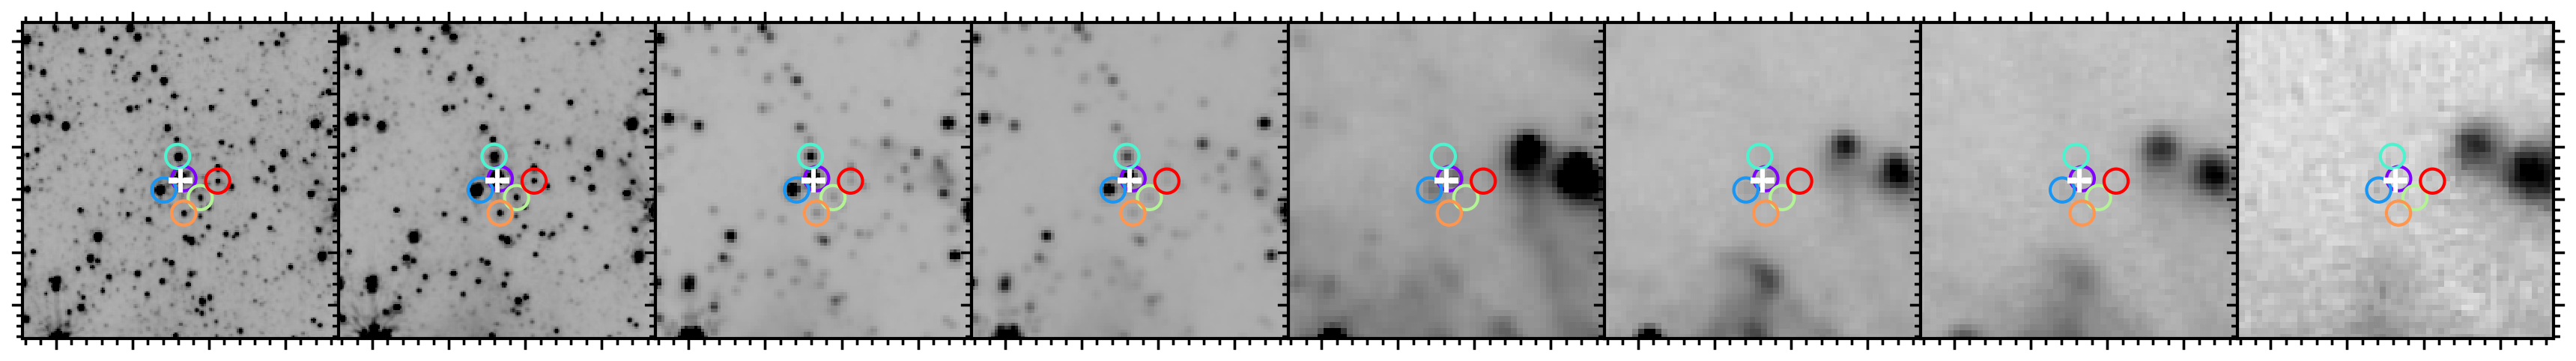
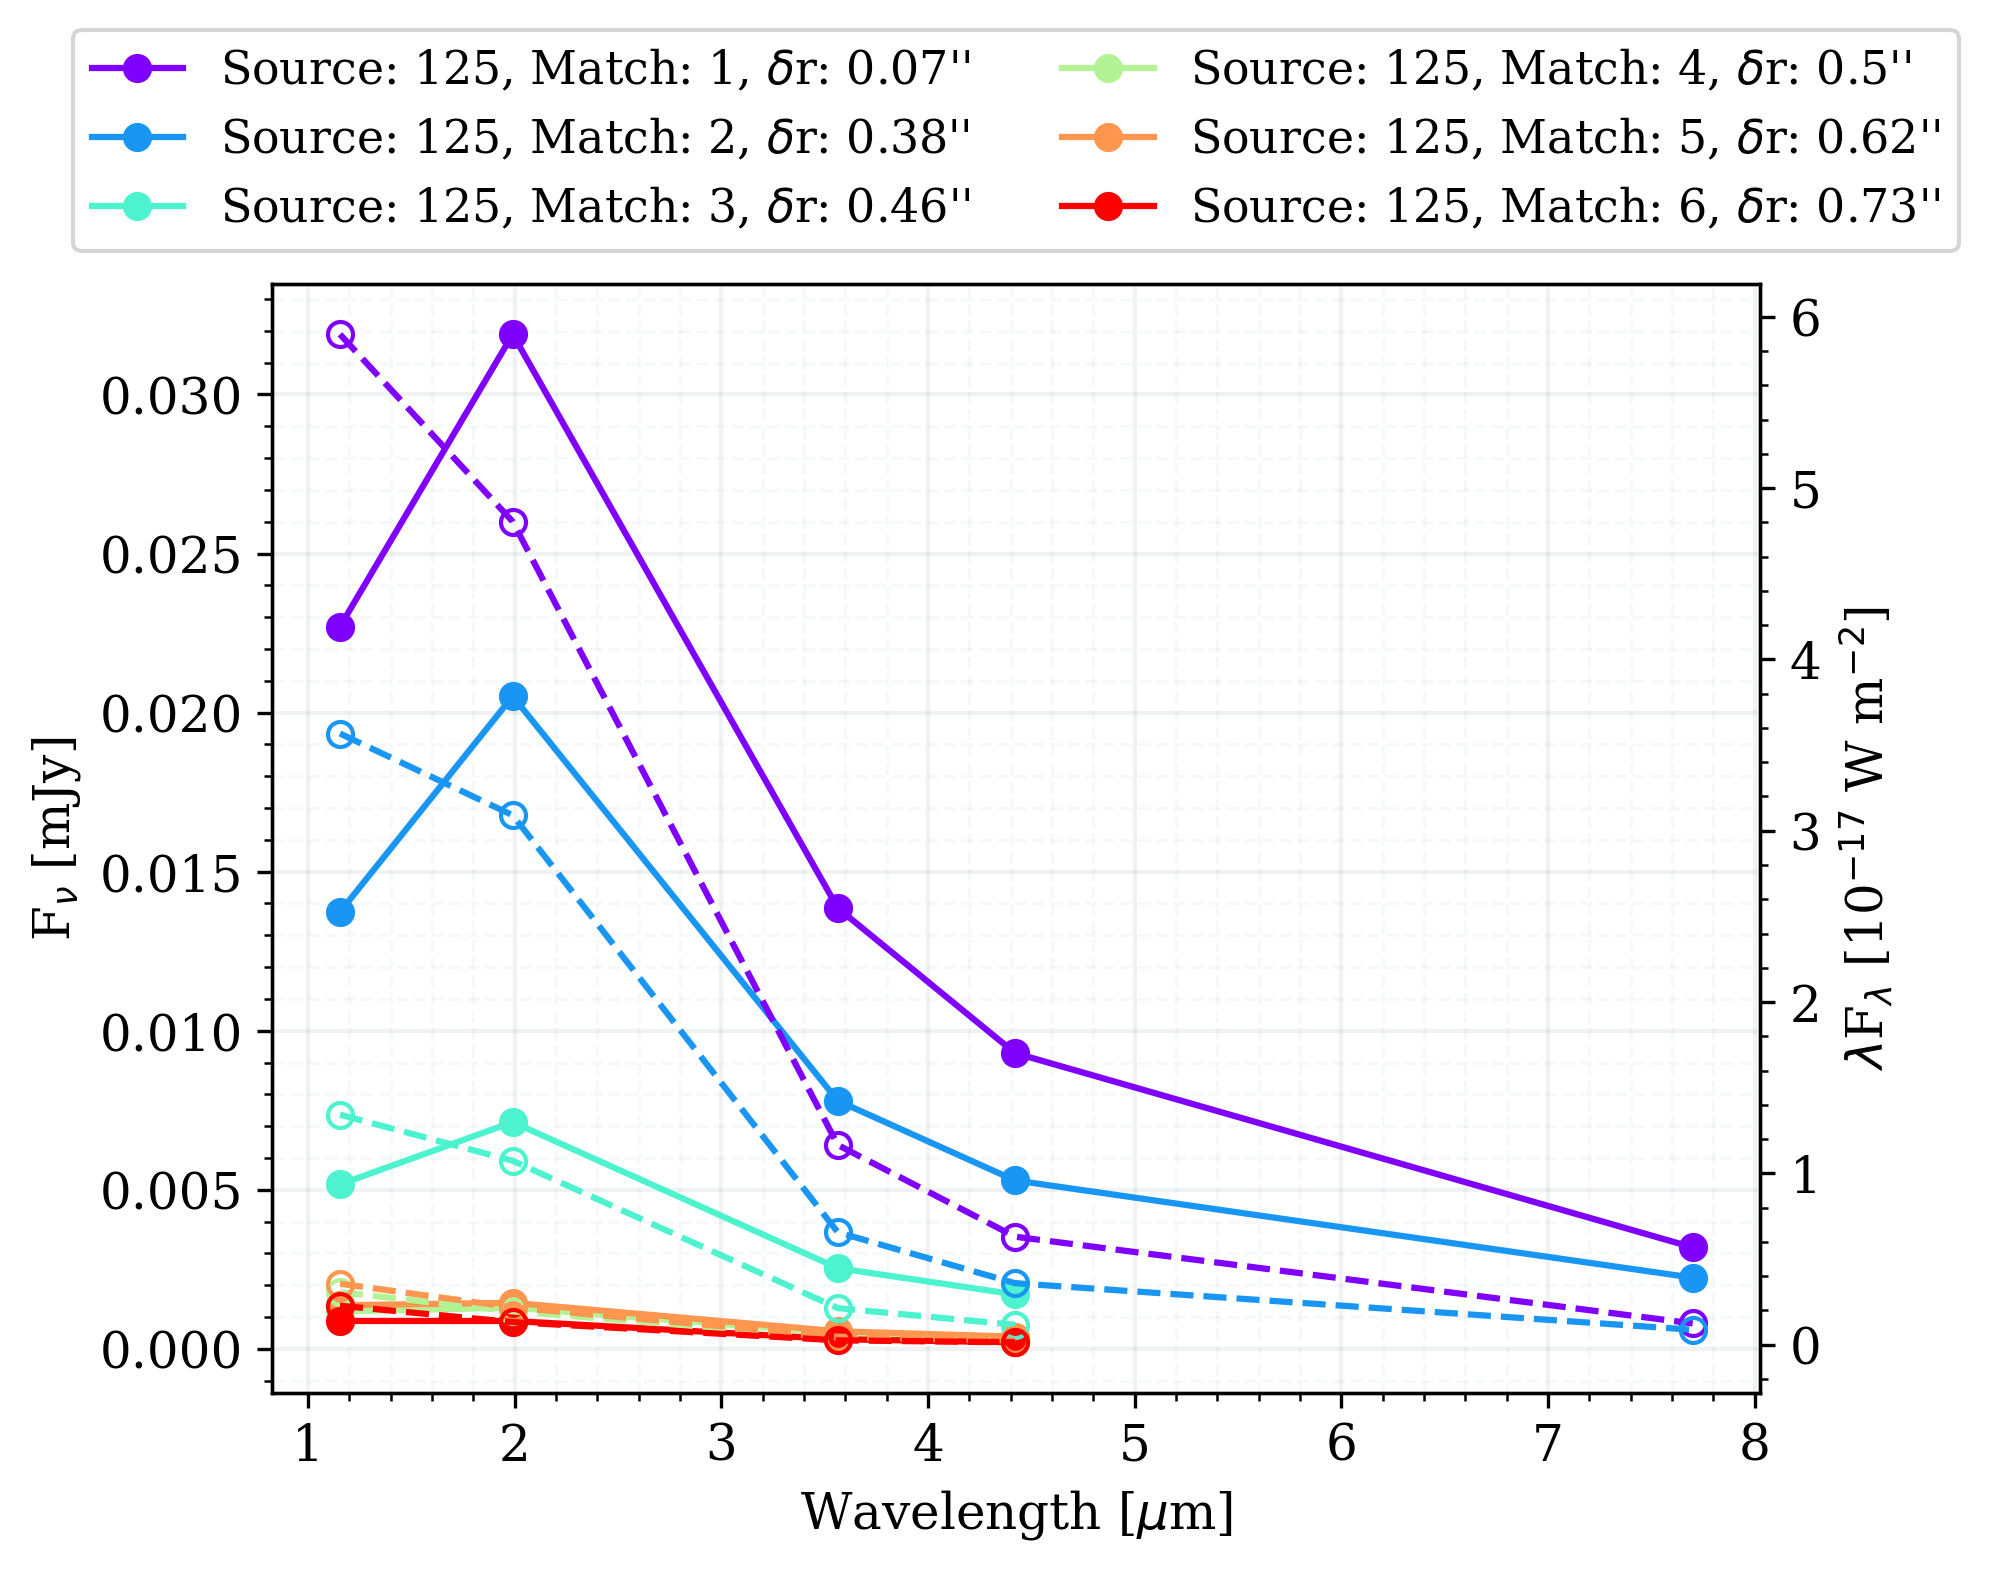
Next, to investigate why only roughly half of the Kinson et al. (2021) Spitzer I YSOs and YSO candidates have matches to objects in our red source catalog, we match the coordinates of each Kinson et al. (2021) source to all JWST-identified sources within Spitzer I (71,000 objects). Subsequently, we inspect the SEDs and images in all eight NIRCam and MIRI bands of the six nearest matches (with detections in at least four JWST filters) to each Kinson et al. (2021) source. We choose to follow up sources with detections in at least four JWST filters, because there are often additional close matches that have detections in only one to two filters. We find that sources in the Kinson et al. (2021) catalog that were identified as YSOs or YSO candidates but have no match to our JWST source catalog are bright in NIRCam filters, but are not detected in the mid-IR MIRI filters. We show an example of this in Figure 8. The bottom panel of this figure shows the SEDs of the six nearest matches to one of the Kinson et al. (2021) YSO (source 125 in Kinson et al., 2022) in both flux densities (left axis; solid lines and filled symbols) and fluxes (right axis; dashed lines and open symbols). The nearest match (0.07″) is shown in purple and subsequent matches are color-coded according to the legend. The top panel of Figure 8 shows arcsec2 (chosen to match the FWHM of the MIPS 24 µm PSF) zoom-in NIRCam and MIRI images centered on the Kinson et al. (2021) source, ordered from shortest wavelength (F115W) to longest wavelength (F2100W). The general trend we observe is that there are several sources matched to previously Spitzer identified YSOs within 1″ that are visible in NIRCam filters, but not in MIRI. In correspondence with this observation, we see that the SEDs of these nearest matches all peak at short wavelengths and diminish at longer wavelengths.
We propose three possibilities for why this may be the case: (1) Sources from Kinson et al. (2021) which are detected in near-IR wavelengths, but not in the mid-IR, are possibly more evolved YSO candidates. Stage I YSOs are deeply embedded within their parental giant molecular clouds (GMCs) and have a rising spectral index towards the mid- and far-IR (Adams et al., 1987). In contrast, more evolved Stage II and III YSOs have blown away dust and gas in their vicinity. Therefore, their fluxes are dominated by optical stellar light (Adams et al., 1987; Robitaille et al., 2006) and these YSOs are no longer visible in the mid-IR. Our color cuts may not capture these sources since many of these likely blend in with the general stellar population in the NIRCam CMDs; (2) All sources in common between Jones et al. (2019) and Kinson et al. (2021) are best-fit by Stage I YSO models which have rising SEDs toward the mid-IR, and would thus correspond to embedded objects. We see in the top panel of Figure 8 that two bright sources appear to the right from center in all four MIRI filters. It is therefore possible that, due to crowding and resolution limitations, there are mismatched sources across the JHK, IRAC, and MIPS photometry that were used to produce the combined catalogs, and that some of these sources are in fact not YSOs; (3) Finally, the drop in sensitivity at longer wavelengths is a limitation of our JWST data that may also contribute to the lack of mid-IR counterparts to the large number of suspected embedded, Stage I YSOs (Jones et al., 2019). At the most extreme, the faint limit of our NIRCam F115W data is 25.78 magnitudes, while for the MIRI F2100W data it is 14.43 magnitudes (see Nally et al. in prep.). For our two closest NIRCam and MIRI filters, F444W and F770W, the faint limits are 23.06 and 19.25 magnitudes, respectively. These differences in sensitivity are also reflected in the precipitous drop in source counts toward the mid-IR; within Spitzer I, the source counts are: 56,094 (F115W), 38,599 (F200W), 13,765 (F356W), 11,729 (F444W), 1,145 (F770W), 692 (F1000W), 273 (F1500W), and 72 (F2100W). While we would expect Stage I YSOs to brighten at mid-IR wavelengths, it is possible that they are fainter than what might be expected from MIPS 24 µm if source blending is significant, such as the case we show in the top panel of Figure 8, where there are two bright sources within the MIPS 24 µm PSF.
4.2 Comparison to 30 Doradus
The R136 SSC in 30 Doradus has high stellar densities ( M⊙ pc-3; Selman & Melnick, 2013) and contains many bright stars with the 30 most massive and luminous having a bolometric luminosity of (Massey & Hunter, 1998).
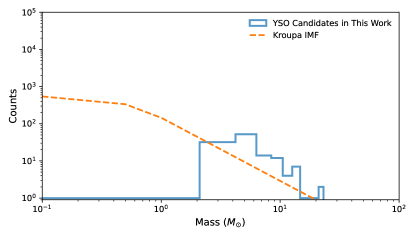
The mass range of the 129 JWST-identified YSO candidates within Spitzer I is . We fit a three-part Kroupa initial mass function (IMF) to the 129 YSO candidates from this work: for , for , and for (Kroupa, 2001). Our inventory of YSO candidates is likely incomplete; estimates of completeness will require further analysis through artificial star testing. The total stellar mass in Spitzer I derived from best-fit Kroupa IMF is (Figure 9). Assuming a typical YSO formation timescale of , the SFR of Sptizer I is .
Nayak et al. (2023) find the current SFR in 30 Doradus derived from counting the YSO candidates and fitting an IMF to be , roughly an order of magnitude higher than the calculated SFR in Spitzer I. In contrast, the average SFR over the last 4 Myr in 30 Doradus calculated using H is . The SFR in 30 Doradus has increased over time in the last few million years. The low SFR of is consistent with Spitzer I being a very young and embedded massive cluster, similar to 30 Doradus 4 Myr ago.
5 Summary and Conclusion
We have presented the first JWST NIRCam and MIRI images (GTO PID: 1234; PI: M. Meixner) of the central stellar bar of NGC 6822, focused particularly on the Spitzer I region, a candidate proto-SSC that has been found to host the largest number of YSOs in this galaxy. We aimed to revisit the YSO population of Spitzer I with this new, high-resolution data. To do so, we have combined NIRCam and MIRI photometry to construct CMDs, and established color selection criteria to identify red sources of interest. We have fit and visually inspected the SEDs of these sources, along with the NIRCam and MIRI images of each, to identify likely YSOs and YSO candidates. We summarize our findings here:
1. The NIRCam and MIRI data reveal a stark difference in the appearance of Spitzer I at shorter and longer wavelengths (see Figure 1). NIRCam reveals a very densely populated field of stars, with several prominent background galaxies. The F356W observations reveal faint diffuse emission likely associated with the 3.3 µm PAH feature. In contrast, our MIRI observations show a network of dusty filaments traced in 7.7 µm PAH emission.
2. We establish color selection criteria to pick 1,274 red sources of interest for further follow up and investigation (see Figure 2). We fit and visually inspect the SEDs of these sources to remove evolved star contaminants. In addition, we visually inspect the images of each source in all eight NIRCam and MIRI filters to identify and remove background galaxy contaminants. This results in a catalog of 129 YSOs for the Spitzer I region (see Figure 3).
3. Matching our catalog to that of Kinson et al. (2021), which contains 90 YSOs and 49 YSO candidates within Spitzer I, we find that 66 of these 139 sources have a match to an object in our catalog. One of these is a prominent background galaxy (see Figure 4), 20 appear to be evolved stars or are unclassified, and the remaining 45 are matched to a JWST-identified YSO or YSO candidate. We also find that individual YSOs from the Kinson et al. (2021) catalog often correspond to multiple JWST sources.
4. We also compare the temperatures, luminosities, and masses of the JWST-identified YSOs to the Spitzer-identified YSOs of Jones et al. (2019), extracted from SED fitting (see Figure 7). We find that these earlier studies over-estimate these properties, which is likely due to the limitations of the Spitzer Space Telescope resolution and the blending of multiple sources in a crowded field.
5. To investigate why only half of the Kinson et al. (2021) YSOs and YSO candidates have matches to JWST red sources, we match the Kinson et al. (2021) objects to all sources we extract within the Spitzer I region. We visually inspect the SEDs and images across all filters for the nearest six matches that have detections in at least four JWST filters (see Figure 8). We find that in nearly all cases where there are no JWST matches, all nearest matched stars have SEDs that peak at short wavelengths in NIRCam and fall off at longer wavelengths in MIRI. We speculate that the reasons for this might be that: (1) These sources might actually be Stage II or III YSOs which may be faint in MIRI and are not selected by our color cuts; (2) In many cases, we see that within 6″ (the FWHM of the Spitzer MIPS 24 µm filter), there are sources that appear bright at MIRI and could feasibly have been MIPS sources that were mismatched to IRAC sources in earlier works, and are thus not YSOs; and (3) The sensitivity of MIRI drops dramatically at the longest MIRI wavelengths compared to the shortest NIRCam wavelengths, and we may thus be missing sources.
This work relies on PSF photometry for NIRCam and aperture photometry for MIRI. As work continues to improve the JWST calibrations and simulated PSFs, future work will include conducting PSF photometry for our MIRI observations and perhaps extracting fainter sources and increasing our source counts in the mid-IR. As we refine our photometry and source catalogs, we will revisit the YSO population of Spitzer I and reassess these results and how our JWST findings compare to previous studies, and investigate additional statistical tools for identifying and separating various stellar populations. In conclusion, JWST has revealed a striking new view of the central stellar bar of NGC 6822 and of the Spitzer I star-forming region, and it shows that its high resolution is necessary to properly identify individual YSOs, characterize their properties, and remove background contaminants.
Acknowledgements
This work is based on observations made with the NASA/ESA/CSA James Webb Space Telescope. The data were obtained from the Mikulski Archive for Space Telescopes at the Space Telescope Science Institute, which is operated by the Association of Universities for Research in Astronomy, Inc., under NASA contract NAS 5-03127 for JWST. These observations are associated with program #1234.
LL acknowledges support from the NSF through grant 2054178. OCJ acknowledges support from an STFC Webb fellowship. CN acknowledges the support of an STFC studentship. MM and NH acknowledge that a portion of their research was carried out at the Jet Propulsion Laboratory, California Institute of Technology, under a contract with the National Aeronautics and Space Administration (80NM0018D0004). PJK acknowledges support from the Science Foundation Ireland/Irish Research Council Pathway programme under Grant Number 21/PATH-S/9360. ON acknowledges the NASA Postdoctoral Program at NASA Goddard Space Flight Center, administered by Oak Ridge Associated Universities under contract with NASA. ASH is supported in part by an STScI Postdoctoral Fellowship.
References
- Adams et al. (1987) Adams, F. C., Lada, C. J., & Shu, F. H. 1987, ApJ, 312, 788, doi: 10.1086/164924
- Andersen et al. (2021) Andersen, M., Zinnecker, H., Hirschauer, A. S., Nayak, O., & Meixner, M. 2021, AJ, 161, 206, doi: 10.3847/1538-3881/abe622
- Astropy Collaboration et al. (2013) Astropy Collaboration, Robitaille, T. P., Tollerud, E. J., et al. 2013, A&A, 558, A33, doi: 10.1051/0004-6361/201322068
- Boyer et al. (2022) Boyer, M. L., Anderson, J., Gennaro, M., et al. 2022, Research Notes of the American Astronomical Society, 6, 191, doi: 10.3847/2515-5172/ac923a
- Cannon et al. (2006) Cannon, J. M., Walter, F., Armus, L., et al. 2006, ApJ, 652, 1170, doi: 10.1086/508341
- Cardelli et al. (1989) Cardelli, J. A., Clayton, G. C., & Mathis, J. S. 1989, ApJ, 345, 245, doi: 10.1086/167900
- Chevance et al. (2020) Chevance, M., Madden, S. C., Fischer, C., et al. 2020, MNRAS, 494, 5279, doi: 10.1093/mnras/staa1106
- Clark et al. (2005) Clark, J. S., Negueruela, I., Crowther, P. A., & Goodwin, S. P. 2005, A&A, 434, 949, doi: 10.1051/0004-6361:20042413
- de Blok & Walter (2000) de Blok, W. J. G., & Walter, F. 2000, ApJ, 537, L95, doi: 10.1086/312777
- de Blok & Walter (2006) —. 2006, AJ, 131, 343, doi: 10.1086/497829
- Efremova et al. (2011) Efremova, B. V., Bianchi, L., Thilker, D. A., et al. 2011, ApJ, 730, 88, doi: 10.1088/0004-637X/730/2/88
- Emig et al. (2020) Emig, K. L., Bolatto, A. D., Leroy, A. K., et al. 2020, ApJ, 903, 50, doi: 10.3847/1538-4357/abb67d
- Gallagher et al. (1991) Gallagher, John S., I., Hunter, D. A., Gillett, F. C., & Rice, W. L. 1991, ApJ, 371, 142, doi: 10.1086/169878
- García-Rojas et al. (2016) García-Rojas, J., Peña, M., Flores-Durán, S., & Hernández-Martínez, L. 2016, A&A, 586, A59, doi: 10.1051/0004-6361/201527265
- Gardner et al. (2023) Gardner, J. P., Mather, J. C., Abbott, R., et al. 2023, PASP, 135, 068001, doi: 10.1088/1538-3873/acd1b5
- Gordon et al. (2022) Gordon, K. D., Bohlin, R., Sloan, G. C., et al. 2022, AJ, 163, 267, doi: 10.3847/1538-3881/ac66dc
- Hirschauer et al. (2020) Hirschauer, A. S., Gray, L., Meixner, M., et al. 2020, ApJ, 892, 91, doi: 10.3847/1538-4357/ab7b60
- Hodge et al. (1988) Hodge, P., Kennicutt, Robert C., J., & Lee, M. G. 1988, PASP, 100, 917, doi: 10.1086/132254
- Hodge (1977) Hodge, P. W. 1977, ApJS, 33, 69, doi: 10.1086/190419
- Hubble (1925) Hubble, E. P. 1925, ApJ, 62, 409, doi: 10.1086/142943
- Hunter & Kaufman (2007) Hunter, D. A., & Kaufman, M. 2007, AJ, 134, 721, doi: 10.1086/519838
- Hunter et al. (1995) Hunter, D. A., Shaya, E. J., Scowen, P., et al. 1995, ApJ, 444, 758, doi: 10.1086/175648
- Israel et al. (2003) Israel, F. P., Baas, F., Rudy, R. J., Skillman, E. D., & Woodward, C. E. 2003, A&A, 397, 87, doi: 10.1051/0004-6361:20021464
- Israel et al. (1996) Israel, F. P., Bontekoe, T. R., & Kester, D. J. M. 1996, A&A, 308, 723
- Jones et al. (2017) Jones, O. C., Meixner, M., Justtanont, K., & Glasse, A. 2017, ApJ, 841, 15, doi: 10.3847/1538-4357/aa6bf6
- Jones et al. (2019) Jones, O. C., Sharp, M. J., Reiter, M., et al. 2019, MNRAS, 490, 832, doi: 10.1093/mnras/stz2560
- Kennicutt (1979) Kennicutt, R. C., J. 1979, ApJ, 228, 394, doi: 10.1086/156858
- Kinson et al. (2021) Kinson, D. A., Oliveira, J. M., & van Loon, J. T. 2021, MNRAS, 507, 5106, doi: 10.1093/mnras/stab2386
- Kinson et al. (2022) —. 2022, VizieR Online Data Catalog, J/MNRAS/507/5106
- Kong et al. (2004) Kong, A. K. H., Sjouwerman, L. O., & Williams, B. F. 2004, AJ, 128, 2783, doi: 10.1086/425527
- Kroupa (2001) Kroupa, P. 2001, MNRAS, 322, 231, doi: 10.1046/j.1365-8711.2001.04022.x
- Lau et al. (2022) Lau, R. M., Hankins, M. J., Han, Y., et al. 2022, Nature Astronomy, 6, 1308, doi: 10.1038/s41550-022-01812-x
- Lee et al. (2005) Lee, S., Pak, S., Lee, S.-G., et al. 2005, MNRAS, 361, 1273, doi: 10.1111/j.1365-2966.2005.09259.x
- Leroy et al. (2018) Leroy, A. K., Bolatto, A. D., Ostriker, E. C., et al. 2018, ApJ, 869, 126, doi: 10.3847/1538-4357/aaecd1
- Levy et al. (2021) Levy, R. C., Bolatto, A. D., Leroy, A. K., et al. 2021, ApJ, 912, 4, doi: 10.3847/1538-4357/abec84
- Massey et al. (1987) Massey, P., Conti, P. S., & Armandroff, T. E. 1987, AJ, 94, 1538, doi: 10.1086/114586
- Massey & Hunter (1998) Massey, P., & Hunter, D. A. 1998, ApJ, 493, 180, doi: 10.1086/305126
- Massey et al. (2007) Massey, P., McNeill, R. T., Olsen, K. A. G., et al. 2007, AJ, 134, 2474, doi: 10.1086/523658
- Nally & Jones (2022) Nally, C., & Jones, O. 2022, Starbug2, 0.2.12. https://github.com/conornally/starbug2
- Nayak et al. (2019) Nayak, O., Meixner, M., Sewiło, M., et al. 2019, ApJ, 877, 135, doi: 10.3847/1538-4357/ab1b38
- Nayak et al. (2023) Nayak, O., Green, A., Hirschauer, A. S., et al. 2023, ApJ, 944, 26, doi: 10.3847/1538-4357/acac8b
- Ochsendorf et al. (2017) Ochsendorf, B. B., Zinnecker, H., Nayak, O., et al. 2017, Nature Astronomy, 1, 784, doi: 10.1038/s41550-017-0268-0
- Oey et al. (2017) Oey, M. S., Herrera, C. N., Silich, S., et al. 2017, ApJ, 849, L1, doi: 10.3847/2041-8213/aa9215
- Perrin et al. (2014) Perrin, M. D., Sivaramakrishnan, A., Lajoie, C.-P., et al. 2014, in Society of Photo-Optical Instrumentation Engineers (SPIE) Conference Series, Vol. 9143, Space Telescopes and Instrumentation 2014: Optical, Infrared, and Millimeter Wave, ed. J. Oschmann, Jacobus M., M. Clampin, G. G. Fazio, & H. A. MacEwen, 91433X, doi: 10.1117/12.2056689
- Rest (2023) Rest, A. 2023, JWST/HST Alignment Tool. https://github.com/arminrest/jhat
- Rieke et al. (2015) Rieke, G. H., Wright, G. S., Böker, T., et al. 2015, PASP, 127, 584, doi: 10.1086/682252
- Rieke et al. (2005) Rieke, M. J., Kelly, D., & Horner, S. 2005, in Society of Photo-Optical Instrumentation Engineers (SPIE) Conference Series, Vol. 5904, Cryogenic Optical Systems and Instruments XI, ed. J. B. Heaney & L. G. Burriesci, 1–8, doi: 10.1117/12.615554
- Rieke et al. (2023) Rieke, M. J., Kelly, D. M., Misselt, K., et al. 2023, PASP, 135, 028001, doi: 10.1088/1538-3873/acac53
- Rigby et al. (2023) Rigby, J., Perrin, M., McElwain, M., et al. 2023, PASP, 135, 048001, doi: 10.1088/1538-3873/acb293
- Robitaille (2019) Robitaille, T. 2019, APLpy v2.0: The Astronomical Plotting Library in Python, doi: 10.5281/zenodo.2567476
- Robitaille (2017) Robitaille, T. P. 2017, A&A, 600, A11, doi: 10.1051/0004-6361/201425486
- Robitaille et al. (2007) Robitaille, T. P., Whitney, B. A., Indebetouw, R., & Wood, K. 2007, ApJS, 169, 328, doi: 10.1086/512039
- Robitaille et al. (2006) Robitaille, T. P., Whitney, B. A., Indebetouw, R., Wood, K., & Denzmore, P. 2006, ApJS, 167, 256, doi: 10.1086/508424
- Rubin et al. (2016) Rubin, R. H., Simpson, J. P., Colgan, S. W. J., et al. 2016, MNRAS, 459, 1875, doi: 10.1093/mnras/stw719
- Sandstrom et al. (2023) Sandstrom, K. M., Chastenet, J., Sutter, J., et al. 2023, ApJ, 944, L7, doi: 10.3847/2041-8213/acb0cf
- Schruba et al. (2017) Schruba, A., Leroy, A. K., Kruijssen, J. M. D., et al. 2017, ApJ, 835, 278, doi: 10.3847/1538-4357/835/2/278
- Schutte et al. (1993) Schutte, W. A., Tielens, A. G. G. M., & Allamandola, L. J. 1993, ApJ, 415, 397, doi: 10.1086/173173
- Selman & Melnick (2013) Selman, F. J., & Melnick, J. 2013, A&A, 552, A94, doi: 10.1051/0004-6361/201220396
- Sewiło et al. (2013) Sewiło, M., Carlson, L. R., Seale, J. P., et al. 2013, ApJ, 778, 15, doi: 10.1088/0004-637X/778/1/15
- Sibbons et al. (2015) Sibbons, L. F., Ryan, S. G., Napiwotzki, R., & Thompson, G. P. 2015, A&A, 574, A102, doi: 10.1051/0004-6361/201423981
- Smith et al. (2006) Smith, L. J., Westmoquette, M. S., Gallagher, J. S., et al. 2006, MNRAS, 370, 513, doi: 10.1111/j.1365-2966.2006.10507.x
- Tantalo et al. (2022) Tantalo, M., Dall’Ora, M., Bono, G., et al. 2022, ApJ, 933, 197, doi: 10.3847/1538-4357/ac7468
- Taylor (2005) Taylor, M. B. 2005, in Astronomical Society of the Pacific Conference Series, Vol. 347, Astronomical Data Analysis Software and Systems XIV, ed. P. Shopbell, M. Britton, & R. Ebert, 29
- Turner et al. (2015) Turner, J. L., Beck, S. C., Benford, D. J., et al. 2015, Nature, 519, 331, doi: 10.1038/nature14218
- Tuthill et al. (1999) Tuthill, P. G., Monnier, J. D., & Danchi, W. C. 1999, Nature, 398, 487, doi: 10.1038/19033
- van Diedenhoven et al. (2004) van Diedenhoven, B., Peeters, E., Van Kerckhoven, C., et al. 2004, ApJ, 611, 928, doi: 10.1086/422404
- Whitney et al. (2008) Whitney, B. A., Sewilo, M., Indebetouw, R., et al. 2008, AJ, 136, 18, doi: 10.1088/0004-6256/136/1/18
- Willott (2022) Willott, C. 2022, jwst - Tools for processing and analyzing JWST data. https://github.com/chriswillott/jwst
- Wong et al. (2022) Wong, T., Oudshoorn, L., Sofovich, E., et al. 2022, ApJ, 932, 47, doi: 10.3847/1538-4357/ac723a
- Wright et al. (2023) Wright, G. S., Rieke, G. H., Glasse, A., et al. 2023, PASP, 135, 048003, doi: 10.1088/1538-3873/acbe66