11email: lsupan@iafe.uba.ar 22institutetext: Université de Paris, CNRS, Astroparticule et Cosmologie, F-75013 Paris, France
The SNR Kes 17-ISM interaction: a fresh view from radio and rays
This paper presents a comprehensive analysis of the Galactic supernova remnant (SNR) Kes 17 (G304.6+0.1) with a focus on its radio synchrotron emission, environs, and the factors contributing to the observed rays. The fitting to the firstly-obtained integrated radio continuum spectrum spanning from 88 to 8800 MHz yields an index (), indicative of a linear particle acceleration process at the shock front of the remnant. Accounting for the SNR radio shell size, the distribution of atomic hydrogen ( ), and assuming the SNR is in the Sedov-Taylor stage of its evolution, we estimate the remnant’s age to be roughly 11 kyr. This result falls at the lower end of the wide range (2-64 kyr) derived from previous analyses of the diffuse X-ray emission interior to the remnant. Furthermore, we used and (=1-0) emission-line data as a proxy for molecular hydrogen and provided the first evidence that the eastern shell of Kes 17 is engulfing a molecular enhancement in the surrounding gas, with an average mass and density . Towards the western boundary of Kes 17 there are not signatures of carbon monoxide emissions above 3, despite previously reported infrared observations have revealed shocked molecular gas at that location. This suggests the existence of a CO-dark interacting molecular gas, a phenomenon also recorded in other Galactic SNRs (e.g. CTB 37A and RX J1713.7–3946) revealing itself both in the infrared and -ray domains. Additionally, by analysing 14.5 yr of continuously collected data from the Large Area Telescope on board the satellite Fermi, we determined that the best-fit power-law photon index for the 0.3-300 GeV -ray emission from the Kes 17 region is (stat syst) in agreement with prior studies. The energy flux turns out to be erg cm-2 s-1 implying a luminosity erg s-1 at kpc. Finally, we successfully modelled the multiwavelength spectral energy distribution by incorporating the radio synchrotron spectrum and the new measurements of GeV -rays. Our analysis indicates that the observed -ray flux most likely originates from the interaction of Kes 17 with western “dark” CO zone with a proton density 400 cm-3.
Key Words.:
ISM: supernova remnants – ISM: individual objects: Kes~17 (G304.6+0.1) – radio continuum: general – gamma rays: ISM1 Introduction
Supernova remnants (SNRs) are captivating objects that cause a long-lasting impact on the Galactic ecosystem, leaving distinct imprints that can be observed across the entire electromagnetic spectrum. This paper, focused on the source Kes 17 (G304.6+0.1), is part of a series of articles conducted by the author team, dedicated to investigating the association between radio and -ray emissions in remnants of stellar explosions. Previous studies in this series were devoted to G338.30.0 (Supan et al., 2016), Kes 41 (Supan et al., 2018a, b), and G46.80.0 (Supan et al., 2022), all of them middle-aged -ray emitting SNRs interacting with their ambient medium.
The initial observations of Kes 17 at radio wavelengths were conducted in the 1970s at 408 and 5000 MHz using the Molonglo and Parkes single-dish telescopes (Goss & Shaver, 1970; Shaver & Goss, 1970a; Milne & Dickel, 1975). The first distance estimate for the remnant was approximately 6 kpc, derived using the uncertain - relation (Shaver & Goss, 1970b). Later on, Caswell et al. (1975) established a lower limit of 9.7 kpc based on absorption features in the low-resolution neutral hydrogen (H I) spectrum of gas clouds along the line-of-sight. This lower limit remained unchanged for nearly five decades, until a recent reanalysis by Ranasinghe & Leahy (2022), which yielded a kinematic distance kpc to the remnant.
Kes 17 was extensively studied in the X-ray domain using data obtained with XMM-Newton, Suzaku, and ASCA satellites (Combi et al., 2010; Gök & Sezer, 2012; Gelfand et al., 2013; Pannuti et al., 2014; Washino et al., 2016). According to the observed properties of the X-ray emitting gas, Combi et al. (2010) proposed that the source belongs to the mixed-morphology (MM) type of SNRs, characterised by a shell-like morphology in radio wavelengths and a filled-centre composition in X rays. Additionally, they suggested the presence of a nonthermal component in the northern, central, and southern regions of the SNR shock front. However, subsequent studies with improved statistics have raised doubts about this possibility and concluded that the X-ray spectrum is dominated by thermal emission (Gök & Sezer, 2012; Gelfand et al., 2013; Washino et al., 2016). At the high-energy end of the spectrum, Kes 17 has been linked to a GeV source detected by the Fermi Large Area Telescope (LAT) (Wu et al., 2011; Gelfand et al., 2013). No counterpart at TeV energies has been reported so far. Concerning the SNR environment, the first hint of interaction came from low-resolution observations of the 1720-MHz maser-line of hydroxyl (OH) (Frail et al., 1996). A significant breakthrough in linking Kes 17 to the interstellar matter occurred through near-infrared (near-IR) spectroscopic studies, which were crucial in firmly determining the location and characteristics of the shocked H2 gas (Lee et al., 2011).
This paper is organised as follows: In Sect. 2 we present the first analysis of the radio continuum spectrum for Kes 17. Adopting a standard evolution model we also derived the SNR’s age by means of the radio size of the expanding forward shock and 21 cm spectral-line observations of the H I gas. Sect. 3 focuses on investigating the morphology and kinematics of the molecular gas emitting in CO lines. This represents the first study of the CO gas in the region of Kes 17. In Sect. 4, we provide an updated analysis of the Fermi-LAT data covering 14.5 yr. We also investigate the emission mechanism responsible for the high-energy flux through a broadband modelling that incorporates the revisited measurements at radio and GeV -ray energies. Our findings are summarised in Sect. 5.
2 SNR Kes 17 in radio wavelengths
2.1 Morphology and spectrum
The radio remnant Kes 17 is characterised by non uniform emission from a complete, albeit irregular, shell structure with an average size of . This can be observed in the 843 MHz image from the Molonglo Sky Survey (SUMSS, HPBW = 45)111http://www.physics.usyd.edu.au/sifa/Main/SUMSS, Bock et al. (1999) included in the inset of Fig. 2a. The surface brightness of the remnant is W m-2 Hz-1 at 843 MHz, while that of the brightest elongated feature ( in size) along the southern periphery is W m-2 Hz-1 An arc of enhanced synchrotron emission is noticed in the northwest region of the remnant, near , . This arc has a size of approximately and coincides with a distinctive bend in the shock front of Kes 17. Bright continuum and line emission in the IR wavebands, as reported by Lee et al. (2011), accompanies the radio synchrotron emission along this edge of Kes 17. Another noteworthy feature is an indentation towards the east of the radio shell, at approximately , , possibly indicating that the SNR shock is wrapping around an external inhomogeneity. The structure of the surrounding matter, revealed for the first time by the analysis of the CO gas is discussed in Sect. 3.
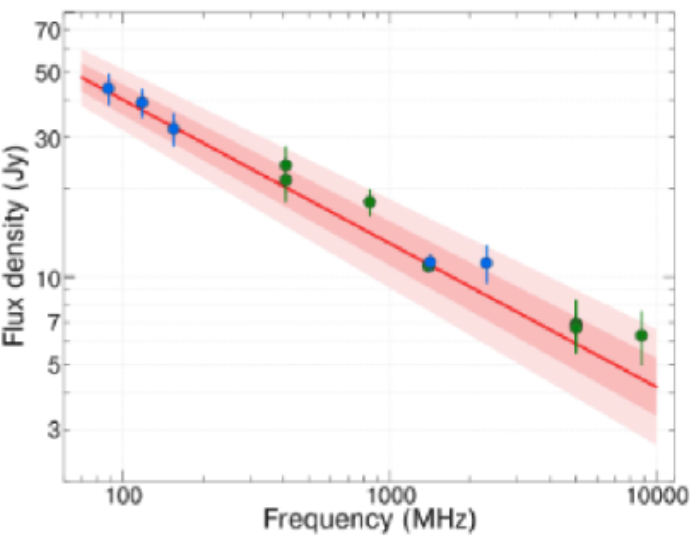
To construct the global spectrum of the radio continuum emission of Kes 17, we compiled flux density estimates from the literature as well as new fluxes that we measured from publicly available radio surveys. For frequencies below 160 MHz, the lowest at which Kes 17 has been detected to date, we used the Galactic and Extragalactic All-sky Murchison Widefield Array Survey (GLEAM, Hurley-Walker et al. 2019)222https://www.mwatelescope.org/science/galactic-science/gleam/. We also used the Southern Galactic Plane Survey (SGPS, McClure-Griffiths et al. 2005)333https://www.atnf.csiro.au/research/HI/sgps/queryForm.htmlat 1420 MHz and the S-band Polarisation All Sky Survey (S-PASS, Carretti et al. 2019)444https://sites.google.com/inaf.it/spass at 2303 MHz. Flux measurements with an error greater than 20% were discarded from the analysis. For the remaining data, if information on the primary calibrator was available, they were brought to the absolute flux scale presented by Perley & Butler (2017). This flux scale is valid for the entire range of compiled frequencies in our analysis (88-8800 MHz) and has an accuracy of 3%. The set of data points was fitted using the simple power-law model , where represents the integrated flux at frequency and is the radio spectral index. During the fitting process, flux measurements were rejected if their dispersion with respect to the model was greater than 2 of the best-fit values.
The final dataset is reported in Table LABEL:fluxes-table. It constitutes the most complete compilation of radio flux measurements conducted for Kes 17 to date. Figure 1 displays the integrated radio continuum spectrum for this SNR, with our new flux density determinations represented by blue filled circles. A weighted least-squares fit was applied to the data points resulting a spectral index . This value is flatter than the previous measurement () reported by Shaver & Goss (1970b), which was based on flux estimates at only 408 and 5000 MHz. The synchrotron radiation spectrum we derived for Kes 17 is consistent with electrons being accelerated via a first-order Fermi mechanism (Onić, 2013). Regarding the spectral shape, the straight distribution of flux densities at low radio frequencies (below 100 MHz) indicates that if ionised gas exists, whether it is located either co-spatially or coincidentally intersecting Kes 17 along the line of sight, the free-free absorption it produces does not have an impact on the integrated continuum spectrum of the remnant. Low-frequency turnovers caused by free-free absorption by ionised gas in H II regions (or in their associated lower-density envelopes), as well as at the interface between an ionising shock and its immediate environment, have been measured in the spectra of some SNRs (e.g. Kes 67, Kes 75, W41, Kes 73, 3C 396, and W49B, Castelletti et al. 2021). For Kes 17, determining whether its forward shock ionises or not the western region where SNR’s interaction with dense gas has been proved in the infrared (Lee et al., 2011), could potentially be illuminated by improved sensitivity and resolution radio observations, especially at the low-frequency portion of the spectrum.
| Frequency | Integrated flux | Reference |
| (MHz) | (Jy) | |
| 88 | 43.9 5.2 | This work (GLEAM) |
| 118 | 39.3 4.2 | This work (GLEAM) |
| 155 | 32.0 4.0 | This work (GLEAM) |
| 408 | 21.4 2.2 | Shaver & Goss (1970a) |
| 408 | 24.0 3.7 | Kesteven (1968) |
| 408 | 21.4 3.3 | Green (1974) |
| 843 | 18.0 1.8 ††footnotemark: † | Whiteoak & Green (1996) |
| 1400 | 10.9 0.14††footnotemark: † | Gelfand et al. (2013) |
| 1420 | 11.2 0.7 ††footnotemark: † | This work (SGPS) |
| 2303 | 11.1 1.6 ††footnotemark: † | This work (S-PASS) |
| 5000 | 6.7 0.7 | Shaver & Goss (1970b) |
| 5000 | 6.8 0.7 | Milne (1969) |
| 5000 | 6.9 1.4 | Milne & Dickel (1975) |
| 8800 | 6.3 1.3 | Dickel et al. (1973) |
2.2 SNR’s age and neutral gas properties from radio data
Estimating the dynamical age of supernova remnants involves indirect methods due to the inability to measure it directly. So far, all age estimates for Kes 17 have been derived on the basis of spectral fitting parameters to the cold and low density X-ray emitting gas inner to the radio shell. However, there are large differences in the estimated ages, with values ranging from 2.3 kyr to as high as 64 kyr depending on factors such as ionisation timescales, , and electron densities, ( 1-3 cm-3 s, 0.4-2.3 cm-3, Pannuti et al. 2014, and references therein). Besides, according to the proposal that Kes 17 is a member of the MM SNRs group and considering a thermal conduction model, Gelfand et al. (2013) derived an age range from 2 to 5 kyr. Additionally, they determined an upper age limit of 40 kyr by assuming that clump evaporation into the inter-cloud medium is primarily responsible for the observed X-ray emission.
In this section, we employ a standard evolution model and examine continuum and line emissions at centimetre wavelengths to estimate the age of Kes 17. The relative intermediate extent of Kes 17’s shock front (as illustrated in the inset of Fig. 2a) compared to other SNRs discovered in the Galaxy, coupled with the absence of optical signatures of radiative shocks in observations from surveys like the SuperCOSMOS H-alpha Survey (SHS, Parker et al. 2005)666http://www-wfau.roe.ac.uk/sss/halpha/index.html or the STScI Digitized Sky Survey (DSS),777https://archive.stsci.edu/cgi-bin/dss_form. lends support to the hypothesis that Kes 17 is in the Sedov expansion stage of its evolution. Based on this picture, the time elapsed since the explosion can be estimated via the relation (Cox, 1972):
| (1) |
where is the shock radius at present (in pc), is the ambient interstellar density (in cm-3), and is the initial explosion energy (in units of erg). The radius, measured in the radio continuum image of Kes 17 at 843 MHz, is or 8 pc according to the revisited kinematic distance kpc to the SNR obtained by Ranasinghe & Leahy (2022) from neutral hydrogen H I absorption features. For the ambient interstellar density, we considered it is well represented by the neutral hydrogen gas density, and estimated it via , the ratio of the hydrogen column density over its depth in the line of sight in the region of the SNR. To calculate we considered the 21 cm line emission of H I from the SGPS data. Our focus was to identify any sign of neutral gas that could have been swept up by the SNR shock or by the stellar winds of the progenitor star. If we detect accumulation of H I around the radio continuum boundary of the remnant, it can provide us with a rough estimate of the pre-shock medium density under the assumption that the accumulated atomic gas was uniformly distributed inside the volume of the H I shell before the stellar explosion. We did not find, however, any neighbouring structure of neutral atomic gas that could be feasibly associated with Kes 17. Moreover, an inspection of the HI datacube shows the remnant in absorption in the complete velocity range from 0 km s-1 to the tangent point velocity ( km s-1, according to the Galactic rotation curve of Reid et al. 2014). Therefore, we simply hypothesised that could be well represented by the mean density value measured in circular test-areas of radius distributed around the remnant (we tested different values and determined that our result remains consistent, within uncertainties, regardless of the size chosen). Under the common assumption that the H I emission is optically thin, after subtracting an appropriate mean background level to each H I velocity channel, the mean column density around Kes 17, calculated by integrating the H I emission between and km s-1 is . This velocity interval is in accord with the interstellar molecular matter traced in CO associated in space and velocity with the SNR (further analysis of this topic is provided in Sect. 3). According to all the assumptions we made previously, our analysis produces a number density in the H I ambient environment , larger than the typical value 1 cm-3 averaged over the cold, warm, and hot gas phases of the ISM (McKee & Ostriker, 1977). Therefore, using Eq. 1 and adopting the value erg for the energy released in the SN event, as derived by Leahy et al. (2020) incorporating both uniform ISM and stellar wind SNR evolutionary models, we estimated that Kes 17 is approximately 11 kyr old. Notably, when using the kinetic energy erg for a canonical SN the age decreases to roughly 7 kyr, not critically different within the uncertainties from our calculation.
We are aware that our approach for the Kes 17’s age provides a first-order approximation, since i) it assumes that the SNR is in the Sedov stage of its evolution, ii) the mean number density of atomic hydrogen, as measured from HI data, represents an upper limit because some of the H I may be unrelated gas located behind the SNR, and iii) our result ignores the possibility of the remnant evolving in an inhomogeneous ambient medium.
3 The molecular environment of Kes 17
The properties of the molecular gas in the region of Kes 17, as traced by the emission from carbon monoxide (CO), did not receive attention in previous works. Dense interstellar material interacting with the western shock front of the SNR was only revealed in infrared wavebands (Lee et al., 2011). Here, we present the main results of the first study towards Kes 17 carried out by using both and emission data in their rotational transition = 1-0. The datacubes for both species were extracted from the Three-mm Ultimate Mopra Milky Way Survey (ThrUMMS, Barnes et al. 2015).888https://users.astro.ufl.edu/~peterb/research/thrumms/ The spatial and spectral resolutions are 72′′ and 0.35 km s-1, respectively, with sensitivities 1 K each.
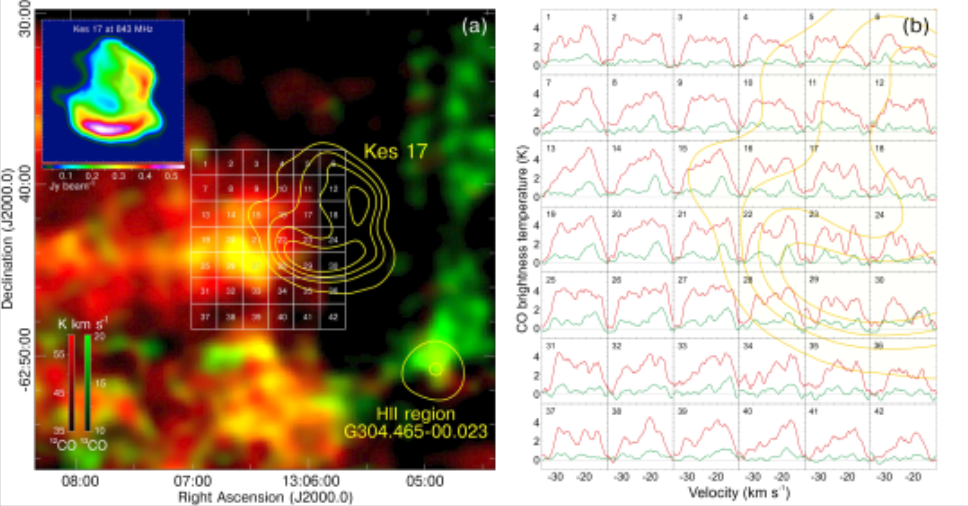
After carefully inspecting the CO data cubes throughout their velocity ranges km s-1, we only found molecular structures in projected correspondence with the radio continuum emission from the SNR’s shell in two intervals, with velocity ranges from to km s-1 and to km s-1, respectively. The CO structure in the first range peaks at km s-1 and in the plane of the sky lies towards the eastern border of Kes 17 with an angular size of approximately 8′ 4′ (in the south-north and east-west directions, respectively). We assigned to this molecular material a distance 5 kpc, as its velocity km s-1 is largely consistent with that of the tangent point in the direction of Kes 17. Consequently, we discard this cloud as possibly associated with Kes 17 ( 8 kpc, Ranasinghe & Leahy 2022), and it will not be analysed in the following. The emission from the second velocity component originates from a cloud at the eastern part of the SNR shell. The distribution of integrated and emissions are presented in the colour-coded Fig. 2a overlaid with contours of the radio continuum emission from the SNR shock wave. Overall, the compared to the emission appears spatially more extended within the region of interest. This difference in distribution can be explained by the fact that emission is optically thinner than that from , whereby it gives account of more internal and denser regions in the cloud (Wilson et al., 2013). Notably, in the brightest part of the uncovered molecular structure, corresponding to the yellowish regions where and emissions overlap, Kes 17 exhibits (within the 80′′ resolution of the radio image smoothed to match the resolution of the CO data) a significant deviation from a spherical symmetry.
In order to gain further insight into the characteristics of the molecular gas, we extracted and spectra across the entire region where the radio continuum emission from, and the CO line emission towards, Kes 17 show a line-of-sight superposition. To cover this region comprehensively, we employed a grid of boxes, as depicted in Fig. 2a. To enhance the signal-to-noise ratio of the spectra, they were smoothed by averaging intensity values within the 5 nearest-neighbour velocity channels. The resulting spectra, presented in Fig. 2b, show a broad emission region in with a velocity span 17 km s-1 and an intensity varying from approximately 2 to 4 K. Multiple kinematic components contribute to the observed emission with peak velocities at approximately , , and km s-1. Examples of profiles showing this behaviour correspond to boxes 16-18, 22-24, and 28-30, all of them within the outermost radio contour of the SNR shell. At the easternmost border of Kes 17, these three velocity components appear to be less distinguishable and exhibit blending. We stress that the profiles (Fig. 2b) do not reproduce the triple-peaked structure observed in the gas, but a broad peak at about km s-1, in complete agreement with the velocity of the H I absorption features used to constrain the distance to Kes 17 (Ranasinghe & Leahy, 2022). The intensity of the emission peaks is 1-2 K.
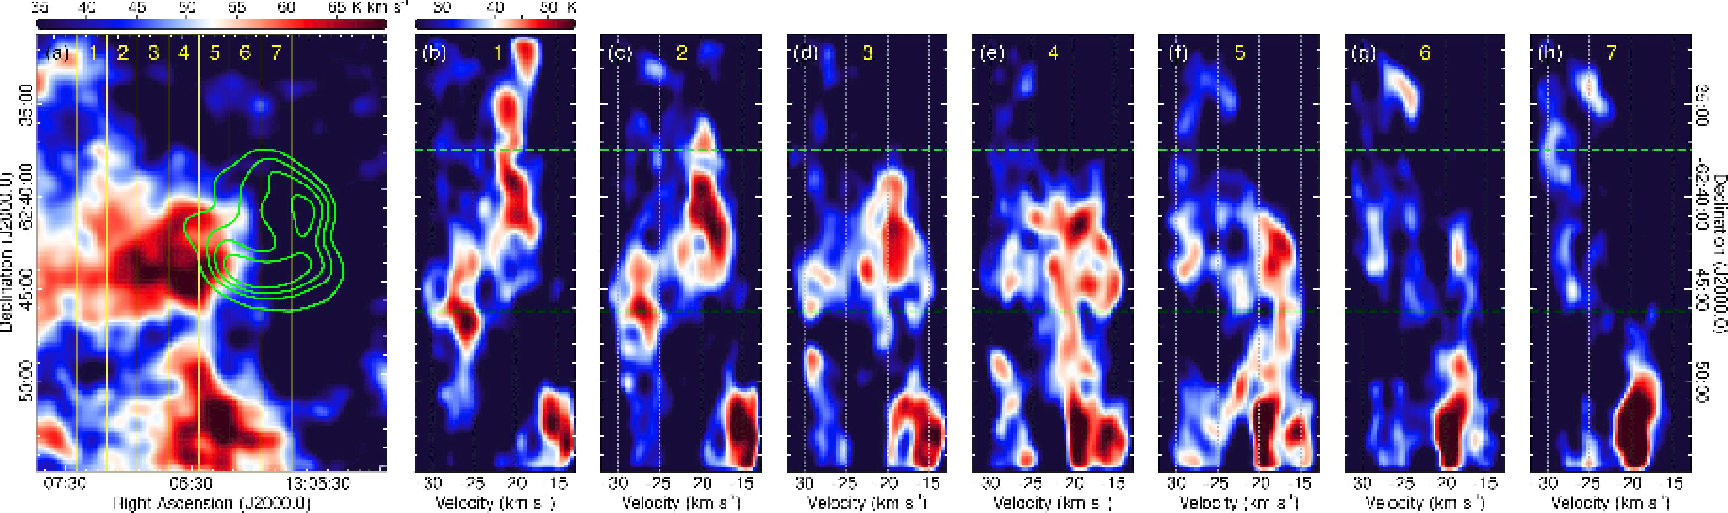
Figure 3 displays position-velocity (-) diagrams of the molecular gas emission. They were constructed by integrating the emission along the R.A. direction in seven slices, each covering a range of 100′′. These slices span the entire cloud of interest and constitute an appropriate tool to effectively capture the spatial heterogeneity of the individual velocity components observed in the spectral distribution shown in Fig. 2b. By inspecting the - diagrams, it is evident that the molecular emission is mostly concentrated at km s-1, adjacent at the position where the radio shell of the remnant is highly distorted and it appears to branch off to the interior of the SNR (panels e to g in Fig. 3). Bright knots are noticeable in the cloud’s interior.
By combining the CO emission and H I absorption profiles (not shown here) extracted over the brightest part of the molecular concentration emitting at km s-1, we determined that it is located at its far kinematical distance kpc. The remaining velocities components of the cloud are at around 7 kpc ( km s-1) and 7.5 kpc ( km s-1). Taking the associated uncertainties (1.0 kpc) in these determinations into account, it can be concluded that these peaks arise from different components of the same structure. The average distance to this structure is estimated to be approximately 7.5 kpc, completely compatible with the distance determined for Kes 17 ( kpc Ranasinghe & Leahy 2022). The error in the distance determination for the molecular gas stem from various factors. One of these contributions is the uncertainty in the peak velocity value for each gas component. Additionally, accurately measuring the properties of individual molecular components can be challenging, especially when they are not completely resolved. Lastly, the use of a Galactic rotation curve, such as the one proposed by Reid et al. (2014), involves assumptions and uncertainties.
We notice that despite our analysis of the molecular material through and lines supports the coexistence of the discovered eastern cloud and the remnant, we have not observed distinct broadenings in the CO emission attributable to turbulence caused by the impact of Kes 17’s shock front. Therefore, we propose that the spectral behaviour of CO might illustrate a soft contact between the surrounding cloud and the remnant’s shockwave. Certainly, the process of impacting the cloud might be at an initial stage.
We have also estimated the total mass and mean density of the molecular gas in the newly-detected cloud at to km s-1 by using both the and (= 1-0) emissions. The procedure involves calculating the molecular hydrogen column density , and deriving both and from it. is obtained from the integrated emission of the CO by using appropriate conversion factors relating the integrated emission of and the H2 column density ( (K km s-1)-1, Bolatto et al. 2013), and also between the column density and ( = , Kohno et al. 2021). We refer the reader to the work of Wilson et al. (2013), where the expressions and assumptions (related to local thermodynamic equilibrium) employed for obtaining column densities are explained in detail. The mass is calculated through the relation , where is the mean molecular mass of the cloud,999Assuming a helium abundance of 25%. is the hydrogen atom mass, and is the solid angle subtended by the cloud located at the distance . On the other side, the mean molecular density is , where denotes the extent of the cloud in the line of sight assumed to be equal to the average of the mean size of the structure in R.A. and Dec. For the integration of the CO emissions we used a circular region with a radius of 5′ (or pc at a distance of kpc to the cloud) centred at , . From this integration, we derived a molecular column density , consistent for both and gases. Therefore, the resulting mean mass and molecular density for the eastern cloud were estimated to be and , respectively. The uncertainties in these measurements are of the order of 40%, and comprise errors in the distance and the definition of the structure in the plane of the sky, as well as in the velocity space. We also notice that differences in the obtained values using emissions from both and were found to be within 20%. The fact that the values estimates from both and are in agreement indicates that both isotopologues provide consistent measurements and can be used for deriving cloud parameters.
Now we focus on the molecular gas distribution towards the western side of the SNR shell. Of particular interest is the absence of CO emission above 3 (where 1 K) spatially correlated with the radio continuum bright region, which is roughly 2′ 4′ in size (centred at , ). In this region, molecular hydrogen and ionic lines at infrared wavelengths have revealed the expansion of the SN shock on a molecular cloud, as reported by Lee et al. (2019). Based on these findings, we tentatively propose the existence of a “CO-dark” gas component to the west of Kes 17. In this scenario, the gas-phase carbon could be in atomic form, while the hydrogen is in molecular form. A similar phenomenon have been observed in CTB 37A (Maxted et al., 2013) and RX J1713.7–3946 (Sano & Fukui, 2021). More sensitive CO molecular-line measurements are needed to shed more light on this scenario for Kes 17. It is, however, worth noting that the detection of -ray radiation in the direction of the remnant can indirectly trace the dark-molecular gas component if it is generated by cosmic-ray collisions with the gas (Wolfire et al., 2010). In the case of Kes 17, a -ray excess at GeV energies has indeed been detected in projected coincidence with the remnant. The analysis of this emission is addressed in Sect. 4 of this work. In passing by, a peculiar wall-like structure of is observed at a distance of approximately from the outermost radio contour towards the west. However, the straight vertical border of this structure and the absence of a counterpart in the data covering the same region strongly suggest that this is not a real feature.
4 The field of Kes 17 at -ray energies
The first reports of emission in the -ray domain spatially projected onto Kes 17 were presented by Wu et al. (2011) and Gelfand et al. (2013), based on statistics of 30-39 months data from Fermi-LAT. The latest Fermi-LAT catalogue of GeV sources (4FGL-DR3,101010https://fermi.gsfc.nasa.gov/ssc/data/access/lat/10yr_catalog/. Abdollahi et al. 2020, 2022) identifies the observed -ray excess directed towards Kes 17 as 4GL J1305.56241. To date, there have been no reports of TeV radiation detected in the Kes 17’s field. In this section we provide an update on the GeV emission in direction to this SNR and investigate the nature of the high energy photons by modelling the spectral energy distribution (SED) combining the updated -ray data with the firstly-obtained radio continuum spectrum of Kes 17 presented in Sect. 2.1.
4.1 The treatment of GeV data from Fermi-LAT
Our analysis comprises the largest statistics of events for Kes 17 to date, consisting of approximately 14.5 yr of continuous data acquisition with the Fermi-LAT, spanning from the beginning of the mission on August , 2008, to February , 2023.111111Corresponding to the time range from 239557417 to 681653590 seconds of the mission elapsed time (MET). This represents a significant improvement of 450% in observing time compared to the previous study conducted by Gelfand et al. (2013).
The processing of the LAT data was conducted using the fermipy module version 1.1.6 (Wood et al., 2021), which uses the Science Tools package version 2.2.0.121212fermipy routines were implemented through a JupyterLab Notebook, https://jupyter.org/. Events were selected using the Pass 8, release (P8R3) of photon reconstructions and the latest instrument response functions (P8R3_SOURCE_V6). The region of interest (ROI) used to extract the events was a circle in size centred at Kes 17 (, ). To extract valid events, we employed the tasks gtselect and gtmktime applying standard filters for good-time intervals (GTIs)131313Information about the definition of events and GTIs can be found in the Fermi-LAT Science Support Center (FSSC) web page, https://fermi.gsfc.nasa.gov/ssc/. and selecting “source” class events (evtype = 3). An additional cut for the zenith angle at 90∘ was implemented to minimise potential contamination from cosmic-ray (CR) interactions in the upper atmosphere. We considered events with reconstructed energies above 0.3 GeV to mitigate the adverse effects of systematic uncertainties in the effective area and the degradation of the point spread function (PSF) at the lowest energies (Ackermann et al., 2012). Furthermore, we excluded photons above 300 GeV due to the limited amount of events at the highest energies.
The set of filtered events was used to fit a sky model through a maximum likelihood optimisation procedure (Mattox et al., 1996). For the optimisation, we implemented a binned likelihood analysis over the ROI. The spatial bins were set at for both morphological and spectral analysis, and the energy range from 0.3 to 300 GeV was divided into 10 logarithmic bins per decade. In the analysis we included all sources from the LAT 10-year (4FGL-DR3) located within the ROI, except 4FGL J1305.5–6241 in projected coincidence with Kes 17. The models used for the optimisation were gll_iem_v06 for the diffuse Galactic background and iso_P8R2_SOURCE_V6_v06 for the isotropic background. The spectral parameters and normalisations of these models were allowed to freely vary during the optimisation process. Convergence was achieved by means of the Minuit optimiser, fixing the source parameters beyond a radius of 4∘ from the ROI centre.
4.2 Morphological and spectral characteristics of the GeV emission
To investigate the spatial distribution of the -ray emission, we used the fermipy tool tsmap to construct a test-statistics (TS) map. Each pixel in this map represents the likelihood of having a point source at the corresponding coordinates, compared to the null hypothesis of the sky model without the point source. The TS parameter is calculated as TS = , where and are the likelihoods including and excluding the source in the sky model, respectively. The TS map allows us to assess the significance of the source detection, (Mattox et al., 1996). In Fig. 4 we present the TS map obtained, overlaid with contours depicting the radio emission from Kes 17. The global TS value after the likelihood optimisation for the GeV source projected in coincidence with Kes 17 was TS 730, corresponding to a detection significance . This represents an improvement of about 2.5 times over the value reported by Gelfand et al. (2013).
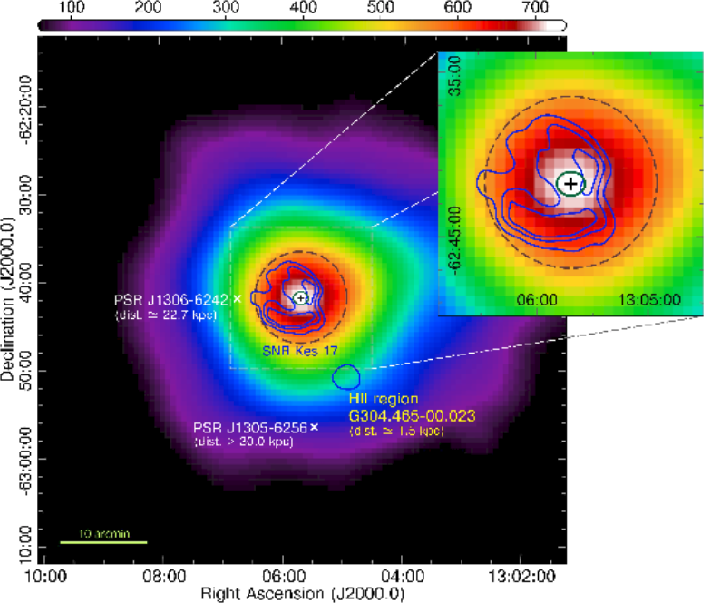
We tested the possibility that the GeV emission be extended by using the extension tool from fermipy, which makes a likelihood analysis by modelling the source as a circular region with variable radius. After convergence, the fitted value of the radius at 95% confidence is , and the significance of the extension is TS 16.3 (). The low significance of the fitted size is indicative that the emission is not significantly extended. We then consider in the following that the -ray excess detected by the Fermi-LAT corresponds to a point-like source and, consequently, we modelled it as a point source. Under this assumption, the localise tool yields the following location of this source: R.A. = , Dec. = 21.6′′, within a 95% confidence limit. From our analysis the localisation of the source, indicated by a green ellipse in Fig. 4, has been significantly improved by approximately one order of magnitude compared to the previous value reported in the 4FGL catalogue. The molecular gas, traced by the bright IR filaments (Lee et al. 2011, and references therein) could extend to cover the -ray region. As we proposed in Sect. 3, this region is suspected of containing “CO-dark” molecular gas in interaction with Kes 17’s shock front.
To investigate the spectral characteristics of the GeV -ray excess detected towards Kes 17, we generated an SED by performing a binned likelihood analysis in the 0.3-300 GeV range, implemented through the fermipy tool sed. To ensure a balance between energy resolution and statistical significance, the data were grouped into 5 equally-spaced bins per decade on a logarithmic energy scale. Additionally, we incorporated energy dispersion corrections to mitigate systematic effects on the fitted spectral parameters.
In our treatment, systematic contributions arise from the effective area, the PSF of the Fermi-LAT, the energy scale, and variations in the spectral parameters due to the normalisation of the diffuse background.141414Further details about systematic errors can be found in the FSSC web page. The contribution related to the effective area is variable and can reach approximately 10% at the extremes of the energy range considered in our analysis. For energies below 100 GeV, the systematic error related to the PSF containment radius is around 5% and increases linearly to about 20% for higher energies. Energy scale uncertainties are within 5% throughout the energy range. On the other hand, systematics associated with the Galactic diffuse background were estimated following the procedure from Abdo et al. (2009), which consists in artificially varying and fixing the normalisation by 6% with respect to the original fit and examining the resulting variations in the fitted spectral parameters. In the analysis of the broadband SED (Sect. 4.3), both statistical and systematic effects were considered. The contributions from both sources of uncertainties were added in quadrature to obtain a final error band for each energy bin.
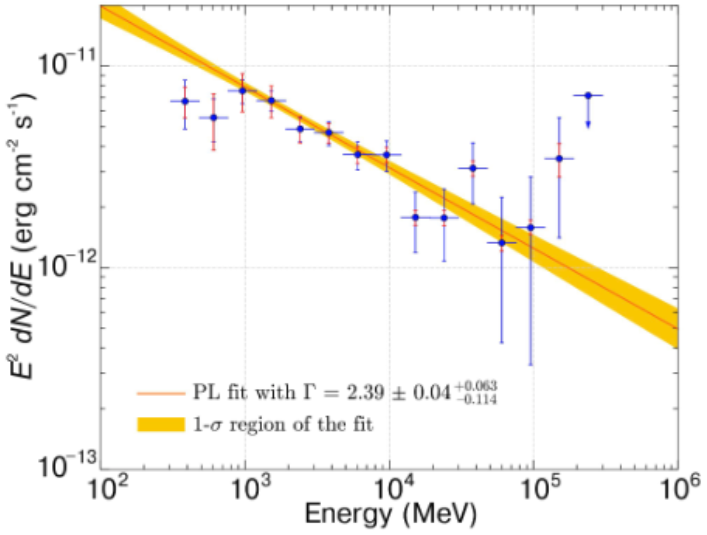
The data were fitted using a power-law model , where is the differential flux (in units of s-1 MeV), is the “pivot” energy, and represents the energy spectral index. Through the bin-by-bin likelihood procedure, we obtained a spectral index value ( stat syst), which is well in agreement with the 4FGL value, but it is softer and marginally consistent with that from Gelfand et al. (2013). Our result is also in agreement with the correlation observed by Acero et al. (2016) between the radio spectral index and the GeV photon index for SNRs interacting with molecular clouds. The data points are shown in Fig. 5, where blue and red error bars denote the statistic and systematic uncertainties, respectively. The plot also shows the power-law fit to the data points, as well as the 1- confidence interval for the fit. The integrated flux is determined to be erg cm-2 s-1,151515Equivalent to an integrated photon flux of ph s-1. corresponding to a luminosity erg s-1 at the distance of kpc. The phenomenology of how the luminosity in -rays for SNRs competes with factors such as distance uncertainties, molecular gas repository densities, or time evolution effects is complex and a detailed analysis of this topic is beyond the scope of this work. However, despite this limitation, we can provide a brief comparison of our estimate for Kes 17 with those derived in a similar energy range (0.1-100 GeV) for emitters identified as advanced (i.e., from middle-aged to old, kyr) and young-aged ( kyr) SNRs associated with molecular clouds (for a more detailed discussion, refer to Acero et al. 2022). For instance, when considering the older sources W44 and IC 443 with high local densities (- cm-3 Yoshiike et al. 2013; Dell’Ova et al. 2020), they would be 5 or even 60 times more luminous than Kes 17 if we place them at the distance of 8 kpc.161616The reported -ray luminosities values turns out to be - erg s-1 in the 0.1-100 GeV range for W44 and IC 443 according to Acero et al. (2022) ( kpc, Ranasinghe & Leahy 2022 and kpc, Yu et al. 2019).. Additionally, the -ray luminosity of the mature remnant Cygnus Loop, evolving in a low-density environment (1-10 cm-3, Fesen et al. 2018), would be comparable to our estimate for Kes 17 if they were located at the same distance.171717The estimated luminosity in 0.1-100 GeV for Cygnus Loop is erg s-1 (Acero et al., 2022) at 0.7 kpc (Fesen et al., 2018). We also point out that all of these middle and advanced-age remnants are more luminous, by one to two orders of magnitude, compared to the young SNRs Tycho and Kepler, which are expanding in low-density media (10 cm-3, Acero et al. 2022; Zhang et al. 2013).181818 for Tycho and Kepler spans the range - erg s-1 at 4 and 5 kpc, respectively (Acero et al. 2022, and references therein).
4.3 Analysis of the spectral energy distribution of Kes 17 from radio to rays
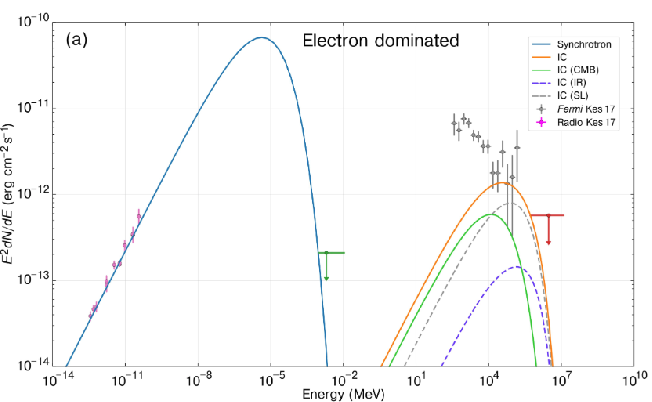
In this section we study the spectral energy distribution of Kes 17, incorporating the new nonthermal continuum radio spectrum extracted from the SNR shell and the high-energy spectrum obtained from new observations by the Fermi-LAT. For the nonthermal X-ray emission, we used an upper limit derived from Suzaku data by Gelfand et al. (2013). At very high energy, we used an upper limit above 1 TeV from the H.E.S.S. Galactic Plane Survey (Fernández Gangoso, 2014; H. E. S. S. Collaboration et al., 2018). To model the multiwavelength emission, we considered an electron population that produces synchrotron radiation, inverse Compton scattering (IC), and nonthermal bremsstrahlung. Additionally, we incorporated a proton population that interacts with the surrounding gas, resulting in the subsequent production and decay of neutral pions (). The parameters characterising these models are presented in Table LABEL:gamma-table and were derived using the Naima Python package (Zabalza, 2015).
To investigate the plausibility of a scenario where the leptonic component is dominant, we considered a one-zone model with an electron population distributed in energies according to a power-law. The updated radio continuum spectrum, extended to cover frequencies from 88 to 8800 MHz, allowed us to further constrain the spectral index of the synchrotron emission, at (Sect. 2.1). We used this measurement to fix the initial power-law index of the electron energy spectrum to a value 1.9. Then, the X-ray upper limit derived by Gelfand et al. (2013) imposes a tight constrain on the magnetic field (), the energy cut-off () and the energy density () of the electron population, which are degenerate. Following Gelfand et al. (2013), we assumed a magnetic field G, which yields a maximum value of the cut-off energy estimated to be TeV and a total energy density erg, which appears reasonable for a middle-aged system (see discussion in Gelfand et al. 2013 about the cut-off in the spectrum due to synchrotron losses of middle-aged to old systems). We first consider the electron population distribution obtained from the radio spectrum synchrotron fit to compute the associated Inverse Compton emission in order to reproduce the observed level of measured -ray emission. We consider three interstellar radiation fields: the cosmic microwave background (CMB) ( = 2.72 K, = 0.26 eV cm-3), the far-IR (FIR) radiation ( = 27 K, = 0.415 eV cm-3), and the near-IR starlight radiation ( = 2800 K, = 0.8 eV cm-3), computed from the GALPROP191919https://galprop.stanford.edu/index.php model at the position of the remnant (Galactocentric distance of 6 kpc) (Strong et al., 2004; Porter et al., 2006). However, as shown in Fig. 6, the IC radiation produced by this electron population fails to reproduce the new Fermi-LAT spectrum. Particularly, the shape of the GeV emission cannot be reproduced by a simple electron population with an index of 1.9. Furthermore, the upper limit from H.E.S.S. places strong constraints on the level of IC emission at very high energies, and constrains the maximum value of the energy break in the electron spectrum to be 1.5 TeV and sets a minimum value for the magnetic field strength at 35 G (see Table LABEL:gamma-table). Therefore, we conclude that it is not possible to adequately model the broad-band emission using a purely leptonic scenario, at least within the framework of a one-zone model.
————————————-
| Scenario | / | ||||||||||
|---|---|---|---|---|---|---|---|---|---|---|---|
| (G) | (cm | (MeV) | (TeV) | (TeV) | (MeV) | (erg) | (erg) | ||||
| Electron dominated | 35 | 1.9 | 10 | 1.5 | 10 | ||||||
| Proton dominated (BPW) | 70 | 400 | 1.9 | 10 | 1.0 | 2.4/3.7 | 2 | 10 | |||
| Proton dominated (ExpCut-off) | 70 | 400 | 1.9 | 10 | 1.0 | 2.4 | 2 | 10 |
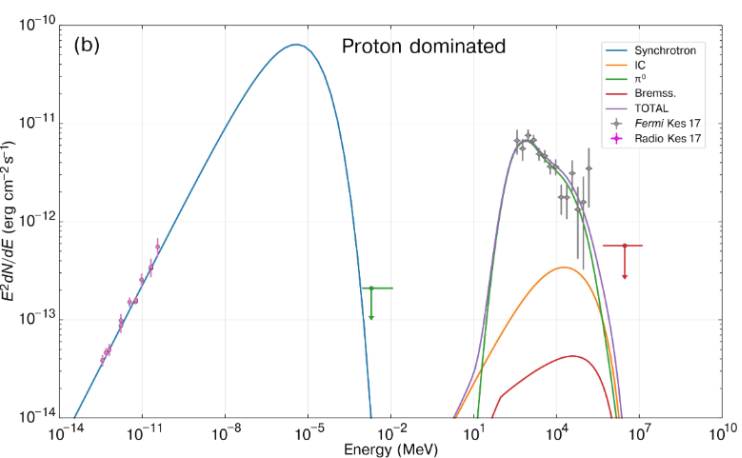
We now investigate a scenario where the major part of the -ray emission is attributed to decay. At this stage, it is important to recall that the Fermi source is spatially coincident with a part of the shell which has bright radio emission and exhibits IR filaments. While no molecular structures were detected in the region of bright -rays (Sect. 3), the study of molecular hydrogen and ionic lines, made it possible to highlight a signature of a shock due to an interaction of the SNR shell with a cloud (Lee et al., 2011). Consequently, in our analysis, we consider only the molecular gas in the western region of Kes 17, as the dominant contributor to the GeV photon flux through hadronic interactions. In the following we will consider a cloud density of 400 cm-3 in accord with the estimation made by Lee et al. (2011) from the IR emission. This value is an order of magnitude higher than the cm-3 used in Gelfand et al. (2013). To analyse the hadronic origin of the -ray radiation, we have assumed two models: a power-law proton spectrum with an index 2.4 and a cut-off above a few TeV (ExpCut-off), and a broken power-law (BPW) with indices = 2.40 and = 3.5 below and above = 2 TeV, up to a maximum energy of 10 TeV, which is strongly constrained by the steep spectrum deduced from Fermi data above few tens of GeV and the non detection of Kes 17 by H.E.S.S. We report all-proton dominated model parameters in Table LABEL:gamma-table. Both models fit the data equally well. To simplify the presentation, we have plotted only the ExpCut-off model in Fig. 6, which clearly shows that the -ray spectrum strongly supports the hadronic origin of the radiation. Since the hadronic -ray emission is proportional to the product of the kinetic energy in protons and the density of the medium, these parameters are closely correlated. Assuming that the total mass of the molecular cloud acts as the target material, we derived a total energy of cosmic-ray protons erg. As can be appreciated in Fig. 6, the first two data points at the lowest -ray energies seem to deviate from a pure power-law shape and appear to be compatible with the so-called “pion-bump” feature observed below a few hundred MeV. As discussed in Tang (2018), the combination of this rising feature in the spectrum with a steep spectrum beyond a few tens of GeV, is widely recognised as a characteristic signature of -decay, illuminating hadronic emission in SNRs. Such a signature is particularly observed in the growing class of advanced-aged GeV emitters SNRs interacting with MCs, as W44 (Giuliani et al., 2011), IC 443 (Ackermann et al., 2013), and W51C (Jogler & Funk, 2016). On the other hand, from the modelling of the data depicted in Fig. 6, it is evident that the contribution of bremsstrahlung radiation from the previously considered electron population, with a similar density, is clearly a minor component in the GeV energy range and its spectral behaviour does not accurately reproduce the spectrum shape. In the final proton-dominated model we include this marginal contribution, as well as that from IC emission of an electron population with a total energy density of erg. The ratio is 0.05 (see Table LABEL:gamma-table), larger than that in the proton-dominated scenario (0.01) discussed by Gelfand et al. (2013), but significantly smaller than their IC dominated scenario (0.1). It can be attributed to the reduction of as a consequence of the higher density of target matter considered here. On the basis of the new measurements of the GeV and radio spectra, we conclude that although a single electron population is considered to reproduce the overall synchrotron emission of the remnant, the decay process may be primarily responsible for the point-like -ray emission detected towards Kes 17 in the GeV energy range.
5 Summary and Conclusions
Based on our comprehensive update on the radio and -ray radiations from Kes 17, along with our analysis of the molecular environment brightening in the and ( = 1-0) lines, we have arrived at the following picture:
1- Kes 17 was created in a stellar explosion that occurred approximately 11 kyr ago in an ambient medium with a density roughly 7 cm-3.
2- The observed spectral shape of the shock front in Kes 17 emitting from 88 to 8800 MHz is adequately fitted with a simple power law model of index . The available radio data suggest that there is not ionised gas located in, around, or anywhere along the sightline to Kes 17 that significantly impacts the integrated spectrum. If present, this ionised gas may produce an spectral curvature below 100 MHz due to free-free thermal absorption. More sensitivity and resolution low frequency radio data are key to spatially resolving spectral curvatures due to intrinsic properties related to the shock in Kes 17 and its interaction with the immediate SNR’s surroundings observed in CO and infrared lines.
3- The eastern part of Kes 17 is wrapping a CO cloud. The main evidences of such an interaction include the distortion of the SNR shock and the distance to the CO cloud that is found to be completely compatible with the distance to the remnant. The average mass and density of this cloud are determined to be and 300 , respectively. Noteworthy, there is not appreciable CO emission detected towards the western region of the radio shell, where molecular hydrogen has been proven to be shocked by the Kes 17’s shock front. This suggests the presence of a CO-dark molecular gas.
4- No features of atomic hydrogen physically connected to Kes 17 are detected at the sensitivity and resolution of the SGPS data used in this work.
5- In its evolution, Kes 17 produces -ray photons at GeV energies, which have been observed by the Fermi-LAT telescope. The flux and luminosity at 7.9 kpc in the 0.3 - 300 GeV energy band are estimated to be erg cm-2 s-1 and erg s-1, respectively. The spectra of this high-energy emission has an index .
6- Based on observational evidence and modelling of the broadband SED ranging from radio to rays, it has been determined that a purely leptonic (IC) scenario is not favoured as an explanation for the emission from Kes 17 observed at GeV energies. Instead, the evidence suggests that the primary contribution to the -ray flux originates from the collision between the western part of the SNR shock front and a dense IR emitting region. Consequently, our analysis adds Kes 17 to the list of SNRs whose emission at GeV energies is hadronic-dominated. -ray luminosities measured in this class of remnants exhibit differences that can be interpreted in terms of the amount of molecular gas, which serves as target material for cosmic-ray interactions, as well as time-evolution effects. Future observations conducted using state-of-the-art instruments operating at the highest energies of the electromagnetic spectrum, coupled with improved resolution and sensitivity, will contribute to refining our understanding of the spectral and morphological behaviour of Kes 17 in the -ray regime.
Acknowledgements.
We are very grateful for the thorough corrections provided by the anonymous referee. G. Castelletti and L. Supan are members of the Carrera del Investigador Científico of CONICET, Argentina. This work was supported by the ANPCyT (Argentina) research project with number BID PICT 2017-3320. This work and collaboration is also supported by the International Emerging Actions program from CNRS (France).References
- Abdo et al. (2009) Abdo, A. A., Ackermann, M., Ajello, M., et al. 2009, ApJ, 706, L1
- Abdollahi et al. (2020) Abdollahi, S., Acero, F., Ackermann, M., et al. 2020, ApJS, 247, 33
- Abdollahi et al. (2022) Abdollahi, S., Acero, F., Baldini, L., et al. 2022, ApJS, 260, 53
- Acero et al. (2016) Acero, F., Ackermann, M., Ajello, M., et al. 2016, ApJS, 224, 8
- Acero et al. (2022) Acero, F., Lemoine-Goumard, M., & Ballet, J. 2022, A&A, 660, A129
- Ackermann et al. (2012) Ackermann, M., Ajello, M., Albert, A., et al. 2012, ApJS, 203, 4
- Ackermann et al. (2013) Ackermann, M., Ajello, M., Allafort, A., et al. 2013, Science, 339, 807
- Barnes et al. (2015) Barnes, P. J., Muller, E., Indermuehle, B., et al. 2015, ApJ, 812, 6
- Bock et al. (1999) Bock, D. C. J., Large, M. I., & Sadler, E. M. 1999, AJ, 117, 1578
- Bolatto et al. (2013) Bolatto, A. D., Wolfire, M., & Leroy, A. K. 2013, ARA&A, 51, 207
- Carretti et al. (2019) Carretti, E., Haverkorn, M., Staveley-Smith, L., et al. 2019, MNRAS, 489, 2330
- Castelletti et al. (2021) Castelletti, G., Supan, L., Peters, W. M., & Kassim, N. E. 2021, A&A, 653, A62
- Caswell et al. (1975) Caswell, J. L., Murray, J. D., Roger, R. S., Cole, D. J., & Cooke, D. J. 1975, A&A, 45, 239
- Combi et al. (2010) Combi, J. A., Albacete Colombo, J. F., Sánchez-Ayaso, E., et al. 2010, A&A, 523, A76
- Cox (1972) Cox, D. P. 1972, ApJ, 178, 159
- Dell’Ova et al. (2020) Dell’Ova, P., Gusdorf, A., Gerin, M., et al. 2020, A&A, 644, A64
- Dickel et al. (1973) Dickel, J. R., Milne, D. K., Kerr, A. R., & Ables, J. G. 1973, Australian Journal of Physics, 26, 379
- Fernández Gangoso (2014) Fernández Gangoso, D. 2014, Theses, Université Montpellier II - Sciences et Techniques du Languedoc
- Fesen et al. (2018) Fesen, R. A., Weil, K. E., Cisneros, I. A., Blair, W. P., & Raymond, J. C. 2018, MNRAS, 481, 1786
- Frail et al. (1996) Frail, D. A., Goss, W. M., Reynoso, E. M., et al. 1996, AJ, 111, 1651
- Gelfand et al. (2013) Gelfand, J. D., Castro, D., Slane, P. O., et al. 2013, ApJ, 777, 148
- Giuliani et al. (2011) Giuliani, A., Cardillo, M., Tavani, M., et al. 2011, ApJ, 742, L30
- Gök & Sezer (2012) Gök, F. & Sezer, A. 2012, MNRAS, 423, 1215
- Goss & Shaver (1970) Goss, W. M. & Shaver, P. A. 1970, Australian Journal of Physics Astrophysical Supplement, 14, 1
- Green (1974) Green, A. J. 1974, A&AS, 18, 267
- H. E. S. S. Collaboration et al. (2018) H. E. S. S. Collaboration, Abdalla, H., Abramowski, A., et al. 2018, A&A, 612, A5
- Hurley-Walker et al. (2019) Hurley-Walker, N., Hancock, P. J., Franzen, T. M. O., et al. 2019, PASA, 36, e047
- Jogler & Funk (2016) Jogler, T. & Funk, S. 2016, ApJ, 816, 100
- Kesteven (1968) Kesteven, M. J. L. 1968, Australian Journal of Physics, 21, 369
- Kohno et al. (2021) Kohno, M., Tachihara, K., Torii, K., et al. 2021, PASJ, 73, S129
- Kramer et al. (2003) Kramer, M., Bell, J. F., Manchester, R. N., et al. 2003, MNRAS, 342, 1299
- Leahy et al. (2020) Leahy, D. A., Ranasinghe, S., & Gelowitz, M. 2020, ApJS, 248, 16
- Lee et al. (2011) Lee, H.-G., Moon, D.-S., Koo, B.-C., et al. 2011, ApJ, 740, 31
- Lee et al. (2019) Lee, Y.-H., Koo, B.-C., Lee, J.-J., Burton, M. G., & Ryder, S. 2019, AJ, 157, 123
- Manchester et al. (2001) Manchester, R. N., Lyne, A. G., Camilo, F., et al. 2001, MNRAS, 328, 17
- Mattox et al. (1996) Mattox, J. R., Bertsch, D. L., Chiang, J., et al. 1996, ApJ, 461, 396
- Maxted et al. (2013) Maxted, N. I., Rowell, G. P., Dawson, B. R., et al. 2013, PASA, 30, e055
- McClure-Griffiths et al. (2005) McClure-Griffiths, N. M., Dickey, J. M., Gaensler, B. M., et al. 2005, ApJS, 158, 178
- McKee & Ostriker (1977) McKee, C. F. & Ostriker, J. P. 1977, ApJ, 218, 148
- Milne (1969) Milne, D. K. 1969, Australian Journal of Physics, 22, 613
- Milne & Dickel (1975) Milne, D. K. & Dickel, J. R. 1975, Australian Journal of Physics, 28, 209
- Onić (2013) Onić, D. 2013, Ap&SS, 346, 3
- Pannuti et al. (2014) Pannuti, T. G., Rho, J., Heinke, C. O., & Moffitt, W. P. 2014, AJ, 147, 55
- Parker et al. (2005) Parker, Q. A., Phillipps, S., Pierce, M. J., et al. 2005, MNRAS, 362, 689
- Perley & Butler (2017) Perley, R. A. & Butler, B. J. 2017, ApJS, 230, 7
- Porter et al. (2006) Porter, T. A., Strong, A. W., & Moskalenko, I. V. 2006, in AAS/High Energy Astrophysics Division, Vol. 9, AAS/High Energy Astrophysics Division #9, 18.63
- Ranasinghe & Leahy (2022) Ranasinghe, S. & Leahy, D. 2022, ApJ, 940, 63
- Reid et al. (2014) Reid, M. J., Menten, K. M., Brunthaler, A., et al. 2014, ApJ, 783, 130
- Sano & Fukui (2021) Sano, H. & Fukui, Y. 2021, Ap&SS, 366, 58
- Shaver & Goss (1970a) Shaver, P. A. & Goss, W. M. 1970a, Australian Journal of Physics Astrophysical Supplement, 14, 77
- Shaver & Goss (1970b) Shaver, P. A. & Goss, W. M. 1970b, Australian Journal of Physics Astrophysical Supplement, 14, 133
- Strong et al. (2004) Strong, A. W., Moskalenko, I. V., & Reimer, O. 2004, ApJ, 613, 962
- Supan et al. (2018a) Supan, L., Castelletti, G., Supanitsky, A. D., & Burton, M. G. 2018a, A&A, 619, A109
- Supan et al. (2018b) Supan, L., Castelletti, G., Supanitsky, A. D., et al. 2018b, A&A, 619, A108
- Supan et al. (2022) Supan, L., Fischetto, G., & Castelletti, G. 2022, A&A, 664, A89
- Supan et al. (2016) Supan, L., Supanitsky, A. D., & Castelletti, G. 2016, A&A, 589, A51
- Tang (2018) Tang, X. 2018, arXiv e-prints, arXiv:1801.03033
- Urquhart et al. (2022) Urquhart, J. S., Wells, M. R. A., Pillai, T., et al. 2022, MNRAS, 510, 3389
- Washino et al. (2016) Washino, R., Uchida, H., Nobukawa, M., et al. 2016, PASJ, 68, S4
- Whiteoak & Green (1996) Whiteoak, J. B. Z. & Green, A. J. 1996, A&AS, 118, 329
- Wilson et al. (2013) Wilson, T. L., Rohlfs, K., & Hüttemeister, S. 2013, Tools of Radio Astronomy (Springer Berlin, Heidelberg)
- Wolfire et al. (2010) Wolfire, M. G., Hollenbach, D., & McKee, C. F. 2010, ApJ, 716, 1191
- Wood et al. (2021) Wood, M., Caputo, R., Charles, E., et al. 2021, in International Cosmic Ray Conference, Vol. 301, 35th International Cosmic Ray Conference (ICRC2017), 824
- Wu et al. (2011) Wu, J. H. K., Wu, E. M. H., Hui, C. Y., et al. 2011, ApJ, 740, L12
- Yoshiike et al. (2013) Yoshiike, S., Fukuda, T., Sano, H., et al. 2013, ApJ, 768, 179
- Yu et al. (2019) Yu, B., Chen, B. Q., Jiang, B. W., & Zijlstra, A. 2019, MNRAS, 488, 3129
- Zabalza (2015) Zabalza, V. 2015, in International Cosmic Ray Conference, Vol. 34, 34th International Cosmic Ray Conference (ICRC2015), 922
- Zhang et al. (2013) Zhang, X., Chen, Y., Li, H., & Zhou, X. 2013, MNRAS, 429, L25