Complex Network View of the Sun’s Magnetic Patches: I. Identification
2Observatory, Faculty of Science, University of Zanjan, University Blvd., Zanjan, 45371-38791, Zanjan, Iran
3Sydney Institute for Astronomy, School of Physics, The University of Sydney, NSW 2006, Australia
)
1 Abstract
Solar and stellar magnetic patches (i.e., magnetic fluxes that reach the surface from the interior) are believed to be the primary sources of a star’s atmospheric conditions. Hence, detecting and identifying these features (also known as magnetic elements) are among the essential topics in the community. Here, we apply the complex network approach to recognize the solar magnetic patches. For this purpose, we use the line-of-sight magnetograms provided by the Helioseismic and Magnetic Imager on board the Solar Dynamic Observatory. We construct the magnetic network following a specific visibility graph condition between pairs of pixels with opposite polarities and search for possible links between these regions. The complex network approach also provides the ability to rank the patches based on their connectivity (i.e., degree of nodes) and importance (i.e., PageRank). The use of the developed algorithm in the identification of magnetic patches is examined by tracking the features in consecutive frames, as well as making a comparison with the other approaches to identification. We find that this method could conveniently identify features regardless of their sizes. For small-scale (one or two pixels) features, we estimate the average of 8% false-positive and 1% false-negative errors.
2 Introduction
In Sun-like stars, the magnetic field is transferred from the inner layers to the atmosphere as the buoyantly unstable field lines bundle into the convection zone, stretch and twist along the path, and finally break through the surface. Such a dynamo creates a complex magnetic environment at which new fluxes (i.e., magnetic patches) continuously appear and cancel on a star’s surface (Parker,, 1955; Murray et al.,, 2006; Priest,, 2014; Schmieder et al.,, 2014; Farhang et al.,, 2018). Accordingly, the solar photosphere is covered by magnetic features of various sizes and time scales ranging from tiny granular magnetic loops with fluxes as small as Mx and lifetimes of a few seconds/minutes to active regions (ARs) with fluxes up to Mx and typical lifetimes of several weeks (Zwaan,, 1985; Hagenaar et al.,, 1999; Wiehr et al.,, 2004; Cheung et al.,, 2007; Tortosa-Andreu and Moreno-Insertis,, 2009; Priest,, 2014; Archontis and Syntelis,, 2019). It is important to note that no explicit definition has been introduced for magnetic features on the Sun’s surface, yet, the term is commonly used in referring to flux concentrations and ephemeral regions (DeForest et al.,, 2007).
To this date, extensive research has been devoted to the observation and recognition of solar magnetic patches and various routines have been developed aspiring this purpose. These algorithms could principally be classified into threshold-based, region-growing-based, and clustering-based segmentation methods, as well as deep learning algorithms (e.g., Welsch and Longcope,, 2003; McAteer et al.,, 2005; Benkhalil et al.,, 2006; DeForest et al.,, 2007; Barra et al.,, 2008; Watson et al.,, 2009; Barra et al.,, 2009; Zhang et al.,, 2010; Harker,, 2012; Verbeeck et al.,, 2013; Bo et al.,, 2022). (Hagenaar et al.,, 1999) used the curvature of the two-dimensional map of the Michelson Doppler Imager (MDI) values of at the photosphere to detect the small solar magnetic patches. The magnetic concentrations are then determined through a pixel-clumping algorithm. (Parnell,, 2002) proposed the Magnetic Clumping Associative Tracker (MCAT) method which identifies magnetic features of the quiet Sun by applying a threshold-based technique. MCAT uses the intensity distribution of MDI images and implements a Gaussian approach (also see, Lamb and Deforest,, 2003). Yet Another Feature Tracking Algorithm (YAFTA) was designed in 2002 to detect both small and large-scale magnetic patches (Welsch and Longcope,, 2002). Given an initial intensity threshold, YAFTA applies a gradient-based method, namely the Downhill method, to extract the positive/negative field concentrations from magnetogram images of MDI (DeForest et al.,, 2007).
In early 2000, with the extensive development of artificial intelligence techniques, new generations of routines were developed to tackle the patch identification problem (McAteer et al.,, 2005; Zharkov et al.,, 2005). (Qahwaji and Colak,, 2005) developed an algorithm using both the image processing techniques (i.e., the morphological procedure, watershed transform, image enhancement routine, and region-growing method) and the machine learning approach (i.e., the neural network) to discern the solar disk borders in H images of the Sun, eliminate the limb-darkening effect, and track ARs. (Barra et al.,, 2008) introduced the Spatial Possibilistic Clustering Algorithm that divides solar full-disk EUV images into coronal Holes, ARs, and quiet regions via the Fuzzy Compact Clustering Means (FCM), and Possibilistic Compact Clustering Means (PCM) algorithms. (Kestener et al.,, 2010) performed a wavelet-based analysis on the magnetogram images to detect solar ARs and studied the multi-fractal characteristics of these features.
(Higgins et al.,, 2011) investigated ARs via a region-growing perspective based on the magnetic field strength. (Caballero and Aranda,, 2014) introduced a three-step algorithm to identify magnetic patches from the EUV images of the Sun. In this method, the images are first segmented into regions with similar properties (according to their intensity histograms). Then, the segments are classified following a hierarchical procedure. Finally, the results are validated through an optimization problem. (Arish et al.,, 2016) developed an unsupervised segmentation routine based on the Bayesian approach to distinguish between solar ARs and coronal holes in EUV images. (Quan et al.,, 2021) employed a deep learning algorithm to determine boundaries of the photospheric fluxes that appeared on the mid-longitudes of the solar disk between 2010 and 2017. They applied a convolutional neural network as well as the YOLO-V3 algorithm and compared the efficiency of these methods.
Despite all the advances made in the investigation of solar atmospheric patches over the past century, the true nature of their underlying mechanism is yet to be understood (Cho et al.,, 2007; Bellot Rubio and Orozco Suárez,, 2019; Farhang et al.,, 2019, 2022). The study of the photospheric flux concentrations and their dynamic evolution could provide new insight into the physical processes responsible for the generation and transport of the solar/stellar magnetic field (DeForest et al.,, 2007; Kosovichev,, 2009). Furthermore, the detection and tracking of the surface fields might even deliver forecasting capabilities (Nóbrega-Siverio et al.,, 2020). Here, we apply the complex network approach and discuss the use of such a novel perspective in the recognition of flux concentrations. The temporal evolution of magnetic patches, as a crucial step in the identification of ARs, will be appraised within the next article in the series.
The complex network approach has recently become of interest for studying solar magnetic structures (Gheibi et al.,, 2017; Daei et al.,, 2017; Najafi et al.,, 2020; Taran et al.,, 2022). This method provides a powerful tool for the identification and examination of complex systems (Donges et al.,, 2009; Boers et al.,, 2015; Kaki et al.,, 2022). Here, we use the magnetogram images to construct the solar magnetic network and assess its dynamic properties. According to the network theory, a graph (a set of edges and nodes as a mathematical representation of a network) could describe the complex relations governing a system (Steinhaeuser et al., 2010a, ; Steinhaeuser et al., 2010b, ). In such a schematic, nodes (vertices) may represent geographical regions, or any other concept depending on the subject system and an edge (link) indicates a physical or mathematical correspondence between two nodes. We consider the pixel locations as our nodes, and links are established if some predefined criteria are met. Generally, various types of graphs are possible depending on the intended condition (e.g., correlation-based, visibility-based, etc.) and the establishment of connections (i.e., simple, directed, or weighted). We show that the complex network approach could detect and identify magnetic features with great accuracy.
3 Data
Solar magnetic patches have been observed over decades by various land-based and space-based instruments (see e.g., Miesch,, 2005; Bellot Rubio and Orozco Suárez,, 2019, and the references therein). The Solar Dynamics Observatory (SDO) mission, launched in 2010, is a well-equipped spacecraft that has provided high-quality data in recent years. One of the instruments on board the SDO is the Helioseismic and Magnetic Imager (HMI). This telescope is mainly designed to study the complex evolution of the solar magnetic field and its origin in both the inner and outer layers of the Sun (Scherrer et al.,, 2012).
HMI provides full-disk images in the absorption line Fe at Å, with the spatial resolution of and temporal resolution of s (Schou et al.,, 2012). This instrument registers Dopplergram images (solar surface velocity maps), continuum filtergrams (wide spectrum images of the shadows), line-of-sight (LOS), and vector magnetograms (magnetic field maps of photosphere) (Pesnell et al.,, 2011; DeRosa and Slater,, 2013). Data are available at Stanford University’s Joint Science Operations Center (JSOC) database at jsoc.stanford.edu. The JSOC catalog archives the data in different resolutions of , , and pixels.
We use the HMI LOS magnetograms with the spatial sampling of pixel-1 at pixels with s intervals. is the radial field component at the disk center but includes non-radial components away from the disk center. However, the LOS magnetic field variation is insignificant and neglected in cases with the typical field-of-view of an AR.
4 The Magnetic Complex Network
We aim to construct the magnetic complex network and evaluate its utility in the recognition of solar photospheric patches. Applying this approach could improve our understanding of the Sun’s atmospheric events and their origins. The first step to establishing a network is defining nodes and edges. We consider each pixel of the HMI image as a node, and the existence of a link between each pair of nodes is verified based on the visibility graph condition:
| (1) |
where and are the unsigned magnetic intensities (absolute values of ) of any two arbitrary pixels with different polarities, and corresponds to the absolute values of all pixels placed along the line joining the two pixels. For example, in the HMI cutout image of Figure 1, the two pixels (red asterisks in panels a and b) connect only if their magnetic intensities exceed the values of those pixels laid on the line (panel c). Note that the likelihood of a link must be examined only between nodes with opposite polarities (panel d). A physical approach to constructing a magnetic network must focus on connections between positive and negative regions. In the remainder of this paper, we show how the graph theory conveniently accomplishes identifying magnetic patches.
5 The Network’s Properties
Having the magnetic network constructed, the calculation of its parameters is required for further investigations. To this purpose, we first calculate the adjacency matrix that contains information on the graph’s nodes (i.e., pixel locations) and edges (i.e., connectivity). Generally, for a magnetogram image of size pixels, there are nodes over which the connectivity must be checked. The size of the adjacency matrix for such a graph is . Introducing a threshold for the background field could practically decrease the execution time as it removes some of the nodes and shrinks the adjacency matrix. Generally, thresholds higher than 12 G are appropriate (see e.g., Shokri et al.,, 2022, and the references therein).
For a simple undirected and unweighted graph, the adjacency matrix is a symmetric array with elements equal to either or . These values indicate whether or not a connection is established between nodes. However, in directed networks, the matrix’s elements could adopt either positive or negative signs as a representation of the entry or exhaust of the edges into the nodes. In the case of weighted networks, there are no limitations, and the adjacency matrix could have any value (rather than binaries) manifesting the importance of the established connections.
We construct a directed and weighted graph to study the solar magnetic patches. We consider the incoming/outgoing magnetic intensities as the weight of connections. Specifically, if a connection is established between pixels and , then equals to of pixel , and equals to of pixel . In case of no connectivity would be zero. Also, is considered to be zero, due to the nature of the magnetic network. The next step is to investigate the graph’s properties (e.g., degree distribution and PageRank).
The degree distribution specifies how many effective connections are established in a network by measuring the number of nodes’ neighbors. By definition, the degree of the -th node of a graph is:
| (2) |
where is the adjacency matrix (Donges et al.,, 2009).
Further to the degree distribution, we calculate the PageRank and assess its applicability in the recognition of magnetic patches. The PageRank, illustrates the importance (popularity) of a node based on the structure of links in a graph (Sheng et al.,, 2020):
| (3) |
In this equation, the damping factor is a constant and could adopt any value between and . But usually, it is considered to be (Brin and Page,, 1998; Mohammadi et al.,, 2021).
In the next section, we discuss these properties in more detail and examine their usefulness in the detection of magnetic patches. We show that the map of degree distribution and PageRank could distinguish the borders of photospheric fluxes on the Sun’s surface.
6 Results and discussions
The solar magnetic activity could be investigated by detecting magnetic structures as they emerge, evolve, and annihilate on the surface. Following this objective, we introduced a new algorithm based on the complex network approach to identify the photospheric magnetic patches from HMI LOS images (the relevant MATLAB and Python packages are available on GitHub, see Data Availability Section). The applicability and efficiency of the developed algorithm are assessed through the examination of various data sets and the evaluation of the networks’ properties (i.e., degree distribution and PageRank). These properties are found to profitably identify magnetic patches from their environment.
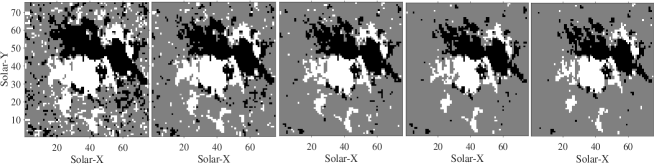
Considering a minimum background threshold for could affect the execution time and the detection of small patches. Figure 2 shows an HMI cutout image of an AR (NOAA 2929), registered at 23:58 on January 17, 2022. The Figure presents the identified magnetic islands for various choices of threshold i.e., 8, 12, 16, 20, and 24 G. Seemingly, lower thresholds result in more intricate outcomes. Considering that the inbred HMI magnetogram noise level hinges on the instrument data product and the area of interest in the photosphere, different thresholds are applicable for various studies
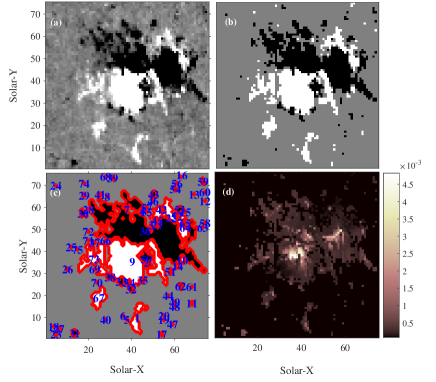
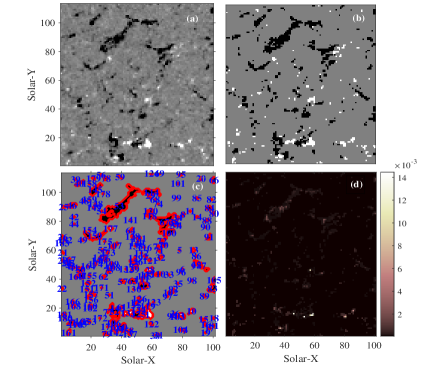
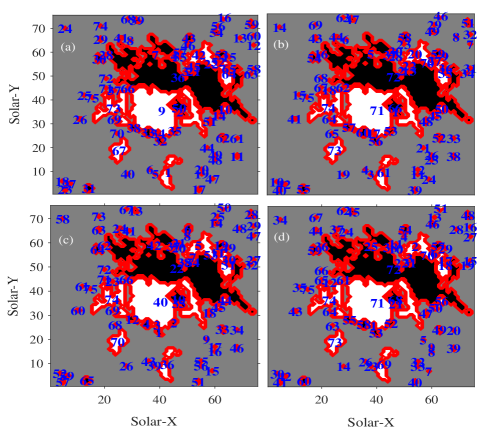
Figure 3 shows an HMI cutout image (panel a) and the map of the network’s degree distribution and PageRank (panels b,d respectively). Magnetic features are clearly visible on the map of the degree distribution. We acknowledge that the original maps have varying shades due to the wide range of plausible values for the degrees. However, a uniform color scheme is applied to all the degree distribution maps to render a better manifestation of borders. We obtain that higher magnetic fluxes result in higher values for PageRank. A similar analysis is performed on the HMI image of a quiet region recorded on July 12, 2021 (Figure 4). Again, we observe that the visibility graph approach could detect the magnetic patches conveniently.
Borders of the identified features could be determined by applying any arbitrary region-growing method. Here, we apply the Downhill algorithm and label the patches based on their connectivity, i.e., summation over all nodes’ degrees within each region (Figures 3 and 4, panel c). This algorithm is basically utilized on HMI images for the recognition of photospheric features, but here, we use it on both the distribution maps and HMI images to extract the borders and evaluate the complex network’s performance, respectively.
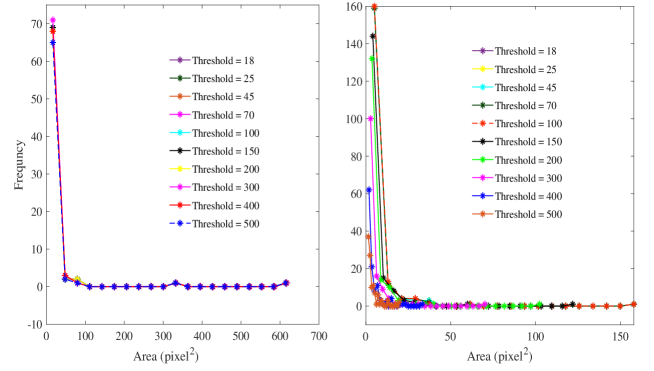
Given an initial threshold, Downhill divides the identified regions into smaller sub-regions. Figure 5 illustrates the impact of the threshold on the size of patches for two active and quiet regions, panels (a) and (b), respectively. The choice of the threshold manifests no significant effect on the patch sizes in an AR (up to 150 G). However, the threshold demonstrates a more profound influence over the quiet Sun, as higher thresholds provide less accurate determinations by neglecting small features. This could particularly affect statistical studies of magnetic patches and elaborate precautions need to be taken in this regard.
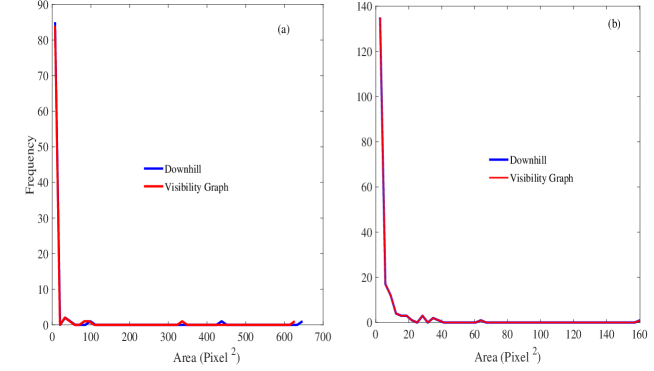
A comparison between the Downhill identification algorithm and the complex magnetic network approach is made. Figure 6 displays the frequency-size distribution of patches identified by the Downhill method applied to the network distribution maps (red line) and to the HMI images (blue line) for an AR and a quiet Sun at a given threshold. The results based on the network algorithm are well-matched with the downhill method.
The solar surface is covered by magnetic patches and the atmospheric structures/phenomena have their origins in these regions. Nonetheless, not all the patches share the same impact on this environment. Parameters such as size, lifetime, and magnetic field strength are likely to regulate the effectiveness (importance) of magnetic patches. Accordingly, in traditional algorithms, the key features were characterized based on these parameters. Alternatively, we propose the examination of magnetic connectivity. The complex network approach provides the ability to rank the magnetic patches based on their affinity (i.e., degree of nodes) and importance (i.e., PageRank) by searching for connections between opposite polarities. A technical differentiation exists between the present perspective and actual magnetic connections, i.e., field lines. However, there is a possibility of discovering commonalities between the two. Figure 7 presents the magnetic features ranked based on their overall degrees and total magnetic fields. Indeed, further investigations could provide a better understanding of this perspective and its efficiency in studies of atmospheric events.
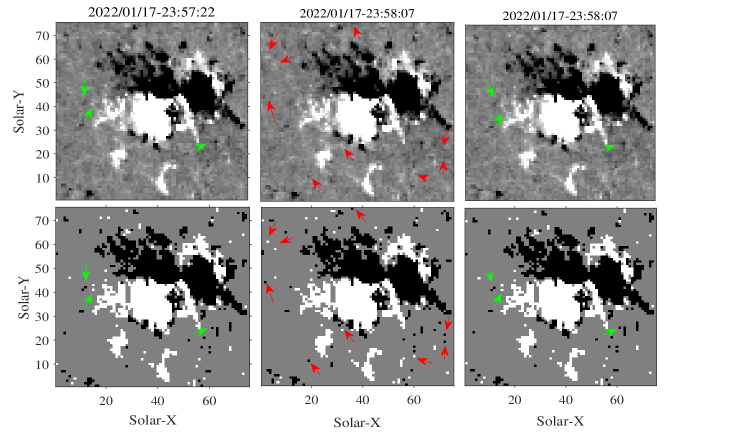
Besides comparing with Downhill, we track the identified patches in consecutive frames to evaluate the efficiency of the network approach particularly in detecting the small-scale (one or two pixels) patches. An event is most likely non-noisian if it appears in two or more successive images. Figure 8 shows an example of three consecutive HMI magnetograms with a time cadence of 45 s versus their identified patches. Out of 74 identified small-scale features detected in the middle magnetogram, 9 features are not detected in the left or right magnetograms (shown with red arrows). Performing a similar analysis on more frames gives an average of 8% false-positive error in the detection of small-scale features. Such features are either noise or concise lifetime patches that cannot be confirmed using the HMI data with 45 s cadences. Furthermore, we observe an average of 1% false-negative errors. The false-negative error indicates the failure in the identification of small-scale patches within an image which appeared in the preceding and following magnetograms. These features are primarily non-noisian events.
One might think of the complex network approach analogous to any other flux-based identification algorithm. Such a misinterpretation might be inspired by the fact that the networks are constructed based on magnetic intensities. However, the measure of the correlation between the magnetic field and the degree of each node, , suggests a clear discrepancy. Furthermore, other approaches to identification usually confront some restrictions. These limitations mainly regard the size of magnetic patches, the number of frames required to acknowledge a feature, and the choice of the intensity threshold (Hagenaar et al.,, 1999; Parnell,, 2002; Welsch and Longcope,, 2002; Qahwaji and Colak,, 2005; Caballero and Aranda,, 2014). The complex network approach successfully identifies small-scale patches (even those as small as one pixel). Yet, the optional choice of background intensity seems to play a major role in the accuracy of the identifications (Figure 2).
The dependency of the present method on the predefined threshold intrinsically differs from the previous algorithms. The susceptibility of other approaches to identification to noise and misidentifications mostly originates in the applied region-growing algorithm. On the other hand, the relatively unfavorable (noisy-like) identification of the visibility graph method at low thresholds corresponds to the small fragments of the photospheric magnetic carpet (Figures 1 d and 2). In other words, the noisy-like features might be of interest depending on the intended study and various levels of accuracy are convenient.
We performed the analysis on several other data sets and obtained that the proposed visibility-graph-based algorithm serves as an efficient and reliable means of identification for solar magnetic patches. The routine remarkably succeeds in the fast recognition of magnetic features in cutout images. As the next step, we intend to investigate the temporal evolution of the small and large solar magnetic patches via this algorithm. We aim to discern noise from tiny features and track the sunspot regions.
Data Availability: The developed MATLAB and Python packages for Identifying Solar Magnetic Patches (ISMP) are available at
https://github.com/Zahra-Tajik/ISMP.git.
Acknowledgments: The authors gratefully thank the NASA/SDO science group and the JSOC central data repository for making data publicly available. We also acknowledge the use of the YAFTA algorithm.
References
- Archontis and Syntelis, (2019) Archontis, V. and Syntelis, P. (2019). The emergence of magnetic flux and its role on the onset of solar dynamic events. Philosophical Transactions of the Royal Society A, 377(2148):20180387.
- Arish et al., (2016) Arish, S., Javaherian, M., Safari, H., and Amiri, A. (2016). Extraction of active regions and coronal holes from euv images using the unsupervised segmentation method in the bayesian framework. Solar Physics, 291(4):1209–1224.
- Barra et al., (2008) Barra, V., Delouille, V., and Hochedez, J.-F. (2008). Segmentation of extreme ultraviolet solar images via multichannel fuzzy clustering. Advances in Space Research, 42(5):917–925.
- Barra et al., (2009) Barra, V., Delouille, V., Kretzschmar, M., and Hochedez, J.-F. (2009). Fast and robust segmentation of solar euv images: algorithm and results for solar cycle 23. Astronomy & Astrophysics, 505(1):361–371.
- Bellot Rubio and Orozco Suárez, (2019) Bellot Rubio, L. and Orozco Suárez, D. (2019). Quiet sun magnetic fields: an observational view. Living Reviews in Solar Physics, 16(1):1–124.
- Benkhalil et al., (2006) Benkhalil, A., Zharkova, V., Zharkov, S., and Ipson, S. (2006). Active region detection and verification with the solar feature catalogue. Solar Physics, 235(1):87–106.
- Bo et al., (2022) Bo, J., Lei, L., Sheng, Z., Shan-shan, Y., Shu-guang, Z., Yao, H., and Xiao-yu, L. (2022). An automatic detection for solar active regions based on scale-invariant feature transform and clustering by fast search and find of density peaks. Chinese Astronomy and Astrophysics, 46(3):264–276.
- Boers et al., (2015) Boers, N., Donner, R. V., Bookhagen, B., and Kurths, J. (2015). Complex network analysis helps to identify impacts of the el niño southern oscillation on moisture divergence in south america. Climate Dynamics, 45(3):619–632.
- Brin and Page, (1998) Brin, S. and Page, L. (1998). The anatomy of a large-scale hypertextual web search engine. Computer Networks and ISDN Systems, 30(1):107–117. Proceedings of the Seventh International World Wide Web Conference.
- Caballero and Aranda, (2014) Caballero, C. and Aranda, M. (2014). Automatic tracking of active regions and detection of solar flares in solar euv images. Solar Physics, 289(5):1643–1661.
- Cheung et al., (2007) Cheung, M. C. M., Schuessler, M., and Moreno-Insertis, F. (2007). Magnetic flux emergence in granular convection: radiative mhd simulations and observational signatures. Astronomy & Astrophysics, 467(2):703–719.
- Cho et al., (2007) Cho, K.-S., Lee, J., Gary, D., Moon, Y.-J., and Park, Y. (2007). Magnetic field strength in the solar corona from type ii band splitting. The Astrophysical Journal, 665(1):799.
- Daei et al., (2017) Daei, F., Safari, H., and Dadashi, N. (2017). Complex network for solar active regions. The Astrophysical Journal, 845(1):36.
- DeForest et al., (2007) DeForest, C., Hagenaar, H., Lamb, D., Parnell, C., and Welsch, B. (2007). Solar magnetic tracking. i. software comparison and recommended practices. The Astrophysical Journal, 666(1):576.
- DeRosa and Slater, (2013) DeRosa, M. and Slater, G. (2013). Guide to sdo data analysis. Lockheed Martin Solar & Astrophysics Laboratory, Palo Alto, CA.
- Donges et al., (2009) Donges, J. F., Zou, Y., Marwan, N., and Kurths, J. (2009). Complex networks in climate dynamics. The European Physical Journal Special Topics, 174(1):157–179.
- Farhang et al., (2018) Farhang, N., Safari, H., and Wheatland, M. S. (2018). Principle of minimum energy in magnetic reconnection in a self-organized critical model for solar flares. The Astrophysical Journal, 859(1):41.
- Farhang et al., (2022) Farhang, N., Shahbazi, F., and Safari, H. (2022). Do cellular automaton avalanche models simulate the quasi-periodic pulsations of solar flares? The Astrophysical Journal, 936(1):87.
- Farhang et al., (2019) Farhang, N., Wheatland, M. S., and Safari, H. (2019). Energy balance in avalanche models for solar flares. The Astrophysical Journal Letters, 883(1):L20.
- Gheibi et al., (2017) Gheibi, A., Safari, H., and Javaherian, M. (2017). The solar flare complex network. The Astrophysical Journal, 847(2):115.
- Hagenaar et al., (1999) Hagenaar, H., Schrijver, C., Shine, R., et al. (1999). Dispersal of magnetic flux in the quiet solar photosphere. The Astrophysical Journal, 511(2):932.
- Harker, (2012) Harker, B. J. (2012). Parameter-free automatic solar active region detection by hermite function decomposition. The Astrophysical Journal Supplement Series, 203(1):7.
- Higgins et al., (2011) Higgins, P. A., Gallagher, P. T., McAteer, R. J., and Bloomfield, D. S. (2011). Solar magnetic feature detection and tracking for space weather monitoring. Advances in Space Research, 47(12):2105–2117.
- Kaki et al., (2022) Kaki, B., Farhang, N., and Safari, H. (2022). Evidence of self-organized criticality in time series by the horizontal visibility graph approach. Scientific Reports, 12.
- Kestener et al., (2010) Kestener, P., Conlon, P., Khalil, A., Fennell, L., McAteer, R., Gallagher, P., and Arneodo, A. (2010). Characterising complexity in compound systems: Segmentation in wavelet-space. Astrophysical Journal, 717:995–1005.
- Kosovichev, (2009) Kosovichev, A. (2009). Photospheric and subphotospheric dynamics of emerging magnetic flux. Space science reviews, 144(1):175–195.
- Lamb and Deforest, (2003) Lamb, D. and Deforest, C. (2003). Magnetic element tracking and the small-scale solar dynamo. In AGU Fall Meeting Abstracts, volume 2003, pages SH42B–0530.
- McAteer et al., (2005) McAteer, R., Gallagher, P. T., Ireland, J., and Young, C. A. (2005). Automated boundary-extraction and region-growing techniques applied to solar magnetograms. Solar Physics, 228(1):55–66.
- Miesch, (2005) Miesch, M. S. (2005). Large-scale dynamics of the convection zone and tachocline. Living Reviews in Solar Physics, 2(1):1–139.
- Mohammadi et al., (2021) Mohammadi, Z., Alipour, N., Safari, H., and Zamani, F. (2021). Complex network for solar protons and correlations with flares. Journal of Geophysical Research: Space Physics, 126(7):e2020JA028868.
- Murray et al., (2006) Murray, M., Hood, A., Moreno-Insertis, F., Galsgaard, K., and Archontis, V. (2006). 3d simulations identifying the effects of varying the twist and field strength of an emerging flux tube. Astronomy & Astrophysics, 460(3):909–923.
- Najafi et al., (2020) Najafi, A., Darooneh, A. H., Gheibi, A., and Farhang, N. (2020). Solar flare modified complex network. The Astrophysical Journal, 894(1):66.
- Nóbrega-Siverio et al., (2020) Nóbrega-Siverio, D., Moreno-Insertis, F., Martinez-Sykora, J., Carlsson, M., and Szydlarski, M. (2020). Nonequilibrium ionization and ambipolar diffusion in solar magnetic flux emergence processes. Astronomy & Astrophysics, 633:A66.
- Parker, (1955) Parker, E. N. (1955). Hydromagnetic dynamo models. The Astrophysical Journal, 122:293.
- Parnell, (2002) Parnell, C. (2002). Nature of the magnetic carpet–i. distribution of magnetic fluxes. Monthly Notices of the Royal Astronomical Society, 335(2):389–398.
- Pesnell et al., (2011) Pesnell, W. D., Thompson, B. J., and Chamberlin, P. (2011). The solar dynamics observatory (sdo). In The solar dynamics observatory, pages 3–15. Springer.
- Priest, (2014) Priest, E. (2014). Magnetohydrodynamics of the Sun. Cambridge University Press.
- Qahwaji and Colak, (2005) Qahwaji, R. and Colak, T. (2005). Automatic detection and verification of solar features. International Journal of Imaging Systems and Technology, 15(4):199–210.
- Quan et al., (2021) Quan, L., Xu, L., Li, L., Wang, H., and Huang, X. (2021). Solar active region detection using deep learning. Electronics, 10(18):2284.
- Scherrer et al., (2012) Scherrer, P. H., Schou, J., Bush, R., Kosovichev, A., Bogart, R., Hoeksema, J., Liu, Y., Duvall, T., Zhao, J., Schrijver, C., et al. (2012). The helioseismic and magnetic imager (hmi) investigation for the solar dynamics observatory (sdo). Solar Physics, 275(1):207–227.
- Schmieder et al., (2014) Schmieder, B., Archontis, V., and Pariat, E. (2014). Magnetic flux emergence along the solar cycle. Space Science Reviews, 186(1):227–250.
- Schou et al., (2012) Schou, J., Scherrer, P. H., Bush, R. I., Wachter, R., Couvidat, S., Rabello-Soares, M. C., Bogart, R. S., Hoeksema, J., Liu, Y., Duvall, T., et al. (2012). Design and ground calibration of the helioseismic and magnetic imager (hmi) instrument on the solar dynamics observatory (sdo). Solar Physics, 275(1):229–259.
- Sheng et al., (2020) Sheng, J., Zhu, J., Wang, Y., Wang, B., Hou, Z., et al. (2020). Identifying influential nodes of complex networks based on trust-value. Algorithms, 13(11):280.
- Shokri et al., (2022) Shokri, Z., Alipour, N., Safari, H., Kayshap, P., Podladchikova, O., Nigro, G., and Tripathi, D. (2022). Synchronization of small-scale magnetic features, blinkers, and coronal bright points. The Astrophysical Journal, 926(1):42.
- (45) Steinhaeuser, K., Chawla, N. V., and Ganguly, A. R. (2010a). Complex networks in climate science: Progress, opportunities and challenges. In CIDU, pages 16–26.
- (46) Steinhaeuser, K., Chawla, N. V., and Ganguly, A. R. (2010b). Complex networks in climate science: Progress, opportunities and challenges. In CIDU, pages 16–26.
- Taran et al., (2022) Taran, S., Khodakarami, E., and Safari, H. (2022). Complex network view to solar flare asymmetric activity. Advances in Space Research, 70(8):2541–2550.
- Tortosa-Andreu and Moreno-Insertis, (2009) Tortosa-Andreu, A. and Moreno-Insertis, F. (2009). Magnetic flux emergence into the solar photosphere and chromosphere. Astronomy & Astrophysics, 507(2):949–967.
- Verbeeck et al., (2013) Verbeeck, C., Higgins, P. A., Colak, T., Watson, F. T., Delouille, V., Mampaey, B., and Qahwaji, R. (2013). A multi-wavelength analysis of active regions and sunspots by comparison of automatic detection algorithms. Solar Physics, 283(1):67–95.
- Watson et al., (2009) Watson, F., Fletcher, L., Dalla, S., and Marshall, S. (2009). Modelling the longitudinal asymmetry in sunspot emergence: the role of the wilson depression. Solar Physics, 260(1):5–19.
- Welsch and Longcope, (2002) Welsch, B. and Longcope, D. (2002). Magnetic helicity injection by horizontal flows in the quiet sun: Ii. self helicity flux. In AGU Fall Meeting Abstracts, volume 2002, pages SH52A–0455.
- Welsch and Longcope, (2003) Welsch, B. and Longcope, D. (2003). Magnetic helicity injection by horizontal flows in the quiet sun. i. mutual-helicity flux. Astrophysical Journal - ASTROPHYS J, 588:620.
- Wiehr et al., (2004) Wiehr, E., Bovelet, B., and Hirzberger, J. (2004). Brightness and size of small-scale solar magnetic flux concentrations. Astronomy & Astrophysics, 422(3):L63–L66.
- Zhang et al., (2010) Zhang, J., Wang, Y., and Liu, Y. (2010). Statistical properties of solar active regions obtained from an automatic detection system and the computational biases. The Astrophysical Journal, 723(2):1006.
- Zharkov et al., (2005) Zharkov, S., Zharkova, V., and Ipson, S. (2005). Statistical properties of sunspots in 1996–2004: I. detection, north–south asymmetry and area distribution. Solar Physics, 228(1):377–397.
- Zwaan, (1985) Zwaan, C. (1985). The emergence of magnetic flux. Solar Physics, 100(1):397–414.