The First Direct Detection of Kirkwood Transitions in Concentrated Aqueous Electrolytes using Small Angle X-ray Scattering
Abstract
We provide a quantitative approach to describe electrolyte phenomena beyond Debye-Hückel theory. Ion-ion correlations, screening, and equilibrium bulk structure in various concentrated electrolytes are investigated using synchrotron small angle X-ray scattering (SAXS), theory, and molecular simulation. Using SAXS measurements we provide the first direct detection of the Kirkwood Transition (KT) for a variety of aqueous electrolytes (\cfNaCl, \cfCaCl2, \cfSrCl2, and \cfErCl3). The KT may be defined as the concentration above which the ion-ion correlations cease to decay exponentially with a single length scale given by the Debye length , and instead decay as a damped oscillator with two length scales: an inverse screening length reflecting the decay of the electric potential and an oscillation frequency, , that reflects the ordering in ion-ion correlations. The nonlocal electric susceptibility is also calculated which provides further insight into the spatial response to external fields. We find that the idealized definition of the KT needs to be generalized as our analyses show that the concentration dependencies of and for our 1:1, 2:1, and 3:1 electrolytes are different.
I Introduction
Understanding screening and structure in concentrated electrolytes has remained at the forefront of condensed phase statistical mechanics beginning nearly 100 years ago with the 1923 development of Debye-Hückel theory (DH)Debye and Hückel (1923). This was after Debye’s 1915 “Scattering of X-rays” paper that played a fundamental role in the development of scattering from liquidsDebye (1915). By 1927, X-ray scattering measurements by Prins and othersVon Zernike and Prins (1927); Prins (1929a, b, 1934, 1935); Prins and Fonteyne (1935) observed prepeaks in the scattered intensity of aqueous electrolytes (e.g., \ceTh(NO3)4 and \ceUO2(NO3)2) and concluded they arose from intermediate range order due to the ions and accompanying hydrating water molecules. In 1936 KirkwoodKirkwood (1936) predicted that oscillations would appear in the charge-charge spatial correlations as the concentration increased, the Kirkwood transition (KT), in contrast to the DH exponential decay. Subsequent electric potential theoriesSinger (1975); Kjellander (1995); Lee and Fisher (1997); Adar et al. (2019) to improve upon DH have been developed for finite-sized ions and yield similar KT behavior. Later, neutron scattering experiments by Enderby et al.Howe, Howells, and Enderby (1974); Neilson, Howe, and Enderby (1975) found that the position of the prepeak for aqueous \ceNiCl2 varied linearly , where is the concentration, consistent with more recent studiesGaspar et al. (2004); Ribeiro (2005); Fetisov et al. (2020a); Ramamoorthy et al. (2020). Using the Ornstein-Zernike (OZ) equation with the hypernetted chain approximation (HNC) for primitive and mean spherical ions, AttardAttard (1993), Leote De Carvalho and EvansLeote de Carvalho and Evans (1994); Evans et al. (1994), and Warren et al.Warren et al. (2013) found non-Debye screening lengths i.e., the screening lengths increasing with concentration. A phenomenon referred to as underscreening. Other Landau functional free energy theories have incorporated spatial and charge frustration into reduced models (e.g. effective field theories and lattice models) predict the emergence of rich phase behaviorTeubner and Strey (1987); Deem and Chandler (1994); Levin, Mundy, and Dawson (1992); Henderson (1992); Bazant, Storey, and Kornyshev (2011); Limmer (2015); Rotenberg, Bernard, and J-P. (2018). Krucker-Velasquez and SwanKrucker-Velasquez and Swan using Brownian Dynamics with primitive ions found non-Debye screening and oscillation frequencies consistent with the earlier electric potential approaches.
Recently, surface force apparatus (SFA) experiments by Gebbie et al.Gebbie et al. (2013), Smith and Lee et al.Smith, Lee, and Perkin (2016); Lee et al. (2017), Ducker et al.Gaddam and Ducker (2019), Han et al.Han and Espinosa-Marzal (2018), and atomic force microscopy (AFM) measurements by Hjalmarsson et al.Hjalmarsson, Atkin, and Rutland (2017), and combined SFA and AFM studies by Baimpos et al.Baimpos et al. (2014) found large effective decay lengths mostly with ionic liquids but also with aqueous LiCl, NaCl and CsCl. However, their effective decay lengths were anomalously large compared to those found from liquid state theory, simulation, and SAXS experimentsCats et al. (2021); Zeman, Kondrat, and Holm (2020); Gavish, Elad, and Yochelis (2018); Adar et al. (2019); Rotenberg, Bernard, and J-P. (2018); Fetisov et al. (2020a); Duignan et al. (2021). In the SFA and AFM studies, they compared their decay lengths, by ansatz, to the Debye screening lengths. This discrepancy in measuring and quantifying screening lengths is due to a variety of factors. The mathematical description of the SFA force curve is based on a phenomenology that includes viscous, van der Waals, electrostatic, and solvation forcesIsraelachvili and McGuiggan (1988); Evans and Wennerström (1999); Smith, Lee, and Perkin (2016); Lee et al. (2017) and exactly how these measurements are related rigorously to the statistical mechanics of the underlying ion-ion correlations have yet to be developed,Li and Kardar (1992); Aminov, Kafri, and Kardar (2015); Seyedi, Martin, and Matyushov (2019) and a rigorous treatment will involve both nonlocal and frequency responses.Parsegian and Weiss (1972); Mahanty and Ninham (1976); Parsegian (2005); Klimchitskaya, Mohideen, and Mostepanenko (2009) In fact, SAXS and SANS measurements on similar ionic liquids by Cabry et al.,Bruce et al. (2017); Cabry et al. (2022) using the same scattering distributions discussed in the present paper, do not find the anomalously large decay lengths found with SFA. To date, no other experiments or molecular simulations have confirmed anomalously large screening lengths.Coles et al. (2020); Rotenberg, Bernard, and J-P. (2018); Rotenberg, Bernard, and Hansen (2018) Furthermore, the most recent AFM measurements on a Li, Na, and Cs chloride salt solutions from 1 mM to 5 M found no anomalous increase in screening length.Kumar et al. (2022) The screening length is defined as the asymptotic decay of an ion’s electric potential due to the interactions with other ions and water molecules in the surrounding solution and measurements or calculations must be appropriately designed in order to be compared with the DH screening length.
Although both spatial and charge frustrations have similar origins, namely the competition between short- and long-range interactions, charge frustration produces unique and subtle signatures via charge correlations that are not present when considering only mass density correlations. The theoretical underpinnings of non-Debye screening and oscillation frequency arise from the strong Coulombic interactions and subsequent correlations, a clear and quantitative relationship between model systems, theory, and experimental observations has remained elusive. Currently, it is impossible to directly measure just the charge-charge correlations using scattering experiments. The relevance of charge-charge correlations to solution dielectric properties is that they take into account the spatial distribution of ions as well as the interactions between them. For example, the electrolyte non-local electric susceptibility , which depends directly upon charge-charge correlationsKjellander (2019); Hansen and McDonald (2013), describes the response of a system to external fields. Understanding and controlling the ions valences, solution concentration, and temperature allow the use of external fields to induce changes inside the electrolyte and thereby allow active control of the systems response (e.g., electrodeless electrolysis, liquid antennas, catalysis, crystallization pathways and rate, colloid interactions, transport properties, etc.)Mahdisoltani and Golestanian (2021).
The response charge density due to ion
| (1) |
where is defined through the corresponding radial distribution functions between electrolyte ions. The KT separates the isotropic liquid state into two distinct idealized regions shown in Figure 2: (1) Where the charge correlations decay exponentially (EXP) with a single length scale denoted herein via the total correlation function , where and (2) a region where two length-scales are dominant (denoted and herein via a damped oscillator (DOSC) ), where is referred to as the periodicity or spatial oscillation frequency, and is a spatial phase. Stated differently, the conceptual possibility of a KT could be arrived at starting from DH theory simply by allowing the inverse screening length in the exponential decay to become complex i.e., , and thus . In the exponential regime, , where , and the Debye length . Here is the electron charge, is the number density of the ion species, is the dielectric constant of the solvent, and is the valence charge of the ion species. Thus, at the KT two length scales arise: a screening length distinct from the Debye length , and an oscillation frequency where is the correlation length between ions.
The physical picture here is that at infinite dilution where DH theory is valid, the ions simply do not see one another and there is only a single screening length over which each ion’s electric potential exponentially decays into the surrounding water. As the number of ions is increased (and DH theory breaks down), the ions begin to interact with each other through the intervening water and their screening length is reduced. At the KT, the electric potential decays as a damped oscillator where each ion is surrounded by an alternating atmosphere with decreasing amplitudes of positive and negative charges and the screening length increases. In this way, as a dilute electrolyte becomes more concentrated, the screening length drops from infinity to a minimum and then starts to gradually increase again while the alternating ion atmosphere extends further out into the electrolyte.
In Small Angle X-ray Scattering (SAXS) the total scattering is due to the sum of all pair correlations (e.g. including those with water) weighted by their atomic X-ray scattering factors. As a result, the individual charge-charge correlations, that are of most interest here, interfere with other pair correlations. Using the theoretical connection with the SAXS signal one can then access the charge correlations to make quantitative comparisons between screening lengths and periodicity as a function of ionic strength and electrolyte type. Indeed, this approach was undertaken in a recent study where we quantified the origin of the observed prepreaks in 2:1 electrolytes as a function of concentrationFetisov et al. (2020a). This study demonstrated that it is possible to obtain quantitative agreement with SAXS using a class of Kirkwood-Buff derived Force FieldsNaleem, Bentenitis, and Smith (2018) (KBFFs) that are fit to reproduce the experimentally observed concentration dependence of isothermal compressibilities, partial molar volumes, and activities. The physical picture that emerged from this study is that the prepeaks in the SAXS can encode the charge-charge correlations, and hence and , for various electrolyte solutions.
As mentioned previously, recent measurements of non-Debye screening lengths in concentrated electrolytes was investigated by Perkin et al.Lee et al. (2017); Smith, Lee, and Perkin (2016) using a Surface Force Apparatus (SFA), Ducker et al.Gaddam and Ducker (2019) using thin film interference/fluorescence microscopy (IFM), and Fetisov et al.Fetisov et al. (2020a) using SAXS. In all these measurements, in contrast to the DH screening behaviour , the screening length was found to increase with concentration typically starting at about m. This non-Debye behaviour is referred to as underscreening in the sense that the spatial extent of an ion’s influence out into the surrounding solution, as quantified by the electric potential response, is larger than . However, the SFA and IFM are anomalously large at the higher concentrations where, for example, Å and Å were found for \ceNaCl at 5 M (compared to Å. Our own mean field \ceNaCl OZ/HNC calculation Å). These experimental estimates of ion-ion correlation decay lengths assume they probe only the bulk electrolyte and hence are insensitive to the surfaces employed. The SAXS measurements used in the present investigation provide a more direct probe and statistical mechanical connection with the underlying correlations in electrolytes than provided by SFA or IFM measurements. Furthermore, SAXS yields information on both the screening length and oscillation frequency of the correlations. In our previous SAXS measurements on bulk electrolytes, supported by extensive molecular dynamics simulations, found Å for \ceCaCl_2 at 4 m (compared to Å).
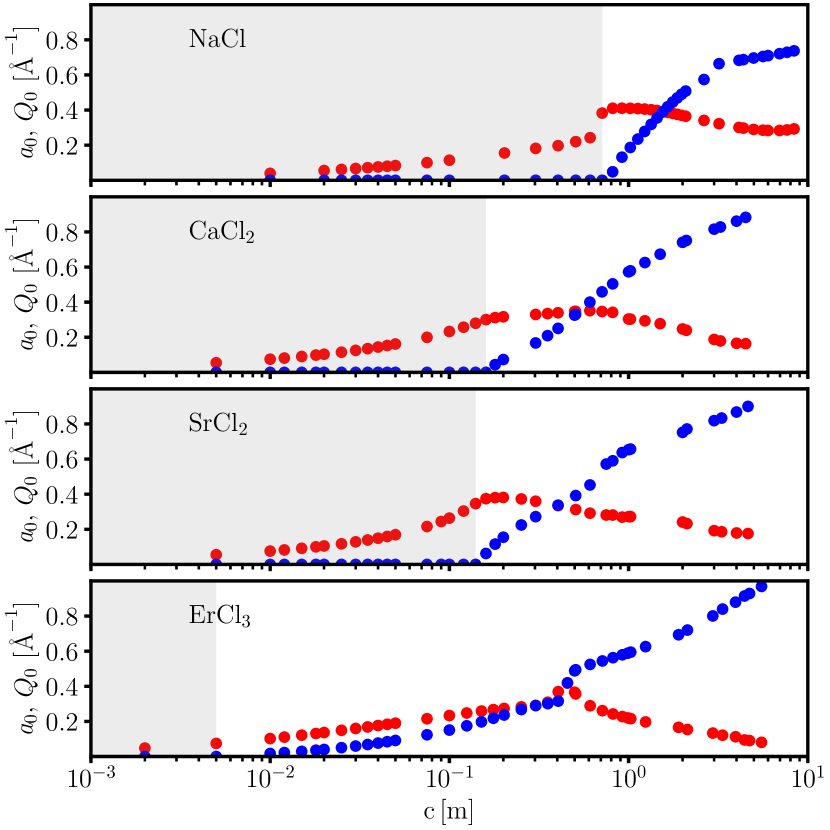
Herein, we connect the liquid state theory and molecular simulations to experimental SAXS (a.k.a. “The Grand Dilution”) for a variety of aqueous electrolytes with atomic cations of varying valence (e.g., +1, +2, and +3). Because of the long-length scale nature of non-Debye screening lengths and periodicity phenomena, reduced descriptions e.g. charged hard-spheres in a continuum dielectric and lattice models are able the capture the qualitative features of screening and periodicity as a function of concentration. A remaining challenge is to connect all-atom molecular simulations to the reduced representations. In this work, theoretical models for electrolyte solutions have been developed based on the liquid state theories using the ion-ion mean-field interactions in water, which involve accurate short- and long-range interactions and can produce quantitative agreement with all-atom molecular dynamics simulations. Figure 1 presents the the predictions of screening and periodicity (root structure) with increasing concentration and valency of electrolyte solutions including (\ceNaCl, \ceCaCl2, \ceSrCl2, and \ceErCl3) in which the inverse screening lengths and oscillation frequencies are extracted from the cation-cation asymptotic correlations. Such analyses show that the traditional KT pole structure holds reasonably well for \ceNaCl electrolyte solutions but as the valency of electrolyte solutions increases, a more complex root structure emerges and will be discussed further below. These results are supported by all-atom molecular dynamics simulations and are quantitatively consistent with our SAXS spectra.
II Results and discussion
As noted in the introduction, past theoretical approximations of the electric potentials for finite-sized ions yielded a variety of transcendental equations (TEs) that can be solved to obtain real and imaginary components: and , respectively. One of the simplest TEs, derived by KjellanderKjellander (1995) and based on an extension of the linearized Poisson-Boltzmann equation for a 1:1 electrolyte, is given by
| (2) |
where , , and is the ion diameter. We solve this numerically using the Newton-Raphson method for aqueous \ceNaCl and the results are shown in Figure 2. Kjellander’s TE, as well as several other TEs from liquid state theory (all display a similar root structure and are provided in the SI for comparison), contains several important features to aid in understanding the screening and periodicity (or oscillation frequency) behavior of aqueous electrolytes arising from the underlying ion-ion correlations as well as their departure from DH behavior. One can see in Figure 2 that the idealized KT is characterized by a Kirkwood line (KL), indicated by the vertical dashed line (green), and is predicted to be , where a cusp occurs in the concentration dependence of , and rises from zero at the KT. For reference, is included to show that a deviation exists in the screening behavior well before the KT. Figure 2 also shows the screening lengths , , and -spacing. It should also be noted that similar physical length scales appear Å and Å as the electrolyte approaches saturation as shown in Figure 2.
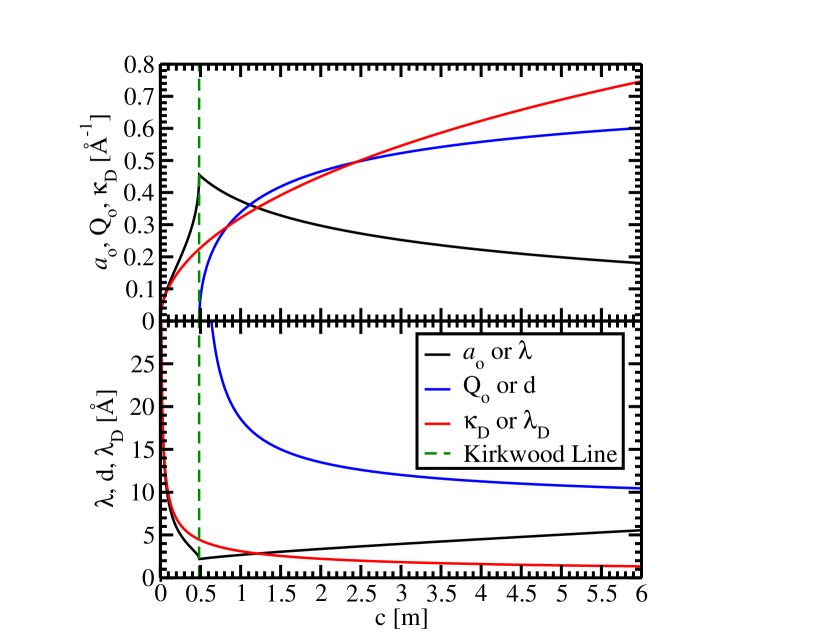
We will see from the results presented below, that this idealized behavior of and at the KL, or, said differently, how we define and characterize the KT, e.g., with a Kirkwood line, may need to be generalized to a Kirkwood region depending on the specific electrolyte.
Let’s consider how the inverse screening length and oscillation frequency of ion-ion correlations can be probed using X-ray scattering. The Fourier transform (FT) of the total correlation function is
| (3) |
where is the scattering wavevector with the structure factor given by
| (4) |
Taking the FT of the DOSC for
| (5) |
one obtains the Teubner-Strey (TS) distribution:
| (6) |
that displays a peak at , with the peak position given by
| (7) |
A Lorentzian (L) distribution peaked at is given by the limit:
| (8) |
as one may have anticipated since the FT of the EXP form for yields .
The measured X-ray intensity is related to the structure factor by
| (9) |
where
| (10) |
where is the total system number density, is the atomic fraction of species , is the X-ray form factor for species , and is the total number of atomic species in the system. X-rays scatter off an element’s electron density whose scattering power is given by the form factor defined by the Fourier transform of the electron density. Thus, elements with higher electron densities have a greater scattering power that scale as the atomic number . SAXS spectra resolve spatial correlations on the order of , which in our studies ranges from to Å-1, thus allowing us to probe spatial correlations ranging from to Å. The peak position of the TS distribution gives the spatial correlation length , and the peak full width at half maximum (FWHM) reflects the range of spatial order or spatial coherence length .
To characterize the prepeak region of the SAXS spectra for a given aqueous electrolyte, we must consider both the strength of the ion-ion correlations as well as the experimental signal contrast of these correlations against the ubiquitous water background. Given that we are interested in understanding the low- prepeak region as a function of concentration, we must choose our aqueous electrolytes judiciously. For example, in our dilution experiments aqueous sodium chloride \ceNaCl is much more difficult to characterize the prepeak region than aqueous erbium chloride \ceErCl_3. The reasons for this are twofold: (1) the scattering power of \ceNa^+ (10e) and \ceCl^- (18e) ions are not too dissimilar from \ceO (8e) atom in water, and (2) both \ceNa+ and \ceCl- ions are monovalent and thus do not yield as strong ion-ion correlations compared to the trivalent \ceEr^+3 (65e) ions. In our previous SAXS and MD studies on aqueous \ceCaCl_2 we found that the prepeak region was dominated by the \ceCa^+2-\ceCa^+2 correlations consistent with the above discussion. Thus, eventhough there are ten partials, for (e.g., for aqueous \ceErCl_3, we have \ceO, \ceH, \ceEr, and \ceCl), underlying the X-ray scattering signal, the major contribution comes from the strong cation-cation total correlation function thus justifying the use of a single TS distribution to characterize the measured SAXS prepeak which we denote simply as where the subscripts have been dropped. We note also that as ions are added to a dilute electrolyte the structure of water will also be perturbed and the \ceO-\ceO correlation function will develop a prepeak, albeit weaker, but consistent with the cation-cation prepeak evolution.
An analysis of the prepeak structure using a broad range of concentrations can be used to obtain and and then compared to the results of molecular dynamics, integral equation theory, and DH theory. Importantly, this opens the tantalizing possibility, explored presently, that the KT can be characterized by observing a transition in low-Q prepeak SAXS spectra from a TS to a L distribution in a series of dilution experiments on various electrolytes. For each concentration, we find it useful to add a linear background to the TS distribution yielding a six-parameter fit function given by . In this way, the SAXS signal provides a direct connection to the underlying ion-ion correlations, pole structure, as well as quantities derived from those correlations.
Our previous investigations on reduced representations of ion-ion interactions focused on the precise nature of short-range interactions to accurately predict collective phenomena of concentrated electrolytes.Duignan et al. (2021) In these studies, the short-range (SR) interaction is computed using quantum density functional theory (qDFT) and the long-range (LR) interaction is modeled as . These studies suggest that simple charge-frustrated interactions (e.g. point charge models in conjunction with a repulsive core) do not have the flexibility to describe SR phenomena as probed by estimates of the single ion solvation free energy and accurate X-ray absorption fine structure and X-ray absorption near-edge spectroscopy. The importance of accurate SR interactions has profound impact on our understanding of non-ideal properties of electrolytes such as clustering and pathways to nucleation of the solid polymorph.Henzler et al. (2018) The additional experimental observation of prepeaks in SAXS provide an additional constraint on the important coupling of SR interactions to LR collective phenomena. Moreover, the presence of a region within the isotropic liquid phase with two dominant length-scales, at concentrations above the KL, provide the necessary fluctuations that yield complex pathways to amorphous phases or crystal polymorphs that may be distinct from the well-characterized final crystalline phase.
II.0.1 SAXS, MD, and OZ/HNC
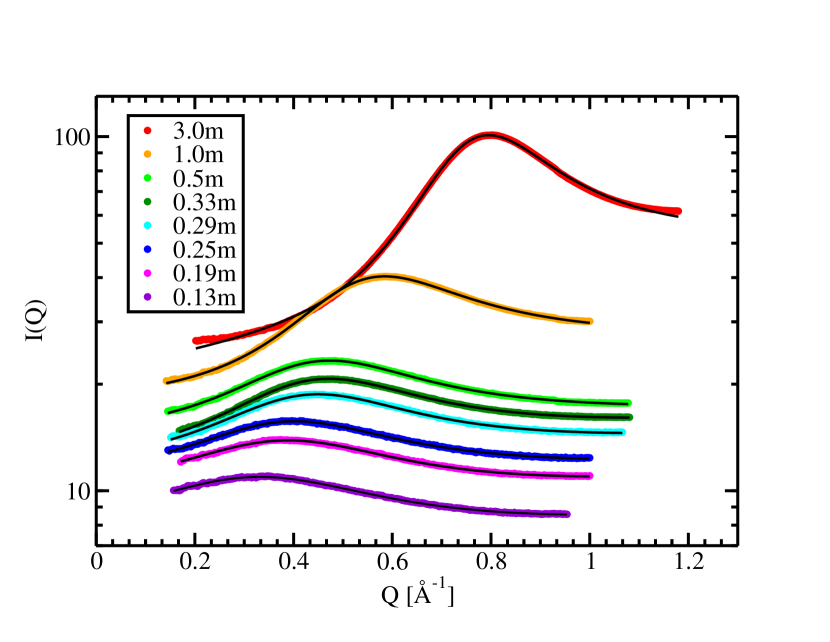
Figure 3 shows representative experimental SAXS data for the prepeaks and their fits using for aqueous \ceErCl3 for a range of concentrations. The fidelity of using a single TS distribution is validated by how accurately it reproduces the experimental spectrum. We’ll see later that a single dominant pole describing the ion-ion correlations can greatly simplify the development of reduced models. From these SAXS spectra, we obtain the following coherence lengths , where is the Full Width Half Maximum (FWHM) of the prepeak (these are quantitatively consistent with sizes deduced from the Scherrer equation), at the concentrations in Figure 3: 27.4 Å (3 m), 23.6 Å (1 m), 18.0 Å (0.5 m), 18.8 Å (0.33 m), 18.0 Å (0.29 m), 16.4 Å (0.25 m), 15.6 Å (0.19 m), 14.8 Å (0.13 m). These nanometer-sized coherence lengths increasing with concentration are consistent with the extent of the ion atmospheres discussed later.
The total correlation function can be expressed in a more convenient form, compared to the usual versus analysis, that better displays it’s asymptotic behaviour, given by
| (11) |
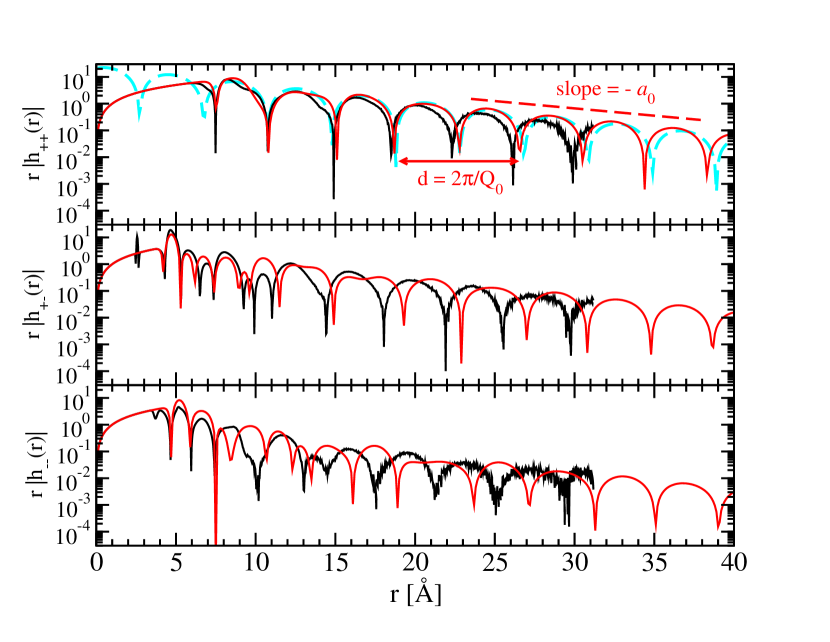
where the inverse screening lengths , oscillation frequencies , and phases can be characterized. Figure 4 compares the results of MD and OZ/HNC (HNC for short) for the three ion-ion partials (the details for MD and HNC are provided in the SI). Several points need to be highlighted: (1) the dominant MD Er-Er correlations are well reproduced by HNC, (2) the MD Er-Cl and Cl-Cl correlations are not as well reproduced by HNC, (3) the MD simulations become noisier at large and at low concentrations (as shown in the SI) compared to HNC, and (4) the asymptotic behaviour of the partial waves displays spatial variations not described exactly by a single pure DOCS partial wave with fixed and as seen in the and partial waves, however, they are close to the -spacing in the partial wave. A few other observations about HNC and MD are also warranted. The MD simulations are more useful at higher concentrations e.g., at m, since there are more ions and the and are more readily ascertained from the asymptotic behavior of . Unfortunately, the KT region is between m, where obtaining and becomes problematic due to lack of asymptotic convergence and instead fitting the prepeak region of is the preferred route. Our view is that running larger and longer MD simulations doesn’t really solve this issue, whereas carefully constructed HNC models can be used to obtain and from asymptotically converged correlation functions.Warren et al. (2013); Gao, Remsing, and Weeks (2023)
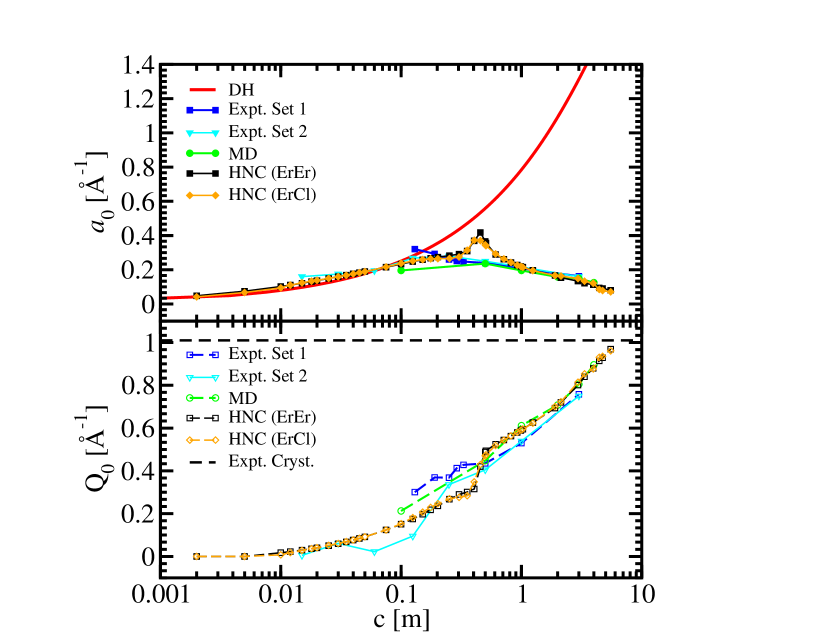
Using the \ceErCl3 SAXS data, MD simulations with all ten partials, and three partials from HNC, we extract and for a range of concentrations shown in Figure 5 by fitting to the prepeak X-ray signal generated from the underlying ten partials. The HNC long-range asymptotic DOSC form for was fit in -space to the \ceEr-\ceEr/\ceEr-\ceCl HNC total correlation functions to obtain and . The HNC calculations employ a mean field description of water where only the three ion-ion partials (, , ) are used and the infinite dilution ion-ion potentials of mean force (PMFs) were calculated from MD simulations and used as input for the HNC calculations. The and data shown in Figure 5 display a more complex behaviour than the idealized KT e.g., from Kjellander mentioned above (as well as other TEs shown in the SI). For \ceErCl3, the SAXS as well as MD results show no pronounced cusp in at m whereas the HNC results do. At low concentrations m, converges to the DH behaviour. For , as the concentration is lowered, experiment, MD, and HNC consistently show a gradual approach to zero instead of the idealized KT behaviour of dropping to zero where the cusp in occurs. At the highest concentration near saturation, converges to that for the experimental first Bragg peak of the crystalline \ceErCl3 hexahydrateIvanov (1969). These non-ideal KT \ceErCl3 results can perhaps be understood by considering that \ceEr+3-\ceEr+3 correlations are very strong (large Coulomb coupling) and hence oscillations persist to much lower concentrationsSmirnov and Grechin (2013); Soderholm, Skanthakumar, and Wilson (2009). Furthermore, this means that oscillations persist even though the peak in , minimum in screening length , has already occurred as the concentration is decreased. Again, one cannot generally assume that exponential to damped oscillatory decay occurs at the KT but instead the concentration dependence of and must be considered independently.
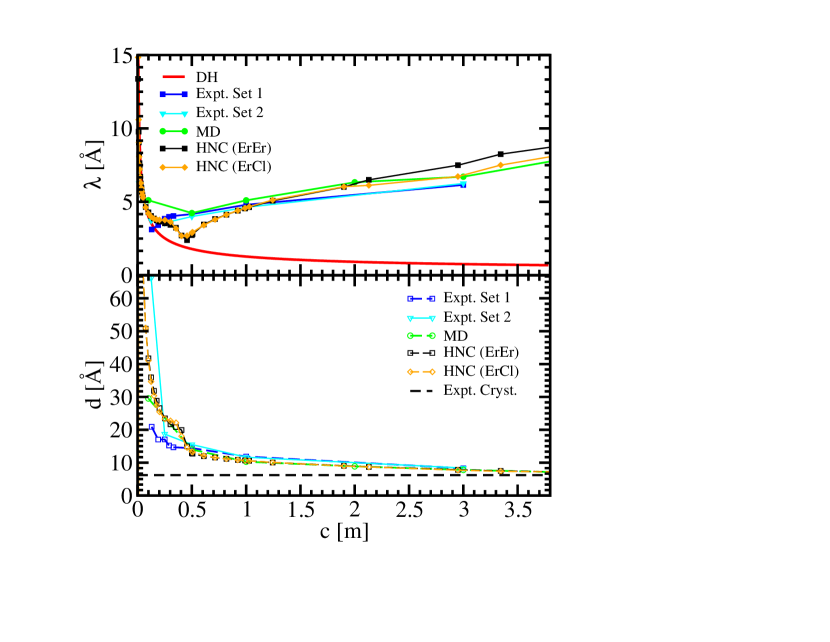
For convenience, Figure 6 shows the -space screening lengths and -spacings corresponding to the data in Figure 5. These comparisons show excellent agreement between the measured SAXS data and those from MD and HNC. These results represent the first joint experimental and molecular theory verification and validation of the non-Debye screening lengths and periodicities in concentrated aqueous \ceErCl3. Importantly, the HNC results are able to capture the long-range asymptotics of ion-ion correlations where direct MD loses it’s utility to yield consistent and at m.
To summarize what we have learned thus far, we find that our analysis of the asymptotic behaviour of the ion-ion correlation functions in aqueous electrolytes yields accurate quantification of screening, periodicity, as well as the interpretation, prediction, and validation of both measured SAXS spectra and theory. Interestingly, the MD results (Fig. S10) show that at relatively high ion concentrations, the values are almost consistent for the ion-ion, ion-water, and water-water correlations while at relatively low ion concentrations, the values for ion-ion correlations tend to be smaller than ones for the ion-water and water-water correlations.
A question that naturally arises is: how do the non-DH screening lengths and oscillation frequencies scale with concentration? Figure 7 shows the results of fitting the combined SAXS, MD and HNC data for and for aqueous \ceErCl3. At low concentrations, the which is similar to the DH scaling . Above the KT region, a common quantity to report is how the screening changes with concentration expressed as the ratio of screening lengths , where is the scaling exponent. Our results give i.e., quasi-cubic scaling, yielding . Previous SFA measurements by Perkin et al. found .Smith, Lee, and Perkin (2016); Lee et al. (2017) In contrast, using a charge-frustrated Ising model, Ludwig et al. finds .Ludwig et al. (2018) Rotenberg et al., using MD simulations of atomic and molecular ions, find a scaling range to .Rotenberg, Bernard, and Hansen (2018); Rotenberg, Bernard, and J-P. (2018) For , we also find , equivalent to the quasi-cubic scaling found in our previous work on \ceCaCl2Fetisov et al. (2020b) as well as that found in several other studies on aqueous electrolytes.
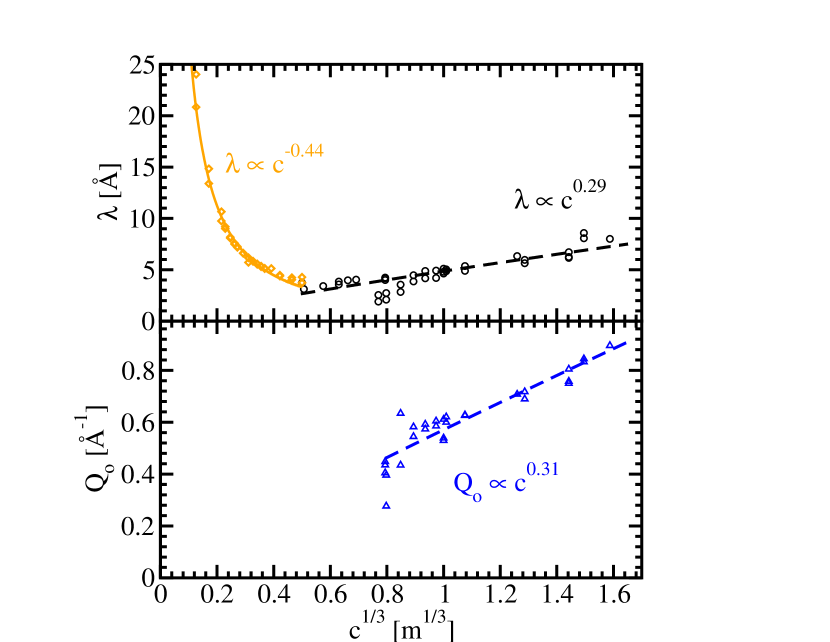
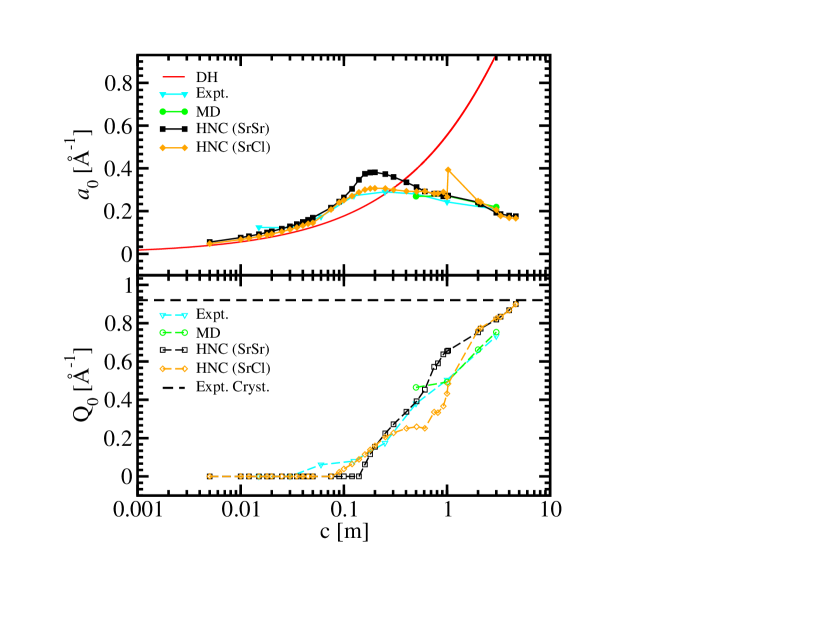
Figure 8 shows our and results for aqueous \ceSrCl2. They are similar to \ceErCl3 but with the important difference due to the reduced Coulomb coupling in the lower valence \ceSr+2-\ceSr+2 correlations. In this case, the more standard KT behaviour is seen where falls to zero around the the peak in . We find very similar behaviour for aqueous \ceCaCl2, whose results are shown in the SI. It is worth noting that the fitting of both the experimental and simulation data are extremely sensitive and as such the uncertainties associated with and values reported in the Figures can be about Å-1 depending on the concentration and the -region or -region chosen for the fitting procedure.
For aqueous \ceNaCl, we don’t find a pronounced SAXS prepeak - see SI. Instead, we find more of a broad spectral “hump” at even at m i.e., very near saturation. The MD and HNC \ceNa+-\ceNa+ correlations are smaller than the and cations. As mentioned previously, aqueous \ceNaCl is, as well as other alkali halides, notoriously difficult to extract information from the prepeak region with X-rays due to the compounding problems of low Coulomb coupling and low contrast. Calculating from the MD data doesn’t yield the measured weak SAXS “shoulder”. However, we can still obtain and from the asymptotic behavior of the \ceNa+-\ceNa+ MD and HNC correlation functions consistent with those determined from fitting the SAXS “hump” with , yielding and which seem physically reasonable within the current context.
II.0.2 Electrostatic Description of Electrolytes
Screening of ions in an aqueous electrolyte is, by definition, an electric phenomenon, however, up to this point the screening and oscillation frequency have been determined from analyzing SAXS prepeaks, MD, and HNC. Let’s consider the electric potential without the linearization and closure assumptions used in DH theory, where the response charge densities to a cation and anion are
| (12) |
The relevant differences in correlations are and ,
| (13) |
can be employed to obtain useful analytic expressions for comparison with MD and HNC. Here we compare the MD and HNC electric potentials and ion-atmospheres to analytic expressions assuming DOSC ion-ion total correlation functions where the amplitude , , and are the same but only their phases (, , or ) differ. Analyzing the electric potentials and ion atmospheres arising from the underlying ion-ion charge density correlations provides insight into the changes in electrolyte structure that give rise to the minimum in the screening length , oscillation frequency, and spatial extent. The minimum in screening length arises from the surrounding cations and anions as well as water orientations mitigating the spatial extent of the ion’s potential and atmosphere. Stillinger’s zeroth moment (a.k.a. electroneutrality condition) is given by
| (14) |
showing that at a sufficiently large distance from the central cation , the electrolyte responds by generating the opposite charge. We can investigate the spatial extent of the ion atmosphere required to achieve electroneutrality by evaluating
| (15) |
whose asymptotic behaviour is given by
| (16) |
where and are given in the SI. Using Poisson’s equation for the asymptotic behaviour of response charge density, , and the zeroth moment condition (to obtain or in Eq. 13), yields the response electric potential caused by either cation or anion ,
| (17) |
where and and 1 and 2 for cations and 2 and 3 for anions, respectively. One can see that this response electric potential does not include the ion’s self-electric potential . Thus, the total electric potential is . If we take the limit
| (18) |
and add the ion’s self-potential, one recovers the DH limit (where the ion size is small compared with ) for the total electric potential
| (19) |

Figure 9 shows , , and for aqueous \ceErCl3 at various concentrations, including where is a minimum using the HNC ion-ion correlations. The top panel shows the \ceEr+3 atmosphere charge oscillations compared to what is happening with the response and total electric potentials in the bottom panel. In the bottom panel, one can see that the response and total electric potentials differ by the inclusion of the self-electric potential of \ceEr+3, as well as the lower plateau displayed by the response potential corresponding to the \ceEr+3 radius. The analytic expressions for and derived above, using the asymptotic form for , are able to quantitatively reproduce the MD (or HNC) results as shown in the SI. For at m (blue curve), the large charge swings (e.g., -7, +5, -5, +4, -3, +3, -2, +2, -1, +1, …) above and below the electroneutrality line (dotted orange) at , do not decay to less than until . Thus, the \ceEr+3 causes the electrolyte to over-respond to the negative more than to the positive. But, the HNC charge oscillation amplitudes of are too large compared with the MD results by about as shown in the SI. We note that the MD results suffer from asymptotic convergence issues - see SI. The general result is that the MD ion atmosphere decays to electroneutrality at slightly shorter distances than HNC. The spatial extent of the MD ion atmospheres of several nanometers is consistent with the experimental coherence lengths previously discussed. At m, where the minimum screening length Å occurs, the falls to zero most rapidly (though there are still oscillations since ) and the ion atmosphere extends to about 18 Å. At m one can see that becomes even longer ranged than at m, with Å. These results show how the long-range behavior, encoded in the and probed by SAXS, are manifested in the underlying electric potentials and ion atmospheres. These results show that by modestly changing the electrolyte concentration, the character and spatial extent of the ion atmospheres change dramatically.
A closely related property that can shed light on the screening behavior of electrolytes is the dielectric susceptibility. Following the dielectric response theories for bulk materials, the response charge density can be characterized by the polarization response of the bulk electrolyte, , due to an external electric field, , which is related to the electric susceptibility or dielectric constant . In linear response in -space, due to an external electric field is related to the susceptibility via , in which is a scalar function for isotropic materials and contains the spatial information about the screening behavior of electrolytes. The longitudinal non-local dielectric constant and response dielectric susceptibility are related by . This dielectric response can be obtained through the fluctuation-dissipation theorem in terms of the ion-ion structure factor via where
| (20) |
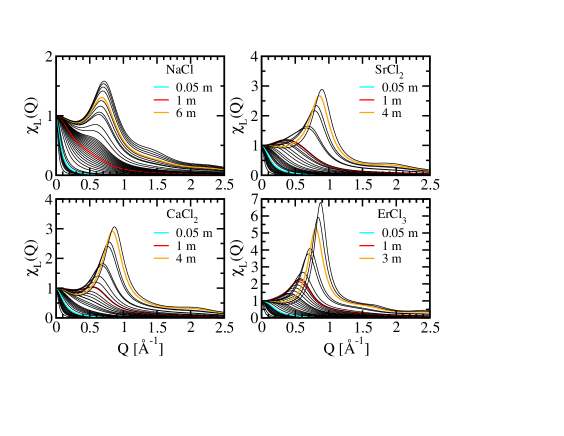
with is the ionic strength . The and concentration-dependent of the electrolytes we study are presented in Fig. 10. Such response functions, , encode variations in spatial resonance or dispersion of the electrolytes response to an external field and thus provide a means to exploit the electrolyte’s spatial response by tuning the concentration. At the highest concentrations of ErCl3, SrCl2, and CaCl2, we see a resonance peak close to Å-1 while for NaCl, the resonance peak appears about Å-1. As the concentration is lowered the evolution of the peak in is consistent with the long-range behavior discussed above. We note, however, that the HNC results for were obtained using only the mean field ion-ion partials compared to all ten partials. Thus, at low concentrations, the HNC will not converge to that for pure water which is peaked around Å-1 but note that at Å-1 the nonlocal dielectric constant of pure water drops to (a wavelength which is comparable to the Bjerrum length of a monovalent ion, Å).Bopp, Kornyshev, and Sutmann (1996) This implies that as ions are added to water a low- long-range resonance appears in the electric susceptibility and increases in intensity as it approaches saturation. On the nanometer scale, the non-local dielectric response, , arises from the behavior of ions and the interactions between them.Maggs and Everaers (2006) The field energy of a homogeneous fluid is proportional to ; therefore, at higher concentrations, we anticipate that the interactions are significantly influenced while at low concentrations such influences are less dramatic.
Similar to the analysis of from which one can extract useful information about the correlations in the electrolyte systems, one can extract important information about the general screening behavior of electrolyte solutions in terms of and at various concentrations and resolutions. Here we use a field theory approach, which is a simple way to study the behavior and properties of electrolytes at a microscopic level and involves statistical averaging of many degrees of freedom to obtain a functional describing the system.Chandler (1993); Caillol (2003); Kardar (2007) The details will be presented in future work, but generally one can extract the pole structure from as
| (21) |
with the self-energy term given by
| (22) |
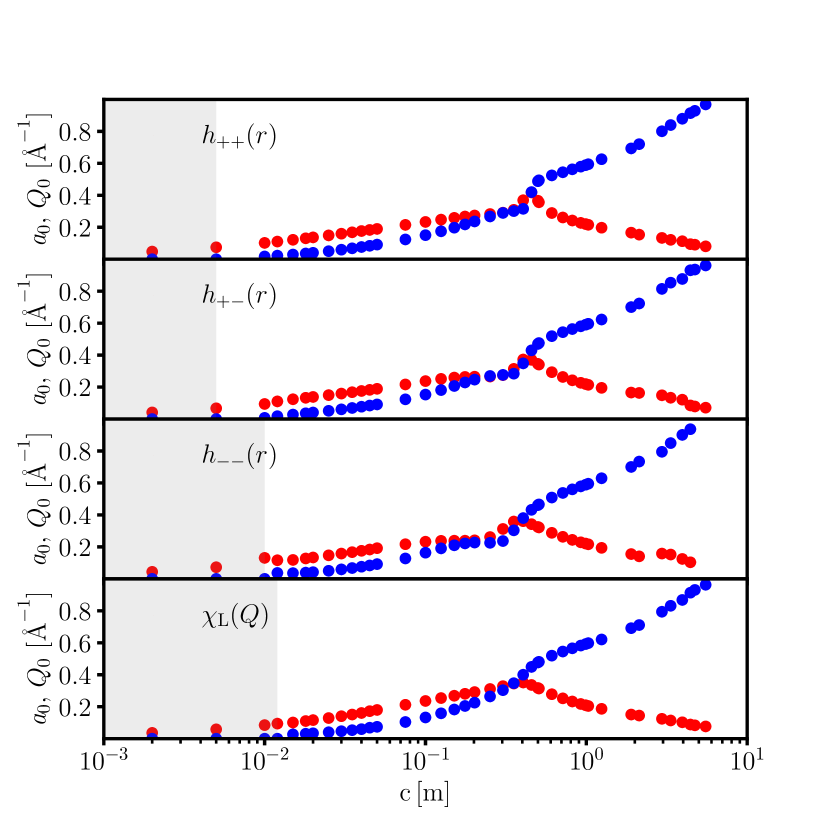
where and as the effective Debye parameter and the coefficients , and are fitting parameters. Figure 11 shows the pole structure for ErCl3 from the total correlation functions of , , and as well as extracted from Eq. 21. As can be seen, they are in good agreement (the pole structure comparison from such analyses will be presented in future work). Therefore, the response functions, , have the same single pole structure as that found from the asymptotic behavior of , and , as well as the measured . Interestingly, the behaviors of can also be captured with TS distributions once the -region for the analysis is chosen carefully as discussed in the SI. Equation 21, however, can accurately represent the behavior of for the studied electrolytes over a wider range in -space.
III Conclusion
Ion-ion correlations, screening lengths, and oscillation frequencies in various concentrated electrolyes have been investigated using synchrotron SAXS, theory, MD, and HNC. From the SAXS measurements in the low- prepeak region of the scattering spectra we are able to extract screening lengths and inverse periodicities , where is the spatial correlation length, that agree exceedingly well with the MD and HNC results. This approach allowed the Kirkwood transition to be investigated and quantified for various electrolytes. The main conclusions of this work are: (1) at low concentration the screening length converges to the Debye Hückel limit , whereas the screening lengths are appreciably larger than as the concentration is increased with a scaling , (2) that the -spacing approach the experimental crystalline Bragg spacing at concentrations near saturation, (3) we derive an analytic form for an ion’s electric potential and ion atmosphere in good agreement with the exact MD results, (4) the non-local suggests that at higher electrolyte concentrations where the cross-over decay occurs, the interactions are mediated by a spatially varying dielectric while at low concentrations the interactions are mainly screened by the bulk dielectric constant, and (5) we show that a single cation-cation pole describes the concentration dependence of , , and .
Finally, SAXS provides a direct connection to the ion-ion correlations, as well as quantities derived from those correlations, than those inferred from SFA which are based on the detection of the interaction between two planar charged surfaces.Israelachvili and McGuiggan (1988); Evans and Wennerström (1999); Liang et al. (2007) Ultimately, a single pole involving the cation-cation correlations are able to capture quantitatively the essential features of the electrolyte response as measured by SAXS. These important length scales provide a pathway to describe electrolyte phenomena beyond using the DH theory.
IV SUPPLEMENTARY INFORMATION
The experimental and computational details are presented in the supplementary information (SI).
V ACKNOWLEDGMENTS
The authors would like to thank Jan Ilavsky at the Advanced Photon Source, Argonne National Laboratory, and Jaehun Chun at the Pacific Northwest National Laboratory (PNNL) for helpful discussions. The authors were supported by the U.S. Department of Energy (DOE), Office of Science, Office of Basic Energy Sciences, Division of Chemical Sciences, Geosciences and Biosciences. PNNL is operated by Battelle for the U.S. DOE under Contract No. DE- AC05-76RL01830. Computing resources were generously allocated by PNNL’s Institutional Computing program. DOE Contract No. DE- AC02-06CH11357 supports the operation of the Advanced Photon Source at Argonne National Laboratory.
REFERENCES
References
- Debye and Hückel (1923) P. Debye and E. Hückel, “Zur theorie der elektrolyte. i. gefrierpunktserniedrigung und verwandte ercheinungen,” Physikalische Zeitschrift 24, 185–206 (1923).
- Debye (1915) P. Debye, “Zerstreuung von röontgenstrahlen,” Ann. Phys. 351, 809–823 (1915).
- Von Zernike and Prins (1927) F. Von Zernike and J. A. Prins, “Die Beugung von Röntgenstrahlen in Flüssigkeiten als Effekt der Molekülanordnung,” Z. Physik 41, 184 (1927).
- Prins (1929a) J. A. Prins, “The Diffraction of X-rays in Liquids Containing Heavy Atoms,” Nature 123, 84 (1929a).
- Prins (1929b) J. A. Prins, “X-ray Evidence for Intermolecular Forces in Liquids,” Nature 123, 908–909 (1929b).
- Prins (1934) J. A. Prins, “X-ray Diffraction In Ionic Solutions,” Physica 1, 1171–1173 (1934).
- Prins (1935) J. A. Prins, “Molecular Arrangement and X-ray Diffraction In Ionic Solutions,” J. Chem. Phys. 3, 72–80 (1935).
- Prins and Fonteyne (1935) J. A. Prins and R. Fonteyne, “X-ray Diffraction In Some Solutions,” Physica 2, 1016–1032 (1935).
- Kirkwood (1936) J. G. Kirkwood, “Statistical Mechanics of Liquid Solutions,” Chem. Rev. 19, 275–307 (1936).
- Singer (1975) K. Singer, in Statistical Mechanics: Volume 2 (The Royal Society of Chemistry, 1975) Chap. 3. Equilibrium Theory of Electrolyte Solutions by C. W. Outhwaite, pp. 188–255.
- Kjellander (1995) R. Kjellander, “Modified Debye-Hückel Approximation with Effective Charges: An Application of Dressed Ion Theory for Electrolyte Solutions,” J. Phys. Chem. 99, 10392–10407 (1995).
- Lee and Fisher (1997) B. P. Lee and M. E. Fisher, “Charge oscillations in Debye-Hückel theory,” Europhys. Lett. 39, 611–616 (1997).
- Adar et al. (2019) R. M. Adar, S. A. Safran, H. Diamant, and D. Andelman, “Screening length for finite-size ions in concentrated electrolytes,” Phys. Rev. E 100, 042615 (2019).
- Howe, Howells, and Enderby (1974) R. A. Howe, W. S. Howells, and J. E. Enderby, “Ion Distribution and Long-range Order In Concentrated Electrolyte Solutions,” J. Phys. C. Solid State Phys. 7, L111–L114 (1974).
- Neilson, Howe, and Enderby (1975) G. W. Neilson, R. A. Howe, and J. E. Enderby, “The Quasi-lattice Structure In Concentrated Electrolytes,” Chem. Phys. Lett. 33, 284–285 (1975).
- Gaspar et al. (2004) A. Gaspar, M. Alves Marques, M. Cabaço, M. de Barros Marques, T. Buslaps, and V. Honkimaki, “X-Ray Diffraction Investigations of Concentrated Aqueous Solutions of Calcium Halides,” J. Mol. Liq. 110, 15–22 (2004).
- Ribeiro (2005) M. Ribeiro, “Intermediate-range Order in Aqueous Solutions of Salts: A Systematic Computer Simulation Study,” J. Phys.: Condens. Matter 17, 453–467 (2005).
- Fetisov et al. (2020a) E. O. Fetisov, C. J. Mundy, G. K. Schenter, C. J. Benmore, J. L. Fulton, and S. M. Kathmann, “Nanometer-Scale Correlations in Aqueous Salt Solutions,” J. Phys. Chem. Lett. 11, 2598–2604 (2020a).
- Ramamoorthy et al. (2020) R. K. Ramamoorthy, M. Levesque, L. Belloni, and D. Carriere, “Structure Factor of \ceEuCl3 Aqueous Solutions via Coupled Molecular Dynamics Simulations and Integral Equations,” J. Phys. Chem. B 124, 1787–1793 (2020).
- Attard (1993) P. Attard, “Asymptotic analysis of primitive model electrolytes and the electrical double layer,” Phys. Rev. E 48, 3604–3621 (1993).
- Leote de Carvalho and Evans (1994) R. J. F. Leote de Carvalho and R. Evans, “The decay of correlations in ionic fluids,” Mol. Phys. 83, 619–654 (1994).
- Evans et al. (1994) R. Evans, R. J. F. Leote de Carvalho, J. R. Henderson, and D. C. Hoyle, “Asymptotic decay of correlations in liquids and their mixtures,” J. Chem. Phys. 100, 591–603 (1994).
- Warren et al. (2013) P. B. Warren, A. Vlasov, L. Anton, and A. J. Masters, “Screening properties of Gaussian electrolyte models, with application to dissipative particle dynamics,” J. Chem. Phys. 138, 204907 (2013).
- Teubner and Strey (1987) M. Teubner and R. Strey, “Origin of the scattering peak microemulsions,” J. Chem. Phys. 87, 3195–3200 (1987).
- Deem and Chandler (1994) M. W. Deem and D. Chandler, “Charge-frustrated model of bicontinuous phases,” Phys. Rev. E 49, 4268–4275 (1994).
- Levin, Mundy, and Dawson (1992) Y. Levin, C. J. Mundy, and K. Dawson, “Renormalization of a landau-ginzburg-wilson theory of microemulsion,” Phys. Rev. A 45, 7309–7319 (1992).
- Henderson (1992) D. Henderson, in Fundamentals of Inhomogeneous Fluids (Marcel-Dekker Inc., 1992) Chap. 12. Nature of Microemulsions by K. A. Dawson and C. J. Mundy, pp. 497–549.
- Bazant, Storey, and Kornyshev (2011) M. Z. Bazant, B. D. Storey, and A. A. Kornyshev, “Double layer in ionic liquids: Overscreening versus crowding,” Phys. Rev. Lett. 106, 046102 (2011).
- Limmer (2015) D. T. Limmer, “Interfacial ordering and accompanying divergent capacitance at ionic liquid-metal interfaces,” Phys. Rev. Lett. 115, 256102 (2015).
- Rotenberg, Bernard, and J-P. (2018) B. Rotenberg, O. Bernard, and H. J-P., “Underscreening in ionic liquids: a first principles analysis,” J. Phys.: Condens. Matter 30, 054005 (2018).
- (31) E. Krucker-Velasquez and J. W. Swan, “Underscreening and hidden ion structures in large scale simulations of concentrated electrolytes,” J. Chem. Phys. , 1787–1793.
- Gebbie et al. (2013) M. S. Gebbie, M. Valtiner, X. Banquy, E. T. Fox, W. A. Henderson, and J. N. Israelachvili, “Ionic liquids behave as dilute electrolyte solutions,” Proc. Natl. Acad. Sci. U.S.A. 110, 9674–9679 (2013).
- Smith, Lee, and Perkin (2016) A. M. Smith, A. A. Lee, and S. Perkin, “The electrostatic screening length in concentrated electrolytes increases with concentration,” J. Phys. Chem. Lett. 7, 2157–2163 (2016).
- Lee et al. (2017) A. A. Lee, C. S. Perez-Martinez, A. M. Smith, and S. Perkin, “Underscreening in concentrated electrolytes,” Faraday Discuss. 199, 239–259 (2017).
- Gaddam and Ducker (2019) P. Gaddam and W. Ducker, “Electrostatic Screening Length in Concentrated Salt Solutions,” Langmuir 35, 5719–5727 (2019).
- Han and Espinosa-Marzal (2018) M. Han and R. M. Espinosa-Marzal, “Electroviscous Retardation of the Squeeze Out of Nanoconfined Ionic Liquids,” J. Phys. Chem. C 122, 21344–21355 (2018).
- Hjalmarsson, Atkin, and Rutland (2017) N. Hjalmarsson, R. Atkin, and M. W. Rutland, “Switchable long-range double layer force observed in a protic ionic liquid,” Chem. Commun. 53, 647–650 (2017).
- Baimpos et al. (2014) T. Baimpos, B. R. Shrestha, S. Raman, and M. Valtiner, “Effect of Interfacial Ion Structuring on Range and Magnitude of Electric Double Layer, Hydration, and Adhesion Interactions between Mica Surfaces in 0.05-3 M \ceLi+ and \ceCs+ Electrolyte Solutions,” Langmuir 30, 4322–4332 (2014).
- Cats et al. (2021) P. Cats, R. Evans, A. Härtel, and R. van Roij, “Primitive model electrolytes in the near and far field: Decay lengths from DFT and simulations,” J. Chem. Phys. 154, 124504 (2021).
- Zeman, Kondrat, and Holm (2020) J. Zeman, S. Kondrat, and C. Holm, “Bulk ionic screening lengths from extremely large-scale molecular dynamics simulations,” Chem. Commun. 56, 15635–15638 (2020).
- Gavish, Elad, and Yochelis (2018) N. Gavish, D. Elad, and A. Yochelis, “From Solvent-Free to Dilute Electrolytes: Essential Components for a Continuum Theory,” J. Phys. Chem. Lett. 9, 36–42 (2018).
- Duignan et al. (2021) T. T. Duignan, S. M. Kathmann, G. K. Schenter, and C. J. Mundy, “Toward a first-principles framework for predicting collective properties of electrolytes,” Acc. Chem. Res. 54, 2833–2843 (2021).
- Israelachvili and McGuiggan (1988) J. N. Israelachvili and P. M. McGuiggan, “Forces between surfaces in liquids,” Science 241, 795–800 (1988).
- Evans and Wennerström (1999) D. F. Evans and H. Wennerström, The Colloidal Domain: Where Physics, Chemistry and Biology Meet (Wiley, 1999).
- Li and Kardar (1992) H. Li and M. Kardar, “Fluctuation-induced forces between manifolds immersed in correlated fluids,” Phys. Rev. A 46, 6490–6500 (1992).
- Aminov, Kafri, and Kardar (2015) A. Aminov, Y. Kafri, and M. Kardar, “Fluctuation-induced forces in nonequilibrium diffusive dynamics,” Phys. Rev. Lett. 114, 230602 (2015).
- Seyedi, Martin, and Matyushov (2019) S. Seyedi, D. R. Martin, and D. V. Matyushov, “Screening of coulomb interactions in liquid dielectrics,” J. Condens. Matter Phys. 31, 325101 (2019).
- Parsegian and Weiss (1972) V. Parsegian and G. H. Weiss, “On van der waals interactions between macroscopic bodies having inhomogeneous dielectric susceptibilities,” J. Colloid Interface Sci. 40, 35–41 (1972).
- Mahanty and Ninham (1976) J. Mahanty and B. W. Ninham, Dispersion Forces (Academic Press, 1976).
- Parsegian (2005) V. A. Parsegian, Van Der Waals Forces A Handbook for Biologists, Chemists, Engineers, and Physicists (Cambridge University Press, 2005).
- Klimchitskaya, Mohideen, and Mostepanenko (2009) G. L. Klimchitskaya, U. Mohideen, and V. M. Mostepanenko, “The casimir force between real materials: Experiment and theory,” Rev. Mod. Phys. 81, 1827–1885 (2009).
- Bruce et al. (2017) D. W. Bruce, C. P. Cabry, J. N. Canongia Lopes, M. L. Costen, L. D’Andrea, I. Grillo, B. C. Marshall, K. G. McKendrick, T. K. Minton, S. M. Purcell, S. Rogers, J. M. Slattery, K. Shimizu, E. Smoll, and M. A. Tesa-Serrate, “Nanosegregation and structuring in the bulk and at the surface of ionic-liquid mixtures,” J. Phys. Chem. B 121, 6002–6020 (2017).
- Cabry et al. (2022) C. P. Cabry, L. D’Andrea, N. S. Elstone, S. Kirchhecker, A. Riccobono, I. Khazal, P. Li, S. E. Rogers, D. W. Bruce, and J. M. Slattery, “Small-angle neutron scattering from mixtures of long- and short-chain 3-alkyl-1-methyl imidazolium bistriflimides,” Phys. Chem. Chem. Phys. 24, 15811–15823 (2022).
- Coles et al. (2020) S. W. Coles, C. Park, R. Nikam, M. Kanduč, J. Dzubiella, and B. Rotenberg, “Correlation length in concentrated electrolytes: Insights from all-atom molecular dynamics simulations,” J. Phys. Chem. B 124, 1778–1786 (2020).
- Rotenberg, Bernard, and Hansen (2018) B. Rotenberg, O. Bernard, and J.-P. Hansen, “Underscreening in ionic liquids: a first principles analysis,” J. Phys. Condens. 30, 054005 (2018).
- Kumar et al. (2022) S. Kumar, P. Cats, M. B. Alotaibi, S. C. Ayirala, A. A. Yousef, R. van Roij, I. Siretanu, and F. Mugele, “Absence of anomalous underscreening in highly concentrated aqueous electrolytes confined between smooth silica surfaces,” J. Colloid Interface Sci. 622, 819–827 (2022).
- Kjellander (2019) R. Kjellander, “The intimate relationship between the dielectric response and the decay of intermolecular correlations and surface forces in electrolytes,” Soft Matter 15, 5866–5895 (2019).
- Hansen and McDonald (2013) J.-P. Hansen and I. R. McDonald, Theory of Simple Liquids, 4th ed. (Elsevier, Cambridge, Massachusetts, 2013).
- Mahdisoltani and Golestanian (2021) S. Mahdisoltani and R. Golestanian, “Long-range fluctuation-induced forces in driven electrolytes,” Phys. Rev. Lett. 126, 158002 (2021).
- Naleem, Bentenitis, and Smith (2018) N. Naleem, N. Bentenitis, and P. E. Smith, “A Kirkwood-Buff Derived Force Field for Alkaline Earth Halide Salts,” J. Chem. Phys. 148, 222828 (2018).
- Henzler et al. (2018) K. Henzler, E. O. Fetisov, M. Galib, M. D. Baer, B. A. Legg, C. Borca, J. M. Xto, S. Pin, J. L. Fulton, G. K. Schenter, N. Govind, J. I. Siepmann, C. J. Mundy, T. Huthwelker, and J. J. D. Yoreo, “Supersaturated calcium carbonate solutions are classical,” Sci. Adv. 4, eaao6283 (2018).
- Gao, Remsing, and Weeks (2023) A. Gao, R. C. Remsing, and J. D. Weeks, “Local molecular field theory for coulomb interactions in aqueous solutions,” J. Phys. Chem. B 127, 809–821 (2023).
- Ivanov (1969) V. I. Ivanov, Sov. Phys. - Crystallogr. 13, 786 (1969).
- Smirnov and Grechin (2013) P. R. Smirnov and O. V. Grechin, “Coordination of ions in aqueous solutions of erbium chloride from x-ray diffraction data,” Russ. J. Coord. Chem. 39, 685–688 (2013).
- Soderholm, Skanthakumar, and Wilson (2009) L. Soderholm, S. Skanthakumar, and R. E. Wilson, “Structures and energetics of erbium chloride complexes in aqueous solution,” J. Phys. Chem. A 113, 6391–6397 (2009).
- Ludwig et al. (2018) N. B. Ludwig, K. Dasbiswas, D. V. Talapin, and S. Vaikuntanathan, “Describing screening in dense ionic fluids with a charge-frustrated Ising model,” J. Chem. Phys. 149, 164505 (2018).
- Fetisov et al. (2020b) E. O. Fetisov, C. J. Mundy, G. K. Schenter, C. J. Benmore, J. L. Fulton, and S. M. Kathmann, “Nanometer-scale correlations in aqueous salt solutions,” J. Phys. Chem. Lett. 11, 2598–2604 (2020b).
- Bopp, Kornyshev, and Sutmann (1996) P. A. Bopp, A. A. Kornyshev, and G. Sutmann, “Static nonlocal dielectric function of liquid water,” Phys. Rev. Lett. 76, 1280–1283 (1996).
- Maggs and Everaers (2006) A. C. Maggs and R. Everaers, “Simulating nanoscale dielectric response,” Phys. Rev. Lett. 96, 230603 (2006).
- Chandler (1993) D. Chandler, “Gaussian field model of fluids with an application to polymeric fluids,” Phys. Rev. E 48, 2898–2905 (1993).
- Caillol (2003) J.-M. Caillol, “Statistical field theory for simple fluids: mean field and gaussian approximations,” Mol. Phys. 101, 1617–1634 (2003).
- Kardar (2007) M. Kardar, Statistical Physics of Fields (Cambridge University Press, 2007).
- Liang et al. (2007) Y. Liang, N. Hilal, P. Langston, and V. Starov, “Interaction forces between colloidal particles in liquid: Theory and experiment,” Adv. Colloid Interface Sci. 134-135, 151–166 (2007).