Practical Implementation of RIS-Aided Spectrum Sensing: A Deep Learning-Based Solution
Abstract
This paper presents reconfigurable intelligent surface (RIS)-aided deep learning (DL)-based spectrum sensing for next-generation cognitive radios. To that end, the secondary user (SU) monitors the primary transmitter (PT) signal, where the RIS plays a pivotal role in increasing the strength of the PT signal at the SU. The spectrograms of the synthesized dataset, including the 4G LTE and 5G NR signals, are mapped to images utilized for training the state-of-art object detection approaches, namely Detectron2 and YOLOv7. By conducting extensive experiments using a real RIS prototype, we demonstrate that the RIS can consistently and significantly improve the performance of the DL detectors to identify the PT signal type along with its time and frequency utilization. This study also paves the way for optimizing spectrum utilization through RIS-assisted CR application in next-generation wireless communication systems.
Index Terms:
Reconfigurable intelligent surface, spectrum sensing, smart radio environment, Detectron2, YOLOv7.I Introduction
The existing electromagnetic radio spectrum is a valuable but limited natural resource that becomes insufficient due to the increasing number of wireless devices and applications. The current under-utilization of the licensed spectrum aggravates the problem and increases the demand for innovative and unconventional practical solutions [1]. While utilizing higher frequency bands with a large amount of available bandwidths is a longer-term solution, cognitive radio (CR), which can be directly applied to the licensed spectrum, is another prominent approach to address the spectrum under-utilization problem. By exploiting spectrum sensing solutions, CR networks aim to provide reliable and fair communication for all users through dynamic spectrum access resulting in efficient and cost-effective spectrum utilization [2].
Reconfigurable intelligent surfaces (RISs) arise a key technology enabling dynamic control over the wireless propagation environment [3, 4]. A typical RIS consists of many passive reflecting elements that can be independently controlled to change the propagation characteristics of electromagnetic waves. By appropriately adjusting the phase shifts of the RIS elements, the incoming wireless signals can be conveyed towards the desired locations by facilitating a beneficial control over signal paths [5].
There has been growing interest in employing the RIS to enhance spectrum sensing capabilities and improve overall spectrum utilization by CR applications [6, 7, 8, 9, 10, 11]. In [6], the authors demonstrate that the use of RIS configurations by the primary user (PU) can improve the spectrum sensing task of the secondary user (SU) in an RIS-assisted CR network. An RIS-enhanced energy detection framework for spectrum sensing is presented in [7], where closed-form expressions for the average detection probability in the presence and absence of a direct link between the transmitter and receiver are derived. A weighted energy detection approach is proposed for the RIS-aided spectrum sensing system in the CR networks, where the RIS along with a passive beam-forming, is utilized to improve the received signal power of the SU [8]. In [9], the authors derive the detection probabilities when the RIS supports either the SU or the PU. Their results show that the RIS substantially improves the spectrum sensing performance for both cases.
There has been a growing interest in employing RISs for spectrum sensing applications, where traditional signal processing methods such as adaptive thresholding, energy detection, matched filtering, and cyclostationary feature extraction are utilized. These methods have inherent limitations such as sub-optimal performance at low received signal powers, dependency on prior signal knowledge, and high computational complexity. This paper proposes the first-ever practical implementation of RIS-empowered deep learning for spectrum sensing employing a real RIS prototype. In the proposed system, wireless communication between the primary transmitter (PT) and the SU is assumed to occur through the RIS’s reflected signals. The state-of-art object detection models, namely Detectron2 [12] and ”You Only Look Once” (YOLO)v7 [13], are trained using the spectrograms of the synthesized dataset including the fourth-generation long-term evolution (4G LTE) and fifth-generation new radio (5G NR) signals. Utilizing spectrogram images, spectrum sensing can be treated as object detection for estimating the type of the signal and its resource occupancy. Our extensive experiments employing a RIS prototype and software-defined radios (SDRs) demonstrated remarkable enhancements in the performance of DL-based detectors via RIS, enabling precise identification of PT signal type and its temporal and spectral utilization.
II System Model
Fig. 1 shows an RIS-empowered spectrum sensing system, where an RIS is employed to assist the SU in acquiring the parameters of the signal broadcasted by the PT. The communication between the PT and the PR takes place through a line-of-sight (LoS) link, assuming that the reflected signal from the RIS to the PR can be neglected compared to the LoS signal. The communication between the PT and SU occurs through a direct link and the reflected signals from the RIS. The main objective of the RIS is to maximize the received signal power by the SU through the RIS.
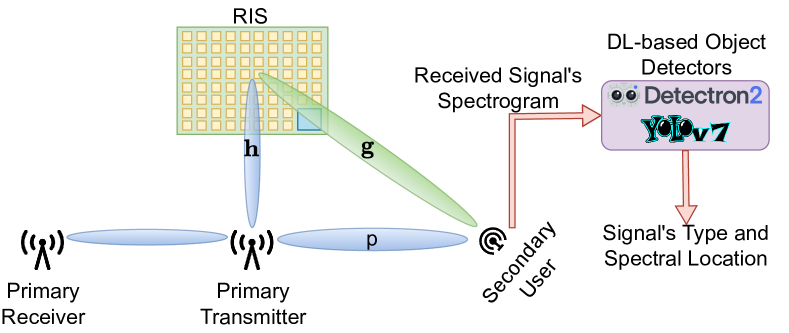
Here, we incorporate an RIS consisting of reflecting elements arranged in a uniform planar array, visually represented by yellow squares in Fig. 1. The controller represented by the blue square at the bottom right corner of the RIS is used to provide the dynamic phase adjustment for each reflecting element as or using PIN diodes. , , and represent the channels of the PT-RIS, RIS-SU, and PT-SU, respectively. Here, and are the complex baseband signals transmitted by the PT and received by the SU, respectively, while denotes the noise at the SU. The received signal, , at the SU under the hypotheses (the PT is in idle mode) and (the PT is in transmit mode) can be expressed as follows
| (1) |
where represents the phase shift configuration matrix of the RIS. and denote the magnitude response and phase shift of the th element, respectively. The value of is assumed to be constant, and can be either or since the reflecting elements of the RIS are passive and binary-phased.
III DL-based Spectrum Sensing
CR networks aim to maximize spectrum efficiency by dynamically detecting the PT’s transmission activity, including the signal type and spectral characteristics through the spectrum sensing application and utilizing the unoccupied spectrum resources for the SU. Traditional signal processing methods for spectrum sensing application includes adaptive thresholding, energy detection, matched filtering, and cyclostationary feature extraction. These methods experience inherent limitations, such as sub-optimal performance at low received signal powers, dependency on prior signal knowledge, and high computational complexity. Nevertheless, next-generation wireless networks accommodate massive machine-type communication, where narrow-band network elements will have limited signal processing and transmit power capabilities. DL-based solutions can be utilized to overcome the deficiencies of traditional spectrum sensing approaches. A set of known signal types can be detected and identified by utilizing the spectrogram of the received signals as images, where the state-of-art object detection approaches can be directly applied. As the detection performance of a spectrum sensing application ultimately depends upon the strength of the received signal, the RIS can play a pivotal role in increasing the PT signal power received by the SU.
III-A State-of-Art Object Detectors: Detectron2 and YOLOv7
In this study, we utilize two prominent DL-based object detector approaches: Detectron2 [12] and YOLOv7 [13]. Detectron2, which is developed by Facebook AI Research as an open-source library, provides a modular framework for rapid implementation and assessment of forthcoming research in the computer vision area. The object detection and segmentation methods of Detectron2 include Faster R-CNN, Mask R-CNN, TensorMask, PointRend, RetinaNet, and DensePose. YOLOv7 allows the target image to be handled as a network input and directly returns the bounding box probabilities and locations of the detected objects. It is reported in [13] that YOLOv7 outperforms in terms of the inference speed and accuracy thanks to its re-parameterization of the model network and dynamic label assignment.
III-B Training Parameters of the Detectors
The training parameters of YOLOv7111Available at: https://github.com/WongKinYiu/yolov7 and Detectron2222Available at: https://github.com/facebookresearch/detectron2 models, whose codes are publicly available, are experimentally determined for the spectrum sensing application. The transfer learning approach is employed to reduce the training effort for the spectrum sensing models of both detectors, in which the pre-trained weights are utilized as the initial weights. The Common Objects in Context (COCO) dataset is utilized to obtain these pre-trained weights. This transfer learning approach significantly reduces the number of epochs required for training the models. The pre-trained model of YOLOv71 in [13] is utilized with the batch and epoch sizes of and , respectively. For Detectron2, the mask R-CNN architecture with the pre-trained model of mask_rcnn_X_101_32x8d_FPN_3x2 in [12] is used. Additionally, Detectron2 is trained with a learning rate of , an image per batch of , a batch size per image of , and iterations with every iteration corresponding to an epoch.
III-C Signals of Interest, Dataset Representation and Generation
We consider the following three scenarios to train the detectors used for the RIS-assisted DL-based spectrum sensing application: The PT transmits (i) 4G LTE, (ii) 5G NR, and (iii) both 4G LTE and 5G NR signals simultaneously. These scenarios are generated using MATLAB’s LTE and 5G NR Toolboxes, which are compliant with the 3GPP standards. The spectrograms of the generated signals, calculated by taking a sampling rate of MHz at the center frequency of GHz and a signal duration of ms, are illustrated in Fig. 2, where each spectrogram is saved as a JPG image having pixels. Each spectrogram is processed using a Hanning window with an overlapping ratio of and an FFT size of . The rows and columns in Fig. 2 indicate the frequency and time domains of the signals, respectively. Additionally, the colormap represents the signal strength, with blue representing a low signal power and yellow representing a high signal power.


The parameters for the 4G LTE signals are chosen as frequency division duplexing and the bandwidth of MHz, whereas the parameters for the 5G NR signals are selected as the subcarrier spacing of kHz and the bandwidth of MHz. In addition, the target signal-to-noise ratio (SNR) values of dB and the target Doppler values of Hz are set for the channel conditions. For each signal transmission scenario, different signals for training and signals for testing are generated with MATLAB’s simulated channels. Therefore, there are spectrogram images to be fed to the detectors to train and spectrogram images to test the trained detectors for all three scenarios. Note that these signals are generated using the example code in Mathworks website [14]. Instead of the SNR values of dB, we utilize dB since the RIS increases the received signal power at the SU by focusing the reflected signals towards the SU. This ensures that the detectors are trained using a more suitable dataset.
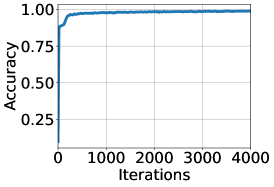
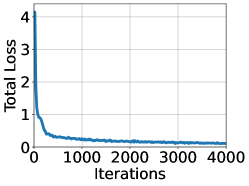
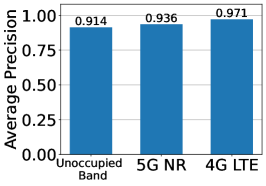
The training dataset of spectrograms is fed to Detectron2 and YOLOv7 models to train their weights. These detectors are utilized to identify the 4G LTE, 5G NR, and unoccupied bands on spectrogram images. Figs. 3(a) and 3(b) illustrate the accuracy of Detectron2 and its total loss with respect to the number of training iterations, respectively. As the number of iterations increases, the accuracy rapidly approaches towards unity while the total loss decreases towards zero. The total loss is the weighted sum of the classification, localization, and mask losses. The average precision (AP) values of the trained Detectron2 model, which are obtained by the test dataset including spectrogram images, are shown in Fig. 3(c). The AP values of the unoccupied band, 5G NR, and 4G LTE are higher than , and the highest AP of is achieved for 4G LTE. The SU can transmit its signals when there are no 5G NR and 4G LTE signals of the PT. In addition, the SU can transmit its signals using only unoccupied regions of the spectrum when there are 5G NR and 4G LTE signals.
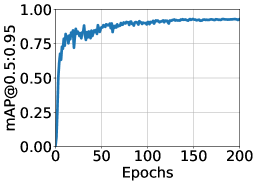


For the YOLOv7 detector’s training process, the mean AP (mAP), which is calculated at the intersection over union (IoU) from to with the step size of (mAP@0.5:0.95), is shown in Fig. 3(d). Note that the IoU measures the overlapping of predicted signal boundaries with the real signal boundaries. The objectness loss through the epochs is shown in Fig. 3(e). As the number of training epochs increases, the model precision improves while the objectness loss decreases. The AP values of the trained YOLOv7 model, which are obtained by the test dataset including spectrogram images, are shown in Fig. 3(f). The results show that YOLOv7 can detect 4G LTE and 5G NR signals more accurately, while Detectron2 can identify unoccupied bands better. Note that these trained models will be utilized in practical measurements, including the RIS, in the following section. The test results indicate that the models are successfully trained. However, it is suggested to use the results of practical measurements to compare the performance of the models.
IV Performance Analysis of the Detectors in Practical Measurement
The measurement setup of the RIS-enhanced spectrum sensing system is illustrated in Fig. 4. The experiments are conducted with ADALM-PLUTO SDR modules to realize the over-the-air transmission and reception by the PT and SU, respectively. The PT and SU are located to ensure that their horn antenna beams remain non-intersecting, resulting in the reception of the reflected signal from the PT only through the RIS-assisted path. The Greenerwave RIS prototype [15] operating at GHz is located on the wall to boost the power of the received signals by the SU by adjusting the phase shifts of the reflecting elements. The RIS is formed in the structure of a uniform planar array with reflecting elements, but its left bottom corner of region is designated for its controller, ending up with a total of reflecting elements. Each element’s phase shift can be individually adjusted by two PIN diodes, which correspond to the horizontal and vertical polarization, as and , resulting in four different states.

Throughout the measurement process, distinct in-phase and quadrature data, including 4G LTE and 5G NR signals for three transmission scenarios, are transmitted by the PT’s SDR module. Then, the SU’s SDR module records the spectrograms of the received signals, which are processed by the DL-based spectrum sensing models, namely Detectron2 and YOLOv7, for determining the signal types and extracting their spectral characteristics. The measurements are conducted in two distinct phases: (i) the RIS is in off mode, specifying that the reflecting element phase shifts are set to , and (ii) the RIS operates in an optimized state, configuring the reflecting elements to maximize the received signal power at the SU. The RIS is optimized through the iterative algorithm in [16] by updating the phase shift configurations of the reflecting elements one by one, where the received signal power of the SU is boosted by approximately dB after iterations. Therefore, the signals monitored by the SU become more apparent in the spectrogram representation.
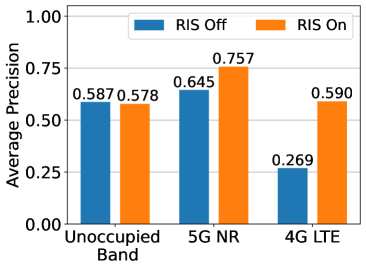
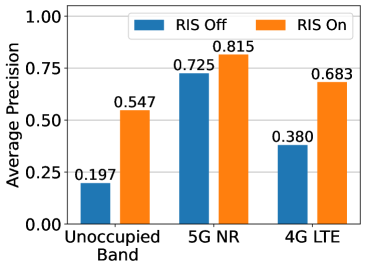
Fig. 5 demonstrates the AP results of the detectors with the collected spectrograms from over-the-air by the SU’s SDR for the two cases corresponding to the RIS being off and on. For the Detectron2, the optimized RIS configuration has the most significant impact on the 4G LTE signal by remarkably enhancing the AP from to . Additionally, the AP of the 5G NR signal is increased from to , while a slight reduction is observed for the unoccupied band. For the YOLOv7, the AP of the 4G LTE signal is raised from to , the 5G NR signal’s AP is boosted by , and the highest improvement of is obtained for the unoccupied band portion of the signal.
The performance of both detectors is improved for the signals of interest (i.e., 4G LTE and 5G NR) by introducing the RIS into the spectrum sensing system. Overall, YOLOv7 performs better than Detectron2 except for detecting the unoccupied band for both cases of RIS’s operation modes. Therefore, utilizing YOLOv7 in the spectrum sensing process for determining the activities of the PT is more reasonable, as it demonstrates superior detection performance for the signals of interest. On the other hand, employing Detectron2 in the spectrum sensing system would be proper for the SU to determine the unused bands in the spectrum and utilize them.
V Conclusion
An RIS-enhanced spectrum sensing system, where the secondary user monitors the activities of the PT with DL-based detectors, has been proposed. The state-of-art detectors, Detectron2 and YOLOv7, are utilized to estimate the signal’s parameters, including signal type and location in the spectrum. These detectors are trained using the synthesized signal dataset of 4G LTE and 5G NR. The trained detectors are tested for their performance in two practical measurement environments in which the RIS is in off mode and optimized mode to focus the reflected beam toward the SU. The extensive measurement results demonstrate that the RIS significantly improves the average precision of the detectors in the spectrum sensing task.
References
- [1] S. Haykin, D. J. Thomson, and J. H. Reed, “Spectrum sensing for cognitive radio,” Proc. of the IEEE, vol. 97, no. 5, pp. 849–877, 2009.
- [2] S. Haykin, “Cognitive radio: brain-empowered wireless communications,” IEEE J. Sel. Areas Commun., vol. 23, no. 2, pp. 201–220, 2005.
- [3] E. Basar et al., “Wireless communications through reconfigurable intelligent surfaces,” IEEE Access, pp. 116 753–116 773, Sep. 2019.
- [4] Q. Wu et al., “Intelligent reflecting surface aided wireless communications: A tutorial,” IEEE Trans. Commun., vol. 69, no. 5, 2021.
- [5] E. Basar and I. Yildirim, “Reconfigurable intelligent surfaces for future wireless networks: A channel modeling perspective,” IEEE Wireless Commun., vol. 28, no. 3, pp. 108–114, June 2021.
- [6] A. U. Makarfi et al., “Reconfigurable intelligent surfaces based cognitive radio networks,” in 2021 IEEE Wireless Commun. Netw. Conf. Works. (WCNCW). IEEE, 2021, pp. 1–6.
- [7] W. Wu et al., “IRS-enhanced energy detection for spectrum sensing in cognitive radio networks,” IEEE Wireless Commun. Lett., vol. 10, no. 10, pp. 2254–2258, 2021.
- [8] S. Lin et al., “Intelligent reflecting surface-aided spectrum sensing for cognitive radio,” IEEE Wireless Commun. Lett., vol. 11, no. 5, pp. 928–932, 2022.
- [9] A. Nasser et al., “Intelligent reflecting surfaces and spectrum sensing for cognitive radio networks,” IEEE Trans. on Cognitive Commun. and Netw., vol. 8, no. 3, pp. 1497–1511, 2022.
- [10] J. Ge et al., “RIS-enhanced spectrum sensing: How many reflecting elements are required to achieve a detection probability close to 1?” IEEE Trans. on Wireless Commun., vol. 21, no. 10, pp. 8600–8615, 2022.
- [11] W. Wu et al., “Joint sensing and transmission optimization for IRS-assisted cognitive radio networks,” IEEE Trans. on Wireless Commun., 2023.
- [12] Y. Wu et al., “Detectron2,” https://github.com/facebookresearch/detectron2, 2019 (accessed July 20, 2023).
- [13] C.-Y. Wang, A. Bochkovskiy, and H.-Y. M. Liao, “Yolov7: Trainable bag-of-freebies sets new state-of-the-art for real-time object detectors,” in Proceedings of the IEEE/CVF Conf. Comp. Vision Pattern Recog., 2023, pp. 7464–7475.
- [14] Mathworks, “Spectrum sensing with deep learning to identify 5G and LTE signals,” https://www.mathworks.com/help/comm/ug/spectrum-sensing-with-deep-learning-to-identify-5g-and-lte-signals.html, 2023.
- [15] Greenerwave, “Greenerwave 2022, 35 rue du Sentier, 75002 Paris, France,” https://greenerwave.com/, 2022 (accessed July 28, 2022).
- [16] S. Kayraklık et al., “Indoor coverage enhancement for RIS-assisted communication systems: Practical measurements and efficient grouping,” in ICC 2023-IEEE Intern. Conf. on Commun. IEEE, 2023.