Why soft contacts are stickier when breaking than when making them
Insects, pick-and-place manufacturing, engineered adhesives, and soft robots employ soft materials to stick to surfaces even in the presence of roughness. Experiments show that the force required for making contact is lower than for releasing it, a phenomenon known as the adhesion hysteresis. 1, 2 The common explanation for this hysteresis is either contact aging or viscoelasticity. 3, 4 Here, we show that adhesion hysteresis emerges even for perfectly elastic contacts and in the absence of contact aging and viscoelasticity because of surface roughness. We present a crack-perturbation model 5, 6, 7 and experimental observations that reveal discrete jumps of the contact perimeter. These stick-slip instabilities are triggered by local differences in fracture energy between roughness peaks and valleys. Pinning of the contact perimeter 8, 9, 10 retards both its advancement when coming into contact and its retraction when pulling away. Our model quantitatively reproduces the hysteresis observed in experiments and allows us to derive analytical predictions for its magnitude, accounting for realistic rough geometries across orders of magnitude in length scale 11, 12. Our results explain why adhesion hysteresis is ubiquitous and reveal why soft pads in nature and engineering are efficient in adhering even to surfaces with significant roughness.
Introduction
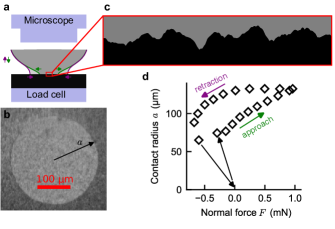
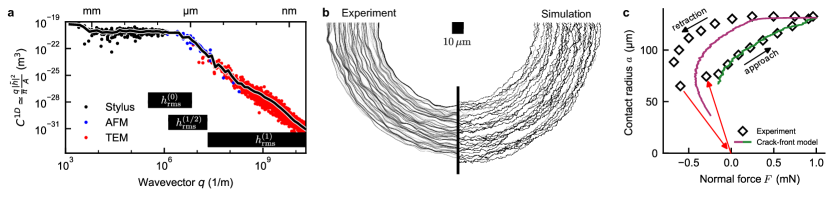
Two solids stick to each other because of attractive van-der-Waals or capillary interactions at small scales. 3 The strength of these interactions is commonly described by the intrinsic work of adhesion , the energy that is gained by these interactions per surface area of intimate contact. The work of adhesion is most commonly measured from the pull-off force of a soft spherical probe (see Fig. 1a) with radius which makes a circular contact with radius (see Fig. 1b). 13. For hard substrates, the measured apparent work of adhesion is smaller than the intrinsic value because roughness limits the area of intimate contact to the highest protrusions 14, 15. Soft solids are sticky because they can deform to come into contact over a large portion of the rough topography. The overall strength of the adhesive joint is then determined by the balance of the energy gained by making contact and the elastic energy spent for conforming to the surface. Following Persson and Tosatti 16, energy conservation implies that surface roughness reduces the apparent work of adhesion to
| (1) |
where is the elastic energy per unit contact area required to conform to the roughness (Fig. 1c). As shown in Fig. 1d, experiments typically follow different paths during approach and retraction, leading to different apparent different values for work of adhesion of adhesion for making and breaking contact, and . This adhesion hysteresis contradicts Persson and Tosatti’s balance of energy, which gives the same value for approach and retraction.
In this letter, we present and experimentally validate a theory that allows us to predict these apparent work of adhesion during approach and retraction and thereby the adhesive hysteresis. For soft spherical probes, we can describe the circular contact perimeter as a crack. The crack front is in equilibrium when Griffith’s criterion is fulfilled: 17 The energy per unit area required locally for opening the crack, , is equal to the energy released from the elastic deformation, , where is the contact area swept out by the moving crack front. A more common way of writing this equation is
| (2) |
where both the energy release rate and should be interpreted as forces per unit crack length. Johnson, Kendall and Roberts (JKR) 13 derived the expression for the energy release rate for a smooth spherical indenter, . Equation (2) then allows the evaluation of not just the pull-off force, but of all functional dependencies between rigid body displacement , contact radius and normal force during contact.
For smooth spheres, is the intrinsic work of adhesion which is uniform along the surface. In the presence of roughness, we will show below that becomes a spatially fluctuating field describing the topographic roughness. Equation (2) must then hold independently for each point on the contact perimeter.
Axissymmetric chemical heterogeneity
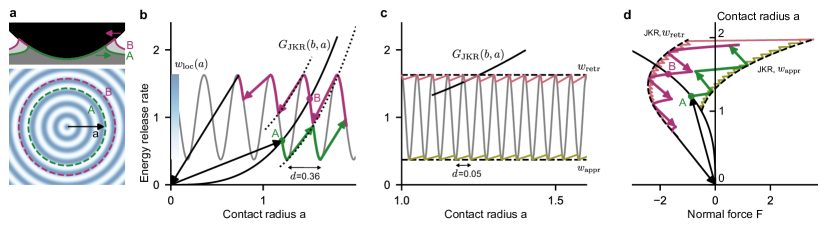
We first demonstrate the physical origin of the adhesion hysteresis using a simplified surface that has concentric rings of high and low adhesion energy, similar to the model by Guduru 20 and Kesari and Lew 21, 22. Rather than being random, varies in concentric rings of wavelength as a function of distance from the apex of the contacting sphere (Fig. 2a). Figure 2b shows alongside for a fixed displacement . Because of the spatial variations of , there are multiple solutions to Eq. (2) indicated by the labels A and B. Moving into contact from the solution denoted by A leads to an instability where the solution A disappears, at which the contact radius jumps to the next ring of . This samples the lower values of shown by the green line in Fig. 2b. Conversely, moving out of contact progresses along a different path that samples the higher values of , shown by the red line. The combination of fluctuations in and the elastic restoring force acts like a ratchet resisting the growing and shrinking of the contact area and leads to a stick-slip motion of the contact line. The line is pinned by the first strong-enough obstacle it encounters, so that it is pinned at low contact radius when the contact area grows and at high radius when it shrinks.
In the limit of roughness with small wavelength, , does not decrease significantly before the contact line arrests at the next peak (see Fig. 2c). In this limit, the contact line samples the minimum values of during approach and the maximum values during retraction. The functional relationship between , and then becomes identical to the JKR solution for smooth bodies (Suppl. Eqs. (S-4) to (S-7)), but with a work of adhesion that is decreased during approach () and increased during retraction (, see Fig. 2d). In this limit, the hysteresis becomes equal to the peak-to-peak amplitude of . 21
Random chemical heterogeneity
The next step in complexity is moving from a simplified axisymmetric surface to a surface with random variation of the local work of adhesion, where the contact line is no longer perfectly circular (see Fig. 3a). The energy release rate at a given point now depends on the whole shape of the contact , where is the length of the corresponding path along the contact circle. Based on the crack-perturbation theory by Gao and Rice 23, 7, 5, we recently derived the approximate expression 5, 6
| (3) |
where the fractional Laplacian of penalizes excursions from circularity and can be interpreted as a generalized curvature, similar to the restoring force of an elastic line. Supplementary Section S-ID derives this expression and shows that near equilibrium, where , the stiffness of the line is given by . Note that counterintuitively, the stiffness of the line does not depend on the elastic modulus of the bulk.
Numerical solution of Eqs. (2) and (3) (see Supplementary Section S-II) on a random field with lateral correlation of length yields force-area curves similar to those of our axisymmetric model (Fig. 3b,c). The key difference is that the contact line now advances and recedes in jumps (Fig. 3a) that are localized over a characteristic length , the Larkin length. 8, 24, 9, 25, 10 Between these jumps, the contact line is pinned. At the same rigid body penetration, pinning occurs at lower contact radii in approach than during retraction, leading to a hysteresis in apparent adhesion described by two JKR curves with constant apparent work of adhesion and (Fig. 3c), similar to the curves obtained from our 1D axisymmetric model (Fig. 2d).
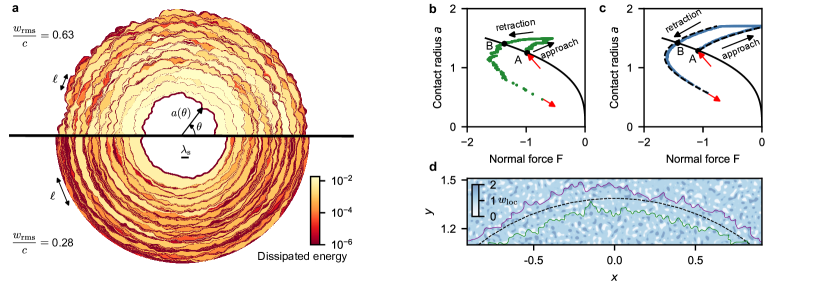
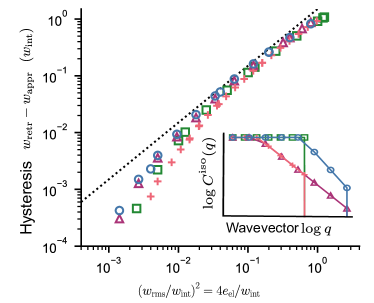
Our numerical data in Suppl. Fig. S-5 shows that the magnitude of hysteresis, , the variance of the random field . To understand this expression, we first discuss the virtual limit where the line is floppy and deviations from circularity are not penalized. Floppy lines () can freely distort and meander along valleys during approach (green line in Fig. 3d) and peaks during retraction (purple line). Because of this biased sampling of the work of adhesion along the line, the contact radius is larger during retraction than during approach. In this individual-pinning limit 26, 27, 10, each angle along the contact perimeter independently yields our 1D model and we obtain . In the opposite limit, the line is stiff and the contact remains circular (dashed line), randomly sampling as many regions of low and high adhesion. The fluctuations average out along the perimeter so that there is no hysteresis, . The contact radius is obtained from the JKR expression evaluated for the spatially averaged work of adhesion, .
Our simulations (and experiments as shown below) are in an intermediate regime, characterized by local jumps over length or pinning sites. The line is stiff over the Larkin length and hence samples a coarse-grained work of adhesion field with . From force-balance Eq. (3) we obtain that an excursion of the contact line by distance over this length leads to a restoring force , which must balance . We note that , which is the distance to the closest local stable configuration. 8, 9 The equilibrium condition then yields
| (4) |
or . This means, the magnitude of the hysteresis must scale as
| (5) |
exactly as observed in our simulations. Identical results were obtained previously for cracks in heterogeneous media. 28, 10
Topographic roughness
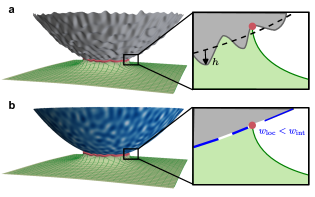
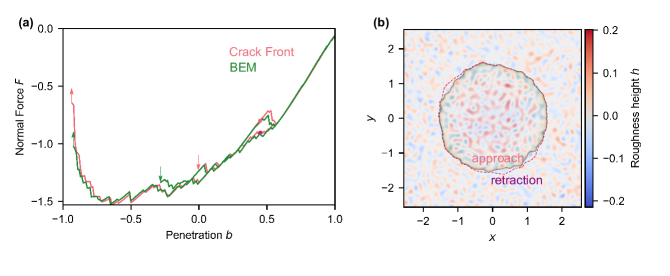
The final step in describing adhesion hysteresis on real surfaces is to relate the randomly rough topography to the spatial variations in local work of adhesion. For this we need to consider excursions of the contact line normal to the surface in additional to the lateral excursions that are described by the contact radius (see Fig. 4). First note that the solid is always dilated near the crack tip. In order to conform to a valley, the elastic solid needs to stretch even more, requiring elastic energy. Using the same arguments that lead to Eq. (1), this additional elastic energy manifests as an effectively decreased local work of adhesion. Conversely, conforming to a peak decreases the overall strain near the crack tip and releases elastic energy, leading to an increased equivalent work of adhesion. While this intuitive picture approximately describes the relationship between heights and local adhesion, the quantitative value of the local adhesion depends nonlocally on the topographic field via an integral transformation derived in Suppl. Sec. I B and C. Supplementary Section III also shows that a crack-front simulation on yields results virtually indistinguishable from an exact boundary-element calculation.
Comparison to experiments
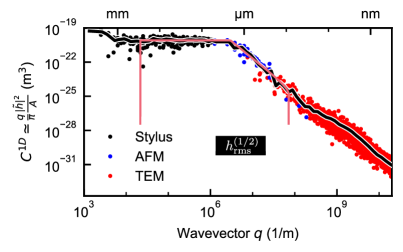
We contacted a rough nanodiamond film with a PDMS hemispherical lense while optically tracing the contact perimeter (see Methods). The nanodiamond film was characterized from atomic to macroscopic length scales using a variety of techniques, as described in Refs. 11, 12. The resulting power-spectral density (PSD) 29 comprehensively describes the topography of the film and is shown in Fig. 5a. This experiment is compared to a simulation carried out on roughness field with an identical PSD, leaving as the only free parameter that we fit to the approach curve. This yields , within the range expected for van-der-Waals interaction.
First, our experiments show the same instabilities as the simulations. The trace of the contact line in Fig. 5b shows the jerky motion of the line for both, with comparable amplitudes of deviations from the ideal contact circle. Videos of the contact area in the indentation experiment show stick-slip motion of the contact line, similar to our simulations (Suppl. Mat. SV1). The fundamental hysteresis mechanism in our model, elastic instabilities and stick-slip motion of the contact line, is clearly present in the experiment.
Second, measurements of the mean contact radius as a function of normal force also agree with our simulation results (Fig. 5c). While the intrinsic work of adhesion was adjusted such that the simulations follow the experimental data during approach, the overall functional form is JKR-like (with an effective ) and agrees between experiments and simulation. During retraction, we observe the same phenomenology: From the point of largest normal force, the sphere retracts first at constant contact radius before starting to follow a JKR-like curve with an increased work of adhesion . While simulations retract at slightly different forces, the order of magnitude of the hysteresis is correctly predicted from our simple elastic model.
Quantitative differences could come from intrinsic assumptions in our model, such as small strains, linear elastic properties, approximations made in deriving the simplified crack-front expressions, or the assumption of conforming contact. Increasing roughness increases adhesion only as long as the energy needed to fully conform the surface roughness is lower than the gain in surface energy 15, 30, 31. Many experiments that report a decrease of pull-off force with increasing roughness, as for example reported in the classic adhesion experiment by Fuller and Tabor 32, may be in this limit where only partial contact is established within the contact circle. Unlike the theory presented here for soft solids and our understanding of nonadhesive contact 15, there is presently no unifying theory that quantitatively describes adhesive contact for stiff solids. Large scale simulations with boundary-element methods are needed to better understand this intermediate regime. 33, 34, 14, 31
Analytic estimates
We now show that simple analytic estimates can be obtained from our crack-front model. The equivalent work of adhesion field has the property that its mean corresponds to the Persson-Tosatti expression, Eq. (1). Furthermore, it has local fluctuations with amplitude which determine the adhesion hysteresis, which means that the main parameter determining the hysteresis is , see Eq. (5). We carried out crack-front simulations on self-affine randomly rough topographies (Fig. 3c and Suppl. Sec. IV) with varying parameters to confirm that the work of adhesion during approach and retraction is indeed given by
| (6) |
with a numerical factor of .
The elastic energy for fully conformal contact can be written as
| (7) |
where is the elastic contact modulus 35 and is a geometric descriptor of the rough topography. In terms of the two-dimensional PSD 29 , we define
| (8) |
where is the wavevector. This expression contains the root-mean-square (rms) amplitude of the topography, , the rms gradient of the topography, , as well as arbitrary derivatives of order . The elastic energy is given by the roughness parameter , which is intermediate between rms heights and rms gradients.
For most natural and engineered surfaces, depends on the large scales, like the rms height, because their Hurst exponent 36, 37, 16, 38. Our model is then consistent with the increase in pull-off force with reported in Refs. 39, 21. We note that most measurements report insufficient details on surface roughness to allow definite conclusions on the applicability of a certain contact model. The range of length scales that dominate in our own experiments is at the transition between power-law scaling and the flat rolloff at m, a length scale that is accessible with an atomic-force microscope. We illustrate the respective scales that contribute to in Fig. 5a.
Summary & Conclusion
The work performed by a soft indenter during the approach-retraction cycle is dissipated in elastic instabilities triggered by surface roughness. The dissipated energy is the difference in energy between the pinned configurations just before and just after the instability (see Fig. 3a). This pinning of the contact line explains why adhesion is always stronger when breaking a soft contact than when making it, even in the absence of material specific dissipation. Roughness peaks increase local adhesion, which pins the contact line and increases the pull-off force. By describing rough adhesion as the pinning of an elastic line, we were able to derive parameter-free, quantitative expressions for the hysteresis in terms of a simple statistical roughness parameter. This analysis paves the way to better understanding the role of surface roughness in adhesion, and provides guidance for which scales of roughness to control in order to tune adhesion.
Methods
Rough substrate
We contacted the PDMS lens against a nanocrystalline diamond (NCD) film of known roughness. The diamond film was deposited on a silicon wafer by chemical vapor deposition and subsequently hydrogen terminated to avoid polar interactions and hydrogen bond formation between the PDMS lens and the rough substrate. The roughness of the film was determined by combining measurements from the milimeter to atomic scales using stylus profilometer, atomic force microscopy (AFM), and transmission electron microscopy (TEM). The full experimental dataset along with the averaged PSD shown in Fig. 5b are available online 40. Details on the film growth and the multiscale topography characterization are provided in Refs. 11, 12.
Synthesis of PDMS hemispheres
We synthesized PDMS hemispheres of 0.7 MPa Young’s modulus by hydrosilylation addition reaction. Vinyl-terminated PDMS V-41 (weight-averaged Molar mass ) as monomer, tetrakis-dimethylsiloxysilane as tetra-functional cross-linker and platinum carbonyl cyclo-vinyl methyl siloxane as catalyst were procured from Gelest Inc. Monomer and cross-linker were first mixed in a molar ratio of 4.4 in an aluminum pan. The catalyst was added as 0.1 weight percent of the total mixture, and finally the batch was degassed in a vacuum chamber for 5 minutes. Hemispherical lenses were cast on fluorinated glass dishes using a needle and a syringe, and cured at 60° C for three days. Since the PDMS mixture has a higher surface energy than the fluorinated surface, the drops maintain a contact angle on the surface, giving a shape of a hemispherical lens. We extracted the radius of curvature mm from a profile image of the lens. After curing reaction, the lenses were transferred to cellulose extraction thimble for Soxhlet extraction where toluene refluxes at 130° C for 48 hrs. PDMS lenses were again transferred to a fluorinated dish and dried in air for 12 h. Finally, the lenses were vacuum dried at 60° C for 16 h and then used for experiments. The radius of curvature was measured by fitting a 3-point circle to the image obtained using an optical microscope (Olympus).
We determined Young’s modulus MPa by fiting the JKR theory to an indentation experiment against a flat silicon wafer covered with octadecyltrichlorosilane (OTS). This experiment also shows that in the absence of surface roughness, the work of adhesion hysteresis is below mJ/m2, a value significantly smaller than the hysteresis measured against NCD (mJ/m2).
Indentation experiment
We measured the force and area during approach and retraction of a PDMS hemisphere against a rough diamond film using the setup of Dalvi et al. 2. The lens and the substrate were approached at a constant rate of 60 nm/s until a repulsive force of 1 mN and then retracted with the same rate. The PDMS hemisphere is transparent, allowing simultaneous measurement of the force and of the contact area, Fig. 1b. The video recording, provided in the Suppl. Mat. SV1, has a frame interval of 0.3s, but Fig. 5c shows values for the force and contact radius at intervals of s.
Extraction of contact line from video
We extracted the perimeter from each time frame of the video of the contact area. The contact area appears as a bright region in the video, and we defined the contact perimeter as a contour line of fixed level of gray. At the length scale of a few pixels, the position of the line is affected by noise on the image. To reduce the effect of noise on the position of the line, we subtracted the image of the contact area at maximum penetration and subsequently applied a spatial Gaussian filter of variance 2 pixels. The lines shown in Fig. 5b therefore only reflect the position of the perimeter on coarse scales. Supplementary Material video SV2 shows that these lines match the shape of the contact area at large scales and follows the same intermittent motion. The original video is available in the Suppl. Mat. SV1.
Acknowledgements
We thank W. Beck Andrews, Patrick Dondl, Lucas Frérot, Mathias Lebihain and Mark Robbins for insightful discussions. The work by AS and LP was funded by the Deutsche Forschungsgemeinschaft (grant EXC-2193/1 – 390951807) and the European Research Council (StG 757343). AD acknowledges funding by the National Science Foundation (DMR-2208464) and TDBJ acknowledges support from the National Institute for Occupational Safety and Health (R21 OH012126).
References
- [1] Chaudhury, M. K. & Whitesides, G. M. Direct measurement of interfacial interactions between semispherical lenses and flat sheets of poly(dimethylsiloxane) and their chemical derivatives. Langmuir 7, 1013–1025 (1991).
- [2] Dalvi, S. et al. Linking energy loss in soft adhesion to surface roughness. Proc. Natl. Acad. Sci. U.S.A. 116, 25484–25490 (2019).
- [3] Israelachvili, J. N. Intermolecular and Surface Forces (Academic Press, London, 1991).
- [4] Chen, Y. L., Helm, C. A. & Israelachvili, J. N. Molecular mechanisms associated with adhesion and contact angle hysteresis of monolayer surfaces. J. Phys. Chem. 95, 10736–10747 (1991).
- [5] Gao, H. & Rice, J. R. Nearly circular connections of elastic half spaces. J. Appl. Mech. 54, 627–634 (1987).
- [6] Sanner, A. & Pastewka, L. Crack-front model for adhesion of soft elastic spheres with chemical heterogeneity. J. Mech. Phys. Solids 160, 104781 (2022).
- [7] Rice, J. R. Weight function theory for three-dimensional elastic crack analysis. In Wei, R. & Gangloff, R. (eds.) Fracture Mechanics: Perspectives and Directions (Twentieth Symposium), 29–57 (American Society for Testing and Materials, Philadelphia, USA, 1989).
- [8] Larkin, A. I. & Ovchinnikov, Y. N. Pinning in type II superconductors. J. Low. Temp. Phys. 34, 409–428 (1979).
- [9] Robbins, M. O. & Joanny, J. F. Contact angle hysteresis on random surfaces. Europhys. Lett. 3, 729–735 (1987).
- [10] Démery, V., Rosso, A. & Ponson, L. From microstructural features to effective toughness in disordered brittle solids. Europhys. Lett. 105, 34003 (2014).
- [11] Gujrati, A., Khanal, S. R., Pastewka, L. & Jacobs, T. D. B. Combining TEM, AFM, and profilometry for quantitative topography characterization across all scales. ACS Appl. Mater. Interf. 10, 29169–29178 (2018).
- [12] Gujrati, A. et al. Comprehensive topography characterization of polycrystalline diamond coatings. Surf. Topogr. Metrol. Prop. 9, 014003 (2021).
- [13] Johnson, K. L., Kendall, K. & Roberts, A. D. Surface energy and the contact of elastic solids. Proc. R. Soc. London, Ser. A 324, 301–313 (1971).
- [14] Pastewka, L. & Robbins, M. O. Contact between rough surfaces and a criterion for macroscopic adhesion. Proc. Natl. Acad. Sci. U.S.A. 111, 3298–3303 (2014).
- [15] Persson, B. N. J., Albohr, O., Tartaglino, U., Volokitin, A. I. & Tosatti, E. On the nature of surface roughness with application to contact mechanics, sealing, rubber friction and adhesion. J. Phys.: Condens. Matter 17, R1–R62 (2004).
- [16] Persson, B. N. J. & Tosatti, E. The effect of surface roughness on the adhesion of elastic solids. J. Chem. Phys. 115, 5597–5610 (2001).
- [17] Griffith, A. A. & Taylor, G. I. VI. The phenomena of rupture and flow in solids. Philos. Trans. R. Soc. London, Ser. A 221, 163–198 (1921).
- [18] Barthel, E. Adhesive elastic contacts: JKR and more. J. Phys. D: Appl. Phys. 41, 163001 (2008).
- [19] Maugis, D. Contact, Adhesion and Rupture of Elastic Solids (Springer, Berlin; New York, 2010).
- [20] Guduru, P. R. Detachment of a rigid solid from an elastic wavy surface: Theory. J. Mech. Phys. Solids 55, 445–472 (2007).
- [21] Kesari, H., Doll, J. C., Pruitt, B. L., Cai, W. & Lew, A. J. Role of surface roughness in hysteresis during adhesive elastic contact. Philos. Mag. Lett. 90, 891–902 (2010).
- [22] Kesari, H. & Lew, A. J. Effective macroscopic adhesive contact behavior induced by small surface roughness. J. Mech. Phys. Solids 59, 2488–2510 (2011).
- [23] Rice, J. R. First-order variation in elastic fields due to variation in location of a planar crack front. J. Appl. Mech. 52, 571–579 (1985).
- [24] Imry, Y. & Ma, S.-k. Random-field instability of the ordered state of continuous symmetry. Phys. Rev. Lett. 35, 1399–1401 (1975).
- [25] Monti, J. M. & Robbins, M. O. Sliding friction of amorphous asperities on crystalline substrates: Scaling with contact radius and substrate thickness. ACS Nano 14, 16997–17003 (2020).
- [26] Joanny, J. F. & de Gennes, P. G. A model for contact angle hysteresis. J. Chem. Phys. 81, 552–562 (1984).
- [27] Patinet, S., Vandembroucq, D. & Roux, S. Quantitative prediction of effective toughness at random heterogeneous interfaces. Phys. Rev. Lett. 110, 165507 (2013).
- [28] Démery, V., Lecomte, V. & Rosso, A. The effect of disorder geometry on the critical force in disordered elastic systems. J. Stat. Mech. P03009 (2014).
- [29] Jacobs, T. D. B., Junge, T. & Pastewka, L. Quantitative characterization of surface topography using spectral analysis. Surf. Topogr. Metrol. Prop. 5, 013001 (2017).
- [30] Mulakaluri, N. & Persson, B. N. J. Adhesion between elastic solids with randomly rough surfaces: Comparison of analytical theory with molecular-dynamics simulations. Europhys. Lett. 96, 66003 (2011).
- [31] Wang, A. & Müser, M. H. Is there more than one stickiness criterion? Friction 11, 1027–1039 (2023).
- [32] Fuller, K. N. G. & Tabor, D. The effect of surface roughness on the adhesion of elastic solids. Proc. R. Soc. London, Ser. A 345, 327–342 (1975).
- [33] Medina, S. & Dini, D. A numerical model for the deterministic analysis of adhesive rough contacts down to the nano-scale. Int. J. Solids Struct. 51, 2620–2632 (2014).
- [34] Popov, V. L., Pohrt, R. & Li, Q. Strength of adhesive contacts: Influence of contact geometry and material gradients. Friction 5, 308–325 (2017).
- [35] Johnson, K. L. Contact Mechanics (Cambridge University Press, 1985).
- [36] Mandelbrot, B. B., Passoja, D. E. & Paullay, A. J. Fractal character of fracture surfaces of metals. Nature 308, 721–722 (1984).
- [37] Candela, T. et al. Roughness of fault surfaces over nine decades of length scales. J. Geophys. Res. – Sol. Ea. 117, B08409 (2012).
- [38] Persson, B. N. J. On the fractal dimension of rough surfaces. Tribol. Lett. 54, 99–106 (2014).
- [39] Briggs, G. A. D. & Briscoe, B. J. Effect of surface roughness on rolling friction and adhesion between elastic solids. Nature 260, 313–315 (1976).
- [40] Gujrati, A. et al. Nanocrystalline diamond (version 2). https://doi.org/10.57703/ce-9npwd (2023). NCD surface topography measured using TEM, AFM, and stylus profilometry.
Supplementary Material for
“Why soft contacts are stickier when breaking than when making them”
Antoine Sanner1,2,3, Nityanshu Kumar4,5, Ali Dhinojwala4, Tevis D.B. Jacobs6 and Lars Pastewka1,2
1 Department of Microsystems Engineering (IMTEK), University of Freiburg, Georges-Köhler-Allee 103, 79110 Freiburg, Germany
2 Cluster of Excellence livMatS, Freiburg Center for Interactive Materials and Bioinspired Technologies, University of Freiburg, Georges-Köhler-Allee 105, 79110 Freiburg, Germany
3 Institute for Building Materials, ETH Zurich, Zurich, 8093, Switzerland
4 School of Polymer Science and Polymer Engineering, The University of Akron, Akron, Ohio 44325, USA
5 Science & Technology Division, Corning Incorporated, Corning, NY 14831, USA
6 Department of Mechanical Engineering and Materials Science, University of Pittsburgh, 3700 O’Hara Street, Pittsburgh, Pennsylvania 15261, USA
S-I Crack-front model
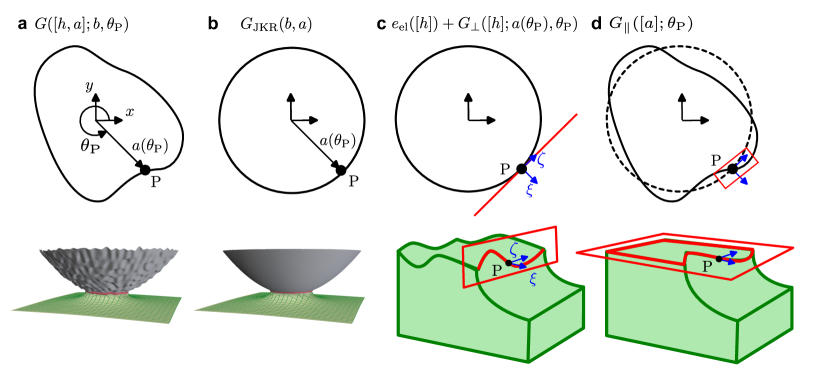
Our goal is to model the contact of a rough sphere on a deformable elastic flat (Fig. S-1a). The contact perimeter of the adhesive contact between a smooth sphere and flat can be regarded as a circular crack (Fig. S-1b). This is the basis of the Johnson, Kendall and Roberts (JKR) model for adhesion 13. JKR derived an expression for the elastic energy release rate for this spherical geometry, and balanced it with the intrinsic work of adhesion, . Here, we extend this result to rough spheres, where the crack shape deviates from circularity. Surface roughness perturbs the shape of the crack in the surface normal direction (Figs. 4 and S-1c). This perturbs the local balance of energy, leading to additional deviation of the crack shape in direction parallel to the surface (Fig. S-1d).
Figure S-1 illustrates this decomposition in terms of the energy release rate . The surface roughness locally perturbs the elastic energy by (Fig. S-1c) 1 and the perimeter distorts within the plane to satisfy equilibrium with the uniform work of adhesion (Fig. S-1d). As we show in detail in this supplementary material, we describe the effect of surface roughness by an equivalent work of adhesion field
| (S-1) |
where is the elastic energy required to fully conform to the surface roughness and the square brackets indicate a functional dependency.
The effect of the in-plane deflection on the elastic energy was derived by Gao and Rice 5 and later extended by us to spheres 6. In our simulations, the equilibrium condition
| (S-2) |
determines the contact radius with errors in the strength of the disorder. The left hand side represents the driving force to increase the contact radius that fluctuates according to the surface roughness, while the right hand side represents the elastic response of the line that only depends on the spherical geometry and the material properties. The numerical implementation follows Refs. 2, 6 and is summarized in supplementary material S-II. We validate our equations by comparing crack-front simulations to boundary element method simulations in supplementary material S-III. Equations (S-1) and (S-2) establish the equivalence between the adhesion of rough spheres and the classic problem of the pinning of an elastic-line by quenched disorder 24, 8, 9, 2, 10, 28.
S-I.1 Axisymmetric contact: The JKR model
We consider the contact of a sphere (to be exact, a paraboloid) adhering an elastic half-space at a fixed rigid body penetration (Fig. S-1a). This case can be mapped to the contact of two spheres with the same composite radius and contact modulus 35. When only one half-space deforms, , where is Young’s modulus and is Poisson’s ratio. Fracture mechanics typically considers the contact of two elastic half-spaces where . We assume the contact is frictionless and consider only vertical displacements of the half space.
The equilibrium radius and force for a perfect sphere against the axisymmetric work of adhesion heterogeneity is given by the JKR theory 13, 18, 19. JKR described the adhesion of a paraboloid with radius by superposing the displacement and the stress fields of the nonadhesive Hertzian contact 3 and the circular flat punch under tensile load 4.
The contact pressures have a tensile singularity as the distance to the edge of the contact goes to 0,
| (S-3) |
with the stress intensity factor
| (S-4) |
Here and below we use the subscript JKR to indicate the circular contact to a smooth sphere. The energy release rate depends solely on the amplitude of this singularity 5
| (S-5) |
and the equilibrium condition yields the contact radius. The normal force is given by
| (S-6) |
At equilibrium, where = , the relationship between force and contact area is given by
| (S-7) |
Once nondimensionalized using distinct vertical and lateral length units, the JKR contact is parameter free 6, 19, 7, and we present our numerical results in the nondimensional units defined in Refs. 18, 19. Specifically, lengths along the surface of the half-space (e.g., the contact radius) are normalized by , lengths in vertical direction (e.g., displacements) by and normal forces by . The equations are in dimensional form but can be nondimensionalized by substituting , and .
S-I.2 Circular contact with surface roughness: Out-of-plane perturbation of the elastic energy release rate
We now determine the energy release rate at the perimeter of the contact with a rough sphere but where the contact perimeter remains circular (Fig.S-1c). We denote the respective energy release by , where the brackets indicate a functional dependency on the height field that describes the roughness. Out-of-plane deflections of the surface of the solid make the elastic energy release rate fluctuate along the contact perimeter, and parameterizes the angle along the perimeter of the circular crack front. In the main text and in our simulations, we formally describe this perturbation of the energy release rate by the equivalent work of adhesion . In order to justify this mapping, we first discuss the true elastic energy release rate and show that the effects of the spherical geometry, surface roughness and in-plane distortion of the crack-front are decoupled.
The JKR contact is the superposition of the (adhesive) flat punch 4 and the Hertz solution 3. For the rough sphere, we now additionally superpose the stresses and displacements needed to conform to the surface roughness. We do not need to determine the whole distribution of contact stresses because the energy release rate only depends on the stress intensity factor at the contact edge via Irwin’s relation 5
| (S-8) |
where captures the effect of roughness. can be thought of as the stress intensity factor in the conforming contact of a circular flat punch with roughness at zero external load. Note that the stress intensity factors of the JKR solution and the influence of roughness can be superposed linearly, because in linear elasticity we can simply superpose stresses originating from different geometric contributions.
S-I.2.1 Stress intensity factor caused by roughness at the tip of a semi-infinite crack
We compute approximately by treating the contact as a semi-infinite crack (Fig. S-2a,b), i.e. the roughness features are small compared to the contact radius. We describe the semi-infinite crack in the coordinate system , where points in the normal to the crack front with in the contacting area. points parallel to it. This is essentially a locally rotated coordinated system at the angle on the crack, as shown in Fig. S-1c. The semi-infinite crack hence represents a small subsection of the circular perimeter centered at and .
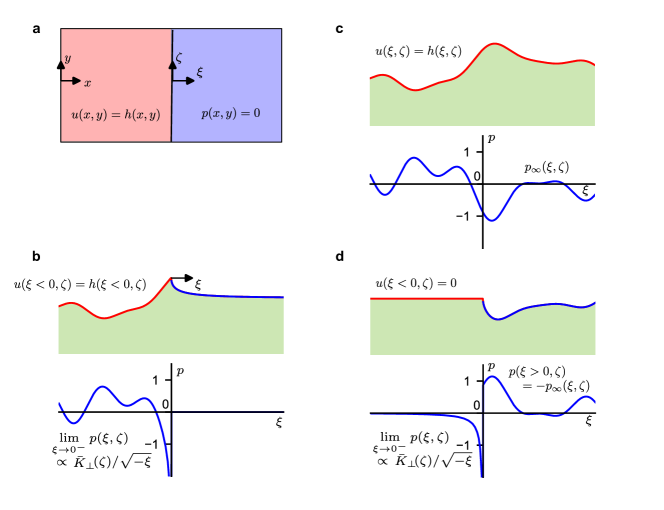
We compute the stress intensity factor by a classic superposition 8 2.6.4 Full Stress Field for Mode-I Crack in an Infinite Plate, where we first compute the pressures needed to conform the surface roughness in the absence of a crack (Fig. S-2c) and subsequently cancel out these pressures on the crack faces () (Fig. S-2d). Loading the crack-faces while keeping the displacements fixed in the contact area () leads to the stress intensity factor . The bar over indicates that the result is valid for a straight crack.
The pressures needed to conform to the surface roughness in the infinite contact are 9, 16,
| (S-9) |
where is the wavevector and the tilde denotes the Fourier transform,
| (S-10) |
The stress intensity factor at the edge of the contact results from the crack-face loading needed to cancel outside the contact area,
| (S-11) |
The quantity is the stress intensity factor at position along the tip of a crack advanced to position (Fig. S-2a). The crack-face weight function 10
| (S-12) |
is the stress intensity factor at the origin of a semi-infinite crack caused by a unit point force at . Evaluating the convolution Eq. (S-11) for each position of the crack yields a two-dimensional field of stress intensity factors, which can be most easily represented in terms of its Fourier modes,
| (S-13) |
with
| (S-14) |
Note that has zero average (because of symmetry of the elastic surface response) and that the solids overlap where the stress intensity factor is negative. Our final result has no overlap provided that . Anderson and Rice 1 derived an equation equivalent to Eq. (S-13) to understand the interaction of crack tips with dislocations.
We now detail the steps leading from Eq. (S-11) to Eq. (S-13). The pressures needed to conform to the surface roughness in the infinite contact are easier to express in Fourier space, see Eq. (S-9). Using the Heaviside step function , we now define the weight function on the whole plane as
| (S-15) |
This allows us to extend the integration bound on Eq. (S-11) to infinity. The convolution theorem then yields the simple expression
| (S-16) |
where the star is the complex conjugate. We now compute the Fourier transform of this generalized weight-function
| (S-17) |
Using that
| (S-18) |
and evaluating the step function, we get a classic Laplace transform 11 Eq. 29.3.4
| (S-19) |
Inserting Eq. (S-9) into Eq. (S-16) and using that yields Eq. (S-13).
S-I.3 Circular contact with surface roughness: Equivalence between topographic roughness and chemical heterogeneity
We now switch from the straight crack back to the contact of a sphere. The first step is to approximate the stress intensity factor by the result for the straight crack, , obtained above. This approximation requires us to rotate the straight crack to be tangential to the contact circle, i.e. to rotate it by the angle that gives the circumferential position (Fig. S-1c). Note that for isotropic random fields, this rotation becomes inconsequential and we do not carry it out for the results shown in the main text. We do carry out this rotation when comparing the crack-front results to the boundary element method, shown in Sec. S-III below. Approximating by is not strictly necessary, since integral expressions for the stress intensity factor for a circular flat punch with surface roughness exist 12, 13, 14. The advantage of the expression for the straight crack Eq. (S-13) is that it links the statistics of the chemical heterogeneity to the statistics of the surface roughness in a simple way, while the expressions for the circular contact are more difficult to evaluate and to interpret.
We now rewrite Eq. (S-8) as
| (S-20) |
The term is stochastic, as it describes the influence of surface roughness, which is typically a random field. Since is linear in , its spatial average vanishes. For a random field with a short correlation length, even partial averages over just the angle must vanish. This means the middle summand in Eq. (S-20) does not contribute to the average energy release rate. However, the variance must be positive and nonzero. Parseval’s theorem tells us that,
| (S-21) |
where is the power spectral density of the heights 29 and are the period of the system in the respective direction. Note that while we consider the limit of an infinite system size , remains finite. The variance gives the elastic energy for fully conformal contact. The average of Eq. (S-20) then becomes
| (S-22) |
This equation is equivalent to a classic result by Persson and Tosatti 16. They approximated equilibrium by . Formally, this can be described by the equilibrium of a smooth sphere with the uniform equivalent work of adhesion , where . This approximation only works in the adiabatic limit. Fluctuations become crucial when they are able to pin the crack front and trigger instabilities.
We now show how to generalize Persson and Tosatti’s result to describe local fluctuations. This means we need to consider the effect of the second term in Eq. (S-20),
| (S-23) |
that disappears in the average but represents the leading-order effect of roughness on the fluctuations of . depends on the geometry and position of the indenter via . This coupling between macroscopic boundary conditions and the microscopic disorder is a second-order effect of the roughness, which we can neglect because our final equilibrium equation determines the crack shape with first-order accuracy only. To first order in , we approximate , yielding
| (S-24) |
This first-order approximation allows us to describe the effect of surface roughness by the equivalent quenched disorder in work of adhesion
| (S-25) |
The equivalent work of adhesion Eq. (S-25) contains only the essential leading-order contributions of the roughness and is independent of the macroscopic geometry, so that our results generalizes to other adhesion setups where our approximations are valid.
Our mapping to an equivalent work of adhesion establishes a link to the pinning of elastic lines by quenched disorder. Theoretical work on the pinning of elastic lines 8, 9, 10, 28 allow us to link the hysteresis in apparent adhesion to the root-mean-square (rms) fluctuations of . Inserting Eq. (S-13) into Eq. (S-24) and (S-25) yields
| (S-26) |
The quantity is the rms half-derivative (or quarter fractional Laplacian) given by
| (S-27) |
with .
The fluctuations of are linear in the roughness amplitudes. Since our assumption of fully conformal contact requires that , is larger than the (second-order) shift in average adhesion. This strong linear perturbation of the local energy arises because the solid is stretched by a distance with at an equilibrium crack tip. In valleys, the solid needs to stretch even more, increasing the elastic energy and decreasing the equivalent adhesion, while on roughness peaks, the equivalent adhesion increases because the solid needs to stretch less than for a perfect sphere (see also Fig. 4 of the main text). The amplitude of these energy fluctuations are given by , a generalized measure of the sharpness of peaks sensitive to larger length scales than curvatures and slopes. For self-affine roughness, this parameter is dominated either by large scales like the rms height, or by small scales like slope and curvatures, depending on the Hurst exponent 16.
S-I.4 Non-circular contact: In-plane perturbation of the elastic energy release rate
Above, we discussed the effect of out-of-plane perturbation on a perfectly circular contact. In reality, the contact shape will deviate from circularity. We now compute the energy release rate at point P on a nearly circular contact to a rough sphere,
| (S-28) |
with first-order accuracy in the deviation from circularity , see Fig. S-3. Our approximation is based on Gao and Rice’s 5 first-order perturbation of the stress intensity factor at the perimeter of an initially circular external crack. Their result applies to arbitrary indenter geometries, where the stress intensity factor can vary along the perimeter 15, 12, 6, as is the case here due to surface roughness. We show that the first-order effect of the in-plane perturbation is independent of the out-of-plane geometry, so that the contact of a rough sphere is equivalent to the contact of a smooth sphere discussed in Ref. 6 using the equivalent work of adhesion heterogeneity Eq. (S-25). In Ref. 6, we only considered the case where is uniform over the contact perimeter, such as when . Here, we highlight the key changes required when is a function of .
The line elasticity emerges from the elastic coupling of the surface displacements caused by moving an initially stretched crack tip. The more the solid is stretched, the larger the elastic energy required to distort the contact line. In this section, we discuss perturbation of stress intensity factor in terms of displacements rather than pressures and introduce a displacement intensity factor 16, 17,
| (S-29) |
in order to shorten the notation. Close to the crack tip, the geometry of the solid is described by
| (S-30) |
so that corresponds to the diameter at the crack tip, see Fig. S-3b. This length gives a geometric interpretation of the energy release rate via Eq. (S-5),
| (S-31) |
At equilibrium, , so that the diameter of the crack tip , with the elastoadhesive length 18.
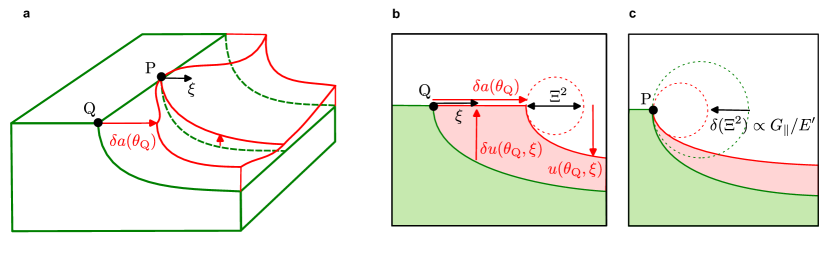
Rice explained how distorting an initially circular contact perimeter affects the energy release rate in a point P that we hold fixed, see Fig. S-3a. Making use of symmetries of the elastic potential, Rice showed that the crack-face weight-function describes how the surface of the solid moves as we distort the crack front within the plane. For the energy release rate, only the perturbation of crack-face displacements close to the crack tip matter. They are described by 5
| (S-32) |
where is the displacement intensity factor for the perfectly circular contact including roughness. The kernel of the integral was obtained from the limit of the crack-face weight-function of a circular external crack by Gao and Rice 5, 7, 19. Equations (S-31) and (S-32) combined with the results from section S-I.2 yield the energy release rate for the nearly circular contact to a rough sphere.
Equation (S-32) captures the dominating effect of the long-ranged elastic coupling of the surface displacements on the energy release rate. We illustrate this effect in Fig. S-3, where we hold fixed and advance the contact area in the neighborhood, corresponding to a locally convex perturbation of the contact perimeter (Fig. S-3a). Closing the adhesive neck over the surface element requires the displacement (Fig. S-3b), which perturbs the whole surface of the solid with amplitudes decaying with distance as . We hold the crack front locally pinned in , yet this nonlocal interaction along the crack front brings the crack faces together (Fig. S-3c) and thereby reduces the energy release rate .
We now show that within our first-order approximation, the reduction of for convex discussed in the previous paragraph is independent of the indenter geometry and stiffness, and corresponds to a generalized curvature, the half-fractional Laplacian , where is an arclength along the contact perimeter. The principal value integral in Eq. (S-32) depends on roughness, indenter geometry and indenter position via , but this coupling of the in-plane elastic response to the out-of-plane geometry is only . Near equilibrium, where
| (S-33) |
deviations of from the material property manifest in Eq. (S-32) through the second-order term . Approximating by the constant value simplifies the principal value integral to
| (S-34) |
Here, the half-fractional Laplacian of the contact radius with respect to the arclength is defined by
| (S-35) |
where are the coefficients of the Fourier series
| (S-36) |
The wavelength of a Fourier mode is . The Fourier amplitude of , , is the slope of the Fourier mode, but unlike slopes, the maxima and minima of the fractional Laplacian are in phase with maxima and minima of . Hence, can be interpreted as a generalized curvature scaling like a slope.
Equations (S-33) and (S-34) yield the first-order perturbation of the energy release rate
| (S-37) |
describing that the line penalizes deviations from circularity with a strength proportional to the equilibrium energy release rate and a generalized curvature. This means that for a fixed jump-depth , it is easier to deflect the line over a wider lateral section , , explaining why a row of several asperities can collectively pin the crack front while an individual asperity cannot 24.
S-II Numerical implementation of the crack-front model
Our numerical simulations use the algorithm by Rosso and Krauth 2 to solve for the equilibrium configurations (metastable states) visited by the crack front as we pull the sphere in and out of the contact. We discretize the crack front in collocation points at equally spaced angles following Ref. 6.
The surface roughness is a Gaussian random field, where the height spectrum has uncorrelated phases and random amplitudes scaling according to the PSD, and defines the equivalent work of adhesion field via Eqs. (S-13) and (S-25). Equation (S-13) describes the stress intensity factor for a straight crack that is rotated to be tangential to the contact circle. Note that the prefactor in Eq. (S-13) is a complex number that introduces a minor phase-shift between and in the direction normal to the front. While this phase-shift, and thereby the orientation of the crack, are important when comparing deterministically the crack-front model to the BEM, they have no effect on the power-spectrum of and on the work of adhesion hysteresis. When the correlation length is much smaller than the contact radius, the heights decorrelate before the orientation of the crack changes significantly along the perimeter. For this reason, and because the rotation becomes computationally intractable on large grids, we generate the equivalent work of adhesion fields used in the main text and in Suppl. Sec. S-IV using a constant orientation of the crack.
S-III Validation of the crack-front model against the Boundary Element Method
We compare the crack-front model to a boundary element method (BEM) simulation to validate our mapping from surface roughness to an equivalent work of adhesion heterogeneity. The implementation of the BEM and the parameters of the simulation are similar to Ref. 6, where we validated the crack-front model for spheres with heterogeneous work of adhesion. In the BEM simulation we perform here, the sphere is rough and the work of adhesion is uniform. The surfaces interact with a cubic cohesive law with a hard-wall repulsion. Our implementation of the BEM is described in detail in Ref. 6 and is based on 20, 21, 22, 23, 24.
Figure S-4 shows a BEM and a crack front simulation on random roughness with and a power spectrum that is flat for wavelengths above the correlation length and 0 below. The force-penetration curves computed with the BEM and the crack-front model nearly overlap and contact perimeters agree well, confirming that the contact of rough spheres is equivalent to the pinning of a crack by the work of adhesion heterogeneity mapped using equation (S-25). Note that in the BEM, the jump into contact instability occurs too early because of the finite interaction range 25, 26, 27, 6. This particular event converges slowly with interaction range, while the remainder of the force-penetration curve, including depinning instabilities, is well converged. Other discrepancies in the force-penetration curves are due to the linearization in the crack-front model.
S-IV Hysteresis on random roughness: crack-front simulations
We verify our theoretical prediction for the apparent work of adhesion (Main Text Eq. (6))
| (S-38) |
using crack-front simulations on self-affine roughness with varying power spectra, and extract the numerical factor from these results. We show in Suppl. Sec. I B,C that self-affine surface roughness maps to an equivalent work of adhesion field with power-law correlation via the integral transform Eq. (S-13). The variance of this work of adhesion heterogeneity , with the elastic energy required to conform to the surface roughness.
Figure S-5 shows the work of adhesion hysteresis as a function the amplitude of disorder . The dashed line represent the prediction Eq. (S-38) using that we fitted to the results. For , the work of adhesion hysteresis in our numerical simulations (symbols) overlaps with the theoretically predicted scaling (dashed line) and is independent of the shape of the power spectrum. Below a critical value of , the hysteresis disapears because of the finite size of the contact 9, 28, 10. This onset of hysteresis depends on the shape of the power-spectral density: for roughness with a short correlation length (purple triangles), the contact process starts to dissipate energy at smaller than for a longer correlation length (pink crosses).
The scaling of the hysteresis with was theoretically predicted and numerically verified on random fields with short-ranged correlation 8, 10, 28, similar to our roughness with flat PSD represented by the green squares. Here we consider isotropic self-affine roughness leading to work of adhesion fields with long-ranged power-law correlations. Démery et al. 28 theoretically predicted that for isotropic fields, the relationship between hysteresis and remains unaffected by these power-law correlations. They derived this result by analytically solving a small disorder expansion of the equation of motion of the elastic line. Our numerical simulations further confirm that Eq. (S-38) remains valid for isotropic self-affine roughness.
References
- [1] Anderson, P. M. & Rice, J. R. The stress field and energy of a three-dimensional dislocation loop at a crack tip. J. Mech. Phys. Solids 35, 743–769 (1987).
- [2] Rosso, A. & Krauth, W. Roughness at the depinning threshold for a long-range elastic string. Phys. Rev. E 65, 025101 (2002).
- [3] Hertz, H. Über die Berührung fester elastischer Körper. J. Reine Angew. Math. 92, 156–171 (1881).
- [4] Sneddon, I. N. Boussinesq’s problem for a flat-ended cylinder. Math. Proc. Cambridge Philos. Soc. 42, 29–39 (1946).
- [5] Irwin, G. R. Analysis of stresses and strains near the end of a crack transversing a plate. J. Appl. Mech. 24, 361–364 (1957).
- [6] Muller, V. M., Yushchenko, V. S. & Derjaguin, B. V. On the influence of molecular forces on the deformation of an elastic sphere and its sticking to a rigid plane. J. Colloid Interface Sci. 77, 91–101 (1980).
- [7] Müser, M. H. Single-asperity contact mechanics with positive and negative work of adhesion: Influence of finite-range interactions and a continuum description for the squeeze-out of wetting fluids. Beilstein J. Nanotechnol. 5, 419–437 (2014).
- [8] Zehnder, A. T. Fracture Mechanics. No. 62 in Lecture Notes in Applied and Computational Mechanics (Springer Science+Business Media, London ; New York, 2012).
- [9] Westergaard, H. M. General solution of the problem of elastostatics of an n-dimensional homogeneous isotropic solid in an n-dimensional space. Bull. Am. Math. Soc. 41, 695–700 (1935).
- [10] Tada, H., Paris, P. C. & Irwin, G. R. The Stress Analysis Of Cracks Handbook (ASME Press, New York, 2000), 3rd edn.
- [11] Abramowitz, M. & Stegun, I. A. Handbook of Mathematical Functions with Formulas, Graphs, and Mathematical Tables, vol. 55 (US Government printing office, 1964).
- [12] Borodachev, N. M. Contact problem for an elastic half-space with a near-circular contact area. Sov. Appl. Mech. 27, 118–123 (1991).
- [13] Fabrikant, V. I. Stress intensity factors and displacements in elastic contact and crack problems. J. Eng. Mech. 124, 991–999 (1998).
- [14] Argatov, I. A comparison of general solutions to the non-axisymmetric frictionless contact problem with a circular area of contact: When the symmetry does not matter. Symmetry 14, 1083 (2022).
- [15] Rice, J. R. Three-dimensional elastic crack tip interactions with transformation strains and dislocations. Int. J. Solids Struct. 21, 781–791 (1985).
- [16] Williams, M. L. On the stress distribution at the base of a stationary crack. J. Appl. Mech. 24, 109–114 (1957).
- [17] Hartranft, R. & Sih, G. The use of eigenfunction expansions in the general solution of three-dimensional crack problems. Indiana Univ. Math. J. 19, 123–138 (1969).
- [18] Creton, C. & Ciccotti, M. Fracture and adhesion of soft materials: A review. Rep. Prog. Phys. 79, 046601 (2016).
- [19] Gladwell, G. M. L. (ed.) Contact Problems, vol. 155 of Solid Mechanics and Its Applications (Springer Netherlands, Dordrecht, 2008).
- [20] Hockney, R. W. The potential calculation and some applications. In Alder, B. A., Fernbach, S. & Rotenberg, M. (eds.) Methods in Computational Physics, Vol. 9, 135–211 (Academic Press, New York, 1970).
- [21] Byrd, R. H., Lu, P., Nocedal, J. & Zhu, C. A limited memory algorithm for bound constrained optimization. SIAM J. Sci. Comput. 16, 1190–1208 (1995).
- [22] Stanley, H. M. & Kato, T. An FFT-based method for rough surface contact. J. Tribol. 119, 481–485 (1997).
- [23] Campañá, C. & Müser, M. H. Practical Green’s function approach to the simulation of elastic semi-infinite solids. Phys. Rev. B 74, 075420 (2006).
- [24] Pastewka, L. & Robbins, M. O. Contact area of rough spheres: Large scale simulations and simple scaling laws. Appl. Phys. Lett. 108, 221601 (2016).
- [25] Wu, J.-J. The jump-to-contact distance in atomic force microscopy measurement. J. Adhes. 86, 1071–1085 (2010).
- [26] Ciavarella, M., Greenwood, J. A. & Barber, J. R. Effect of Tabor parameter on hysteresis losses during adhesive contact. J. Mech. Phys. Solids 98, 236–244 (2017).
- [27] Wang, A., Zhou, Y. & Müser, M. H. Modeling adhesive hysteresis. Lubricants 9, 17 (2021).
- [28] Tanguy, A. & Vettorel, T. From weak to strong pinning I: A finite size study. Eur. Phys. J. B 38, 71–82 (2004).