Minor merger growth in action:
JWST detects faint blue companions around massive quiescent galaxies at
Abstract
Minor mergers are thought to drive the structural evolution of massive quiescent galaxies; however, existing HST imaging is primarily sensitive to stellar mass ratios 1:10. Here, we report the discovery of a large population of low-mass companions within 35 kpc of known quiescent galaxies at . While massive companions like those identified by HST are rare, JWST imaging from JADES reveals that the average massive quiescent galaxy hosts 5 nearby companions with stellar mass ratios 1:10. Despite a median stellar mass ratio of just 1:900, these tiny companions are so numerous that they represent at least 30% of the total mass being added to quiescent galaxies via minor mergers. While relatively massive companions have colors similar to their hosts, companions with mass ratios 1:10 typically have bluer colors and lower mass-to-light ratios than their host galaxies at similar radii. The accretion of these tiny companions is likely to drive evolution in the color gradients and stellar population properties of the host galaxies. Our results suggest that the well-established “minor merger growth” model for quiescent galaxies extends down to very low mass ratios of 1:100, and demonstrates the power of JWST to constrain both the spatially-resolved properties of massive galaxies and the properties of low-mass companions beyond the local universe.
1 Introduction
The Hubble Space Telescope (HST) revealed that distant quiescent galaxies appear to be remarkably compact: the sizes of passive galaxies double between and (e.g., Daddi et al. 2005; van Dokkum et al. 2008; Damjanov et al. 2009). The strength of color gradients in these galaxies also evolves rapidly: at , quiescent galaxies are red throughout; by their outskirts are bluer than their centers (e.g., Suess et al. 2019a, b, 2020; Mosleh et al. 2020; Miller et al. 2023). The major driver of this structural evolution is thought to be gas-poor minor mergers, which are effective at increasing galaxy sizes and building up color gradients while leaving central densities and stellar masses mostly unchanged (e.g., Bezanson et al. 2009; Hopkins et al. 2009; Naab et al. 2009; Ji & Giavalisco 2022). HST imaging indicates that roughly half of the observed size growth of quiescent galaxies is explainable by minor mergers with mass ratios 1:10 (e.g., Newman et al. 2012; Belli et al. 2015).
Despite their importance to quiescent galaxy evolution, the faint nature of low-mass companions means that they are difficult to characterize beyond the local universe. Even when limiting to the massive quiescent hosts (), HST studies such as Newman et al. (2012) only probed mass ratios of 1:10 at . In a hierarchical growth scenario, smaller mergers are likely to be even more common (e.g., Fakhouri et al. 2010). The existence of lower-mass companions at as well as their integrated effect on the masses, sizes, and color profiles of their massive quiescent hosts remains uncharacterized.
JWST (Gardner et al. 2023) opens the door to studying faint, low-mass satellite galaxies outside of the local universe. The JWST Advanced Deep Extragalactic Survey (JADES; Eisenstein et al. 2023) reaches m depths comparable to HST’s Ultra Deep Field (UDF) over much larger area — and triples the resolution, increasing the effective surface brightness of compact companions (Rieke et al. 2023b). The redder imaging enabled by JWST/NIRCam also allows us to begin disentangling stellar population properties to understand why color gradients evolve (e.g., Miller et al. 2022).
In this Letter, we leverage the depth and resolution of new JWST imaging from the JADES survey to study the occurrence of low-mass companions around a sample of 161 massive quiescent galaxies at . We find that these companions are extraordinarily common, with each galaxy in our sample hosting 5 companions with . We also investigate how these newly-discovered companions may influence the growth and evolution of their quiescent hosts by comparing the colors and stellar population properties of the companions to the spatially-resolved properties of their hosts.
Throughout this Letter we assume a standard CDM cosmology with , , and . Magnitudes are quoted in the AB system (Oke 1974).
2 Methods
2.1 Data & parent sample
This work uses multi-band JWST/NIRCam mosaics in GOODS-S. The data reduction is described in detail in Rieke et al. (2023a). We use F090W, F115W, F182M, F200W, F210M, F277W, F335M, F356W, F410M, F444W, F460M, and F480M mosaics, which include data from JADES (Eisenstein et al. 2023, PID 1180), JEMS (Williams et al. 2023, PID 1963), and FRESCO (Oesch et al. 2023, PID 1895). We additionally use HST data in F435W, F606W, F775W, F814W, F850LP, F105W, and F160W (Illingworth et al. 2016; Whitaker et al. 2019) which were reduced and mosaicked onto the same scale as the JADES JWST mosaics.
Our sample of 161 quiescent galaxies is described in detail in Ji et al. (in prep.). Quiescent galaxies are selected from the 3D-HST catalog (Skelton et al. 2014) to have , , and rest-frame colors within the Schreiber et al. (2015) quiescent box. Suspected AGN are removed by cross-matching with previous works such as Lyu et al. (2022). Seven additional spectroscopically-confirmed quiescent galaxies from Carnall et al. (2020) are also included. Figure 2 shows the sample in mass-redshift space. 13 sources lie in the UDF, while the remaining 148 have HST imaging through CANDELS-deep; this means that for the majority of galaxies in our sample, JADES JWST/F150W imaging is 1-2 mag deeper as well as three times higher resolution than available HST/F160W imaging.
2.2 Faint source detection
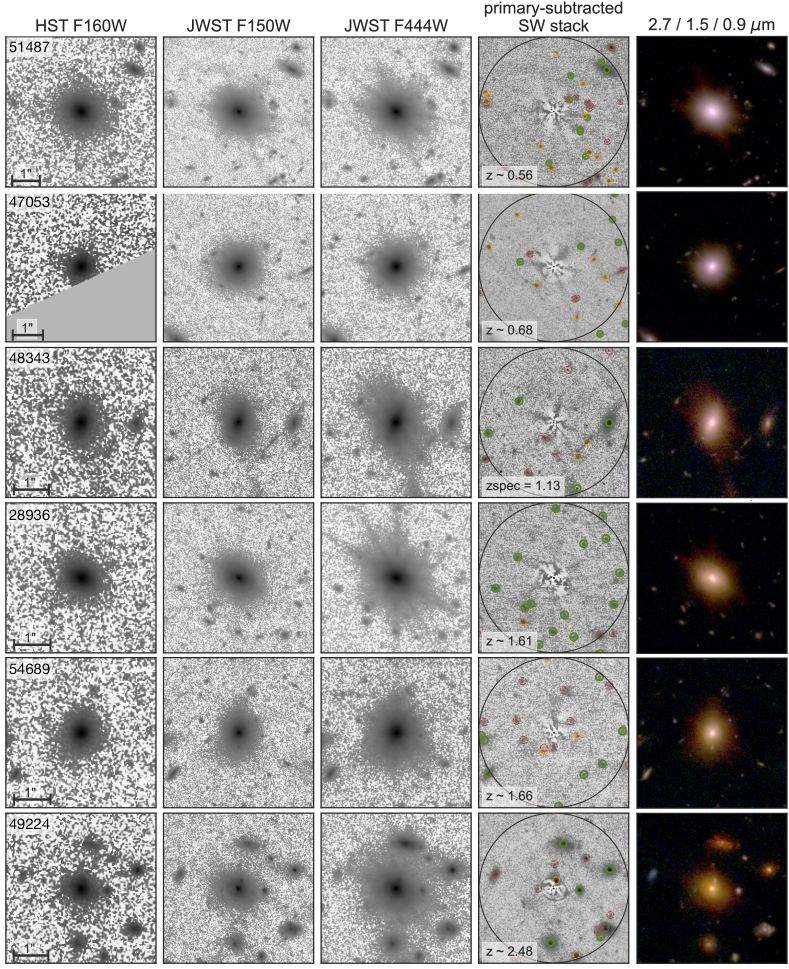
We noticed many faint sources around these known quiescent galaxies that did not appear in previous HST imaging (Fig. 1). These sources are typically small, close to their host, and often brighter in bluer wavelengths. Due to a combination of color and resolution – which impacts both blending and segmentation – these objects are not reliably detected in the main JADES catalog, which is based on a long-wavelength stacked detection image and optimized to detect faint isolated red sources.
We therefore create a source catalog based on a short-wavelength stack of the F090W, F115W, F182M, F200W, and F210M filters. The higher resolution of this SW stack allows us to more reliably detect faint blue sources close to bright hosts. We use sep (Barbary 2016), the python implementation of SourceExtractor (Bertin & Arnouts 1996), to detect and deblend sources using a 3 pixel gaussian kernel, a minimum area of five pixels, a threshold of 5, 32 deblending levels, and a contrast of 0.001. These parameters avoid shredding our primary galaxies while still detecting and deblending most visible companions.
2.3 Faint source photometry
Measuring accurate fluxes for faint sources close to bright primaries requires careful subtraction of the extended primary light profile. We model and subtract the light of each primary quiescent galaxy using the photutils.isophote elliptical isophote fitting algorithm, which requires minimal assumptions about the galaxy’s intrinsic light profile (Jedrzejewski 1987). We create a 7x7” cutout around each primary galaxy in all available JWST/NIRCam and HST/ACS bands, mask all nearby sources, then fit an ellipse to each band independently. As an initial guess, we use the central position, Kron radius, and axis ratio from our SW-detection catalog. We fit for both ellipse geometry and flux at ”; at ” we fix the ellipse geometry and fit only for the flux. We constrain the maximum semimajor axis to 3.5” to ensure all ellipses fit within our cutout. Some primaries are too faint in bluer bands for the ellipse fits to converge; in these cases we mask the primary using our SW-detected segmap (expanded by 11 pixels to capture galaxy outskirts).
We use photutils to perform aperture photometry on the primary-subtracted cutouts at the locations of all other SW-detected sources. We use a 0.2” diameter aperture, which encloses the majority of the flux in these compact sources while minimizing background flux. Following Rieke et al. (2023a), we correct these fluxes for the PSF by applying a linear factor based on the WebbPSF encircled energy and calculate photometric errors using empty apertures. To allow for additional flux uncertainty due to our primary subtraction, we assume that each source is in the 90% noisiest region of the mosaic independent of its actual weight map value.
Due to our SW detection, of cutouts contain a shredded star-forming galaxy at a similar photometric redshift as the primary galaxy. We remove these multiple detections of single objects by identifying any locations where 3 sources are within 0.2” of each other, then removing all sources except the one with the brightest F150W flux.
2.4 Identification & properties of companions
We fit the multi-band photometry for all faint sources and primary galaxies with eazy-py (Brammer et al. 2008; Brammer 2021) using the tweak_fsps_QSF_12_v3 template set and a free photometric redshift . Faint sources are identified as possible companions if (a) they are within 35 kpc of the primary galaxy, (b) their primary-subtracted fluxes are brighter than (e.g., detections), and (c) their photometric redshifts from eazy-py are consistent with the primary quiescent galaxy within 1 (determined using the eazy-py ‘z160’ and ‘z840’ columns). The limit of 35 kpc ensures we can compute accurate gradients for the primary galaxies, while the magnitude cut ensures sources are visible above the extended host light. Our redshift cut may preferentially include sources with particularly uncertain photometric redshift solutions; our selected companions have a median , higher than the primary galaxy median . From regions free of primary sources we estimate % of identified companions are chance alignments. This companion identification is unlikely to be either pure or complete; we leave a detailed selection and characterization of the full companion population around massive quiescent galaxies to future works.
We use eazy-py to re-fit the photometry of each possible companion with the redshift fixed to that of the primary quiescent galaxy to ensure consistent rest-frame color estimates. We also fit each companion with FAST (Kriek et al. 2009) using the Bruzual & Charlot (2003) templates, the Kriek & Conroy (2013) dust law, a delayed- star formation history, photometric redshift fixed to that of the primary, and a grid spacing of 0.1 in Av and (age). We test fits with both free and fixed metallicity; we find no systematic differences in either stellar mass or with different metallicity assumptions, but allowing sub-solar metallicities for the companions — expected based on their low stellar masses, e.g. Sanders et al. (2020) — typically increases their inferred ages. Throughout this work, we quote stellar population properties from FAST and rest-frame colors from eazy-py.
2.5 M/L profiles of primary quiescent galaxies
We calculate radial profiles for the primary quiescent galaxies following the third method described in Suess et al. (2019a), based on Szomoru et al. (2010). In brief, we measure deconvolved surface brightness profiles for each galaxy in each band, then perform SED fitting using the same setup described above to obtain a stellar mass, age, and dust attenuation value at each radius. values are obtained by dividing the FAST stellar mass and the eazy-py rest-frame V-band light.
We use Lenstronomy (Birrer & Amara 2018; Birrer et al. 2021) to fit a single Sérsic profile to each primary quiescent galaxy in each available JWST and HST band. We use our SW-detected source catalog and segmentation map to simultaneously fit all sources that are up to two magnitudes fainter than the primary galaxy and have centers 2” away; we mask all other sources. Most candidate companions are significantly fainter than their primary, and are masked. We first fit each primary in F150W— which offers the best combination of signal-to-noise and resolution— allowing the position, Sérsic index, half-light radius, position angle, and axis ratio to vary. We constrain the Sérsic index to , the size to , and the position to within of the SW catalog center. We then fit a Sérsic profile to all other JWST and HST bands, forcing the center to the best-fit F150W center but allowing free , size, axis ratio, and position angle. All fits are performed on the 0.03” drizzled images and use empirical point spread functions (PSFs) from Ji et al. (2023).
We measure the residual flux in concentric elliptical annuli that are centered at the primary’s best-fit F150W location, have the same axis ratio and position angle as the best-fit F150W Sérsic profile, and are spaced approximately one PSF FWHM apart. We add this residual flux profile to the best-fit deconvolved Sérsic profile. We estimate error bars on the resulting residual-corrected deconvolved surface brightness profiles using the empty aperture scaling relations from Rieke et al. (2023a). We fit these spatially-resolved multi-band surface brightness profiles with eazy-py and FAST as described above, fixing the redshifts to the best-fit spatially-integrated redshift.
3 Results
In Figure 1, we show example HST and JWST images of six quiescent galaxies in our sample. While JWST/F150W and HST/F160W trace nearly identical rest-frame wavelengths, JWST imaging is three times higher resolution and up to two magnitudes deeper than HST. Figure 1 also shows a stack of all JWST short-wavelength filters after subtracting the primary quiescent galaxy. The smooth component of the primary galaxy is typically well-fit; small residuals often tracing the PSF diffraction spikes can occasionally be seen in the innermost ”. Possible companions are circled in green. These examples demonstrate the striking number of newly-revealed faint companions around these well-studied massive quiescent galaxies. Across our sample of 161 quiescent primaries, we identify a total of 629 companions, of which only 60/629 (10%) have and 36/629 (6%) have mass ratios 1:10.
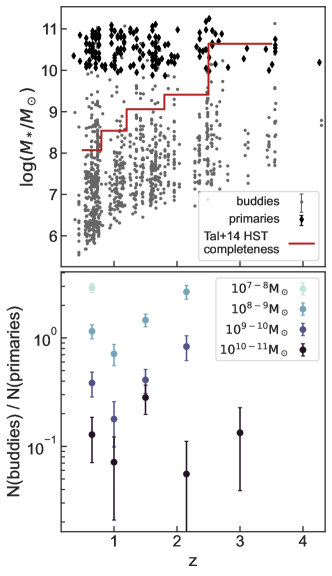
Figure 2 shows stellar mass versus redshift for our primary quiescent galaxies and all identified companions, along with the mass completeness limit of CANDELS-wide from Tal et al. (2014) (CANDELS-deep, which contains most of our sources, is about a magnitude deeper than CANDELS-wide in GOODS-S). The majority of companions are well below the Tal et al. (2014) mass completeness threshold. The right panel shows the number of companions per host in bins of companion mass. While companions exist around just 10% of hosts, most massive quiescent galaxies host a total of 5 companions. The masses of most companions are larger than expected for globular clusters; however, some of our lowest-mass sources at may be consistent with the high-mass end of the globular population (e.g., Barmby et al. 2007; Caldwell et al. 2011).
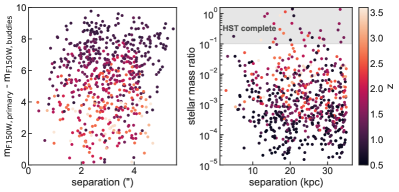
Figure 3 demonstrates why these companions with consistent photometric redshifts were not identified in previous studies: they are simply too faint to distinguish from the extended light of their host at HST’s resolution. The grey shaded region in the plot shows the 1:10 stellar mass ratio where previous HST studies (e.g., Newman et al. 2012) were complete; just 6% of our companions lie in this 1:10 regime. Whether parameterized in terms of a difference in magnitude or inferred mass ratio, the companions are up to 10,000 times fainter than their host. While this difference seems extreme, we note again that our quiescent primaries are as bright as and we only include companions with primary-subtracted fluxes above the 6 limiting depth of JADES F150W imaging: even these faint sources are easily distinguishable by eye in single-band JADES imaging (Fig. 1).
There are clear trends with mass and redshift in Figures 2 & 3: it is easier to detect faint, nearby companions at lower redshifts. This indicates that our current companion selection is incomplete. Figure 3 also shows there may be a lack of bright companions at very close separations, perhaps because such massive companions would trigger starbursts and prevent the primary galaxy from entering our quiescent selection. Completeness aside, it is clear from this initial study that JWST is revealing an extraordinarily prominent population of faint, low-mass companions around bright quiescent galaxies at cosmic noon.
We find that the sum of the stellar mass contained in all massive companions (mass ratio 1:10) is , while the sum of the stellar mass contained in all less-massive companions (mass ratio 1:10) is . Given that our sample is likely to be less complete at more extreme mass ratios, our results indicate that these newly-discovered low-mass companions contribute % of the total mass accreted onto massive quiescent galaxies via mergers.
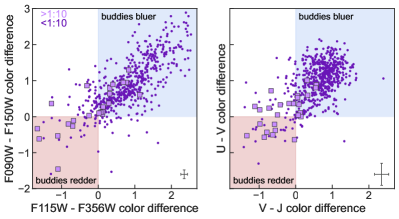
Figure 4 shows the difference in both observed and inferred rest-frame color between each primary and all of its identified companions. Overall, most companions in our sample are bluer than their hosts, whether we consider observed or rest-frame colors: 85% of companions have bluer and rest-frame colors than their hosts. However, there is a clear dependence on companion mass ratio: companions with mass ratios 1:10 are typically redder than those with lower mass ratios, with colors similar to or even redder than their hosts.
In Figure 5, we place these companions in context by comparing their properties to the spatially-resolved properties of their hosts. The left panel of Figure 5 shows the profile of each quiescent galaxy as well as a stack of all 161 quiescent galaxies. While individual galaxies show a range of behaviors, the stacked profile clearly shows that radially decreasing profiles are common in quiescent galaxies in this mass and redshift range (consistent with Suess et al. 2019a, b, 2020). The shaded hexagons in the right panel of Figure 5 show the typical colors of the primary quiescent galaxies as a function of radius. Consistent with Miller et al. (2022), most galaxies in our sample are -quiescent in their centers but move to bluer colors consistent with star-forming galaxies in their outskirts. Our stellar population fits indicate that the lower values and bluer colors on the outskirts of quiescent galaxies are likely due to either younger stellar ages or lower metallicities, since most primaries have A at all radii.
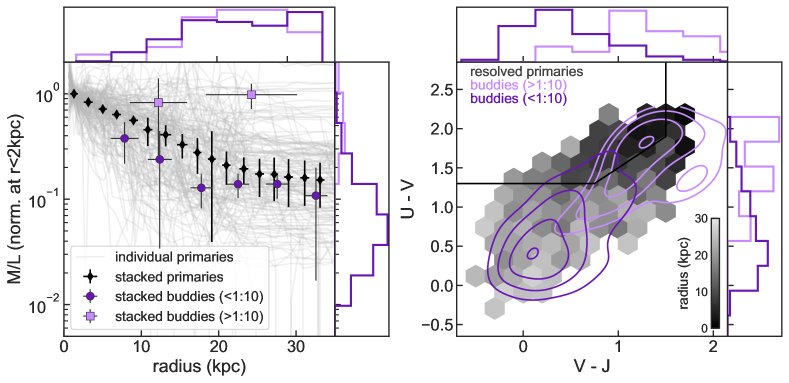
The purple points in the left panel of Figure 5 show the companion values, split by mass ratio and stacked in radial bins based on their location with respect to their primary. The purple contours in the right panel show the companion colors split by mass ratio. Companions with mass ratios 1:10 tend to have values similar to the center of the primary galaxy and populate the redder portion of the diagram; their stellar population fits indicate a low median specific star formation rate of . In contrast, companions with mass ratios 1:10 – the new region probed by this study – tend to have slightly lower than their hosts at fixed radius, and often lie in the lower-left corner of space typical for low-mass star-forming galaxies. Low-mass companions located at smaller radii appear to have slightly higher . Our stellar population fits indicate that these low-mass ratio companions also have higher median specific star formation rates of . We emphasize that the companions are masked when we calculate the radial color profiles of the primary galaxies: even the smooth component of the quiescent primaries matches the low of the low-mass companions at large radii.
4 Discussion & Conclusions
In this Letter, we have shown that most massive quiescent galaxies at have decreasing gradients and are surrounded by low-mass companions. The median mass ratio of our detected companions is just 1:900, well below the 1:10 limit probed by HST. These tiny companions are an order of magnitude more numerous than their higher-mass counterparts: we find that the average quiescent galaxy hosts just companions with , but companions with . Companions with mass ratios 1:10 tend to be relatively red, with values similar to that of their hosts; however, companions with mass ratios 1:10 tend to be bluer and lower than either the spatially-integrated or spatially-resolved properties of their primary host. Our results suggest that larger companions (1:10) likely drive the majority of quiescent size growth, while tiny companions (1:10) are the primary drivers of color gradient evolution. While not designed to be mass-complete, this first-look study demonstrates the power of JWST to push the study of low-mass companions to high redshifts.
The relatively red colors, high values, and low ongoing SFRs of companions with mass ratios 1:10 are consistent with a scenario where quiescent galaxies grow via dry minor mergers (e.g., Bezanson et al. 2009). These red companion galaxies are unlikely to bring in significant molecular gas reservoirs that would trigger star formation in their hosts. The low median SFR of this population is also consistent with the “conformity” picture, where quiescent galaxies tend to host quiescent satellites (Weinmann et al. 2006).
New to our study is the observation that the minor merger growth model extends to very low masses: 94% of the companions in our study have mass ratios 1:10. While these low-mass companions show a range in properties, the population as a whole tends to be bluer, lower , and more highly star-forming than their host. These companions are so low-mass that they are unlikely to bring in significant gas reservoirs, but their distinct stellar populations will establish radially decreasing color gradients that likely strengthen over time as more minor mergers occur (consistent with Suess et al. 2019b, 2020). Our observation that the outskirts of quiescent galaxies tend to be lower than their centers even when masking all identified companions indicates that the accretion of tiny blue companions may already have been taking place for some time before . We find that these tiny companions make up 30% of the stellar mass accreted onto quiescent galaxies, indicating that this newly-observed population will meaningfully affect the evolution of their hosts. The discovery of such a large stellar mass contained in tiny companions is not inconsistent with cosmological simulations: Jiang & van den Bosch (2014) predict a factor of 1.5 more dark matter mass in low-mass subhalos than more massive ones, and Rodriguez-Gomez et al. (2016) use the Illustris simulation to predict roughly equal stellar mass in mergers with mass ratios and .
While we have provided an initial guess at companion fractions in Figure 2, our current companion selection is not intended to be mass-complete. Especially at , it is unlikely we are detecting all companions with mass ratios 1:100. We may also be missing an intrinsically redder subset of companions – while our 1-2m stacked detection image does trace redward of the Balmer break across our full range, future studies may be able to account for the lower spatial resolution of the longer-wavelength JWST bands and identify redder companions from a 3-4m detection image. Studying redder companions may provide additional insights into environmental quenching. Expanding to a larger search radius is also likely to identify many more companions; however, statistical background corrections will become more important. Finally, we note that our current work uses EAZY to calculate photometric redshifts and rest-frame colors, and FAST for stellar populations: future more detailed SED fitting may be able to further characterize stellar population trends both for the companions themselves and the spatially-resolved properties of the hosts.
Our work demonstrates the power of JWST to constrain the spatially-resolved properties of distant galaxies from imaging alone. We confirm the findings of Miller et al. (2022) that, while the centers of quiescent galaxies often lie within the traditional UVJ box, the outskirts of quiescent galaxies are significantly bluer and often lie in the UVJ star-forming region (Fig. 5). Our stellar population fits indicate that most quiescent galaxies in our sample have A throughout, suggesting that gradients in quiescent galaxies are likely caused by either age or metalliticy gradients. Future work is needed to break the age-metallicity degeneracy and understand the role of metallicity or abundance ratio gradients (e.g., Greene et al. 2015; Woo & Ellison 2019; Santucci et al. 2020).
Our work also ushers in a new era of studying low-mass companions outside of the local universe. While some studies have begun this work with HST (e.g., Nierenberg et al. 2013, 2016; Ji et al. 2018), it is clear from Figures 2 & 3 that deep observations with the efficiency and resolution of JWST are required to reliably detect companions at . The existence of low-mass companions at high redshift is not unexpected: after all, many dwarf galaxies in our own Local Group likely formed at (e.g., Weisz et al. 2014); deep enough imaging should be able to reveal high-redshift dwarf galaxies shortly after their formation epoch. Further, cosmological simulations make strong predictions for the halo occupation distribution and the radial distribution of satellites around massive galaxies. Our results indicate that JWST data will be able to directly test these predictions against observations and constrain the relationship between stellar mass, subhalo distribution, and overall buildup of the stellar and dynamical mass of quiescent galaxies (e.g., Zahid & Geller 2017). While our current study has focused on massive quiescent galaxies without clear evidence of AGN, future works may provide a detailed observational understanding of how the companion population depends on host properties such as stellar mass, star formation rate, or star formation history.
References
- Astropy Collaboration et al. (2013) Astropy Collaboration, Robitaille, T. P., Tollerud, E. J., et al. 2013, A&A, 558, A33, doi: 10.1051/0004-6361/201322068
- Astropy Collaboration et al. (2018) Astropy Collaboration, Price-Whelan, A. M., Sipőcz, B. M., et al. 2018, AJ, 156, 123, doi: 10.3847/1538-3881/aabc4f
- Barbary (2016) Barbary, K. 2016, Journal of Open Source Software, 1, 58, doi: 10.21105/joss.00058
- Barmby et al. (2007) Barmby, P., McLaughlin, D. E., Harris, W. E., Harris, G. L. H., & Forbes, D. A. 2007, AJ, 133, 2764, doi: 10.1086/516777
- Belli et al. (2015) Belli, S., Newman, A. B., & Ellis, R. S. 2015, ApJ, 799, 206, doi: 10.1088/0004-637X/799/2/206
- Bertin & Arnouts (1996) Bertin, E., & Arnouts, S. 1996, A&AS, 117, 393, doi: 10.1051/aas:1996164
- Bezanson et al. (2009) Bezanson, R., van Dokkum, P. G., Tal, T., et al. 2009, ApJ, 697, 1290, doi: 10.1088/0004-637X/697/2/1290
- Birrer & Amara (2018) Birrer, S., & Amara, A. 2018, Physics of the Dark Universe, 22, 189, doi: 10.1016/j.dark.2018.11.002
- Birrer et al. (2015) Birrer, S., Amara, A., & Refregier, A. 2015, ApJ, 813, 102, doi: 10.1088/0004-637X/813/2/102
- Birrer et al. (2021) Birrer, S., Shajib, A. J., Gilman, D., et al. 2021, Journal of Open Source Software, 6, 3283, doi: 10.21105/joss.03283
- Brammer (2021) Brammer, G. 2021, eazy-py, 0.5.2, doi: 10.5281/zenodo.5012704
- Brammer et al. (2008) Brammer, G. B., van Dokkum, P. G., & Coppi, P. 2008, ApJ, 686, 1503, doi: 10.1086/591786
- Bruzual & Charlot (2003) Bruzual, G., & Charlot, S. 2003, MNRAS, 344, 1000, doi: 10.1046/j.1365-8711.2003.06897.x
- Caldwell et al. (2011) Caldwell, N., Schiavon, R., Morrison, H., Rose, J. A., & Harding, P. 2011, AJ, 141, 61, doi: 10.1088/0004-6256/141/2/61
- Carnall et al. (2020) Carnall, A. C., Walker, S., McLure, R. J., et al. 2020, MNRAS, 496, 695, doi: 10.1093/mnras/staa1535
- Daddi et al. (2005) Daddi, E., Renzini, A., Pirzkal, N., et al. 2005, ApJ, 626, 680, doi: 10.1086/430104
- Damjanov et al. (2009) Damjanov, I., McCarthy, P. J., Abraham, R. G., et al. 2009, ApJ, 695, 101, doi: 10.1088/0004-637X/695/1/101
- Eisenstein et al. (2023) Eisenstein, D. J., Willott, C., Alberts, S., et al. 2023, arXiv e-prints, arXiv:2306.02465, doi: 10.48550/arXiv.2306.02465
- Fakhouri et al. (2010) Fakhouri, O., Ma, C.-P., & Boylan-Kolchin, M. 2010, MNRAS, 406, 2267, doi: 10.1111/j.1365-2966.2010.16859.x
- Gardner et al. (2023) Gardner, J. P., Mather, J. C., Abbott, R., et al. 2023, PASP, 135, 068001, doi: 10.1088/1538-3873/acd1b5
- Greene et al. (2015) Greene, J. E., Janish, R., Ma, C.-P., et al. 2015, ApJ, 807, 11, doi: 10.1088/0004-637X/807/1/11
- Hopkins et al. (2009) Hopkins, P. F., Bundy, K., Murray, N., et al. 2009, MNRAS, 398, 898, doi: 10.1111/j.1365-2966.2009.15062.x
- Illingworth et al. (2016) Illingworth, G., Magee, D., Bouwens, R., et al. 2016, arXiv e-prints, arXiv:1606.00841, doi: 10.48550/arXiv.1606.00841
- Jedrzejewski (1987) Jedrzejewski, R. I. 1987, MNRAS, 226, 747, doi: 10.1093/mnras/226.4.747
- Ji & Giavalisco (2022) Ji, Z., & Giavalisco, M. 2022, ApJ, 935, 120, doi: 10.3847/1538-4357/ac7f43
- Ji et al. (2018) Ji, Z., Giavalisco, M., Williams, C. C., et al. 2018, ApJ, 862, 135, doi: 10.3847/1538-4357/aacc2c
- Ji et al. (2023) Ji, Z., Williams, C. C., Tacchella, S., et al. 2023, arXiv e-prints, arXiv:2305.18518, doi: 10.48550/arXiv.2305.18518
- Jiang & van den Bosch (2014) Jiang, F., & van den Bosch, F. C. 2014, MNRAS, 440, 193, doi: 10.1093/mnras/stu280
- Kriek & Conroy (2013) Kriek, M., & Conroy, C. 2013, ApJ, 775, L16, doi: 10.1088/2041-8205/775/1/L16
- Kriek et al. (2009) Kriek, M., van Dokkum, P. G., Labbé, I., et al. 2009, ApJ, 700, 221, doi: 10.1088/0004-637X/700/1/221
- Lyu et al. (2022) Lyu, J., Alberts, S., Rieke, G. H., & Rujopakarn, W. 2022, ApJ, 941, 191, doi: 10.3847/1538-4357/ac9e5d
- Miller et al. (2022) Miller, T. B., van Dokkum, P., & Mowla, L. 2022, arXiv e-prints, arXiv:2207.05895. https://arxiv.org/abs/2207.05895
- Miller et al. (2023) —. 2023, ApJ, 945, 155, doi: 10.3847/1538-4357/acbc74
- Mosleh et al. (2020) Mosleh, M., Hosseinnejad, S., Hosseini-ShahiSavandi, S. Z., & Tacchella, S. 2020, ApJ, 905, 170, doi: 10.3847/1538-4357/abc7cc
- Naab et al. (2009) Naab, T., Johansson, P. H., & Ostriker, J. P. 2009, ApJ, 699, L178, doi: 10.1088/0004-637X/699/2/L178
- Newman et al. (2012) Newman, A. B., Ellis, R. S., Bundy, K., & Treu, T. 2012, ApJ, 746, 162, doi: 10.1088/0004-637X/746/2/162
- Nierenberg et al. (2016) Nierenberg, A. M., Treu, T., Menci, N., et al. 2016, MNRAS, 462, 4473, doi: 10.1093/mnras/stw1860
- Nierenberg et al. (2013) Nierenberg, A. M., Treu, T., Menci, N., Lu, Y., & Wang, W. 2013, ApJ, 772, 146, doi: 10.1088/0004-637X/772/2/146
- Oesch et al. (2023) Oesch, P. A., Brammer, G., Naidu, R. P., et al. 2023, arXiv e-prints, arXiv:2304.02026, doi: 10.48550/arXiv.2304.02026
- Oke (1974) Oke, J. B. 1974, ApJS, 27, 21, doi: 10.1086/190287
- Perrin et al. (2014) Perrin, M. D., Maire, J., Ingraham, P., et al. 2014, in Society of Photo-Optical Instrumentation Engineers (SPIE) Conference Series, Vol. 9147, Ground-based and Airborne Instrumentation for Astronomy V, ed. S. K. Ramsay, I. S. McLean, & H. Takami, 91473J, doi: 10.1117/12.2055246
- Rieke et al. (2023a) Rieke, M., Robertson, B., Tacchella, S., et al. 2023a, arXiv e-prints, arXiv:2306.02466, doi: 10.48550/arXiv.2306.02466
- Rieke et al. (2023b) Rieke, M. J., Kelly, D. M., Misselt, K., et al. 2023b, PASP, 135, 028001, doi: 10.1088/1538-3873/acac53
- Rodriguez-Gomez et al. (2016) Rodriguez-Gomez, V., Pillepich, A., Sales, L. V., et al. 2016, MNRAS, 458, 2371, doi: 10.1093/mnras/stw456
- Sanders et al. (2020) Sanders, R. L., Shapley, A. E., Reddy, N. A., et al. 2020, MNRAS, 491, 1427, doi: 10.1093/mnras/stz3032
- Santucci et al. (2020) Santucci, G., Brough, S., Scott, N., et al. 2020, ApJ, 896, 75, doi: 10.3847/1538-4357/ab92a9
- Schreiber et al. (2015) Schreiber, C., Pannella, M., Elbaz, D., et al. 2015, A&A, 575, A74, doi: 10.1051/0004-6361/201425017
- Skelton et al. (2014) Skelton, R. E., Whitaker, K. E., Momcheva, I. G., et al. 2014, ApJS, 214, 24, doi: 10.1088/0067-0049/214/2/24
- Suess et al. (2019a) Suess, K. A., Kriek, M., Price, S. H., & Barro, G. 2019a, ApJ, 877, 103, doi: 10.3847/1538-4357/ab1bda
- Suess et al. (2019b) —. 2019b, ApJ, 885, L22, doi: 10.3847/2041-8213/ab4db3
- Suess et al. (2020) —. 2020, ApJ, 899, L26, doi: 10.3847/2041-8213/abacc9
- Szomoru et al. (2010) Szomoru, D., Franx, M., van Dokkum, P. G., et al. 2010, ApJ, 714, L244, doi: 10.1088/2041-8205/714/2/L244
- Tal et al. (2014) Tal, T., Dekel, A., Oesch, P., et al. 2014, ApJ, 789, 164, doi: 10.1088/0004-637X/789/2/164
- van Dokkum et al. (2008) van Dokkum, P. G., Franx, M., Kriek, M., et al. 2008, ApJ, 677, L5, doi: 10.1086/587874
- Waskom et al. (2017) Waskom, M., Botvinnik, O., O’Kane, D., et al. 2017, Mwaskom/Seaborn: V0.8.1 (September 2017), v0.8.1, Zenodo, Zenodo, doi: 10.5281/zenodo.883859
- Weinmann et al. (2006) Weinmann, S. M., van den Bosch, F. C., Yang, X., & Mo, H. J. 2006, MNRAS, 366, 2, doi: 10.1111/j.1365-2966.2005.09865.x
- Weisz et al. (2014) Weisz, D. R., Dolphin, A. E., Skillman, E. D., et al. 2014, ApJ, 789, 148, doi: 10.1088/0004-637X/789/2/148
- Whitaker et al. (2019) Whitaker, K. E., Ashas, M., Illingworth, G., et al. 2019, ApJS, 244, 16, doi: 10.3847/1538-4365/ab3853
- Williams et al. (2023) Williams, C. C., Tacchella, S., Maseda, M. V., et al. 2023, arXiv e-prints, arXiv:2301.09780, doi: 10.48550/arXiv.2301.09780
- Woo & Ellison (2019) Woo, J., & Ellison, S. L. 2019, MNRAS, 487, 1927, doi: 10.1093/mnras/stz1377
- Zahid & Geller (2017) Zahid, H. J., & Geller, M. J. 2017, ApJ, 841, 32, doi: 10.3847/1538-4357/aa7056