The role of injection method on residual trapping at the pore-scale in continuum-scale samples
Abstract
The injection of CO2 into underground reservoirs provides a long term solution for anthropogenic emissions. A variable injection method (such as ramping the flow rate up or down) provides flexibility to injection sites, and could increase trapping at the pore-scale. However, the impact of a variable injection method on the connectivity of the gas, and subsequent trapping has not been explored at the pore-scale. Here, we conduct pore-scale imaging in a continuum-scale sample to observe the role of a variable flow rate on residual trapping. We show that the injection method influences how much of the pore space is accessible to the gas, even when total volumes injected, and total flow rates remain constant. Starting at a high flow rate, then decreasing it, leads to a larger amount of the pore space accessed by the gas. Conversely, starting at a low flow rate, and increasing it, leads to a larger role of heterogeneity of the pore space. This can promote trapping efficiency because channelling of the two fluids can occur, but less gas is trapped overall. Overall, a high-to-low injection scenario is optimum for residual trapping in the pore space due to increases in pore space accessibility.
Physical Review E
Department of Energy Science & Engineering, Stanford University Department of Geology, Ghent
1 Introduction
The subsurface storage of CO2 will be integral to mitigating climate change, and limiting warming to the 2∘C agreed under the Paris agreement [Rubin \BBA De Coninck (\APACyear2005), IPCC (\APACyear2014)]. The trapping of CO2 in the subsurface over geological time scales can be achieved in many ways: structural trapping, residual trapping, solubility trapping and mineral trapping [Krevor \BOthers. (\APACyear2015), Benson \BOthers. (\APACyear2012)]. Residual trapping is an important trapping mechanism as it can trap large volumes of CO2 over short timescales [Krevor \BOthers. (\APACyear2015)]. It also limits the spread of the plume (which reduces the area that monitoring has to be conducted over), and is not dependent on the structural integrity of a cap rock. Storage projects require flexibility in variables such as CO2 injection rate, with flow regularly ramped up or down. Variations in injection rate will influence the pore-scale movement of CO2, and could play a significant role on the amount of residual trapping. There is also the potential to engineer injection strategies to maximise trapping [Shamshiri \BBA Jafarpour (\APACyear2012)].
The role of the injection rate on trapping has been studied widely, over many scales. Pore-scale experiments have explored the role of flow rate on trapping, with a lower flow rate favouring snap-off of gas phase, which encourages trapping [Hughes \BBA Blunt (\APACyear2000), Herring \BOthers. (\APACyear2015), Wildenschild \BOthers. (\APACyear2001)]. A higher flow rate causes a higher capillary pressure, allowing more of the pore space to be accessed by the gas [Blunt (\APACyear2017)]. A higher gas saturation promotes a higher trapping efficiency [Land (\APACyear1968), Niu \BOthers. (\APACyear2015)]. \citeAzhang2023impact found that higher injection rates increased the migration distances and trapping capacities. Contrary to pore-scale studies, field scale models do not predict strong injection variability effects. For example, \citeAbannach2015stable found that varying CO2 injection rates had a negative effect on overall injectivity within the first years of operation, but the role of the injection rate was deemed insignificant over longer periods. \citeAli2019effects found that varying the injection method improved residual trapping by up to 15%, but only in the first years of injection. The difference in trapping efficiencies among the injection scenarios were within a few percent in the long term. \citeAkolster2018impact found that varying the amplitude and frequency of CO2 storage had little long term impact (over 100 years) on reservoir pressure and plume migration. Ramping up the injection rate did not influence trapping, and so injection wells were advised to be placed as needed and progressively to avoid a large upfront cost of deployment to meet future storage demand.
Overall, the literature is ambiguous on the impact of injection rate for CO2 trapping, especially at the field scale. In these models, it appears that the potential impact is over short timescales, and is not important for long term trapping. However, the early stage dynamics will influence plume shape and later scale dynamics [Szulczewski \BOthers. (\APACyear2012), MacMinn \BOthers. (\APACyear2010)]. Thus, a deeper understanding is required to suitably model plume injection and CO2 trapping. If plume geometry and pressure distribution are poorly predicted it will affect estimates of storage capacity and residual trapping.
In this work we explore the effect of variable injection rates on pore-scale trapping in a continuum-scale sample. We compare the flow mechanisms generated when the flow rate is either ramped up, or ramped down, and explore the subsequent impact on trapping efficiency and utilisation of the pore space. With this analysis, we gain a deeper insight on the role of the injection scenario on residual trapping which will aid future modelling efforts, and bridge the gap between pore-scale observations, and their impact on larger scale flow properties.
2 Material & Methods
2.1 Experimental Apparatus and Procedure
The experiments were conducted in a cylindrical Bentheimer sandstone sample, 25 mm in diameter and 45 mm in length. Details of the Hassler-type core holder used in these experiments is discussed elsewhere [Wang \BOthers. (\APACyear2023)]. The sample was initially saturated with brine (deionized water doped with 17 wt.% KI to improve the X-ray contrast). The system was pressurized to 5 MPa to minimise the compressibility of nitrogen, with an additional 2 MPa of confining pressure. For both experiments, nitrogen is initially injected (the drainage step), after which brine is injected (the imbibition step). There are two injection scenarios, during drainage, discussed in this work: high to low (referred herein as H2L) and low to high (referred herein as L2H). The flow rate during the high flow rate period was 1.8ml/min for 1hr. The flow rate during the low flow rate period was 0.6ml/min for 1hr. The flow rate during imbibition was constant at 1.2ml/min for 8 minutes.
The total volume of gas injected was kept constant at 144ml (108ml during high flow, and 36ml during low flow). The volume of brine injected was kept constant at 10 ml. For this sample, 1 pore volume is approximately 5ml. This means around 20 pore volumes (PVs) were injected during high flow, 7 PVs were injected during low flow, and 2 PVs were injected during imbibition.
2.2 X-ray imaging
The X-ray imaging was performed with the “High Energy Micro-CT Optimized for Research” scanner (HECTOR) at the center for X-ray tomography at Ghent University. The sample was exposed to X-ray radiation with a peak energy of 160 keV. Each tomogram contained 2101 projections. Two scans were required to capture the length of the core, with each scan lasting 20 minutes. One set of scans were taken during high flow, and also during low flow, at the end of drainage, and at the end of imbibition, resulting in 8 scans for the 4 stages of each injection scenario.
2.3 Image Analysis
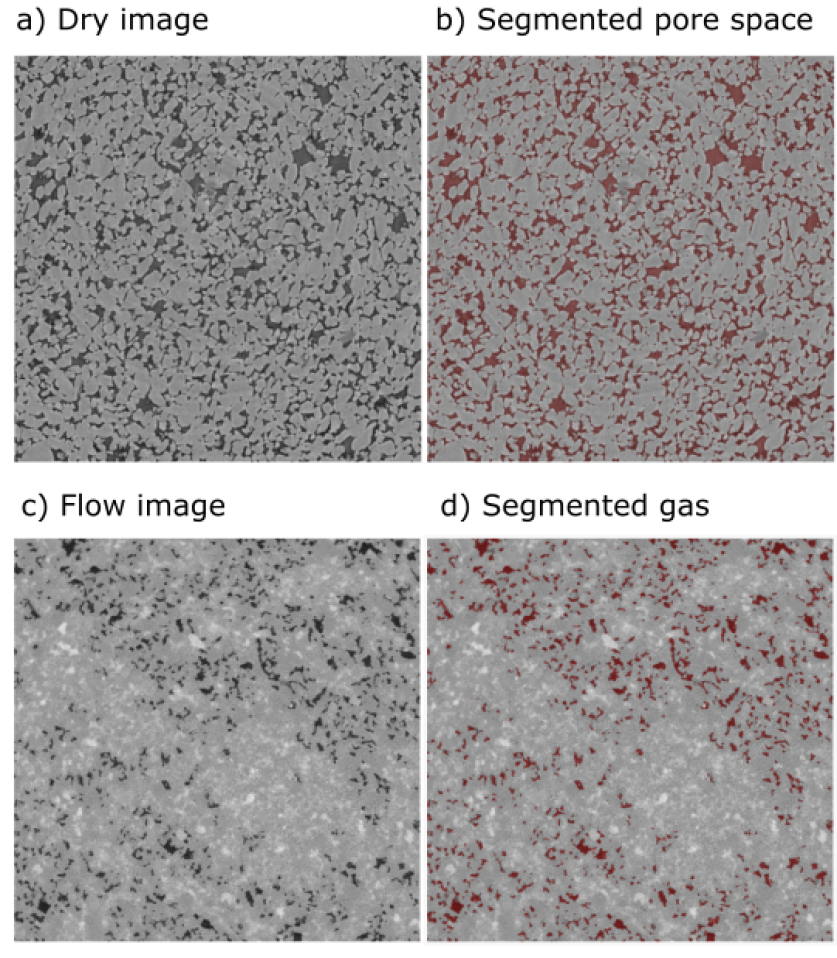
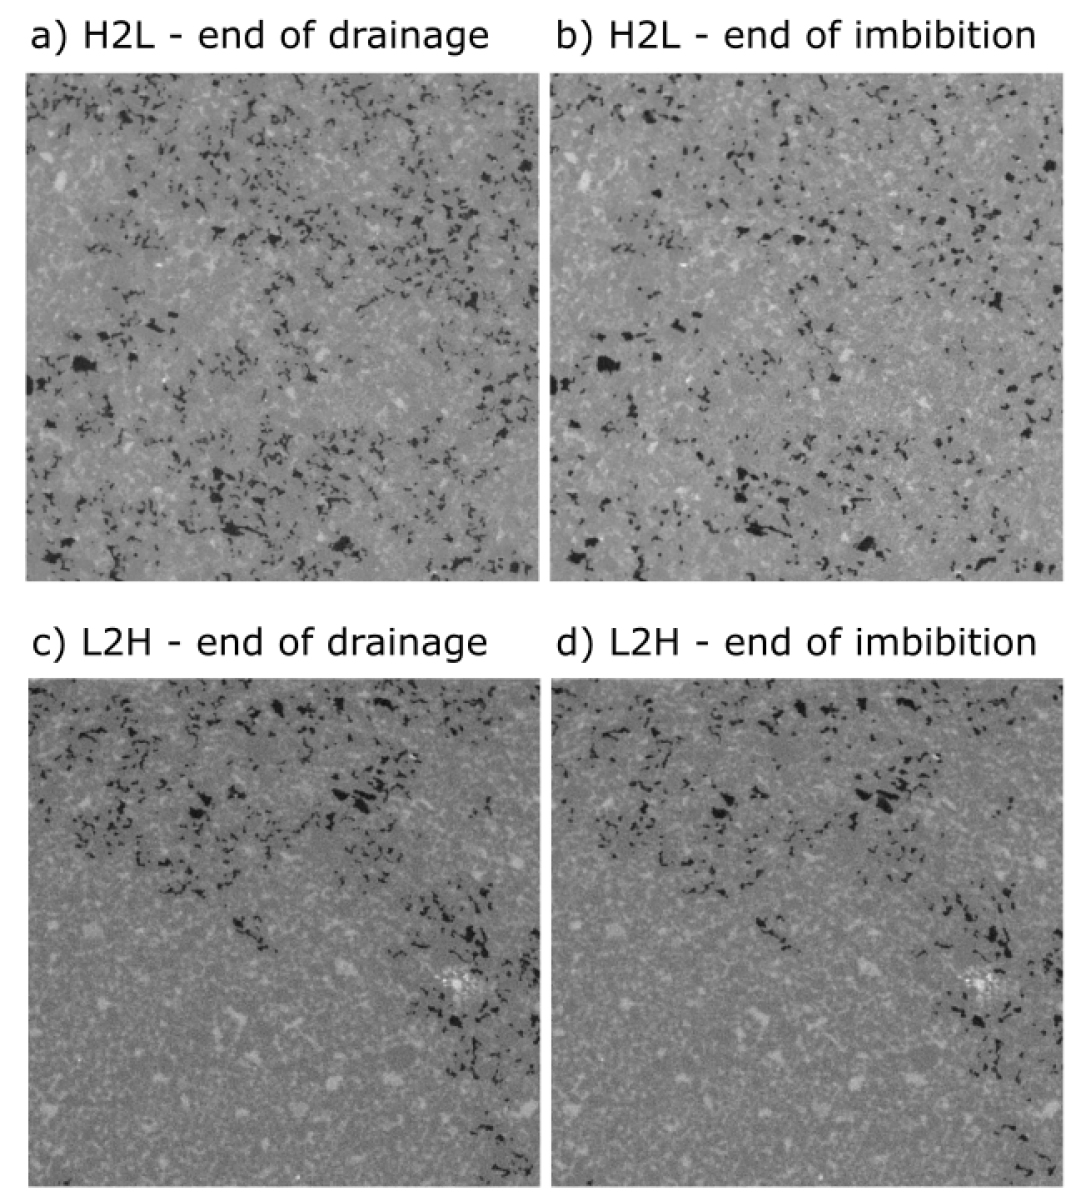
The voxel size for the images acquired was 20 . The images analyzed were mm in size (this means that dynamics do occur outside the field of view in the direction of flow, but the entire cross section of the core was imaged). The images were reconstructed from the X-ray projections, then filtered with a non-local means filter to suppress noise, while maintaining the information of phase boundaries [Schlüter \BOthers. (\APACyear2014)]. Prior to the flow experiments, an image with only air in the pore space was taken. This image is used to segment the pore space from the rock grains using a watershed segmentation algorithm. All subsequent images are registered to this image. Then the sample was saturated with brine and imaged, with all subsequent images with the gas and brine present subtracted from this image to locate the gas. From this, the gas is segmented using a simple greyscale value threshold. The pore space was overlain on this segmentation to locate the pore space occupied with brine. The segmentation of the pore space is shown in Figure 1 a-b, and the segmentation of the gas is shown in Figure 1 c-d.
The image analysis workflow is available on Github: https://github.com/cspurin/image_processing.git, and described in detail in the Supplementary Information.
3 Results and Discussion
3.1 The impact of injection scenario on saturation during drainage
The gas distribution across the core for the different injection scenarios (H2L and L2H) is shown in Figure 2a-d; only the gas is shown, with the rock grains and brine transparent. Each color corresponds to a different ganglion of gas to highlight gas connectivity across the core. The slice averaged saturation across the core during high flow and low flow for both injection scenarios is quantified in Figure 2e.
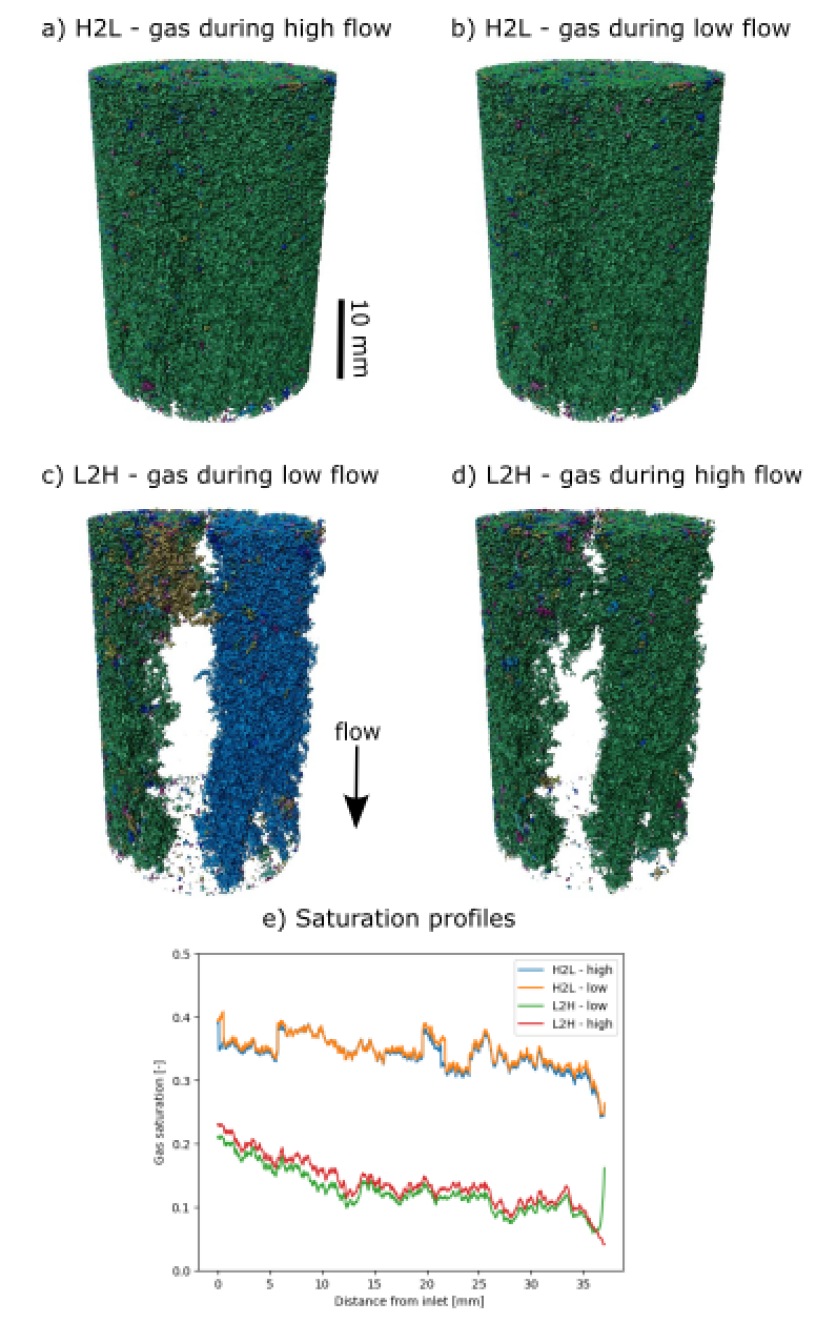
For the H2L experiment, the decrease in flow rate does not change the slice averaged saturation, as shown in Figure 2e. However, this does not mean that no fluid rearrangement occurred, as discussed in the next section. For the L2H experiment, the increase in flow rate only increases the gas saturation slightly. In Figure 2 c and d, there is a marked increase in connectivity of the gas phase during high flow, heavily linked to the heterogeneous band in the middle of the sample. This is discussed in the next section.
During low flow in the L2H experiment, a flow path for the gas across the core was established (see Figure 2c). When the flow rate was increased, the saturation change was small, leading to a lower saturation at the end of drainage than the H2L experiment (see Figure 2 e), even though the maximum flow rate, and the volume injected at both flow rates was the same for both injection scenarios. Thus, once a flow path is established, a change in pore occupancy is less likely to occur, for a given flow rate. The pressure generated by the high-rate injection can dissipate more easily if a flow path is already established. Therefore, there is a smaller difference between the two fluids present, hence less displacement.
Overall, the largest pore volume utilisation was during the H2L experiment. As the volume injected was the same, this implies that, if upscaled, that a H2L injection regime will minimise plume spread for a given volume of gas, due to a more compact displacement. Once a pathway across the pore space is established, it is more difficult to increase pore volume utilisation. This implies that inreasing the flow rate with time leads to an irreversible reduction in the pore space accessible for the gas.
3.2 The impact of injection scenario on gas connectivity during drainage
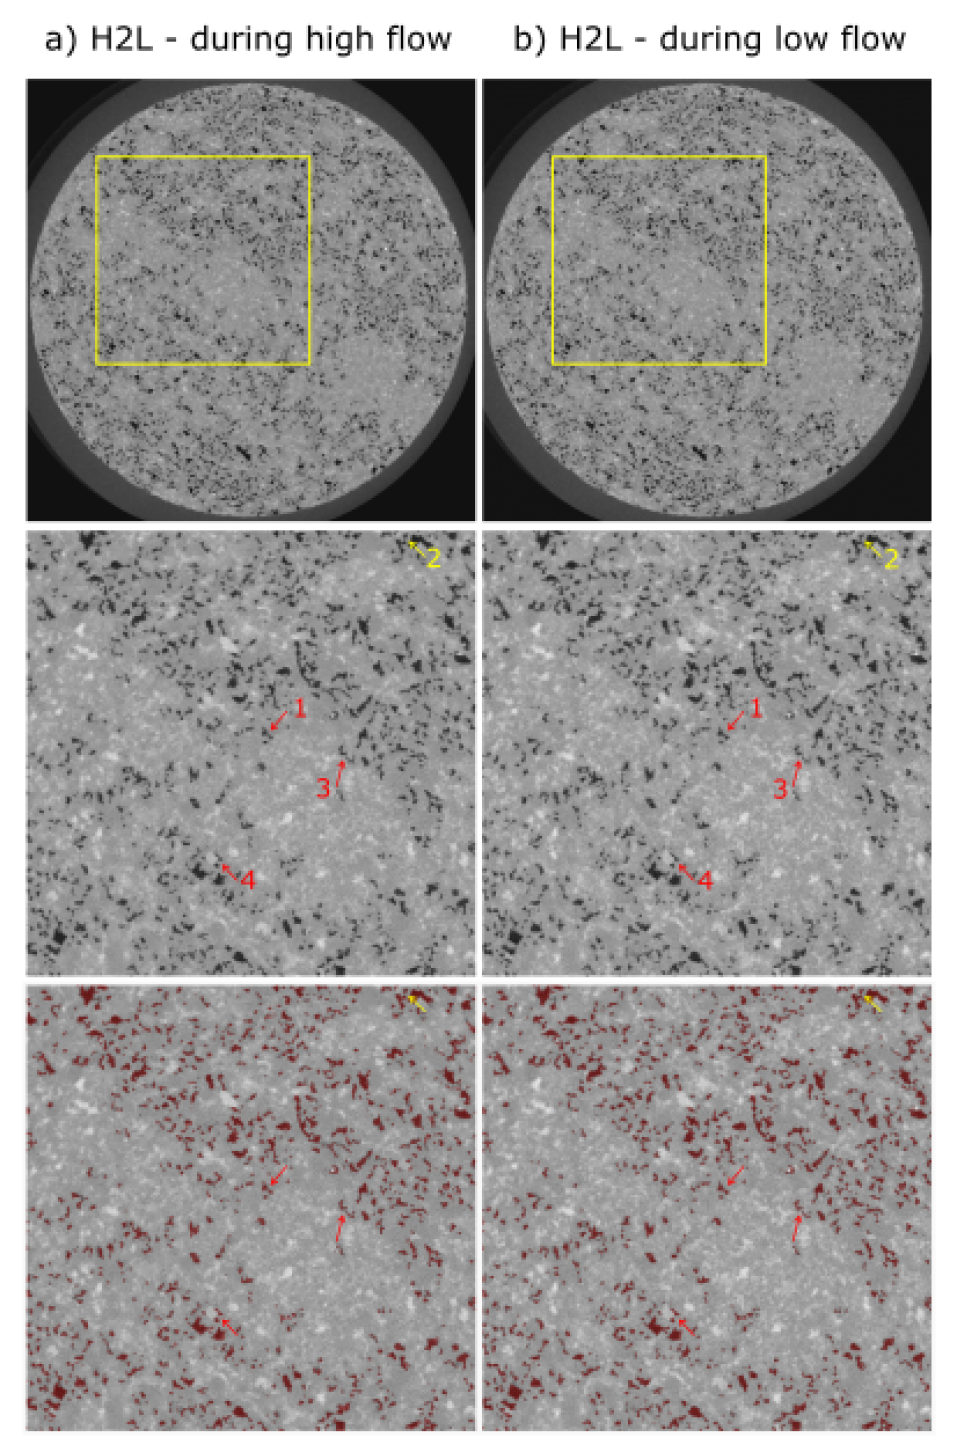
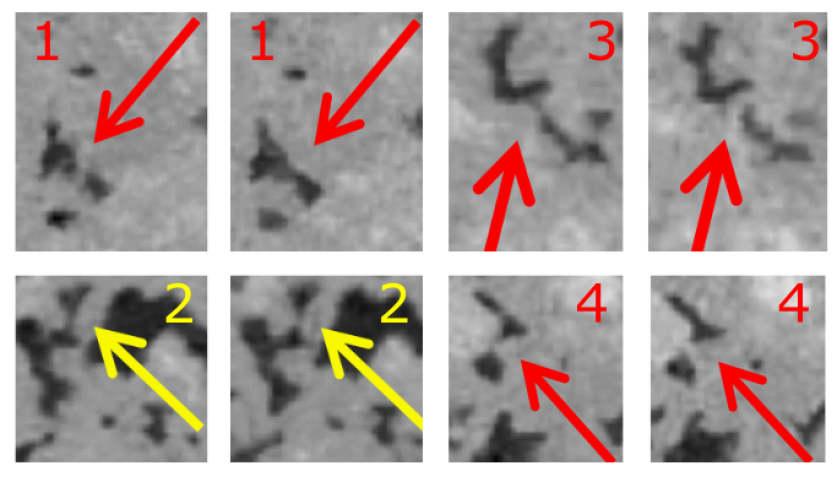
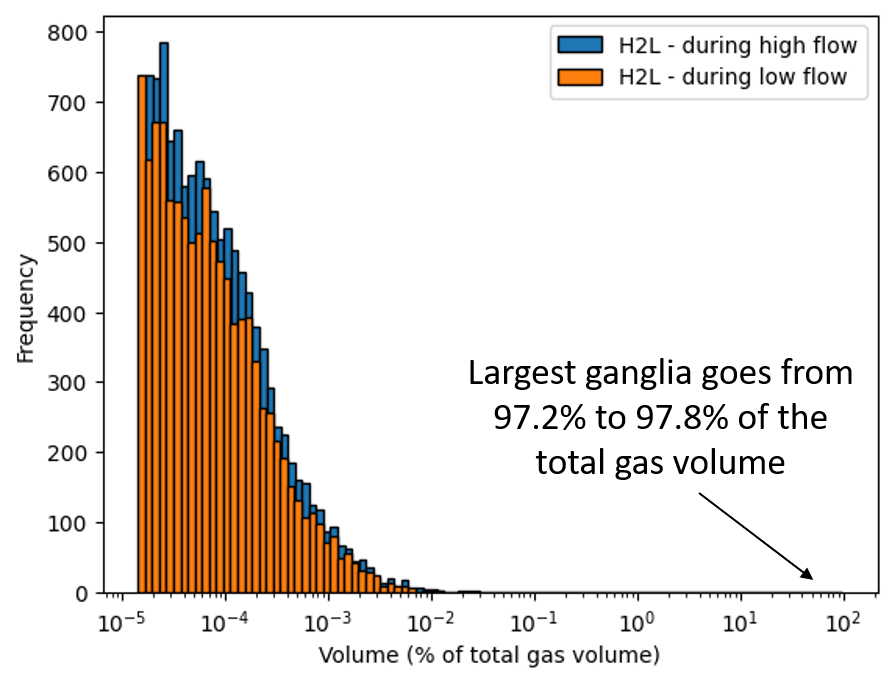
For the H2L experiment, the decrease in flow rate causes a number of small rearrangements of the fluids in the pore space. Both snap-off and connection of the gas is observable, as shown in Figure 3 and Figure 4. These events are small, with the largest ganglion contributing 97.2% of the total gas volume, but collectively influence the connectivity of the gas. As shown in Figure 6, the smaller ganglia decrease in frequency for all ganglion sizes, with the largest ganglion increasing in volume to 97.8% of the total gas volume as a result. The total number of ganglia reduces by approximately 13%, from 12,442 to 10,835. While saturation changes across the core are small (all within 2%, see Figure 2e), the connectivity in the small ganglia changes significantly. Previous research suggested that lowering the flow rate would favour snap-off, which would encourage trapping [Hughes \BBA Blunt (\APACyear2000), Herring \BOthers. (\APACyear2015)]. While we observe snap-off events, the global trend is for the smaller ganglia to connect to the main flow pathway, reducing the volume of disconnected gas at the end of drainage.

For the L2H experiment, the increase in flow rate causes some filling events, which greatly increases the connectivity of the gas phase, shown qualitatively in Figure 2 c-d and Figure 5. The number of ganglia decreases from 5,922 to 4,771, a change of 24%, relative to a 9% increase in saturation. The largest ganglion increases in volume, from 58.9% of the total gas volume, to 94.9% of the total gas volume. This large increase is due to the connection of the two sides either side of the unoccupied band.
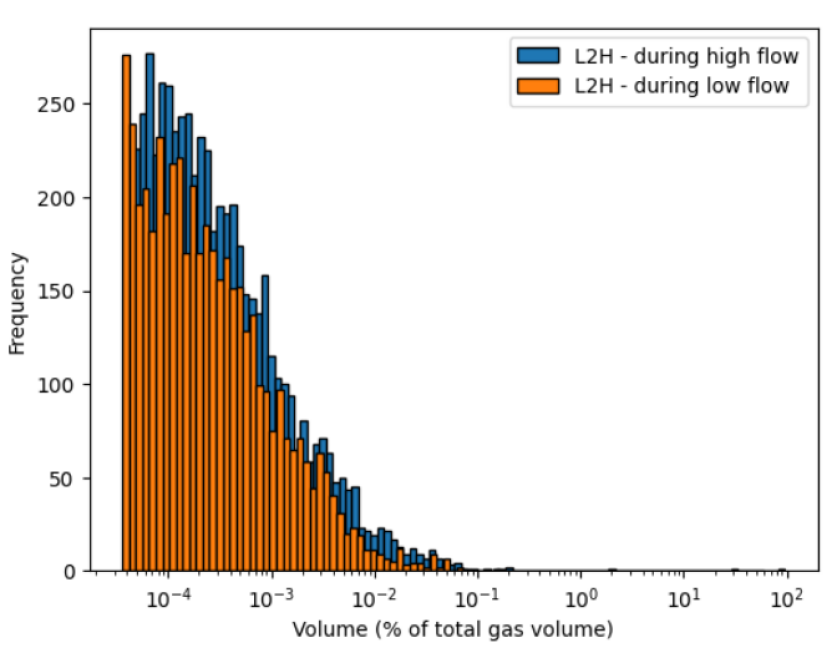
The increase in flow rate also increases the number of smaller ganglia, as shown in Figure 7. Thus, there is filling that increases connectivity, and also filling that does not improve connectivity, with the filling events improving connectivity outweighing the filling events that do not. While connectivity increases, there is a band completely unoccupied by gas in the middle of the sample, even at the end of drainage, observable in Figure 2 c-d. During the H2L experiment, this band is filled with gas.
3.3 The impact of injection scenario on trapping efficiency
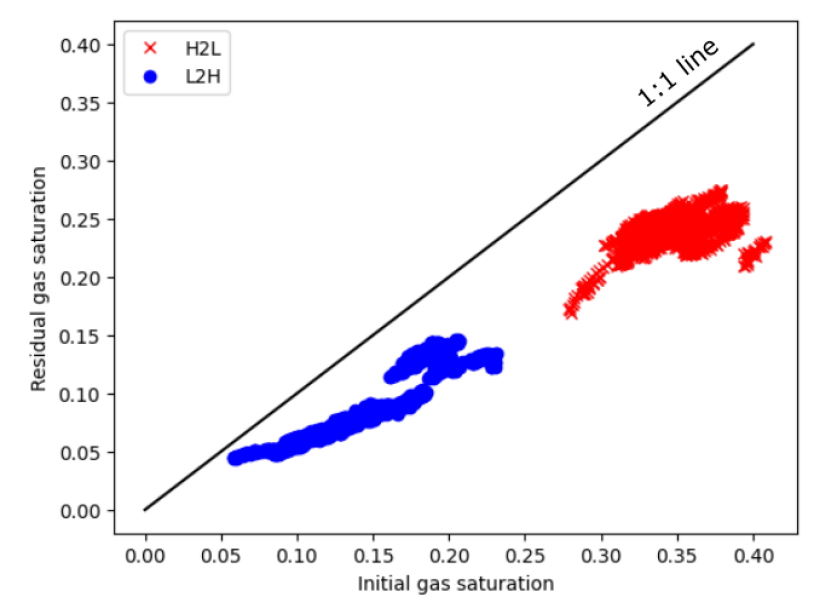

The initial gas saturation (the saturation at the end of drainage) is plotted against the residual gas saturation (the saturation at the end of imbibition) to obtain the trapping efficiency for both experiments. This is shown in Figure 8. For the L2H experiment, the initial gas saturation is lower, but trapping efficiency is similar for both experiments. Thus, the H2L experiment presents a more favourable trapping scenario.
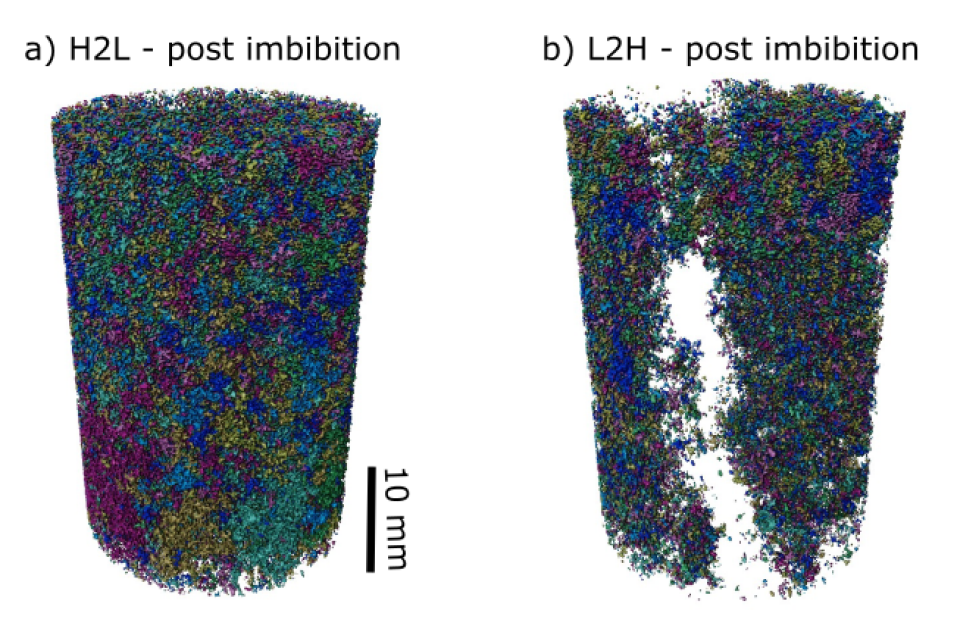
As can be observed qualitatively in Figure 9 and Figure 10, there are larger gas ganglia post imbibition for the H2L imbibition experiment. This is quantified in Figure 11, with some much larger ganglia present at the end of imbibition for the H2L experiment (over an order of magnitude larger than the largest ganglia present at the end of imbibition for the L2H experiment). The largest ganglia for the H2L experiment contributes 5% of the total gas volume, compared to 2% of the total gas volume for the L2H experiment, so the gas ganglia are relatively disconnected in both cases. For the H2L experiment, there are also more smaller disconnected regions.
4 Conclusions
In this work, we show that the injection scenario influences the extent of the pore volume accessed by the gas, and the amount of residual trapping. Starting at a high flow rate, which subsequently decreases, causes a larger volume of the pore space to be accessed by the gas. While the trapping efficiency is slightly higher in the experiment where the flow rate is increased, the water channels through part of the sample not accessed by the gas. This means the control on trapping efficiency could be dependent on the heterogeneity of the sample. Further work should explore different lithologies, so that the role of heterogeneity could be assessed. Variations in pore space accessibility could be less if the sample is more homogeneous, or when averaged over a larger volume, which would influence residual trapping. However, this needs to be explored in more detail.
The high to low injection scenario is the most favourable in terms of total amount of gas trapped related to gas injected. However, there are other implications that control the injection of gas into the subsurface, such as minimising the maximum pressure to prevent fracturing. This must be kept in mind when developing an injection protocol for subsurface storage. While starting at a lower flow rate is associated with a lower risk for fracturing, increasing the flow rate at a later time does not significantly change the relative amount of the pore volume accessed, or the average saturation. This would translate at the field scale to the gas plume spreading out further and slower stabilisation times.
5 Acknowledgements
Catherine Spurin and Hamdi Tchelepi acknowledge support from the GeoCquest consortium. Sharon Ellman is a PhD Fellow with the Research Foundation – Flanders (FWO) and acknowledges its support under grant 1182822N. T. Bultreys holds a senior postdoctoral fellowship from the Research Foundation-Flanders (FWO) under Grant No. 12X0922N. This research also received funding from the Research Foundation–Flanders under grant G051418N, G004820N and the UGent BOF funding for the Centre of Expertise UGCT (BOF.EXP.2017.0007).
References
- Bannach \BOthers. (\APACyear2015) \APACinsertmetastarbannach2015stable{APACrefauthors}Bannach, A., Hauer, R., Streibel, M., Kühn, M.\BCBL \BBA Stienstra, G. \APACrefYearMonthDay2015. \BBOQ\APACrefatitleStable large-scale CO2 storage in defiance of an energy system based on renewable energy–modelling the impact of varying CO2 injection rates on reservoir behavior Stable large-scale co2 storage in defiance of an energy system based on renewable energy–modelling the impact of varying co2 injection rates on reservoir behavior.\BBCQ \APACjournalVolNumPagesEnergy Procedia76573–581. \PrintBackRefs\CurrentBib
- Benson \BOthers. (\APACyear2012) \APACinsertmetastarbenson2012carbon{APACrefauthors}Benson, S\BPBIM., Bennaceur, K., Cook, P., Davison, J., de Coninck, H., Farhat, K.\BDBLothers \APACrefYearMonthDay2012. \BBOQ\APACrefatitleCarbon capture and storage Carbon capture and storage.\BBCQ \APACjournalVolNumPagesGlobal energy assessment-Toward a sustainable future993. \PrintBackRefs\CurrentBib
- Blunt (\APACyear2017) \APACinsertmetastarbluntbook{APACrefauthors}Blunt, M\BPBIJ. \APACrefYear2017. \APACrefbtitleMultiphase Flow in Permeable Media: A Pore-Scale Perspective Multiphase flow in permeable media: A pore-scale perspective. \APACaddressPublisherCambridge University Press. \PrintBackRefs\CurrentBib
- Herring \BOthers. (\APACyear2015) \APACinsertmetastarherring2015efficiently{APACrefauthors}Herring, A\BPBIL., Andersson, L., Schlüter, S., Sheppard, A.\BCBL \BBA Wildenschild, D. \APACrefYearMonthDay2015. \BBOQ\APACrefatitleEfficiently engineering pore-scale processes: The role of force dominance and topology during nonwetting phase trapping in porous media Efficiently engineering pore-scale processes: The role of force dominance and topology during nonwetting phase trapping in porous media.\BBCQ \APACjournalVolNumPagesAdvances in Water Resources7991–102. \PrintBackRefs\CurrentBib
- Hughes \BBA Blunt (\APACyear2000) \APACinsertmetastarhughes2000pore{APACrefauthors}Hughes, R\BPBIG.\BCBT \BBA Blunt, M\BPBIJ. \APACrefYearMonthDay2000. \BBOQ\APACrefatitlePore scale modeling of rate effects in imbibition Pore scale modeling of rate effects in imbibition.\BBCQ \APACjournalVolNumPagesTransport in Porous Media403295–322. \PrintBackRefs\CurrentBib
- IPCC (\APACyear2014) \APACinsertmetastaripcc2014mitigation{APACrefauthors}IPCC. \APACrefYearMonthDay2014. \BBOQ\APACrefatitleMitigation of climate change. Contribution of working group III to the fifth assessment report of the intergovernmental panel on climate change Mitigation of climate change. contribution of working group iii to the fifth assessment report of the intergovernmental panel on climate change.\BBCQ \APACjournalVolNumPagesCambridge University Press, Cambridge, United Kingdom and New York, NY, USA. \PrintBackRefs\CurrentBib
- Kolster \BOthers. (\APACyear2018) \APACinsertmetastarkolster2018impact{APACrefauthors}Kolster, C., Agada, S., Mac Dowell, N.\BCBL \BBA Krevor, S. \APACrefYearMonthDay2018. \BBOQ\APACrefatitleThe impact of time-varying CO2 injection rate on large scale storage in the UK Bunter Sandstone The impact of time-varying co2 injection rate on large scale storage in the uk bunter sandstone.\BBCQ \APACjournalVolNumPagesInternational Journal of Greenhouse Gas Control6877–85. \PrintBackRefs\CurrentBib
- Krevor \BOthers. (\APACyear2015) \APACinsertmetastarkrevor2015capillary{APACrefauthors}Krevor, S., Blunt, M\BPBIJ., Benson, S\BPBIM., Pentland, C\BPBIH., Reynolds, C., Al-Menhali, A.\BCBL \BBA Niu, B. \APACrefYearMonthDay2015. \BBOQ\APACrefatitleCapillary trapping for geologic carbon dioxide storage–From pore scale physics to field scale implications Capillary trapping for geologic carbon dioxide storage–from pore scale physics to field scale implications.\BBCQ \APACjournalVolNumPagesInternational Journal of Greenhouse Gas Control40221–237. \PrintBackRefs\CurrentBib
- Land (\APACyear1968) \APACinsertmetastarland1968calculation{APACrefauthors}Land, C\BPBIS. \APACrefYearMonthDay1968. \BBOQ\APACrefatitleCalculation of imbibition relative permeability for two-and three-phase flow from rock properties Calculation of imbibition relative permeability for two-and three-phase flow from rock properties.\BBCQ \APACjournalVolNumPagesSociety of Petroleum Engineers Journal802149–156. \PrintBackRefs\CurrentBib
- Li \BOthers. (\APACyear2019) \APACinsertmetastarli2019effects{APACrefauthors}Li, C., Maggi, F., Zhang, K., Guo, C., Gan, Y., El-Zein, A.\BDBLShen, L. \APACrefYearMonthDay2019. \BBOQ\APACrefatitleEffects of variable injection rate on reservoir responses and implications for CO2 storage in saline aquifers Effects of variable injection rate on reservoir responses and implications for co2 storage in saline aquifers.\BBCQ \APACjournalVolNumPagesGreenhouse Gases: Science and Technology94652–671. \PrintBackRefs\CurrentBib
- MacMinn \BOthers. (\APACyear2010) \APACinsertmetastarmacminn2010co2{APACrefauthors}MacMinn, C\BPBIW., Szulczewski, M\BPBIL.\BCBL \BBA Juanes, R. \APACrefYearMonthDay2010. \BBOQ\APACrefatitleCO2 migration in saline aquifers. Part 1. Capillary trapping under slope and groundwater flow Co2 migration in saline aquifers. part 1. capillary trapping under slope and groundwater flow.\BBCQ \APACjournalVolNumPagesJournal of fluid mechanics662329–351. \PrintBackRefs\CurrentBib
- Niu \BOthers. (\APACyear2015) \APACinsertmetastarniu2015impact{APACrefauthors}Niu, B., Al-Menhali, A.\BCBL \BBA Krevor, S\BPBIC. \APACrefYearMonthDay2015. \BBOQ\APACrefatitleThe impact of reservoir conditions on the residual trapping of carbon dioxide in B erea sandstone The impact of reservoir conditions on the residual trapping of carbon dioxide in b erea sandstone.\BBCQ \APACjournalVolNumPagesWater Resources Research5142009–2029. \PrintBackRefs\CurrentBib
- Rubin \BBA De Coninck (\APACyear2005) \APACinsertmetastarrubin2005ipcc{APACrefauthors}Rubin, E.\BCBT \BBA De Coninck, H. \APACrefYearMonthDay2005. \BBOQ\APACrefatitleIPCC special report on carbon dioxide capture and storage Ipcc special report on carbon dioxide capture and storage.\BBCQ \APACjournalVolNumPagesUK: Cambridge University Press. TNO (2004): Cost Curves for CO2 Storage, Part214. \PrintBackRefs\CurrentBib
- Schlüter \BOthers. (\APACyear2014) \APACinsertmetastarschluter2014image{APACrefauthors}Schlüter, S., Sheppard, A., Brown, K.\BCBL \BBA Wildenschild, D. \APACrefYearMonthDay2014. \BBOQ\APACrefatitleImage processing of multiphase images obtained via X-ray microtomography: a review Image processing of multiphase images obtained via x-ray microtomography: a review.\BBCQ \APACjournalVolNumPagesWater Resources Research5043615–3639. \PrintBackRefs\CurrentBib
- Shamshiri \BBA Jafarpour (\APACyear2012) \APACinsertmetastarshamshiri2012controlled{APACrefauthors}Shamshiri, H.\BCBT \BBA Jafarpour, B. \APACrefYearMonthDay2012. \BBOQ\APACrefatitleControlled CO2 injection into heterogeneous geologic formations for improved solubility and residual trapping Controlled co2 injection into heterogeneous geologic formations for improved solubility and residual trapping.\BBCQ \APACjournalVolNumPagesWater Resources Research482. \PrintBackRefs\CurrentBib
- Szulczewski \BOthers. (\APACyear2012) \APACinsertmetastarszulczewski2012lifetime{APACrefauthors}Szulczewski, M\BPBIL., MacMinn, C\BPBIW., Herzog, H\BPBIJ.\BCBL \BBA Juanes, R. \APACrefYearMonthDay2012. \BBOQ\APACrefatitleLifetime of carbon capture and storage as a climate-change mitigation technology Lifetime of carbon capture and storage as a climate-change mitigation technology.\BBCQ \APACjournalVolNumPagesProceedings of the National Academy of Sciences109145185–5189. \PrintBackRefs\CurrentBib
- Wang \BOthers. (\APACyear2023) \APACinsertmetastarwang2023pore{APACrefauthors}Wang, S., Spurin, C.\BCBL \BBA Bultreys, T. \APACrefYearMonthDay2023. \BBOQ\APACrefatitlePore-scale imaging of multiphase flow fluctuations in core-scale samples Pore-scale imaging of multiphase flow fluctuations in core-scale samples.\BBCQ \APACjournalVolNumPagesAuthorea Preprints. \PrintBackRefs\CurrentBib
- Wildenschild \BOthers. (\APACyear2001) \APACinsertmetastarwildenschild2001flow{APACrefauthors}Wildenschild, D., Hopmans, J.\BCBL \BBA Simunek, J. \APACrefYearMonthDay2001. \BBOQ\APACrefatitleFlow rate dependence of soil hydraulic characteristics Flow rate dependence of soil hydraulic characteristics.\BBCQ \APACjournalVolNumPagesSoil Science Society of America Journal65135–48. \PrintBackRefs\CurrentBib
- Zhang \BOthers. (\APACyear2023) \APACinsertmetastarzhang2023impact{APACrefauthors}Zhang, H., Al Kobaisi, M.\BCBL \BBA Arif, M. \APACrefYearMonthDay2023. \BBOQ\APACrefatitleImpact of wettability and injection rate on CO2 plume migration and trapping capacity: A numerical investigation Impact of wettability and injection rate on co2 plume migration and trapping capacity: A numerical investigation.\BBCQ \APACjournalVolNumPagesFuel331125721. \PrintBackRefs\CurrentBib