Test to the Performance of a LGAD Based Zero Degree Detector on CSNS Back-n Beamline
Abstract
A comprehensive and reliable nuclear database of neutron-induced process is required by the development of Accelerator-Driven System technology. Although many excellent efforts have been made, the measurements to the fission fragment in zero degree of the beam direction is not perfect enough. Most detector can not work constantly under the strike of intense flux neutron beam, thus their application as Zero Degree Detector (ZDD) is greatly limited. Recently, the Low Gain Avalanche Diode (LGAD) technology has been developed to meet the complicated and several requirement of ATLAS on Large Hadron Collider (LHC) and could survive after irradiation. With its 50 µm active thickness, 30 ps temporal resolution, low cost and good radiation hardness property, the LGAD detector is expected to be an excellent candidate for the use of a Zero Degree Detector in neutron-induced process data measurements. This paper represents a performance test to LGAD detector when it is used as a ZDD on the Back-streaming Neutron (Back-n) beamline at CSNS. Measuring to the cross section of , it shows that the LGAD performs well as a ZDD based on a good agreement with the data from ENDF database.
Index Terms:
TBDI Introduction
Accelerator-Driven Systems (ADS) is one of the promising technology for future nuclear power plants. It will not only enhance the safety measures for controlling conventional nuclear reactors but also improve the efficiency of nuclear fuel utilization. However, the development of ADS technology necessitates a comprehensive and reliable nuclear database of neutron-induced processes, which is yet to be fully achieved and requires significant efforts. [1]
The cross section and the angular distributions of the fragments are important issues of neutron induced process data measurement. Many beneficial works have been done to measure the angular distributions, with gaseous or silicon detector series setup. [2, 3, 4, 5, 6, 7] However, the measurement of fragments distributions in zero degree direction of the neutron beam direction is a challenging work. This is primarily due to the direct irradiation of the zero-degree detectors (ZDD) by the neutron beam. Gaseous detectors, in this scenario, are easily interrupted by sparks, while silicon detectors are bothered by the irradiation damage.
Recent studies have focused on exploring new types of detectors that could potentially be used for ZDD. SiC (silicon carbide) detectors [8] and diamond detectors [9] are considered to be promising candidates due to their excellent anti-irradiation properties because of their wide forbidden band gaps. However, the application of SiC detectors is limited by their small surface area and large thickness, while diamond detectors are too expensive for widespread use. Further research is needed to overcome these limitations and find cost-effective solutions for implementing ZDD in neutron-induced process measurements.
In recent years, many advanced detector technologies are being developed to meet the high-performance requirements of the Large Hadron Collider (LHC). [10] The Low Gain Avalanche Diode (LGAD) [11] technology is one of them that is particularly well-suited for the ZDD applications. The LGAD detector is N-on-P silicon sensor fabricated on 50 µm epitaxial layer of a p-type silicon bulk. A moderate internal gain, typically ranging from 10 to 30 is achieved by establishing high electric field within the multiplication layer between the p-n junction, and consequently enhances the temporal resolution to 30 ps approximately. LGAD detectors offer excellent timing resolution and radiation hardness, making them highly suitable for precise measurements in high-energy physics experiments. [12] Table I lists some important performance parameters of LGAD.
| Performance | Parameters |
| segmentation dimensions | |
| active thickness | 50 µm |
| temporal resolution | 30 ps |
| gain | 1030 |
The active thickness of LGAD is 50 µm. Neutrons and have a minimal tendency to deposit energy within the sensitive volume of a detector, whereas ionized particles have the ability to fully deposit their energy. Additionally, it can be produced as a detector array with a pixel size of about , which enables the simultaneous detection of both light and heavy particles. Furthermore, the LGAD detector offers a temporal resolution of approximately 30 ps, which greatly benefits the measurement of neutron energy using the time-of-flight method. With these advantages, there is a promising potential for the LGAD detector to be utilized as the ZDD in the measurement of the angular distribution of neutron-induced process fragments.
In order to check this idea, experimental tests were conducted on the Back-n beamline at the China Spallation Neutron Source (CSNS). This paper is organized as the followings. The experimental setup is introduced in Sec.II, including the general properties of CSNS and Back-n, a preliminary ZDD setup and the corresponding DAQ electronics. The analysis to the data collected and the results are introduced in the subsequent section. Finally, the conclusion will be presented in the last section, as well as the insights into the potential applications of the LGAD detector as a ZDD for measuring the angular distribution of neutron-induced charged particles.
II Experimental Setup
II-A Back-n Beamline
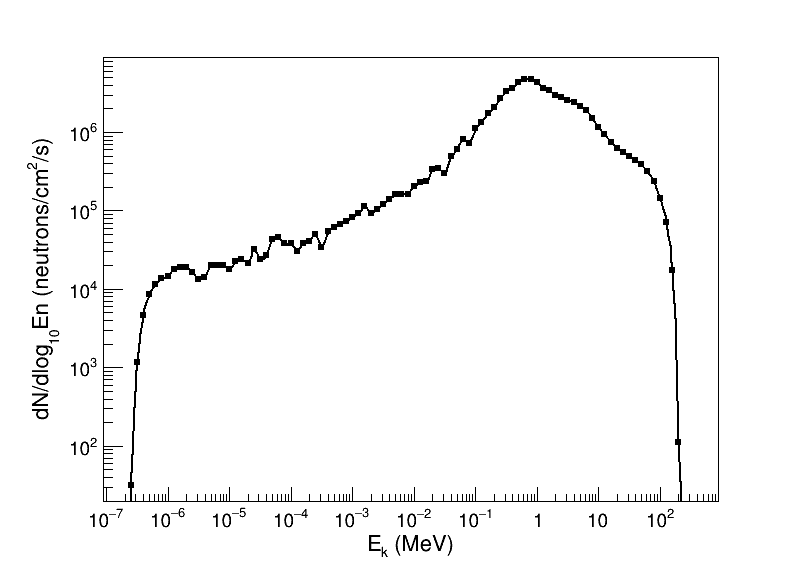
The Back-n is a white neutron beamline that has been constructed within the China Spallation Neutron Source (CSNS). Its primary purpose is to facilitate multidisciplinary research in material science through the utilization of neutron scattering methods. The accelerator operates in a double bunch mode, where two clusters of protons are generated with a time interval of 410 ns. These protons are then accelerated to a energy of 1.6 GeV within the Rapid Cycling Synchrotron (RCS). Subsequently, they collide with a tungsten target at a repetition frequency of 25 Hz. The designed beam power of CSNS in phase-I is 100 kW, which would be upgraded to 500 kW in phase-II. As a result of the spallation reaction, neutrons are produced and scattered in all directions, covering a solid angle. The Back-n takes advantage of the neutrons that back-stream in the direction of the incoming protons. As illustrated in Figure 1, the Back-n beamline offers a wide range of kinetic energy for neutrons, spanning from thermal neutron energy to several hundreds of MeV. Additionally, the flux density of the Back-n is at 100 kW. This characteristic makes it highly suitable for measuring neutron-induced process data. For a more comprehensive understanding of Back-n, please refer to [14].
II-B The Detector Setup
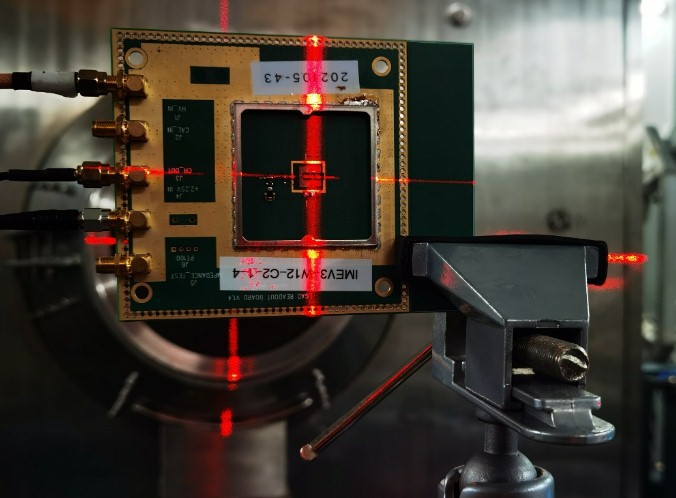
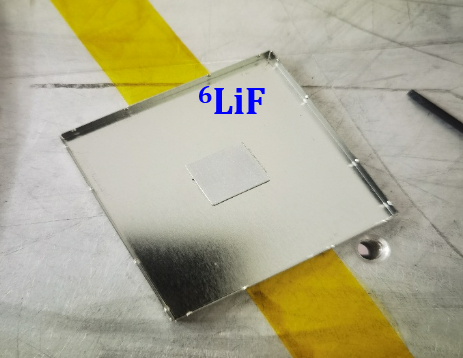
As illustrated in the top plot of Figure 2, a LGAD detector in size of is bonded onto a printed circuit board (PCB) along with a pre-amplifier. The detector applied is in batch of IHEP-IME, which is designed and fabricated independently by the Institute of High Energy Physics, CAS, China. [12] The signals generated by the detector are pre-amplified and subsequently read by the readout electronics, which will be discussed in detail later in the paper. To shield the detector from ambient light, an aluminum cover is placed on top of the PCB. Additionally, as illustrated in the bottom plot of Figure 2, a Lithium target is attached to the center of the cover, directly above the detector. The Lithium target consists of a 50 µm layer of plated on a 0.5 mm thick aluminum substrate. The detector is positioned closely to the target, with a separating distance of approximately 1 mm. For precise alignment, laser indicators are employed to guide the installation process, ensuring that the LGAD detector is accurately centered on the neutron beam. The distance between the detector and the center of the spallation target is measured to be 77.0 meters.
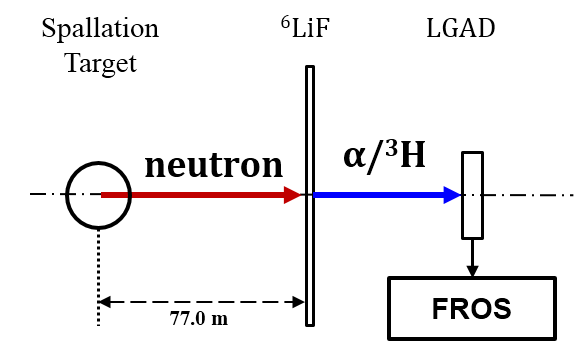
The experiment is illustrated in Figure 3. As the neutrons traverse the lithium target, will occurs in possibilities, resulting in the production of and tritium in solid angle. These secondary particles are then detected if they hit on the LGAD detector. The signals from the detector are read by the electronics FROS, which will be introduced in later section.
II-C The Readout System
II-C1 The Fast Read Out System
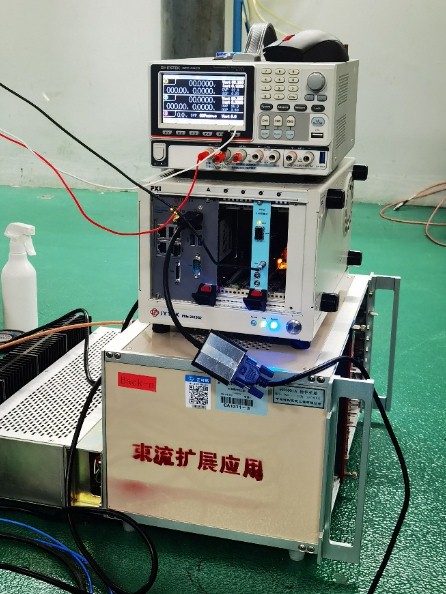
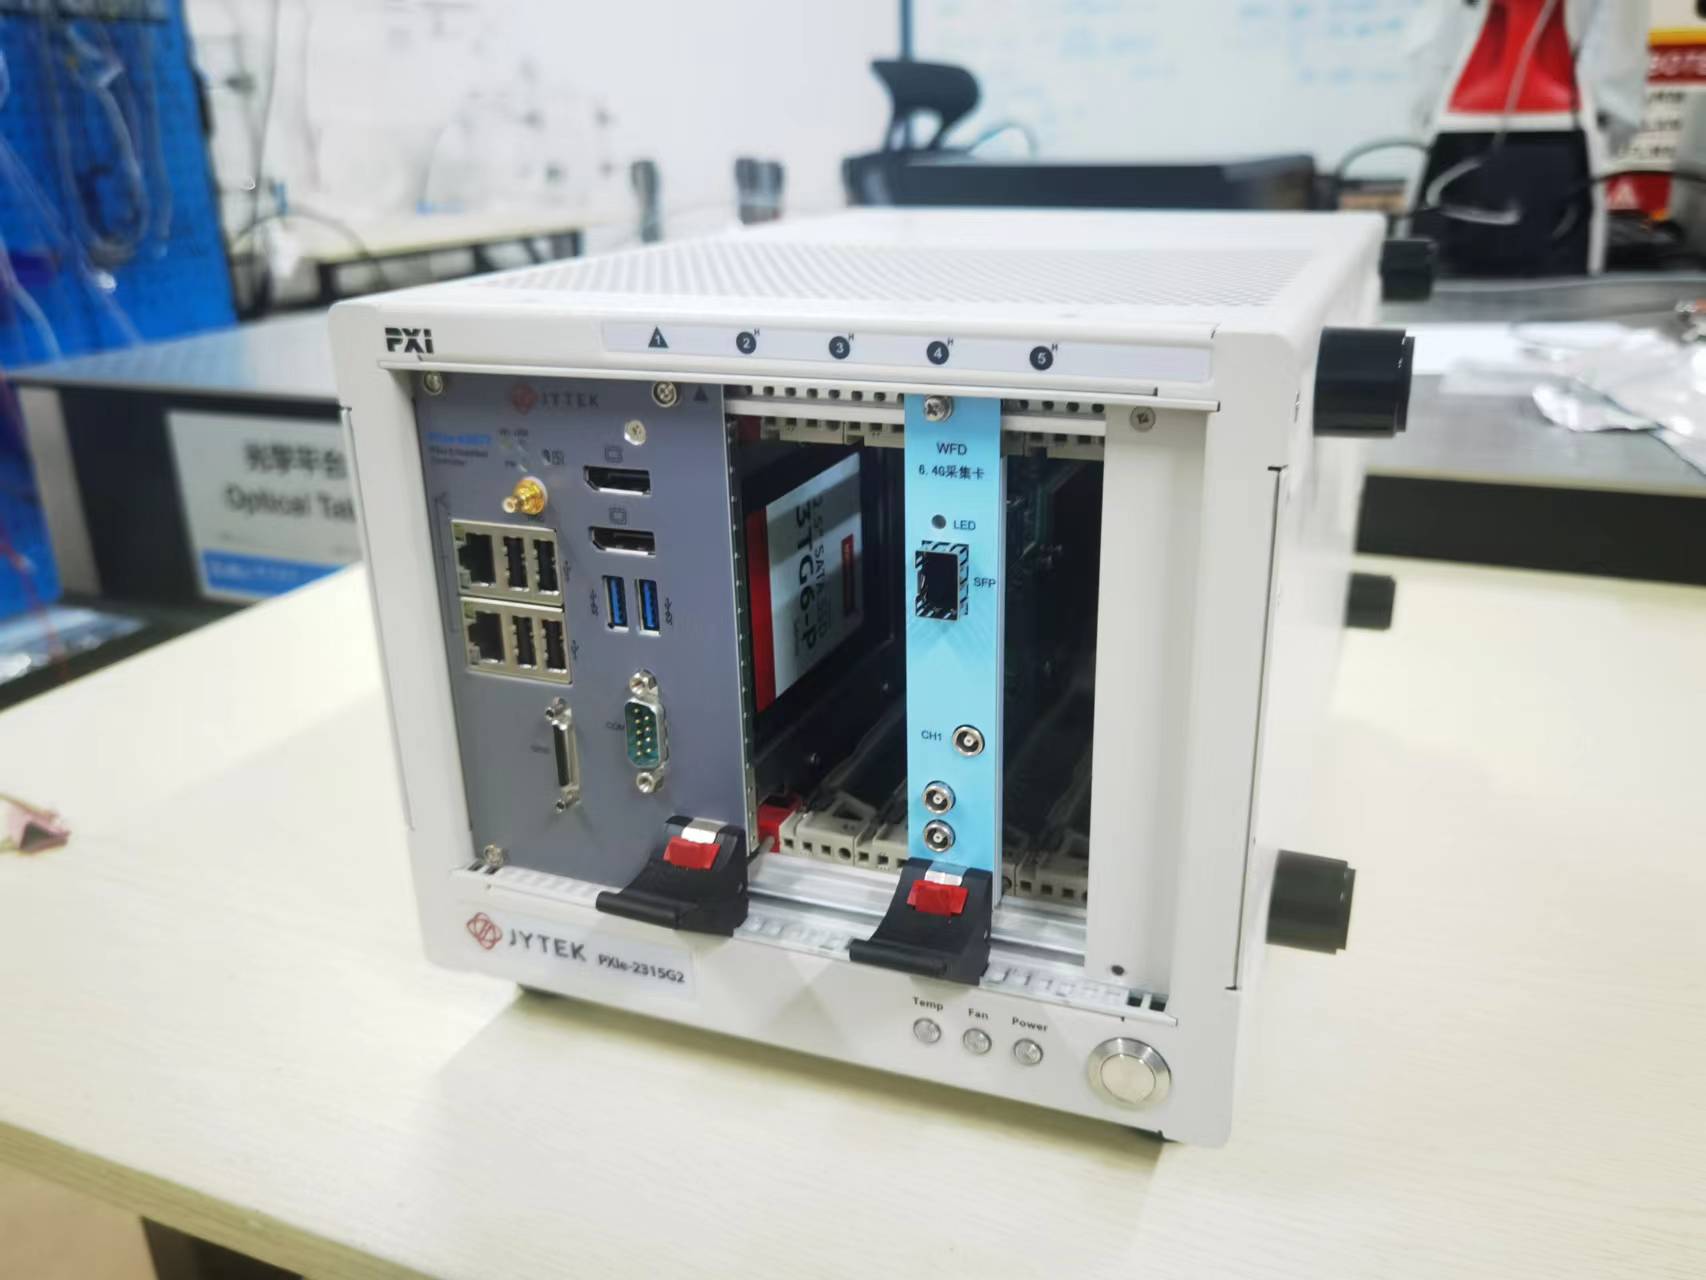
The LGAD detector is known for its high timing resolution capabilities. Its signal exhibits a rising time of approximately 700 ps and a full width of 2.5 ns. To effectively read such a fast signal, the readout electronics must be characterized by a high sampling rate and bandwidth. In this experiment, a Fast Read Out System (FROS) is employed to meet these requirements. The FROS is a high-speed readout system based on the PXIe protocol, as illustrated in Figure 4. The acquisition card used in the FROS setup is the PXIe-X1022, manufactured by Hefei EverACQ Technologies Co., Ltd. Each acquisition card is responsible for reading signals from a single channel, with a sampling rate of 6.4 Gsps and a bandwidth of 2 GHz. These cards are carried by a PXIe crate. The acquired data is digitized and then summarized by the controller PC of the crate. The FROS system is capable of supporting signals readout from one to 17 channels simultaneously.
To ensure synchronization, the clocks of the cards within the FROS are synchronized using a timer trigger card. A 25 Hz pulsed signal, referred to as the signal, serves as a time reference. This signal is generated by the RCS kicker when the protons are extracted from the RCS. The signal is accessible to the acquisition card, allowing for the recording of time differences between the sampling signals and the signal.
II-C2 Function Validation to FROS
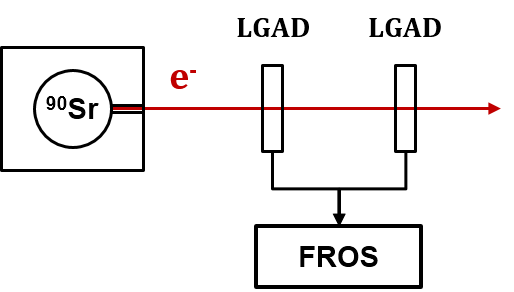
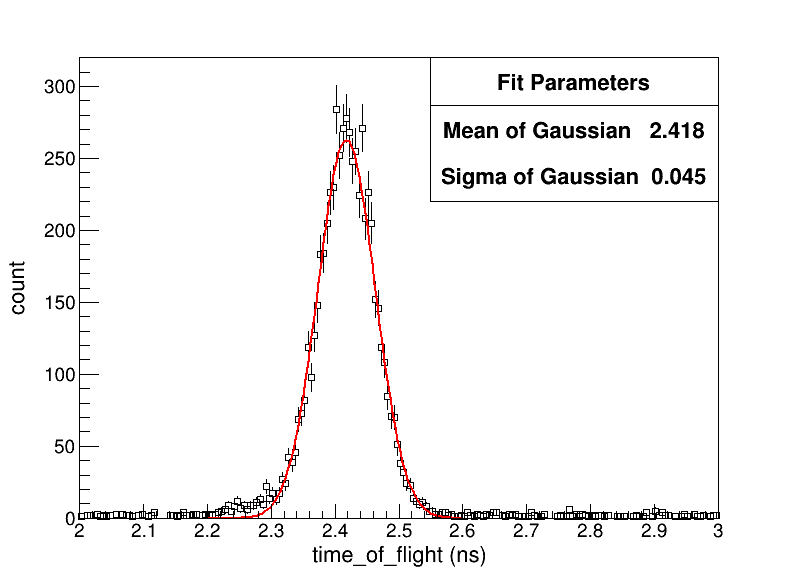
The performance of FROS is functionally validated as illustrated in Figure 5. Two LGAD detectors and a source are deployed in line. The electrons released from the source are collimated by the Lead enclosure of the source and directed to the LGAD detectors. Most of the electrons could go through the first LGAD and reach the second LGAD since they are in minimal ionization particle state. The signals from the both LGAD are expected to be recorded with a time difference, because their distances from source are different. This time difference, which is actually the time of electron flight (), can be utilized to evaluate the temporal resolution of the LGAD.
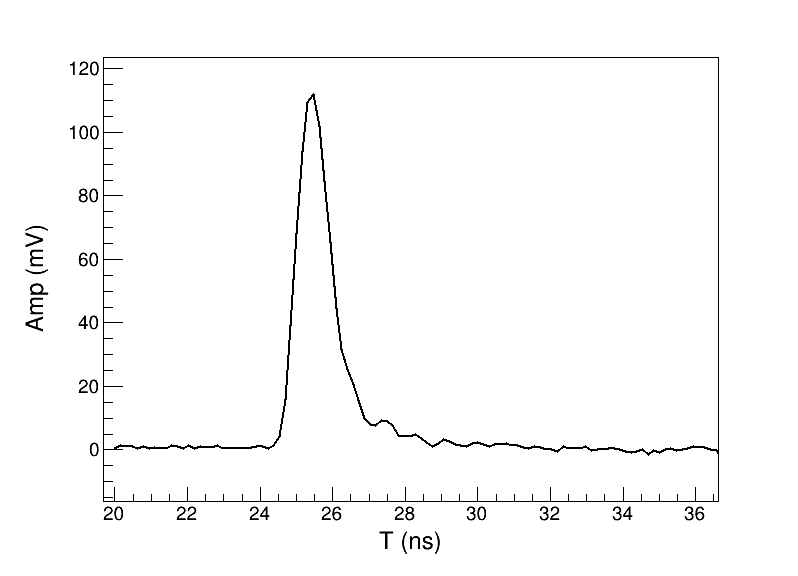
Figure 6 displays the result of the validation. The top plot displays a sample signal read by the FROS, with a signal width of approximately 2 ns and a rising time of around 700 ps. It shows that the FROS is capable of reading the fast signals of LGAD detector. The bottom plot shows the distribution of , from which the width of the distribution is evaluated using Gaussian fitting, resulting in a value of 45 ps for the standard deviation (). Since both LGAD detectors are identical, their temporal resolutions are expected to be the same. Therefore, the temporal resolution of the LGAD is estimated to be approximately 30 ps.
III Analysis and Result
III-A Analysis to the Experiment Data
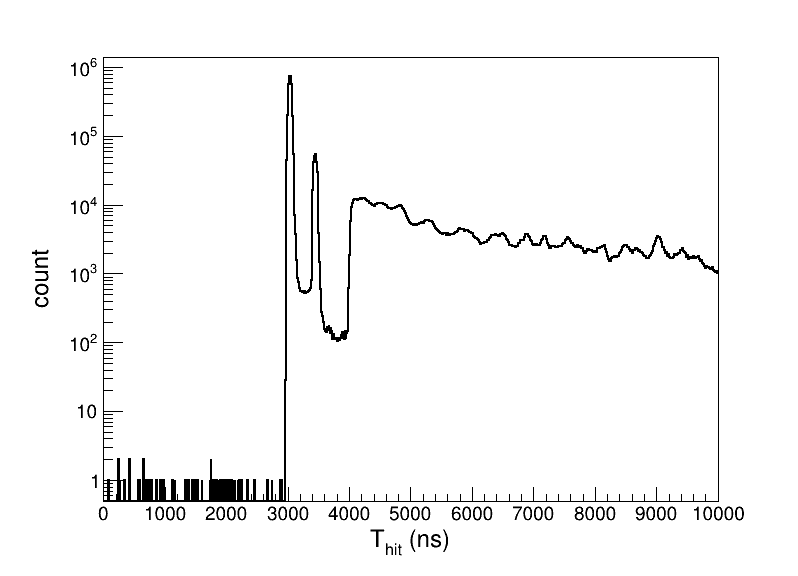
The main objective of this paper is to evaluate the performance of the LGAD detector when utilized as a ZDD. To achieve this, the cross section of the reaction is measured for neutrons with varying energies, employing the Back-n beamline at CSNS and the experimental setup described earlier. Given the thickness of the LGAD detector, only a small fraction of the signals detected are expected to originate directly from neutrons. Instead, the majority of the signals are anticipated to be generated by the secondary particles produced in the reaction, namely the alpha particles and tritium. When a secondary particle interacts with the detector, the FROS continuously records a signal, along with the time elapsed since the last signal was received. The time of the signal () is determined using a 50% constant fraction discrimination method. represents the time at which the secondary particle is detected by the LGAD, and consequently, the time at which the neutron strikes the lithium target, given their close proximity. Figure 7 illustrates a portion of the distribution of time differences between and . Notably, two peaks are observed on the left side of the plot, which correspond to the gamma flash produced during the spallation process. These gamma particles travel faster than the neutrons and are consequently detected at the very beginning. The presence of the gamma flash allows us to calibrate the time of flight of the neutrons, and subsequently calculate the energy of neutrons.
By analyzing the arrival time of the gamma flash, we can determine the time at which the spallation process occurs () using equation 1.
| (1) |
Where c denotes the light speed. is the distance from the center of the spallation target to the LGAD detector and has been accurately measured to be 77.0 meters. represents the position of the first gamma flash peak. Then, the time of neutron flight will be calculated with eq.2.
| (2) |
| (3) |
| (4) |
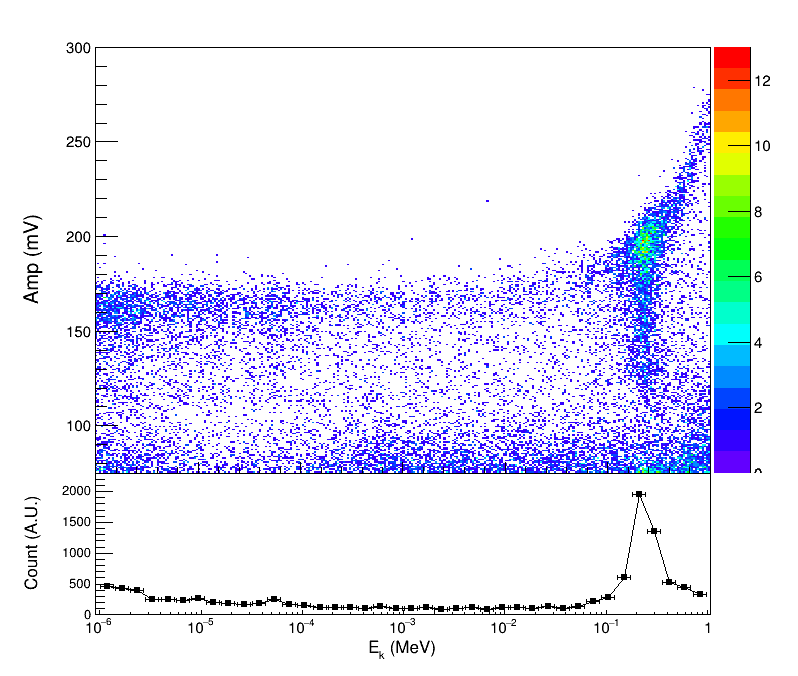
Figure 8 represents a two-dimensional distribution of reconstructed neutron kinetic energy and the amplitude of the signal generated by the secondary particles of the reaction. Its x-projection plot beneath displays the distribution of neutron kinetic energy, from which an obvious resonant peak can be observed. The amplitude of the signal corresponds to the energy deposition in the detector An event band is observed at the top of the plot, distinct from the lower backgrounds. This band corresponds to the group of tritium (T) and alpha particles (), as the neutron and gamma background usually deposit few energy in the detector. By selecting events within this band, the measured cross-section of the reaction can be calculated. This is done by correcting the neutron kinetic energy spectrum using the standard spectrum of back-scattered neutron energy, as illustrated in Figure 1.
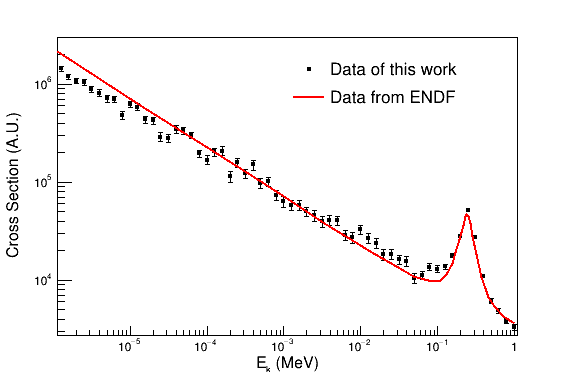
The corrected spectrum of the cross-section is depicted in Figure 9. This measured cross-section is then compared to the standard data obtained from the ENDF database. Notably, both data-sets exhibit agreement within the neutron energy range spanning from 100 eV to 1 MeV, although there is a disagreement for energies below 100 eV. This discrepancy can be attributed to the fact that the experiment described in this paper was carried out simultaneously with other detector tests, which were positioned in front of our detector installation on the beamline. As low-energy neutrons have a higher probability of being absorbed or scattered away, fewer low-energy neutrons reached the LGAD detector and were detected than originally expected.
III-B Evaluation to the Anti-irradiation Performance
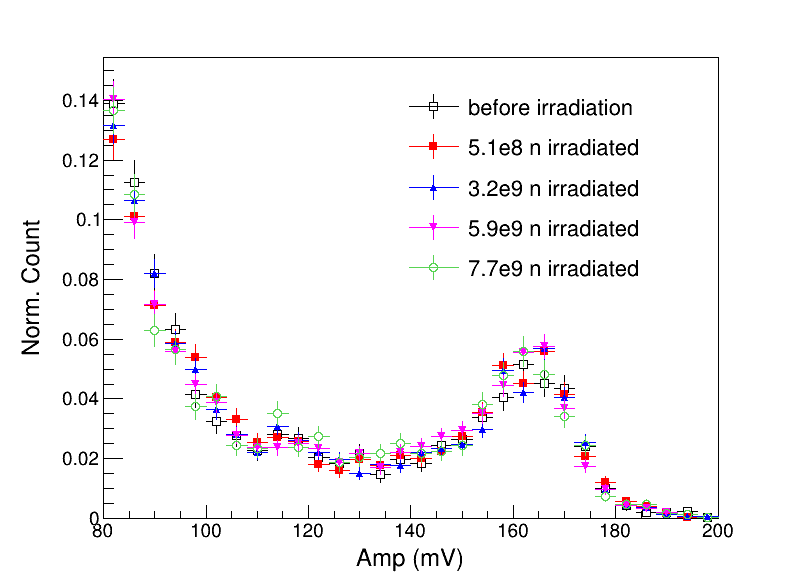
The anti-irradiation performance of LGAD holds significant importance in the application of a ZDD and impacts the reliability and accuracy of data measurements in neutron-induced processes. Therefore, ensuring a strong anti-irradiation capability is crucial for the successful utilization of LGAD in ZDD applications. Reference [12] has reported the excellent anti-irradiation performance of LGAD under the irradiated neutron flux in level of from the view of detector design. In this paper, an additional method is proposed to evaluate this performance based on the perspective of detector application. To evaluate the anti-irradiation performance of the LGAD, the running information of the experiment is investigated. In total 20.64 h was the detector irradiated for on the Back-n beamline, which corresponds to a 1 MeV equivalent neutron flux of passing through the detector. The anti-irradiation performance of the LGAD is evaluated based on the amplitude of charged particles ( or T) generated by neutrons with kinetic energy below 0.1 MeV. Within this energy range, the produced charged particles should exhibit nearly mono-kinetic energy characteristics. If the LGAD demonstrates good anti-irradiation properties, the amplitude of the signal, which essentially corresponds to the kinetic energy, should follow a Gaussian distribution and remain stable throughout the experiment.
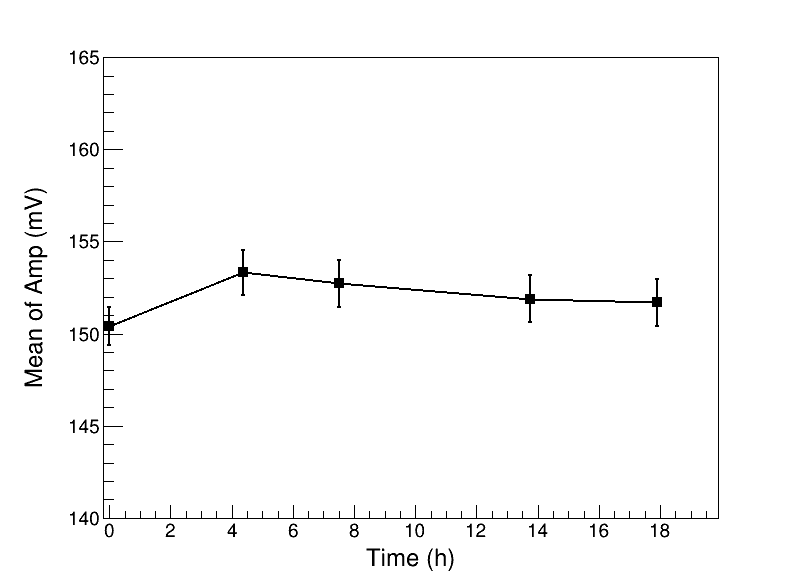
Figure 10 (a) illustrates the amplitude distributions under different amount of neutron flux irradiation throughout the experiment. The peaks observed when the amplitude exceeds 120 mV are mainly contributed by the signals of and T, and coincide with each others. The mean values of these distributions are presented in Figure 10 (b). It is evident that the mean values generally remain constant throughout the experiment. This indicates that the LGAD exhibits good anti-irradiation performance, which is a significant advantage when utilizing it as a ZDD for the neutron-induced processes data measurement.
IV Conclusion
The LGAD detector, with its 50 µm sensitive volume thickness, 30 ps temporal resolution, low cost and excellent anti-irradiation property, is expected to be an excellent candidate for the use of a ZDD in neutron-induced process data measurements. This paper presents an experiment that tests the performance of the LGAD when utilized as a ZDD. The detector is placed directly on the neutron beamline to measure the cross-section of . Comparing the results obtained in this work to the ENDF standard database, a relatively consistent outcome is observed, particularly in the resonant peak around 0.1 MeV. This finding suggests that the LGAD is a viable option for the application of a zero degree detector in neutron-induced process data measurements. This will contribute to the improvement of the design of nuclear data measurement experiments, especially for that to be conducted on a short distance-of-flight neutron beamline considering its excellent temporal resolution.
References
- [1] INTERNATIONAL ATOMIC ENERGY AGENCY, Status of Accelerator Driven Systems Research and Technology Development, IAEA-TECDOC-1766, IAEA, Vienna (2015).
- [2] A.S. Vorobyev et al., Measurement of the fission cross section and angular distributions of fragments from fission of and in neutron energy range of 0.3-500 MeV, 2023, arXiv:2301.06835v1.
- [3] Zhizhou Ren et al., Measurement of the 236U(n, f ) cross section for neutron energies from 0.4 MeV to 40 MeV from the back-streaming white neutron beam at the China Spallation Neutron Source, PHYSICAL REVIEW C, 2020, 102:034604
- [4] M. Diakaki et al., Measurement of the 236U(n,f) cross section at fast neutron energies with Micromegas Detectors, EPJ Web of Conferences, 2020, 239:05001.
- [5] F. Tovesson et al., Fast Neutron–Induced Fission Cross Sections of up to 200 MeV, NUCLEAR SCIENCE AND ENGINEERING, 2014, 178:57–65
- [6] A.Wakhle et al., The Coincident Fission Fragment Detector (CFFD), Nuclear Instruments and Methods in Physics Research A, 2017, 864:7–11
- [7] J.H. Adams Jr. et al., The Zero-Degree Detector system for fragmentation studies, Nuclear Instruments and Methods in Physics Research A, 2007, 579:443–446
- [8] Marzio De Napoli, SiC detectors: A review on the use of silicon carbide as radiation detection material, Front. Phys., 2022, 10:898833.
- [9] H. Kagan et al., SiC detectors: A review on the use of silicon carbide as radiation detection material, Nuclear Inst. and Methods in Physics Research, A 924 (2019) 297–300.
- [10] H. Imam, A High Granularity Timing Detector for the ATLAS Detector Phase-II Upgrade, IEEE Transactions on Nuclear Science, 2022, 69(4), 677-686.
- [11] Marco Ferrero et al., An Introduction to Ultra-Fast Silicon Detectors, CRC Press, Boca Raton (2021).
- [12] Li Mengzhao et al., Effects of Shallow Carbon and Deep N++ Layer on the Radiation Hardness of IHEP-IME LGAD Sensors, IEEE Transactions on Nuclear Science, 2022, 69(5):1098-1103
- [13] Yonghao Chen et al., Neutron energy spectrum measurement of the Back-n white neutron source at CSNS, Eur. Phys. J. A, 2019, 55: 115.
- [14] The CSNS Back-n Collaboration, Back-n white neutron source at CSNS and its applications, NUCL SCI TECH, 2021, 32:11.