Symbiotic star T CrB as an extreme SU UMa type dwarf nova
Abstract
T CrB is a symbiotic recurrent nova that exhibits quiescent and active phases between its classical nova eruptions. The statistical properties of these active phases have been poorly studied thus far. Because of that their nature remained unknown. Here we study statistical properties of the active phases and show that they are consistent with outburst and superoutbursts observed in SU UMa type dwarf novae. The recurrence time of these outbursts is consistent with theoretical predictions for similar systems. Moreover, the visual and X-ray evolution of the last active phase is consistent with a superoutburst. This suggests that T CrB is a dwarf nova with an extremely long orbital period, closely related to SU UMa dwarf novae. The similarities between the last superoutburst and the reported activity preceding the 1946 nova eruption may suggest that next classical nova eruption in T CrB could be indeed soon expected.
1 Introduction
T CrB is a recurrent classical nova with a recurrence time of roughly 80 years (e.g. Sanford, 1949). The last recorded outburst was in 1946, which suggests a new outburst will occur in the next few years (e.g. Luna et al., 2020). Its orbital period is 227.5687d (Fekel et al., 2000). The white dwarf mass in T CrB is close to the Chandrasekhar limit M M⊙ (Belczynski & Mikolajewska, 1998; Stanishev et al., 2004). The mass donor of the system is a red giant, classifying the system as a symbiotic star (see Kenyon, 1986, and references therein). This makes T CrB a member of a rare group of symbiotic recurrent novae, which has only six members known thus far (RS Oph, T CrB, V3890 Sgr, V745 Sco, LMC S154 and V618 Sgr; see Iłkiewicz et al., 2019; Merc et al., 2023, and references therein).
T CrB experiences active phases, where the UV continuum of the system rises for extended periods of time (e.g. Selvelli et al., 1992; Iłkiewicz et al., 2016). The most recent active phase was suggested to be connected to the upcoming outburst (e.g. Munari et al., 2016; Luna et al., 2020; Schaefer, 2023). However, Iłkiewicz et al. (2016) argued that the active phases are quasi-periodic and are not connected to the classical nova outbursts. Here we explore archival observations of T CrB in order to unravel the nature of its active phases.
2 Observations
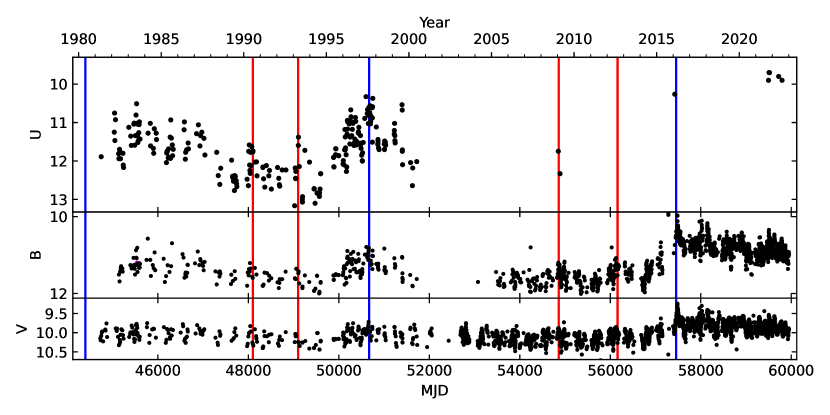
We collected photometric observations in filters from the literature. The sources included the AAVSO International Database, the All Sky Automated Survey (Pojmanski, 1997), Bruch (1992), Zamanov & Zamanova (1997), Zamanov et al. (2004), Munari et al. (2016) and Zamanov et al. (2016). In addition, we collected the data presented by Stanishev et al. (2004) and references therein. Where not all data was in a machine-readable form we digitized the data in the same fashion as discussed by Stanishev et al. (2004). Our sample is virtually identical to that presented by Schaefer (2023), except that we limited our analysis to times covered by observations in , as the amplitude of active phases is best studied in bluest filters. The light-curve is presented in Fig. 1.
3 Results
In order to examine the long-term variability of T CrB we cleaned and smoothed the light-curve. As a first step we fitted the orbital variability in the filters with a sine function using the data from before the start of the most recent active phase. From this we obtained the ephemeris of the maximum of the ellipsoidal variability MJDmax=53155.22(49)+E113.71(2), implying an orbital period roughly consistent with the one measured by Fekel et al. (2000). The obtained amplitude of the ellipsoidal variability was 0.173(5) mag in the band and 0.172(12) in the band. Subsequently, we removed the ellipsoidal variability, leaving only the mean red giant brightness in the data. We did not include the data in band in this procedure, as there was not enough data points for a good fit.
The resultant data was still noisy, as at all times in T CrB there is flickering present with an amplitudes of up to 0.1 mag in the band (e.g. Zamanov et al., 2016). In order to remove such fast variability we smoothed the light-curve using local polynomial regression (LOESS, Cleveland, 1979; Cleveland & Devlin, 1988). This method is commonly used to smooth astronomical light-curves (e.g. Li et al., 2012). We used python implementation of LOESS, with a Gaussian kernel and a radius of 113.71 days (Marholm, 2019). We note that Schaefer (2023) discovered that T CrB orbital variability has slightly variable shape. This could affect the accuracy of our subtraction of the ellipsoidal variability from the light-curve. We tested this by changing the parameters of the subtracted orbital variability in accordance with the range of changes noted by Schaefer (2023). We found that the changing orbital variability does not significantly change the smoothed light-curve.
In order to study the amplitude of long-term variability of T CrB it is vital to remove the red giant contribution from the observed magnitudes, as its presence lowers the amplitude in the magnitude scale. In order to correct for that effect we adapted the mean brightness of the red giant of 10.029 mag in the band (Zamanov et al., 2004). In order to calculate the red giant contribution in the band we assumed a reddening of E()=0.15 mag (Selvelli et al., 1992) and a color of the red giant =1.60 mag (Straižys, 1992) assuming a M4.5III red giant (Mürset & Schmid, 1999). We then converted the theoretical magnitude of the red giant and observed magnitudes of T CrB to fluxes, removed the red giant contribution from observations and converted the fluxes back to magnitudes. The resultant smoothed light-curve that has the red giant contribution removed is presented in Fig. 2.
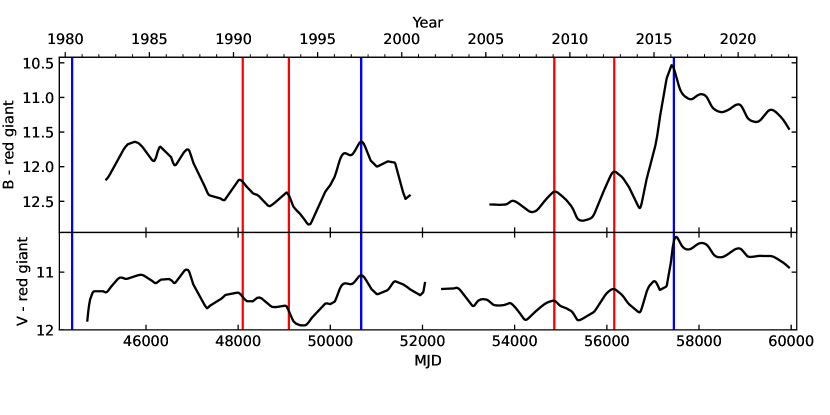
Iłkiewicz et al. (2016) suggested that there are small and big active phases in T CrB. The big active phases have a reccurence period of 5000 days. The small active phases occur between the big active phases, they have smaller amplitudes and a recurrence period of 1000 days. Both kinds of active phases have larger amplitudes in bluer filters. There are three big active phases in our data (Fig. 2). However, the beginning of the first big active phase is not covered. Instead, in order to determine its maximum we used UV data presented by Selvelli et al. (1992), which suggests that T CrB reached a plateau around 8th June 1980. The maxima of the next two big active phases were determined from our smoothed light-curve to be around MJD 50670 and 57455. The first two maxima of small active phases were determined to be around MJD 48100 and 49100 by Zamanov & Zamanova (1997). The maxima of the two most recent small active phases were determined from our smoothed light-curve to be around MJD 54860 and 56160. We measured the amplitudes of the big and small active phases using the smoothed light-curve in the band. The measurements are presented in Table 3.
| Type | MJD | Amplitude |
|---|---|---|
| Big active phase / superoutburst | 44398 | 1.17 mag |
| Small active phase / normal outburst | 48100 | 0.63 mag |
| Small active phase / normal outburst | 49100 | 0.47 mag |
| Big active phase / superoutburst | 50670 | 1.15 mag |
| Small active phase / normal outburst | 54860 | 0.43 mag |
| Small active phase / normal outburst | 56160 | 0.73 mag |
| Big active phase / superoutburst | 57455 | 1.99 mag |
Dwarf nova outbursts as a source of active phases in T CrB have been suggested in the past (Iłkiewicz et al., 2016). Moreover, the X-ray flux dropped right at the beginning of the most recent big active phase and returned to normal right at the end of the active phase (Luna et al., 2018; Kuin et al., 2023). This is exactly the behavior expected for a dwarf nova outburst (e.g Fertig et al., 2011; Luna et al., 2018). Exactly the same behavior was observed during the previous big active phase, were the X-ray flux increased at the end of the big active phase (Iłkiewicz et al., 2016). This confirms that both active phases are of the same nature and are reminiscent of a dwarf nova outburst.
The photometric evolution of the most recent big active phase evolution is very similar to a typical superoutburst. Namely, fast rise to the maximum is followed a quasi-plateau with a slow decline, and subsequent fast drop to quiescence (Fig. 2, see also fig. 1 of Otulakowska-Hypka et al. 2016). While the sharp decline to quiescence is not yet fully covered, it has already started (Schaefer et al., 2023; Teyssier et al., 2023; Munari, 2023).
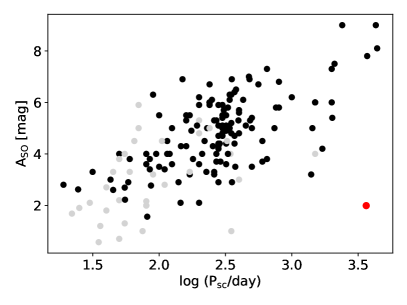
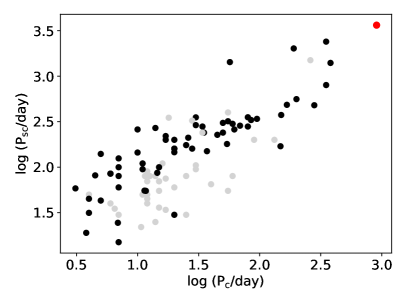

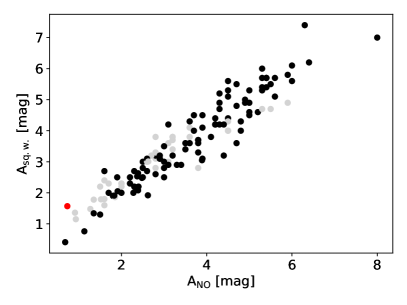
In order to test the hypothesis that active phases in T CrB are due to dwarf nova outbursts we compared their statistical properties with a sample of dwarf novae. In this hypothesis the small active phases are the normal dwarf nova outbursts and big active phases are superoubtursts in SU UMa type dwarf novae. In SU UMa type dwarf novae the superoutburst occurs because of a 3:1 tidal resonance in the accretion disc (Hirose & Osaki, 1990; Osaki, 2005). The statistical properties of dwarf novae selected for the present test consisted of relationships between observables that had the highest correlation among those presented by Otulakowska-Hypka et al. (2016). In particular, we compared amplitudes of normal outbursts ANO and superoutbursts ASO, recurrence time of normal outbursts Pc and super outburst Psc, as well as amplitude of the superoutburst when magnitude from the end of the plateau is used Asq.w.. Both Pc and Psc are not constant and can change by a factor of up to 3 (Otulakowska-Hypka et al., 2016). Hence, it is essential to use minimal recurrence time observed. For this reason we do not adapt recurrence times measured by us, but minimal values recorded in the literature. Namely, we use Pc=906d and Psc=3640d measured by Anupama (1997). For amplitudes we adopted the values presented in Table 3. As for Asq.w. it is possible only to measure it during the last big active phase and we obtained Asq.w.=1.57 mag.
The comparison of active phases in T CrB to those in dwarf novae is presented in Fig. 3. On all of the figures the T CrB active phases are consistent with the dwarf nova properties. This, combined with the X-ray behavior and the fact that the active phases behavior remained roughly constant for at least the last 40 years confirms their dwarf nova nature. The only relationship that T CrB slightly departs from is the relationship between Psc and ASO. This may be explained by a small sample of measured recurrence times of big active phases. Moreover, this relationship has the lowest Pearson product-moment correlation coefficient of r=0.65 compared to r=0.84, r=0.94 and r=0.89 for other relationships.
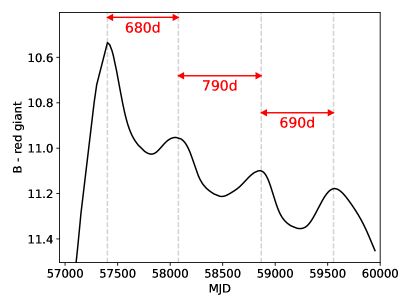
During superoutbursts in SU UMa dwarf novae superhumps are observed. Superhumps have roughly sinusoidal shape and periods slightly larger compared to the orbital period (e.g. Kato et al., 2009). In fact, during the plateau of the last big active phase of T CrB a variability with a period of 700d is visible (Fig. 4). A similar behaviour might have been present during the two previous superoutbursts, but not enough data is available to confirm this. Since the orbital period of T CrB is 227.5687d (Fekel et al., 2000) the 700d is significantly larger than the orbital period and we suggest that they can be interpreted as superhumps. This would further confirm the SU UMa type dwarf nova nature of the active phases in T CrB. We note that this period excess of the positive superhump is unprecedentedly high, being over three times the orbital period. Typically a period excess of up to 10% is observed (e.g. Wakamatsu et al., 2021). This is easily explained by the fact that the period excess of a superhump is strongly correlated with the orbital period (Stolz & Schoembs, 1984) and the dwarf novae were observed in binary systems with orbital periods of up to few hours (e.g. Kato & Vanmunster, 2023). In fact, if we would extrapolate the known relationship between the period excess and orbital period, we would obtain period excees far exceeding the one observed in T CrB (see eq. 4 of Otulakowska-Hypka et al., 2016). However, obviously an extrapolation so large will not provide an accurate prediction. Moreover, the rationship between orbital period and superhump period, as well as a similar relation between superhump period and mass ratio in the system seem to not hold for systems with long orbital periods (see Otulakowska-Hypka et al., 2016, and references therein). Hence, the validity of superhump interpretation of variability with 700d period should be verified with theoretical simulations.
4 Conclusions and discussion
It has been suggested that the last T CrB big active phase is biggest since the 1946 outburst and the last similar big active phase was seen just before the 1946 outbursts (Munari et al., 2016; Luna et al., 2020; Schaefer, 2023). This may be true regardless of physical interpretation of the brightening and classical nova eruption could be triggered by a superoutburst. Moreover, we note that a systematic change of mass transfer rate in the system suggested by Schaefer (2023) is consistent with a change in recurrence time of superoutbursts from 3640d (Anupama, 1997) to 6500d (Table 3). However, the change in the amplitude of superoutbursts is not as obvious given that most of the historical data is in the band, where the amplitude of outburst is relatively low. On the other hand, the limited sample of observations suggests that the most recent superoutburst had an amplitude only 0.5 mag higher compared to the previous two superoutbursts (Fig. 1). This makes the difference in amplitudes less dramatic compared to what is suggested in the literature. Moreover, Variable Star and Exoplanet Section of Czech Astronomical Society111http://var2.astro.cz/ provides observations of T CrB suggesting that the most recent superoutburst had nearly identical maximum brightness as the preceding one. However, we omitted these observations in our work as they seem inconsistent with the AAVSO data.
We have shown that T CrB is closely related to SU UMa dwarf novae using statistical properties of its active phases, the shape of the most recent big active phase, as well as the X-ray behavior. This makes T CrB a dwarf nova with an extremely long orbital period, 3 orders of magnitude longer than in other SU UMa type dwarf novae. This also places T CrB among rare systems where both dwarf nova and classical nova outbursts were recorded (Šimon, 2002; Mróz et al., 2016).
Dwarf nova outbursts in symbiotic stars have been modeled in the past (e.g. Alexander et al., 2011). In particular, according to the recent modeling by Bollimpalli et al. (2018) the recurrence time of dwarf nova outbursts in similar symbiotic stars is expected to be in the range between 1.5 and 4 years. This is in excellent agreement with the 1000d (2.7 years) recurrence time of normal dwarf nova outbursts in T CrB. Hence, the dwarf nova outbursts in T CrB are consistent with theoretical predictions. This makes T CrB a valuable laboratory for dwarf nova outburst models in extremely large accretion discs. Moreover, it may serve as a link between dwarf nova outbursts in binary stars and similar outbursts in Active Galactic Nuclei (Hameury et al., 2009).
References
- Alexander et al. (2011) Alexander, R. D., Wynn, G. A., King, A. R., & Pringle, J. E. 2011, MNRAS, 418, 2576, doi: 10.1111/j.1365-2966.2011.19647.x
- Anupama (1997) Anupama, G. C. 1997, in Physical Processes in Symbiotic Binaries and Related Systems, ed. J. Mikołajewska, 117
- Belczynski & Mikolajewska (1998) Belczynski, K., & Mikolajewska, J. 1998, MNRAS, 296, 77, doi: 10.1046/j.1365-8711.1998.01301.x
- Bollimpalli et al. (2018) Bollimpalli, D. A., Hameury, J. M., & Lasota, J. P. 2018, MNRAS, 481, 5422, doi: 10.1093/mnras/sty2555
- Bruch (1992) Bruch, A. 1992, A&A, 266, 237
- Cleveland (1979) Cleveland, W. S. 1979, Journal of the American statistical association, 74, 829
- Cleveland & Devlin (1988) Cleveland, W. S., & Devlin, S. J. 1988, Journal of the American statistical association, 83, 596
- Fekel et al. (2000) Fekel, F. C., Joyce, R. R., Hinkle, K. H., & Skrutskie, M. F. 2000, AJ, 119, 1375, doi: 10.1086/301260
- Fertig et al. (2011) Fertig, D., Mukai, K., Nelson, T., & Cannizzo, J. K. 2011, Publications of the Astronomical Society of the Pacific, 123, 1054. http://www.jstor.org/stable/10.1086/661949
- Hameury et al. (2009) Hameury, J. M., Viallet, M., & Lasota, J. P. 2009, A&A, 496, 413, doi: 10.1051/0004-6361/200810928
- Hirose & Osaki (1990) Hirose, M., & Osaki, Y. 1990, PASJ, 42, 135
- Iłkiewicz et al. (2019) Iłkiewicz, K., Mikołajewska, J., Miszalski, B., et al. 2019, A&A, 624, A133, doi: 10.1051/0004-6361/201834165
- Iłkiewicz et al. (2016) Iłkiewicz, K., Mikołajewska, J., Stoyanov, K., Manousakis, A., & Miszalski, B. 2016, MNRAS, 462, 2695, doi: 10.1093/mnras/stw1837
- Kato & Vanmunster (2023) Kato, T., & Vanmunster, T. 2023, arXiv e-prints, arXiv:2304.13311, doi: 10.48550/arXiv.2304.13311
- Kato et al. (2009) Kato, T., Imada, A., Uemura, M., et al. 2009, PASJ, 61, S395, doi: 10.1093/pasj/61.sp2.S395
- Kenyon (1986) Kenyon, S. J. 1986, The symbiotic stars
- Kuin et al. (2023) Kuin, N. P., Luna, G. J. M., Page, K., et al. 2023, The Astronomer’s Telegram, 16114, 1
- Li et al. (2012) Li, Z., Chen, L., & Wang, D. 2012, PASP, 124, 297, doi: 10.1086/665327
- Luna et al. (2020) Luna, G. J. M., Sokoloski, J. L., Mukai, K., & M. Kuin, N. P. 2020, ApJ, 902, L14, doi: 10.3847/2041-8213/abbb2c
- Luna et al. (2018) Luna, G. J. M., Mukai, K., Sokoloski, J. L., et al. 2018, A&A, 619, A61, doi: 10.1051/0004-6361/201833747
- Marholm (2019) Marholm, S. 2019, sigvaldm/localreg: Fully tested version, 0.2.0, Zenodo, doi: 10.5281/zenodo.3234461
- Merc et al. (2023) Merc, J., Gális, R., Velez, P., et al. 2023, MNRAS, 523, 163, doi: 10.1093/mnras/stad1434
- Mróz et al. (2016) Mróz, P., Udalski, A., Pietrukowicz, P., et al. 2016, Nature, 537, 649, doi: 10.1038/nature19066
- Munari (2023) Munari, U. 2023, arXiv e-prints, arXiv:2307.00255, doi: 10.48550/arXiv.2307.00255
- Munari et al. (2016) Munari, U., Dallaporta, S., & Cherini, G. 2016, New A, 47, 7, doi: 10.1016/j.newast.2016.01.002
- Mürset & Schmid (1999) Mürset, U., & Schmid, H. M. 1999, A&AS, 137, 473, doi: 10.1051/aas:1999105
- Osaki (2005) Osaki, Y. 2005, Proceedings of the Japan Academy, Series B, 81, 291, doi: 10.2183/pjab.81.291
- Otulakowska-Hypka et al. (2016) Otulakowska-Hypka, M., Olech, A., & Patterson, J. 2016, MNRAS, 460, 2526, doi: 10.1093/mnras/stw1120
- Pojmanski (1997) Pojmanski, G. 1997, Acta Astron., 47, 467, doi: 10.48550/arXiv.astro-ph/9712146
- Sanford (1949) Sanford, R. F. 1949, ApJ, 109, 81, doi: 10.1086/145106
- Schaefer (2023) Schaefer, B. E. 2023, MNRAS, doi: 10.1093/mnras/stad735
- Schaefer et al. (2023) Schaefer, B. E., Kloppenborg, B., Waagen, E. O., & Observers, T. A. 2023, The Astronomer’s Telegram, 16107, 1
- Selvelli et al. (1992) Selvelli, P. L., Cassatella, A., & Gilmozzi, R. 1992, ApJ, 393, 289, doi: 10.1086/171506
- Stanishev et al. (2004) Stanishev, V., Zamanov, R., Tomov, N., & Marziani, P. 2004, A&A, 415, 609, doi: 10.1051/0004-6361:20034623
- Stolz & Schoembs (1984) Stolz, B., & Schoembs, R. 1984, A&A, 132, 187
- Straižys (1992) Straižys, V. 1992, Multicolor stellar photometry
- Teyssier et al. (2023) Teyssier, F., Hinnefeld, J. D., Boussin, C., et al. 2023, The Astronomer’s Telegram, 16109, 1
- Šimon (2002) Šimon, V. 2002, A&A, 382, 910, doi: 10.1051/0004-6361:20011560
- Wakamatsu et al. (2021) Wakamatsu, Y., Thorstensen, J. R., Kojiguchi, N., et al. 2021, PASJ, 73, 1209, doi: 10.1093/pasj/psab003
- Zamanov et al. (2004) Zamanov, R., Bode, M. F., Stanishev, V., & Martí, J. 2004, MNRAS, 350, 1477, doi: 10.1111/j.1365-2966.2004.07747.x
- Zamanov et al. (2016) Zamanov, R., Semkov, E., Stoyanov, K., & Tomov, T. 2016, The Astronomer’s Telegram, 8675, 1
- Zamanov & Zamanova (1997) Zamanov, R. K., & Zamanova, V. I. 1997, Information Bulletin on Variable Stars, 4461, 1