Strong localization of microwaves beyond 2D in aperiodic Vogel spirals
Abstract
We carry out dynamical microwave transport experiments in aperiodic Vogel spiral arrays of cylinders with high dielectric permittivity. We experimentally disclose the electromagnetic modal structure of these structures in real space showing that they simultaneously support long-lived modes with Gaussian, exponential, and power law spatial decay. This unique modal structure, which cannot be found in traditional periodic or disordered photonic materials, is shown to be at the origin of strong localization in Vogel spirals that survives even in three dimensions. Altogether our results unveil the manifestations of the rich, unprecedented, spatial structure of electromagnetic modes supported by aperiodic photonic systems in wave transport and localization.
A full understanding and control over electromagnetic transport in photonic media is crucial for the efficient design of optical structures, paving the way for many applications [1]. At the microscopic level, controlling light transport in photonic structures involves the ability of not only understand, but also to engineer the electromagnetic modes that such structures can support. In the case of traditional periodic and disordered optical structures, light transport and the underlying electromagnetic modal structure have been extensively investigated over the years. In periodic photonic structures the scattering of propagating, extended electromagnetic waves from Bragg planes is related to the opening of photonic bandgaps at certain frequencies [2]. In disordered optical systems the interference of multiply scattered waves may lead to the formation of exponentially localized states and eventually to the breakdown of light diffusion [3, 4, 5]. This effect, the optical counterpart of Anderson localization for electrons in solids [6], strongly depends on dimensionality [7], and in three-dimensional (3D) media there is no unquestionable observation of light localization transition so far for disordered systems [8, 9, 10]. When structural correlations are introduced, as it is the case of two-dimensional (2D) hyperuniform disordered materials, a richer transport diagram exists that include transparency, light diffusion, Anderson localization, or full band gaps, depending on the frequency [11, 12, 13, 14, 15, 16, 13, 17, 18, 19, 20, 21].
As an alternative to periodic and disordered photonic structures, aperiodic metamaterials designed by means of deterministic mathematical rules have emerged as a novel material platform for photonic devices [22, 23, 24]. Indeed, these structures exhibit unique optical properties that do not exist in either periodic or disordered photonic media, such as fractal transmission spectra [25, 26], subdiffusive transport [27], and light localization transition [28]. From a technological point of view, these unusual optical properties have fostered the development of functionalities that also cannot be found in conventional periodic or disordered structures, including applications in lasing [29, 30], optical sensing [31, 32, 33], photo-detection [34], and optical imaging [35]. Among various classes of deterministic aperiodic photonic media, Vogel spiral arrays single out for its versatility and the possibility to tailor its structural order [36, 37, 38]. From the microscopic level the unusual optical properties of aperiodic systems are enabled by their unique electromagnetic modal structure. For instance, recently it was theoretically demonstrated that aperiodic Vogel spiral arrays display a rich spectrum of long-lived and spatially localized quasimodes with distinctive spatial decay forms, namely Gaussian, exponential, and power law [39].
In the present letter, we not only experimentally demonstrate that these characteristic types of electromagnetic modes coexist in Vogel spirals, but also that this unique electromagnetic modal structure leads to unusual wave transport phenomena. Indeed, by conducting microwave transport experiments in Vogel spiral arrays of cylinders with high dielectric permittivity, we unveil the consequences of this peculiar modal structure on wave transport and localization. In particular, we show that the presence of long-lived quasimodes with exponential, power law and Gaussian spatial decays is at the origin of a very slow decay of the electromagnetic energy that propagates throughout the arrays—of the same order as in the case of conventional 2D disordered systems in the regime of Anderson localization. Furthermore, we experimentally demonstrate that Vogel spirals support localized modes satisfying the Thouless criterion for Anderson localization in random systems, despite the fact these structures are not disordered. Importantly, we show that the Thouless criterion can be fulfilled for modes that are not necessarily exponentially localized in space, in contrast to what occurs in the case of Anderson localization in disordered systems. Finally, we demonstrate the robustness of these long-lived modes against the change in the dimensionality of the cavity, beyond the 2D limit, preserving their spatial profiles and quality factors even when the homogeneity of the electric field in the -direction is broken. Altogether, our findings experimentally demonstrate the unprecedented electromagnetic modal structure of Vogel spirals arrays in real space, and reveal its impact in wave transport phenomena and localization.
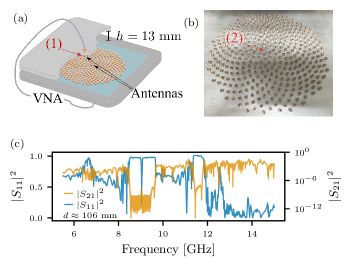
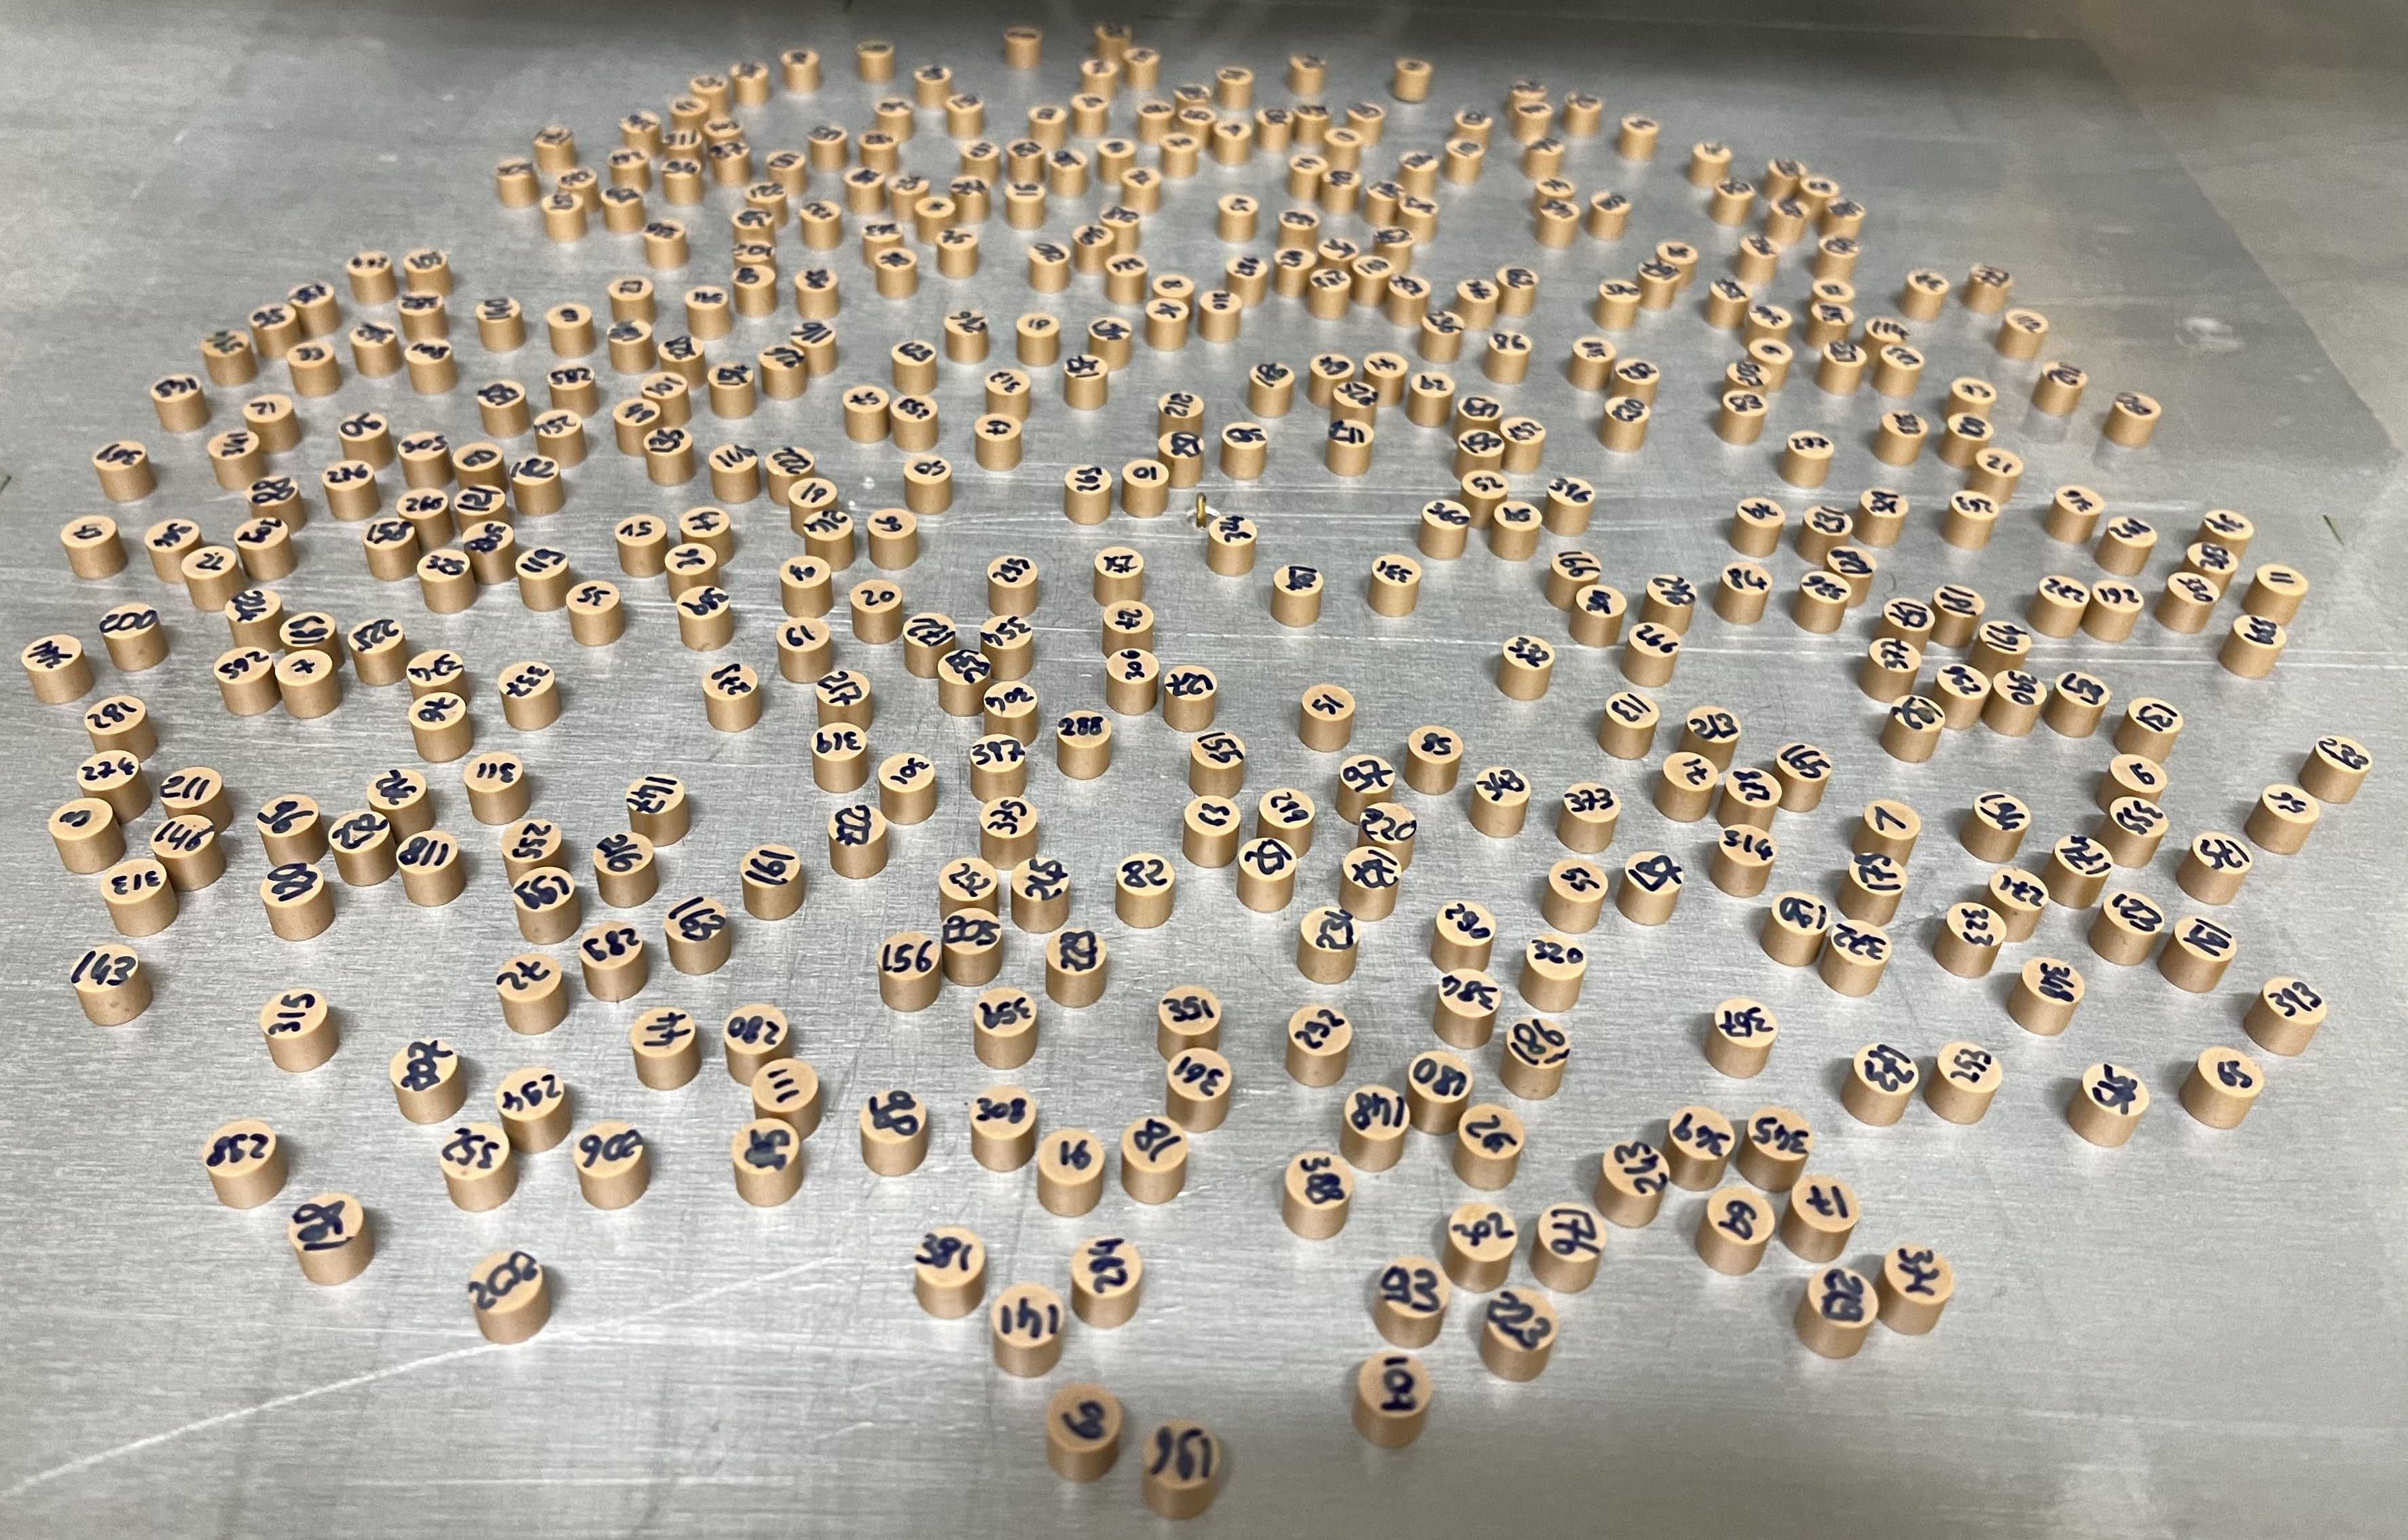
Our main sample consists of cylindrical scatterers (dielectric permittivity , radius 3 mm and height 5 mm) disposed in a cavity made of two parallel aluminium plates which are separated by a distance mm [see Fig. 1(a)]. Cylinders are placed following a Vogel spiral array of 140 mm radius with a planar density cm-2 [see Fig. 1(b)]. This lattice, often called Golden-Angle spiral (GA spiral), is defined in polar coordinates , as ( mm) and linked to the golden number (see Supplementary material I). In order to ensure an homogeneous electrical contact between the scatterers and the bottom plate and thus a good reproducibility, we covered the bottom plate with a self-adhesive thin plastic film.
As sketched in Fig. 1(a), the electric field in the cavity is mapped by the straight antenna (1) placed at the center of the movable top plate. We measure all points on a mm2 grid, covering the disk region occupied by the spiral plus one corner of the embedding square [see, e.g., Fig. 2(a)], resulting in measured points (see Supplementary material II). The presence of the second straight antenna (2) at the center of the bottom plate defines the origin of the system coordinates and allows to measure both the complex reflection and transmission signals and , respectively, using a Vector Network Analyzer (VNA). Note that both antennas are linear and perpendicular to the plane of the cavity, thus imposing a transverse magnetic (TM) polarization (electric field perpendicular to the plane of the cavity). For a height mm, the empty cavity can be completely considered as 2D below the cutoff frequency GHz, where is the speed of light in air. Beneath this threshold, just the fundamental transverse magnetic mode TM0 can propagate in air and the field is invariant along the -axis. Measured positions are scanned in a frequency range between 5.5 and 15 GHz meaning that both 2D and 3D regimes can be investigated. Examples of the measured spectra as well as are shown in Fig. 1(c) for a given distance between both antennas, where the geometrical center of the spiral is placed at . Vanishing transmission values (reflection values close to 1) at certain frequencies indicate the presence of bandgaps. Outside of these gaps, the transmitted signal is a superposition of peaks which are related with the resonances of the system. The parameters of each resonance (frequency , width and complex amplitude) are extracted by means of the harmonic inversion technique as described in Refs. [40, 41]. Later, by clustering the amplitudes of the same resonance measured at all positions, the map of the electric field amplitude is obtained revealing the spatial structures of each eigenmode of the system [18].
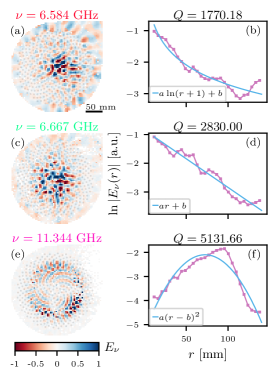
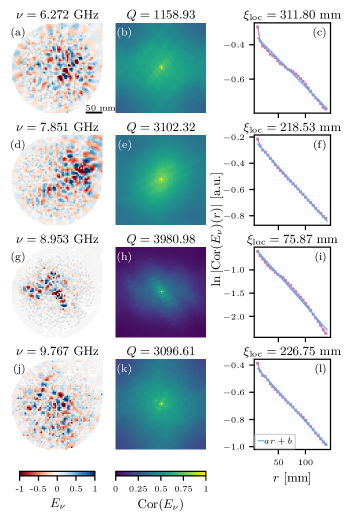
Figure 2 shows the spatial modal structure of three characteristic eigenstates found in the same experimental GA spiral and their corresponding radial decay. Specifically, power-law, exponential, and Gaussian radial decays have been identified by minimizing the sum of squared residuals. Our experimental results demonstrate that Vogel spirals support a rich variety of long-lived modes that exhibit different spatial extent and radial decay profiles, hence confirming recent theoretical predictions [39]. This can be contrasted to disordered samples, where (Anderson) localized states are always characterized by an exponential radial decay (see Supplementary material III). The analyzed long-lived modes found experimentally in this GA spiral sample are distributed in three frequency windows around GHz (exponential, power-law and Gaussian modes), GHz and GHz (Gaussian modes) and are characterized by high quality factors , i.e., low energy-loss ratios.
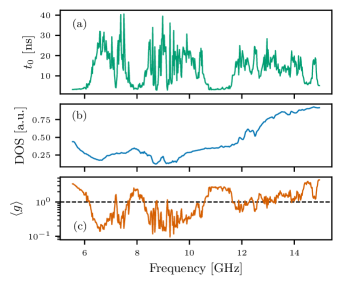
Dynamical electromagnetic transport properties can be probed by measuring the temporal evolution of the energy carried by a certain superposition of modes by means of the transmission spectra as , where represents the Fourier-transform and a Gaussian band pass filter of bandwidth centered around . Figure 3(a) displays the energy as a function of time for three different filters centered around the frequency of the modes extracted in Fig. 2 and with GHz.
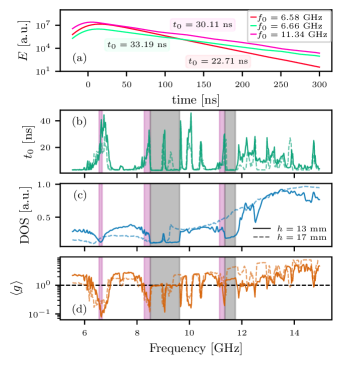
Within these frequency intervals, the presence of modes with high quality factors leads to very slow energy dynamics. Assuming an exponential decay of the energy with respect to time, , one can fit a characteristic decay time that is closely related to the average width of the modes contributing to the transport . Next, by repeating the previous analysis in a systematic way, we compute the characteristic decay time as a function of the frequency [see Fig. 3(b)]. We focus at frequency ranges where the spatial structure of the eigenmodes can be properly characterized by the harmonic inversion/clustering methods. Here, -regions associated with frequency windows containing exponential, power-law or Gaussian states (pink stripes) are characterized by high peaks whose maximum values are of the order of those found in disordered systems (see Supplementary material III), whilst -valleys correspond to short-lived, not spatially localized states or band gaps.
The existence of band gaps can be investigated by experimentally extracting the density of states (DOS) that is directly accessible from the intensity of the reflected signal as [42, 43]. In Fig. 3(c), we plot the DOS, where two band gaps are observed (grey stripes). Additionally, no modes are found by the harmonic-inversion/clustering methods in these frequency intervals whose positions coincide with two of the valleys previously displayed by the characteristic decay time. Peaks at the center of the first bandgap are a signature of defect modes of the system. Additionally, an increment in the number of states supported by the system is observed above .
The Thouless conductance, defined as (where is the spacing between consecutive resonances), is a key quantity in localization theory and it is used as a fundamental criterion for Anderson localization in disordered systems. Indeed, the Thouless criterion establishes that Anderson localization occurs for [44, 45, 46]. Using the two previously introduced quantities (DOS and ), we extract experimentally the average Thouless conductance [see Fig. 3(d)] as where is the average density of states over the frequency interval . Figure 3(d) experimentally demonstrates that non-random systems can fulfil the Thouless criterion for Anderson localization, originally conceived to characterize localization in disordered structures, again confirming theoretical predictions [28, 39]. Our findings confirm that not only eigenmodes characterized by an exponential spatial decay can satisfy the Thouless condition, as it occurs for disordered systems, but also other modes with different spatial decay forms, such as algebraic and Gaussian decays. To the best of our knowledge localized, long-lived modes that fulfil the Thouless criterion in non-random arrays with non-exponential spatial decays have never been experimentally observed so far. This result demonstrates experimentally the unique modal structure that aperiodic Vogel spirals support, leading to unusual properties of wave transport and localization. The existence of long-lived modes with different decay types in the same system means that these distinct classes of modes will have different sensitivity to the sample boundaries. As a result, these classes of modes exhibit different evolution of the transport quantities with respect to the system size, as shown in Supplementary material IV.
It should be noted that, up to this point, all long-lived modes shown have been found below the 2D cutoff frequency in air ( GHz), so the electromagnetic field is confined in the plane of the array. In order to study the robustness of GA spiral modes with respect to the dimensionality, the distance between both aluminium plates is increased from mm to mm implying a new cutoff frequency GHz. As a result the electromagnetic field is actually three-dimensional beyond this frequency. Then previous experimental procedure and data analysis are repeated, thus the characteristic decay time , the DOS, and the average Thouless conductance are extracted and correspond to the dashed lines depicted in Fig. 3(b), (c) and (d), respectively. displays remarkable similarities in both cases, being just differentiated by a decrease of the characteristic peaks related to the first localization region (at GHz) and the formation of a new peak in the first band gap. The appearance of this peak can be also observed in the DOS, where the size of the first band gap has been considerably reduced in its upper part. Additionally, the presence of new modes at lower frequencies leads to the population of the second band gap that has completely disappeared, confirming their 3D character. Nevertheless, still drops by around one order of magnitude near GHz, keeping its shape in all frequency windows containing long-lived modes.
In the last part of this letter we focus in the highest-frequency window in which long-lived exist ( GHz), and which occurs beyond the new cutoff frequency. Here the presence of long-lived modes previously predicted by the analysis of and is verified by the Harmonic inversion/clustering methods. Four different Gaussian modes corresponding to this frequency band are shown in Fig. 4 for both cavity sizes [(a)-(c) mm and (b)-(d) mm]. High quality factors confirm the existence of long-lived modes even in the case where the 2D confinement of the electromagnetic field is not due to the geometry of the cavity.
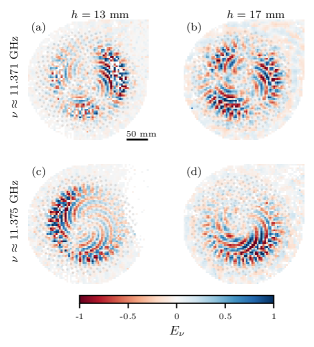
Indeed, Fig. 4 experimentally proves the robustness of Gaussian long-lived modes in Vogel spirals against the situation in which the electric field is inhomogeneous in the direction. This result also experimentally confirms previous numerical findings [28] that demonstrate the existence of localized, long-lived 3D electromagnetic modes supported by 2D Vogel spirals arrays precisely for , corresponding to GHz in our experimental system.
In conclusion, we have experimentally revealed the spatial modal structure supported by quasi-two-dimensional arrays of dielectric cylinders placed according to aperiodic Vogel spirals and its impact in wave transport. We showed that these structures support a unique modal structure where long-lived modes with different radial decay types (exponential, power-law and Gaussian) coexist, confirming recent theoretical predictions [39]. We also investigate the impact of these peculiar modal structure on microwave transport properties by means of the temporal evolution of the energy as well as the characteristic decay time (related with the average resonance width ), the density of states, and the Thouless conductance. This analysis reveals that Vogel spirals exhibit very slow energy dynamics as a result of this particular modal structure. Indeed, we show that in frequency windows containing long-lived modes the values of are similar to those found in the Anderson localized regime in traditional 2D disordered systems. In these same frequency windows the Thouless criterion for Anderson localization is shown to be fulfilled despite the lack of disorder and the presence of non-exponentially localized modes. Long-lived modes supported by Vogel spiral are also proven to be robust against the change in the dimensionality of the cavity, from 2D to 3D, so that they remain essentially unperturbed and preserve their spatial profiles and quality factors even when the homogeneity of the electric field in the -direction is broken. Our findings not only experimentally demonstrate the unprecedented electromagnetic modal structure of Vogel spirals arrays in real space and their robustness against the opening of the cavity, but also their effects in wave localization and transport phenomena, such as slow energy transport dynamics.
Acknowledgements
We thank L. Dal Negro, F. Sgrignuoli, M. Prado, and Y. Chen for enlightening discussions. F.A.P. acknowledge CNPq, CAPES, and FAPERJ for financial support. L.A.R.-L. gratefully acknowledges the financial support from CONACyT (Mexico), through the Grant No.775585, and from the French government, through the UCAJEDI Investments in the Future project managed by the National Research Agency (ANR) with the reference number ANR-15-IDEX-0001.
References
- Vynck et al. [2021] K. Vynck, R. Pierrat, R. Carminati, L. S. Froufe-Pérez, F. Scheffold, R. Sapienza, S. Vignolini, and J. J. Sáenz, Light in correlated disordered media (2021), arXiv:2106.13892 [physics.optics] .
- Joannopoulos et al. [2008] J. D. Joannopoulos, S. G. Johnson, J. N. Winn, and R. D. Meade, Photonic Crystals: Molding the Flow of Light, 2nd ed. (Princeton University Press, Princeton (New Jersey), 2008).
- Lagendijk et al. [2009] A. Lagendijk, B. v. Tiggelen, and D. S. Wiersma, Fifty years of Anderson localization, Physics Today 62, 24 (2009).
- Schertel et al. [2019] L. Schertel, O. Irtenkauf, C. M. Aegerter, G. Maret, and G. J. Aubry, Magnetic-field effects on one-dimensional Anderson localization of light, Phys. Rev. A 100, 043818 (2019), 1812.06447 .
- Laurent et al. [2007] D. Laurent, O. Legrand, P. Sebbah, C. Vanneste, and F. Mortessagne, Localized modes in a finite-size open disordered microwave cavity, Phys. Rev. Lett. 99, 253902 (2007).
- Anderson [1958] P. W. Anderson, Absence of diffusion in certain random lattices, Phys. Rev. 109, 1492 (1958).
- Abrahams et al. [1979] E. Abrahams, P. W. Anderson, D. C. Licciardello, and T. V. Ramakrishnan, Scaling theory of localization: Absence of quantum diffusion in two dimensions, Phys. Rev. Lett. 42, 673 (1979).
- Skipetrov and Sokolov [2014] S. E. Skipetrov and I. M. Sokolov, Absence of Anderson localization of light in a random ensemble of point scatterers, Phys. Rev. Lett. 112, 023905 (2014).
- Sperling et al. [2016] T. Sperling, L. Schertel, M. Ackermann, G. J. Aubry, C. Aegerter, and G. Maret, Can 3D light localization be reached in ‘white paint’?, New J. Phys. 18, 013039 (2016), 1510.08092 .
- Skipetrov and Page [2016] S. E. Skipetrov and J. H. Page, Red light for Anderson localization, New J. Phys. 18, 021001 (2016), arXiv:1601.07848 [cond-mat.dis-nn] .
- Torquato and Stillinger [2003] S. Torquato and F. H. Stillinger, Local density fluctuations, hyperuniformity, and order metrics, Phys. Rev. E 68, 041113 (2003).
- Leseur et al. [2016] O. Leseur, R. Pierrat, and R. Carminati, High-density hyperuniform materials can be transparent, Optica 3, 763 (2016).
- Ricouvier et al. [2017] J. Ricouvier, R. Pierrat, R. Carminati, P. Tabeling, and P. Yazhgur, Optimizing hyperuniformity in self-assembled bidisperse emulsions, Phys. Rev. Lett. 119, 208001 (2017), arXiv:1711.00719 [cond-mat.soft] .
- Froufe-Pérez et al. [2016] L. S. Froufe-Pérez, M. Engel, P. F. Damasceno, N. Muller, J. Haberko, S. C. Glotzer, and F. Scheffold, Role of short-range order and hyperuniformity in the formation of band gaps in disordered photonic materials, Phys. Rev. Lett. 117, 053902 (2016).
- Froufe-Pérez et al. [2017] L. S. Froufe-Pérez, M. Engel, J. J. Sáenz, and F. Scheffold, Band gap formation and Anderson localization in disordered photonic materials with structural correlations, Proceedings of the National Academy of Sciences 114, 9570 (2017).
- Sgrignuoli et al. [2022] F. Sgrignuoli, S. Torquato, and L. Dal Negro, Subdiffusive wave transport and weak localization transition in three-dimensional stealthy hyperuniform disordered systems, Phys. Rev. B 105, 064204 (2022).
- Haberko et al. [2020] J. Haberko, L. S. Froufe-Pérez, and F. Scheffold, Transition from light diffusion to localization in three-dimensional amorphous dielectric networks near the band edge, Nat. Commun. 11, 4867 (2020).
- Aubry et al. [2020] G. J. Aubry, L. S. Froufe-Pérez, U. Kuhl, O. Legrand, F. Scheffold, and F. Mortessagne, Experimental tuning of transport regimes in hyperuniform disordered photonic materials, Phys. Rev. Lett. 125, 127402 (2020), 2003.00913 .
- Klatt et al. [2022] M. A. Klatt, P. J. Steinhardt, and S. Torquato, Wave propagation and band tails of two-dimensional disordered systems in the thermodynamic limit, Proceedings of the National Academy of Sciences 119, e2213633119 (2022).
- Froufe-Pérez et al. [2023] L. S. Froufe-Pérez, G. J. Aubry, F. Scheffold, and S. Magkiriadou, Bandgap fluctuations and robustness in two-dimensional hyperuniform dielectric materials, Opt. Express 31, 18509 (2023).
- Granchi et al. [2023] N. Granchi, M. Lodde, K. Stokkereit, R. Spalding, P. J. van Veldhoven, R. Sapienza, A. Fiore, M. Gurioli, M. Florescu, and F. Intonti, Near-field imaging of optical nanocavities in hyperuniform disordered materials, Phys. Rev. B 107, 064204 (2023).
- Dal Negro [2022] L. Dal Negro, Waves in complex media (Cambridge University Press, 2022).
- Dal Negro and Boriskina [2012] L. Dal Negro and S. Boriskina, Deterministic aperiodic nanostructures for photonics and plasmonics applications, Laser & Photonics Reviews 6, 178 (2012).
- Dal Negro et al. [2016] L. Dal Negro, R. Wang, and F. A. Pinheiro, Structural and spectral properties of deterministic aperiodic optical structures, Crystals 6, 161 (2016).
- Sgrignuoli et al. [2020] F. Sgrignuoli, S. Gorsky, W. A. Britton, R. Zhang, F. Riboli, and L. Dal Negro, Multifractality of light in photonic arrays based on algebraic number theory, Communications Physics 3, 106 (2020).
- Reisner et al. [2022] M. Reisner, Y. Tahmi, F. Piéchon, U. Kuhl, and F. Mortessagne, Experimental observation of multifractality in Fibonacci chains (2022), arXiv:2207.13755 [cond-mat.dis-nn] .
- Sgrignuoli and Dal Negro [2020] F. Sgrignuoli and L. Dal Negro, Subdiffusive light transport in three-dimensional subrandom arrays, Phys. Rev. B 101, 214204 (2020).
- Sgrignuoli et al. [2019] F. Sgrignuoli, R. Wang, F. A. Pinheiro, and L. Dal Negro, Localization of scattering resonances in aperiodic Vogel spirals, Phys. Rev. B 99, 104202 (2019), arXiv:1810.01909 [cond-mat.dis-nn] .
- Noh et al. [2011] H. Noh, J.-K. Yang, S. V. Boriskina, M. J. Rooks, G. S. Solomon, L. Dal Negro, and H. Cao, Lasing in Thue–Morse structures with optimized aperiodicity, Applied Physics Letters 98, 201109 (2011).
- Vardeny et al. [2013] Z. V. Vardeny, A. Nahata, and A. Agrawal, Optics of photonic quasicrystals, Nature Photonics 7, 177 (2013).
- Razi et al. [2019] M. Razi, R. Wang, Y. He, R. M. Kirby, and L. Dal Negro, Optimization of large-scale Vogel spiral arrays of plasmonic nanoparticles, Plasmonics 14, 253 (2019).
- Lee et al. [2010] S. Y. Lee, J. J. Amsden, S. V. Boriskina, A. Gopinath, A. Mitropolous, D. L. Kaplan, F. G. Omenetto, and L. Dal Negro, Spatial and spectral detection of protein monolayers with deterministic aperiodic arrays of metal nanoparticles, Proceedings of the National Academy of Sciences 107, 12086 (2010).
- Gopinath et al. [2009] A. Gopinath, S. V. Boriskina, B. M. Reinhard, and L. Dal Negro, Deterministic aperiodic arrays of metal nanoparticles for surface-enhanced raman scattering (sers), Opt. Express 17, 3741 (2009).
- Trevino et al. [2011] J. Trevino, H. Cao, and L. Dal Negro, Circularly symmetric light scattering from nanoplasmonic spirals, Nano Letters 11, 2008 (2011).
- Huang et al. [2007] F. M. Huang, Y. Chen, F. J. G. de Abajo, and N. I. Zheludev, Optical super-resolution through super-oscillations, Journal of Optics A: Pure and Applied Optics 9, S285 (2007).
- Dal Negro et al. [2012] L. Dal Negro, N. Lawrence, and J. Trevino, Analytical light scattering and orbital angular momentum spectra of arbitrary vogel spirals, Opt. Express 20, 18209 (2012).
- Christofi et al. [2016] A. Christofi, F. A. Pinheiro, and L. Dal Negro, Probing scattering resonances of Vogel’s spirals with the Green’s matrix spectral method, Opt. Lett. 41, 1933 (2016).
- Pollard and Parker [2009] M. E. Pollard and G. J. Parker, Low-contrast bandgaps of a planar parabolic spiral lattice, Opt. Lett. 34, 2805 (2009).
- Prado et al. [2021] M. Prado, F. Sgrignuoli, Y. Chen, L. Dal Negro, and F. A. Pinheiro, Structural entropy and spatial decay of quasimodes in vogel spirals, Phys. Rev. B 104, 184204 (2021).
- Main et al. [2000] J. Main, P. A. Dando, D. Belkic, and H. S. Taylor, Decimation and harmonic inversion of periodic orbit signals, Journal of Physics A: Mathematical and General 33, 1247 (2000).
- Wiersig and Main [2008] J. Wiersig and J. Main, Fractal Weyl law for chaotic microcavities: Fresnel’s laws imply multifractal scattering, Phys. Rev. E 77, 036205 (2008).
- Kuhl et al. [2010] U. Kuhl, S. Barkhofen, T. Tudorovskiy, H.-J. Stöckmann, T. Hossain, L. de Forges de Parny, and F. Mortessagne, Dirac point and edge states in a microwave realization of tight-binding graphene-like structures, Phys. Rev. B 82, 094308 (2010).
- Barkhofen et al. [2013] S. Barkhofen, M. Bellec, U. Kuhl, and F. Mortessagne, Disordered graphene and boron nitride in a microwave tight-binding analog, Phys. Rev. B 87, 035101 (2013).
- Thouless [1977] D. J. Thouless, Maximum metallic resistance in thin wires, Phys. Rev. Lett. 39, 1167 (1977).
- Wang and Genack [2011] J. Wang and A. Z. Genack, Transport through modes in random media, Nature 471, 345 (2011).
- Mondal et al. [2019] S. Mondal, R. Kumar, M. Kamp, and S. Mujumdar, Optical Thouless conductance and level-spacing statistics in two-dimensional Anderson localizing systems, Phys. Rev. B 100, 060201(R) (2019).
Supplemental Material
I Definition of Vogel spirals
Vogel spirals are defined by their polar coordinates as
| (S1) |
where is an integer, is a positive constant, and is an irrational number. The scaling factor sets the particle separation while is the divergence angle and determines the constant aperture between successive point. The angle is specified as a function of the irrational number as where is the fractional part of . When is irrational, point patterns are characterized by a lack of both translational and rotational symmetries.
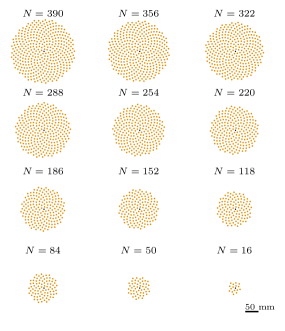
In this work, we focus in the Golden-Angle (GA) Vogel spiral, also known as “sunflower spiral”, which is obtained by considering as the golden number leading to also called the “golden angle”. Experimentally, 12 samples consisting of () cylinders are placed and measured for different heights of the cavity ( and 17 mm are presented in this work). All samples are characterized by the same scaling factor mm and their centers are always located at where the central antenna sets the origin . Figure S1 shows the 12 different GS experimentally studied in this work.
II Experimental map
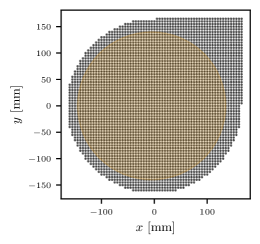
Experimental measurements are carried out over a surface determined by a circle of 160 mm radius centred in the origin . In order to observe the electric field out of the lattice, we superimpose a 165 mm size square with corners at , , and . The resulting area is mapped in a regular mm2 grid unit cell. Figure S2 shows the experimental map used to scan the cavity where each grey point represents a measured point and the orange circle the space occupied for the array of cylinders (). The total of measured positions is .
III Disordered system
For the sake of comparison, besides the main analysis carried out in the GA spiral, we also study the modal structure and microwave transport in a traditional disordered systems (DS). The disordered point pattern is generated using the software developed in [14] and considers a set of packing hard disks of radius mm enclosed into a circle of radius 140 mm, thus the planar density is constant respect to the GA spiral case ( cm-2, see Fig. S3).
Here, mm is the size of our experimental cylinders plus the size of the tube used to place the cylinders. The cavity is mapped using the same experimental map (see Fig. S2) in the same frequency range (from 5.5 GHz to 15 GHz) than the GA spiral case. Both reflected and transmitted signals are measured. Data analysis to obtain the eigenmodes of the systems (via the harmonic inversion/clustering method), the characteristic decay time (via the Fourier transform), the Density of States (via the reflected signal) and the Thouless conductance (via and the ) is performed as explained in the main text.
Figures S4[(a), (d), (g) and (j)] show four eigenmodes found by means of the harmonic inversion/clustering algorithms in the DS.
Since disordered systems lack of a center (in contrast to Vogel spirals), their eigenmodes are not centered in the system. This makes the field amplitude spatial autocorrelation [see Fig. S4(b), (e), (h) and (k)], defined as
| (S2) |
the most suitable quantity to study the radial decay [see Fig. S4(c), (f), (i) and (l)] [5]. As it can be observed, all eigenmodes present large quality factors and a clear exponential radial decay of their autocorrelation functions no matter their spatial extension, frequency, the position of their center, or the amplitude distribution with respect to the center of the mode, as expected. The localization lenght is extracted by assuming .
The characteristic time , the DOS and the average Thouless conductance are computed and plotted in Fig. S5[(a), (b) and (c), respectively]. Similarly to the GA spiral case, varies from flat valleys to high peaks. Nevertheless, in contrast to the GA spiral case, no band gap can be clearly observed in the DOS. The maxima -values found in the GA spiral case are ns, ns and ns for the first and second confined regions, respectively, while in the disordered case ns. Hence we conclude that the characteristic energy decay time in disordered and aperiodic Vogel spiral structures is of the same order. Finally, the average Thouless conductance shows a fast decay of around one order of magnitude in the frequency windows where exponential eigenmodes are found by the harmonic inversion/clustering method.
IV Scaling analysis
To investigate how the transport quantities as well as the modes are affected by the boundaries of the spiral, the experiment is repeated for 12 different configurations, and for each one of them, the number of cylinders in the array is reduced according to (). In Fig. S6, we show [(a) and (b)] the characteristic decay time , [(c) and (d)] the normalized density of states, and [(e) and (f)] the average Thouless conductance as a function of the number of cylinders and frequency in two frequency windows containing the analyzed long-lived modes (from 6 to 7 GHz and from 10.5 to 11.5 GHz). The spatial structure of three different eigenmodes with characteristic (g) power-law, (h) exponential, and (i) Gaussian decays found by the harmonic inversion/clustering methods are also shown in Fig. S6. Note that below a certain threshold [(g) , (h) , (i) ], the number of resonances recovered by the harmonic inversion is found to be insufficient to form a cluster and subsequently to reveal the spatial structure of the modes.
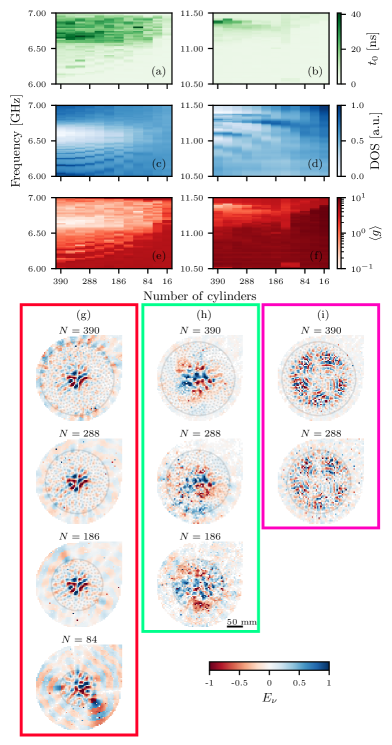
Around GHz, Fig. S6(a) and (e) show that the localization signatures earlier analyzed (high values and ) remain unperturbed even for lattices with a reduced number of cylinders , while Fig. S6(c) shows that the density of states start to lose its structure and becomes flat below . Here the leaking of the wave out of the spiral is driven by the absence of certain cylinders needed to support the long-lived modes. This fact is illustrated by the power-law and exponential modes [see Fig. S6(g) and (h), respectively] which cannot be recovered by our analysis whenever the typical system size becomes smaller than the noticeable modal size when and , respectively. At higher frequency, Gaussian modes are found to have larger sizes, and are therefore more sensitive to changes in the system boundaries so that they can only exist for larger systems . This value of also determines a critical value above which Gaussian modes with high () values disappear [Fig. S6(b)]. Nevertheless, the DOS remains unperturbed even for larger systems ().