Identifying the discs, bulges, and intra-halo light of simulated galaxies through structural decomposition
Abstract
We perform a structural decomposition of galaxies identified in three cosmological hydrodynamical simulations by applying Gaussian Mixture Models (GMMs) to the kinematics of their stellar particles. We study the resulting disc, bulge, and intra-halo light (IHL) components of galaxies whose host dark matter haloes have virial masses in the range – . Our decomposition technique isolates galactic discs whose mass fractions, , correlate strongly with common alternative morphology indicators; for example, is approximately equal to , the fraction of stellar kinetic energy in co-rotation. The primary aim of our study, however, is to characterise the IHL of galaxies in a consistent manner and over a broad mass range, and to analyse its properties from the scale of galactic stellar haloes up to the intra-cluster light. Our results imply that the IHL fraction, , has appreciable scatter and is strongly correlated with galaxy morphology: at fixed stellar mass, the IHL of disc galaxies is typically older and less massive than that of spheroids. Above , we find, on average, , albeit with considerable scatter. The transition radius beyond which the IHL dominates the stellar mass of a galaxy is roughly for disc galaxies, but depends strongly on halo mass for spheroids. However, we find that no alternative IHL definitions – whether based on the ex-situ stellar mass, or the stellar mass outside a spherical aperture – reproduce our dynamically-defined IHL masses.
keywords:
galaxies: evolution – galaxies: kinematics and dynamics – galaxies:stellar content – galaxies: structure – methods: numerical1 Introduction
In the ‘-cold dark matter’ (CDM) cosmological model, structure forms in a hierarchical manner. Galaxies are expected to have undergone numerous accretion events over their lifetime, building up their stellar mass at least in part through mergers with lower-mass ones. In principle, these accretion events should leave an observable imprint on present-day galaxies in the form of an extended stellar component: the intra-halo light (IHL; see e.g. Purcell et al., 2007). The ubiquity of merger events in the CDM model implies that the IHL should be present, to some extent, in most galaxies (Bullock & Johnston, 2005). Indeed, the IHL has been observed across a broad range of galaxy masses; it is typically referred to as a stellar halo at the galactic scale (see Helmi, 2008, for a review of the Milky Way’s, MWs, stellar halo), and as intra-group (cluster) light at the galaxy group (cluster) scale (see Contini, 2021; Montes & Trujillo, 2022, for reviews).
Our understanding of the mass fraction, spatial distribution and stellar populations of the IHL, as well as how they vary with host halo mass, is limited, partly due to difficulties defining the IHL unambiguously (see e.g. Sanderson et al., 2018, and references therein). Nonetheless, there is mounting evidence hinting at a connection between present day IHL properties and the formation of its host galaxy and dark matter (DM) halo. In the case of the MW, observations of individual halo stars (e.g., by the Gaia Collaboration et al., 2021) have revolutionised our understanding of the Galaxy’s formation history through the discovery of distinct substructures in 6D phase space (e.g., the Gaia Enceladus/Sausage; Belokurov et al., 2018; Helmi et al., 2018) or distinct chemodynamical sub-populations (e.g. Kruijssen et al., 2019; Horta et al., 2020; Buder et al., 2022), which are the likely remnants of destroyed satellites that merged with the MW early in its formation. At the galaxy cluster scale, Deason et al. (2021) showed that the stellar density profiles of simulated clusters exhibit a well-defined edge, coincident with the ‘splashback’ radius of the underlying DM halo (e.g. Adhikari et al., 2014; Diemer, 2017). This feature has since been detected observationally (Gonzalez et al., 2021), indicating that the IHL may provide an observable probe of the underlying DM distribution.
Despite recent observational progress, accurately characterising the IHL for a representative sample of extragalactic galaxies remains challenging. Surveys based on resolved stellar populations provide a wealth of information on halo stars, but these measurements can only be obtained for nearby systems (e.g. Barker et al., 2009; Ibata et al., 2013; Harmsen et al., 2017). Deep integrated light surveys provide an alternative approach to studying the IHL of extragalactic systems, where the surface brightness profiles of galaxies can be decomposed based on assumptions about the analytic form appropriate for specific galactic components. Merritt et al. (2016) measured the IHL of 8 nearby disc galaxies by decomposing their stellar mass surface density profiles, finding an RMS scatter in the IHL mass fraction of approximately 1 dex, indicating that the IHL fraction varies significantly, even for galaxies with similar morphologies and stellar masses. The IHL fractions of galaxy groups and clusters at also exhibit significant scatter, with measured fractions ranging from a few per cent to per cent (e.g. Montes, 2022). It is unclear how much of this scatter is inherently physical in origin (due to, for example, stochastic variations in formation histories, e.g. Fattahi et al., 2020; Rey & Starkenburg, 2022), and how much is a result of the inconsistent methodologies adopted by different observational studies (see, e.g., Kluge et al., 2021).
The outlook for characterising the IHL consistently across different environments is perhaps more promising in cosmological, hydrodynamical simulations, in which the various structural components of galaxies can in principle be identified from the kinematics of their stellar particles. In particular, understanding the formation mechanisms of the IHL and how they vary as a function of mass can be addressed with large volume cosmological simulations, where galaxies that form in a broad range of environments can be studied and tracked over time (e.g. Schaye et al., 2015; Pillepich et al., 2018; Davé et al., 2019).
Cañas et al. (2020) introduced an adaptive phase-space algorithm, specifically designed to distinguish kinematically hot stellar particles (which they identified with the IHL) from centrally concentrated stellar structures and applied it to galaxies identified in the Horizon-AGN simulation (Dubois et al., 2016). This allowed them to study the mass-dependence of the IHL fractions of a diverse population of galaxies, which revealed that the scatter in IHL masses is correlated with kinematic measures of galaxy morphology. While their method was effective in identifying the IHL of galaxies in diverse environments, their results depend on a free parameter that had to be calibrated to a small number of uncertain observations.
Unsupervised machine learning techniques provide a viable alternative for identifying kinematically distinct structures within simulated galaxies (e.g. Doménech-Moral et al., 2012). Obreja et al. (2016) showed that Gaussian Mixture Models (GMMs) can be applied to the stellar components of galaxies to identify discs, bulges, and stellar haloes, whose properties resemble those of observed systems. Automating structural decomposition for a diverse galaxy sample is, however, non-trivial. As a result, studies are typically limited to small samples of galaxies, for which the clusters of stars identified by the GMMs can be manually assigned to different galactic components (Obreja et al., 2018; Obreja et al., 2019), or they are limited to galaxies within a narrow range of mass or morphology (e.g. Ortega-Martinez et al. 2022, though see Du et al. 2019).
In this work, we use GMMs to characterise the disc, bulge and IHL components of simulated galaxies across a wide range of halo masses. We apply our methodology to galaxies from three simulations based on the Eagle model of galaxy formation, allowing us to study how the mass fraction, stellar populations and structure of these components vary from the galactic scale up to the scale of massive galaxy clusters. The remainder of this paper is organised as follows. In Section 2, we describe the Eagle simulations and introduce the kinematic quantities used in our structural decomposition. In Section 3, we introduce our decomposition technique and compare our results to alternative techniques. In Section 4, we analyse the stellar populations and structural properties of the disc, bulge, and IHL components; and in Section 5 we summarise our results.
2 Simulations and analysis
2.1 The Eagle simulations
The Eagle Project (Schaye et al., 2015; Crain et al., 2015) is a suite of cosmological, smoothed particle hydrodynamical (SPH) simulations that model the formation and evolution of galaxies in a CDM universe using cosmological parameters consistent with the Planck Collaboration et al. (2014) results. The majority of our analysis is based on the cubic Mpc “Reference” run of the Eagle Project (i.e. Ref-L0100N1504; see Table 2 of Schaye et al. 2015), which follows structure formation using equal-mass dark matter (DM) particles and initially the same number of baryonic particles. The mass of DM particles is , and is the initial baryonic particle mass.
Initial conditions were evolved to using an updated version of Gadget-3 (Springel, 2005; Schaye et al., 2015) that includes subgrid models for, among other processes, radiative cooling and photoheating (Wiersma et al., 2009), star formation and stellar feedback (Schaye & Dalla Vecchia, 2008; Dalla Vecchia & Schaye, 2012) the growth of supermassive black holes (BHs) through mergers and accretion, and feedback from active galactic nuclei (AGN; Rosas-Guevara et al. 2015). The subgrid model parameters were calibrated so that Eagle reproduced observations of the galaxy stellar mass function, the stellar size-mass relation, and the black hole mass-stellar mass relation (see Crain et al., 2015, for details). Subsequent work has shown that Eagle also reproduces observations of galaxies at , such as their angular momenta (Lagos et al., 2017), sizes (Furlong et al., 2017), velocity dispersion, and rotational velocities (van de Sande et al., 2019), highlighting that galaxy structure and kinematics are reproduced well by Eagle.
We supplement results from Ref-L0100N1504 at high and low halo masses using data from two other simulations. One is the Cluster-Eagle project (C-Eagle; Bahé et al. 2017; Barnes et al. 2017), which is a suite of 30 resimulations of cluster-mass haloes; the other is a Eagle volume simulated using higher resolution in the DM component while maintaining the original baryonic particle mass and force resolution that was used for Eagle (see Ludlow et al. 2023, for details). We use the latter run, which is referred to in our paper as 50-HiResDM, to test the sensitivity of our results to the spurious collisional heating of stellar particles by DM halo particles (see, e.g., Ludlow et al., 2019, 2021; Wilkinson et al., 2023). 50-HiResDM employed the same subgrid models, as well as the same numerical and subgrid parameters as Eagle, but its DM particle mass is , i.e. a factor of 7 lower than the value used for Ref-L0100N1504. The C-Eagle project used the same subgrid and numerical set-up as Eagle, but adopted different parameters for the AGN feedback subgrid model to achieve better agreement with the observed gas content of galaxy clusters (see Bahé et al. 2017 and Barnes et al. 2017 for details).
2.2 Identifying DM haloes and galaxies
DM haloes, their substructure haloes and associated galaxies were identified using Subfind (Springel et al., 2001; Dolag et al., 2009). Haloes were first identified using a Friends-of-Friends algorithm (FoF; Davis et al. 1985), which links nearby DM particles into FoF groups. Baryonic particles were assigned to the same group as their nearest DM particle, provided it belonged to one. Each FoF halo was then divided into self-bound substructures, or “subhaloes” for short. One subhalo typically dominates the total mass of the FoF halo – we refer to this as the “central” subhalo; lower-mass subhaloes we refer to as “satellite” subhaloes. The baryonic particles associated with central and satellite subhaloes are referred to as central and satellite galaxies, respectively. The stellar mass of a galaxy, , is defined as the total mass of all stellar particles gravitationally bound to a subhalo.
We restrict our analysis to stellar particles associated with central galaxies identified at , but exclude those bound to satellite galaxies. We note that this choice may be questionable for systems with large numbers of satellite galaxies or for those undergoing mergers; in these cases, distinguishing stellar particles that are bound to a central galaxy from those bound to its satellites is challenging. However, we find that MW-mass central galaxies in Eagle typically contribute 97 per cent of the total stellar mass associated with their FoF haloes, with satellites contributing per cent. At higher halo masses, however, where mergers and substructure are more prevalent, the contribution of satellite galaxies to the total stellar mass of FoF haloes can be quite large, sometimes reaching as high as per cent for halo masses . Satellite galaxies, however, typically dominate the stellar mass budget at larger galacto-centric radii than that which encompasses the majority of the central’s stellar material. For that reason, we neglect the possible contribution of satellites to the IHL of galaxies.
We henceforth quantify halo masses using , i.e. the total mass (DM plus baryonic) within the spherical radius that encloses a mean density of , where is the critical density, is the Hubble parameter, and is the gravitational constant. The centres of haloes and galaxies are defined as the location of their DM particle with the lowest gravitational potential energy.
2.3 Kinematic quantities used for structural decomposition
We begin by repositioning the stellar particles of each central galaxy relative to its halo centre. The velocity frame of the galaxy is at rest with respect to the centre of mass motion of the innermost 80 per cent of its stellar mass. All positions and velocities from herein refer to these recentred quantities.
Galaxies are then oriented such that the -axis aligns with their total stellar angular momentum vector, , which is calculated using all stellar particles between 2 and 30 kpc. The lower limit of 2 kpc is imposed to minimise contributions from stellar particles with disordered motions, or from kinematically decoupled cores111Although these are rare in Eagle (Lagos et al., 2022), they can impact the measured stellar angular momentum significantly., while the upper limit minimises the contribution from particles that do not belong to the central disc or spheroidal component of the galaxy. We have verified the orientation of is robust to reasonable variations to the upper and lower radial limits.
We use the following quantities to decompose Eagle galaxies into distinct structural components, which may include a disc, a bulge, and IHL:
-
•
: The specific angular momentum in the -direction relative to the specific angular momentum of a particle on a circular orbit with the same binding energy. This quantity was first introduced by Abadi et al. (2003) to isolate disc stars; it is commonly referred to as the orbital circularity parameter. Particles with values of 1 (-1) are on prograde (retrograde) circular orbits in the plane perpendicular to the net angular momentum vector (i.e., in the disc plane of a late type galaxy).
-
•
: The specific angular momentum in the plane parallel to (i.e., perpendicular to the disc of a late type galaxy), normalised by (note that in our coordinate system, ). This quantity was first introduced by Doménech-Moral et al. (2012) to aid in identifying disc stars.
-
•
: The ratio of the specific binding energy of a particle to that of the most bound stellar particle in the galaxy.
For a given value of the specific binding energy, the maximum value of the specific angular momentum corresponds to that of a particle on a prograde circular orbit, which we refer to as (Abadi et al., 2003). We estimate numerically using the orbital information of stellar particles (see also Thob et al., 2019; Kumar et al., 2021). Particles are first divided into 150 equally-spaced bins of specific binding energy. Within each bin, the maximum value of the specific angular momentum of all particles, , is taken to be the value of for particles within that bin. Due to the finite mass resolution of our simulations and the diffuse nature of galaxy outskirts, this approach may be inaccurate at large galacto-centric distances, where bins naturally contain fewer stellar particles than those in the central regions of galaxies. However, we have verified that the results of our galaxy decomposition are insensitive to reasonable variations in the number of binding energy bins used to calculate . This is because is mostly useful for identifying disc particles, which are centrally concentrated and located in regions of a halo that are well sampled by stellar particles.
3 Identifying the structural components of simulated galaxies
In this section, we introduce our structural decomposition technique and apply it to two example galaxies identified in Ref-L0100N1504 (S3.1). In S3.2, we test the effect of varying the number of Gaussians used by the GMM on the resulting disc, bulge, and IHL mass fractions, and in S3.3 we compare the results of our decomposition to alternative estimates of the kinematic morphologies and IHL fractions of galaxies. The results in this section are limited to central galaxies identified at in Ref-L0100N1504 that have , resulting in a sample of 2415 galaxies. This halo mass limit ensures that the structural and kinematic properties of the galaxies are robust to spurious heating by DM particles at their half stellar mass radii (; see Table 2 of Ludlow et al., 2023).
3.1 Decomposing the stellar component of Eagle galaxies using GMMs
We use GMMs to decompose the stellar components of Eagle galaxies into at most three physical components – a disc, a centrally concentrated bulge, and an extended IHL – but make no attempt to isolate dynamically distinct sub-components of them (i.e. we do not distinguish between thin and thick discs, or classic- and pseudo-bulges). We follow Obreja et al. (2016, see also ) and use the kinematic parameter space of stellar particles defined by their values of , , and . Our GMMs find particle clusters in this parameter space and approximate their distributions with multi-dimensional Gaussians. The GMMs evaluate the probability of each stellar particle belonging to each of these Gaussian distributions. In this work, particles are wholly allocated to the Gaussian distribution to which they are assigned the largest probability (i.e. we adopt a hard classification) and these Gaussian components are later associated with the different structural components of a galaxy.
The optimal number of Gaussian distributions, , required to disentangle the various components of a galaxy is not known a priori, so assumptions must be made. Obreja et al. (2019) applied GMMs to 25 galaxies simulated at high resolution using and associated each of the best-fit Gaussians to one physical galaxy component: a thin or thick disc, classical- or pseudo-bulge, or a stellar halo. However, the structural components of galaxies may not follow simple Gaussian distributions in the input parameter space (e.g. they may posses kinematic substructure or exhibit non-Gaussian distribution functions), and when they do not multiple Gaussian distributions per galaxy component seem to fare better. Du et al. (2019) used a modified Bayesian information criterion to determine that works well for galaxies in Illustris-TNG100 (Pillepich et al., 2018) with stellar masses ; they assigned each Gaussian to a physical galaxy component based on the values222We follow the nomenclature of Du et al. (2019) and denote the mean of the Gaussians output by our GMM fits using angular brackets, e.g. or . of and .
Morphological classification
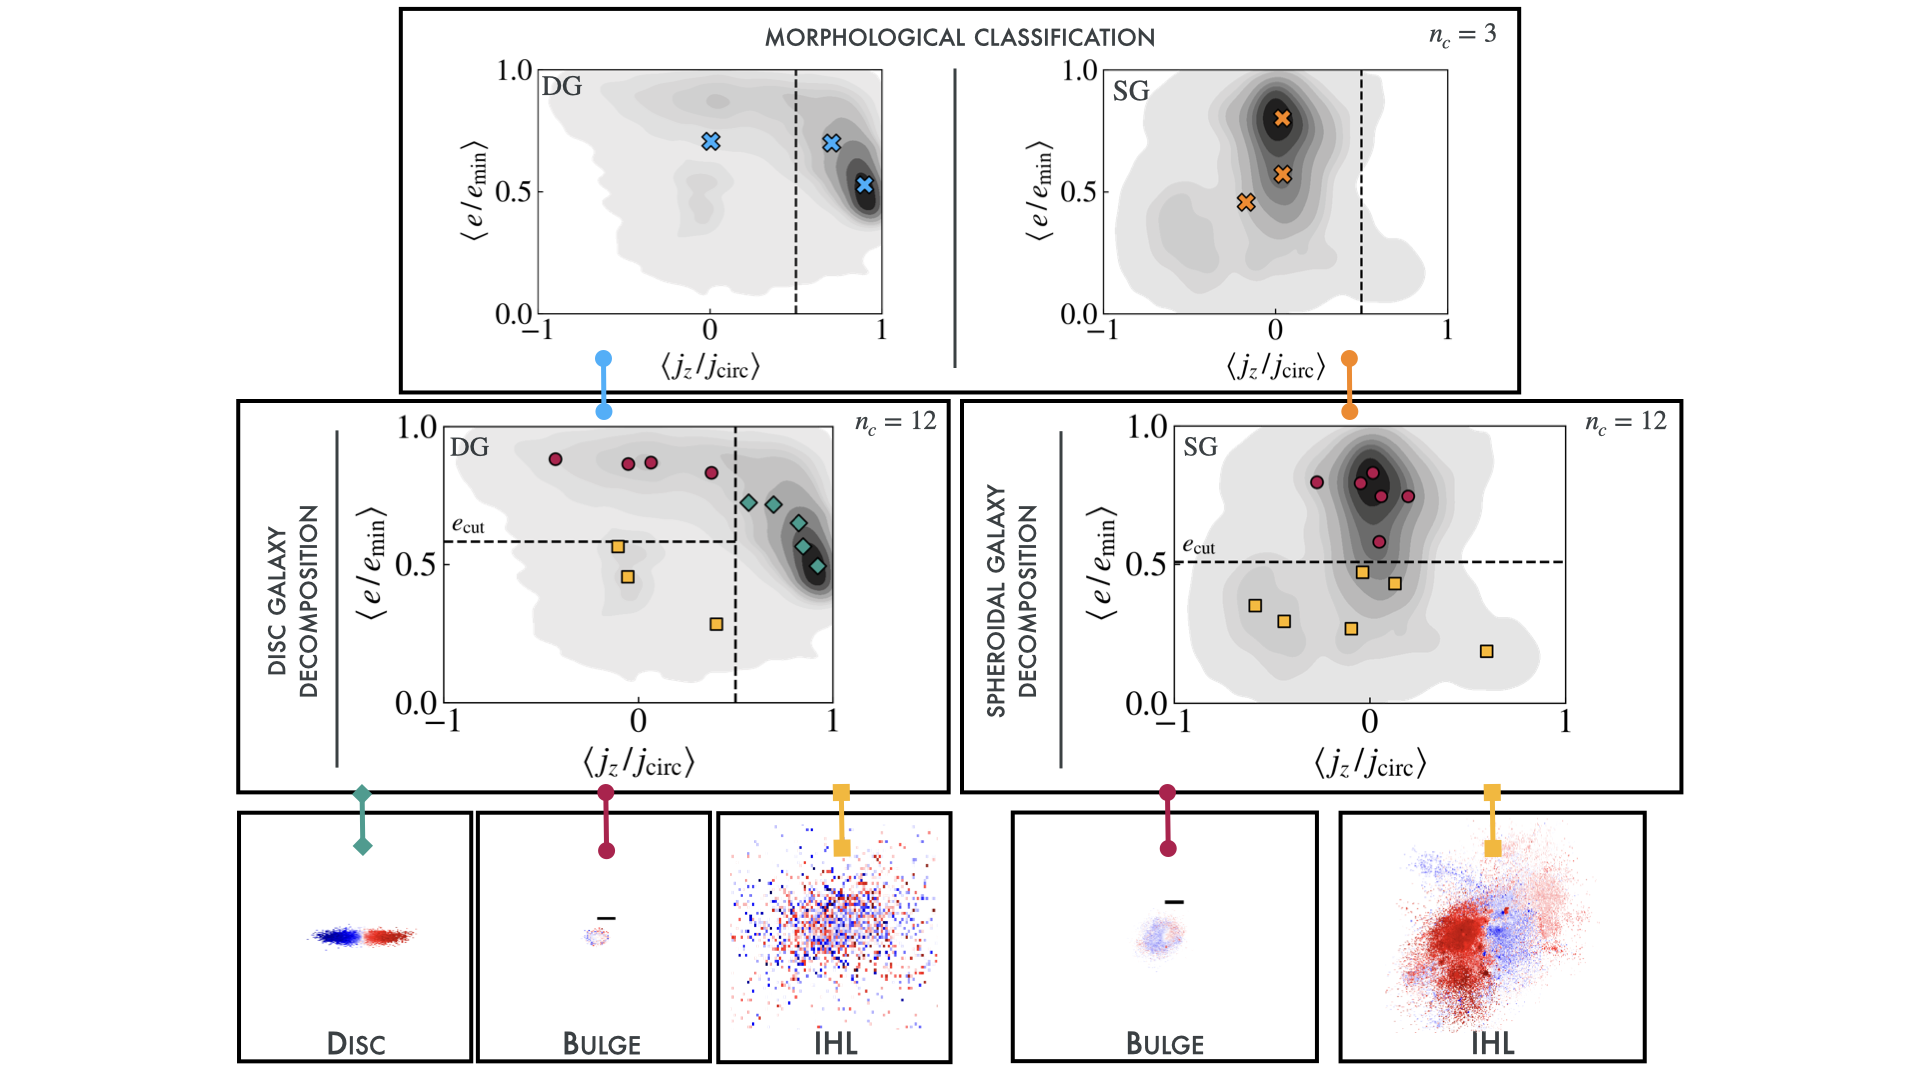
We follow a different approach, and initially set in order to assess whether each galaxy possesses a significant disc component or if it can be approximated as a pure spheroid. If one or more of the best-fit Gaussians have a mean circularity we classify the galaxy as a disc (and hereafter refer to them as “disc” galaxies), otherwise it is spheroid dominated (hereafter, “spheroid”). After some experimentation, we found that this initial morphological classification prevents the identification of spurious discs in dispersion dominated galaxies for GMMs run with larger , cases that often lead to net counter-rotating spheroidal components. This occurs because dispersion supported systems often contain a small but significant fraction of stellar orbits with high values, and assigning those orbits to a “disc” skews the distribution of the remaining values lower. The top panels of Fig. 1 show two typical galaxies that were classified as a disc (left panel) and spheroid (right panel) using .
After categorising galaxy morphologies this way, we again run GMMs but this time using a range of values. For the bulk of our analysis we adopt , but discuss below how increasing or decreasing affects the median mass fractions of the various structural components of galaxies inferred from GMMs, as well as the intrinsic variation in them for individual galaxies.
Disc galaxy decomposition
For all , disc galaxies are modelled using the (, , ) parameter space of stellar particles and we assign the corresponding best-fit Gaussian distributions to one of the three physical galaxy components based on their values of and . Those with are assigned to the disc, and the rest are split between the bulge and IHL. To do so, we identify the Gaussian distributions with the maximum and minimum values and define as the midpoint between them, i.e. . The remaining Gaussian clusters not assigned to the disc (i.e. those with ) are assigned to the bulge if , or to the IHL if . Note that there is the chance that the IHL will not be detected, as is the case for the disc model in Fig. 1 (upper-left panel). This occurs most often when is small and the IHL is significantly less massive than the disc and bulge components.
Spheroidal galaxy decomposition
We run the same GMMs for spheroids, but this time using (, ) as the input parameter space (the broad distributions for the bulges and IHL of spheroidal galaxies overlap considerably making this quantity less useful for distinguishing these components). As for discs, Gaussians with are assigned to the bulge; those with are assigned to the IHL333If we instead adopt a fixed specific binding energy cut of to distinguish the bulge and IHL components, bulge masses are systematically higher by about 5 per cent; IHL masses are systematically lower by roughly 20 per cent..
Applying the method to example galaxies
The middle row of Fig. 1 show the results of running a GMM using on the disc and spheroidal galaxies mentioned above, and in the bottom row we plot projections of the stellar particles assigned to each component (these galaxies are hereafter referred to as DG and SG, respectively). DG (left) is roughly the mass of the MW, having and . SG is the central galaxy of a low-mass cluster with and . Teal diamonds, maroon circles, and yellow squares show the values of and corresponding to the best-fit Gaussians assigned to the disc, bulge, and IHL, respectively.
The vertical black lines show the value of used to distinguish Gaussians assumed to represent the disc component from those that represent the bulge or IHL. The horizontal black lines show the values of . For DG, we find whereas for SG . We note that these values are lower than the value of 0.75 adopted in previous work (e.g. Du et al., 2020, 2021) to distinguish between GMM Gaussians representing the bulges and IHL of simulated disc galaxies, but the most appropriate value of for a particular galaxy is unclear. Recent work suggests that the optimal cut in binding energy may depend on galaxy morphology (e.g. Zana et al., 2022). Nonetheless, when applied to DG, our method effectively separates the tightly-bound stellar structures (i.e. the bulge) from the loosely-bound ones (i.e. the IHL). For SG, the separation between the bulge and IHL components is less clear: several Gaussians have , suggesting that the bulge and IHL components of this galaxy are less dynamically distinct than those of DG.
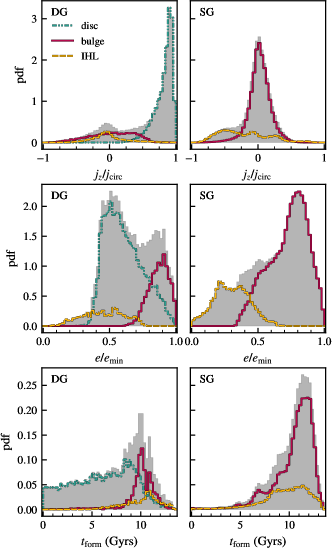
Fig. 2 shows a few properties of the stellar particles belonging to the different structural components of DG (left column) and SG (right column; in both cases, the structural components were identified using a GMM with ). The top and middle rows show the distributions of and , respectively; the bottom row shows the distributions of stellar ages (). Grey histograms in each panel represent all stellar particles belonging to each galaxy, and the colored lines show the subset of stellar particles assigned to the disc (teal dotted-dashed lines), bulge (solid maroon lines), and IHL (dashed yellow lines).
DG is composed of three distinct components: a rotationally supported disc, a tightly bound bulge and a loosely bound stellar halo (the latter two components are largely dispersion supported, as expected). The bottom left panel of Fig. 2 shows that the disc component formed over an extended time period, with star formation peaking Gyrs ago, and gradually tapering off to roughly half of the peak value by . The disc, which is composed primarily of stellar particles that formed in-situ (),444We use the ex-situ classification of Davison et al. (2020). Stellar particles are traced back to the snapshot prior to star formation: if the associated gas particle does not belong to the main branch of the subhalo at this snapshot, the stellar particles are flagged as having formed “ex-situ”. All other particles are flagged as having formed “in-situ”. has a half mass stellar age of 6.4 Gyr, and an interquartile age range of about 5 Gyr.
The bulge component of DG contains a slightly higher contribution from ex-situ stars () and is, on average, composed of the oldest stellar populations in the galaxy; its half mass stellar age is . The IHL component is the most extended in the galaxy (its half stellar mass radius is ; for the bulge, ) and is dominated by stars that formed ex-situ (), suggestive of a merger-driven formation scenario. Similar to the bulge component, the IHL hosts a relatively old stellar population with a half mass age of about 10.1 Gyrs. Neither the bulge nor the IHL contain an appreciable number of stellar particles with ages (the disc formed 54 per cent of its stellar mass in that time).
The bulge component of SG is similar to that of DG: it is dispersion-supported and comprised primarily of old stellar populations (the half mass age of bulge stars in SG is ). The visible peaks in the distribution of bulge stars does, however, indicate that the bulge contains several distinct stellar populations. Together with the high ex-situ fraction (), this implies a formation history dominated by multiple merger events, consistent with the standard model for the formation of brightest cluster galaxies (BCGs) in (e.g. De Lucia & Blaizot, 2007; Robotham et al., 2014). The IHL of SG is also dominated by ex-situ stars () and is comprised of two kinematically-distinct components: one dispersion-supported structure with a peak orbital circularity of , and another with a peak at . The latter component counter-rotates with respect to the net angular momentum of the galaxy and is visible in the plot of the component projections (see bottom panel of Fig 1).
3.2 The impact of varying on the decomposition results
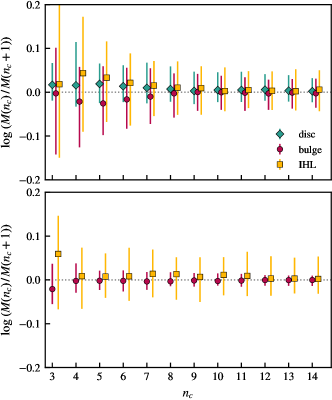
Fig. 3 shows the logarithmic change in the stellar mass that is allocated to the disc (teal diamonds; upper panel), bulge (maroon circles), and IHL (yellow squares) components of individual galaxies as is increased by , starting from and increasing to . The top and bottom panels show results separately for the subset of disc and spheroidal galaxies, respectively. Symbols correspond to the median555When calculating this ratio, we set if a particular component is undetected for a given value of . Doing so allows us to include such instances in our estimates of the scatter and logarithmic change in component masses as is increased, which would otherwise be biased by only including systems for which masses can be estimated. We note that such occurrences do not affect the medians values plotted in Fig. 3. values of , and error bars show in interquartile scatter (note: is used generically here to represent the mass assigned to a particular galaxy component after running a GMM that uses Gaussians).
The top panel of Fig. 3 shows that, for disc galaxies, the mass assigned to each structural component is typically robust provided . For spheroids, the situation is similar. The median masses assigned to the bulge and IHL of individual systems is largely unchanged when is increased from , although the scatter in mass assigned to the IHL of individual galaxies is larger than that of bulges for all . The larger scatter in the mass assigned the IHL component compared to the bulge of spheroidal galaxies is due its relatively low mass, which makes it more susceptible to small changes in . Note, however, that both the median mass fraction and scatter in mass assigned to each component, including the IHL, are well-behaved provided , regardless of galaxy morphology.
We adopt for our analysis for the following reason. If the Gaussian distributions are equally divided between the structural components of galaxies, it implies that the disc, bulge, and IHL of disc-dominated galaxies will each be identified by 4 Gaussian distributions; for spheroidal galaxies, the bulge and IHL will be identified by 6 Gaussians. The exact division of the Gaussians among the structural components of galaxies will, of course, vary from galaxy to galaxy, but allowing for multiple Gaussians per galactic component can better accommodate the presence of distinct sub-populations.
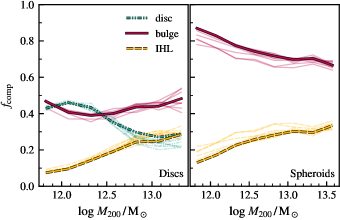
We stress, however, that the exact value of is somewhat arbitrary: provided , the masses allocated to the different structural components of most galaxies are relatively stable. This result is shown another way in Fig. 4, where we plot the fraction of mass assigned to the various structural components of discs (left) and spheroids (right) as a function of . The thick lines in each panel correspond to results obtained for ; the thin lines show results for other values of in the range . Note that the variation in the component mass fractions that arise from changing is smaller than the differences between the mass fractions of each component.
3.3 Comparison to alternative definitions of galaxy components
3.3.1 Relation to kinematic estimates of galactic morphology
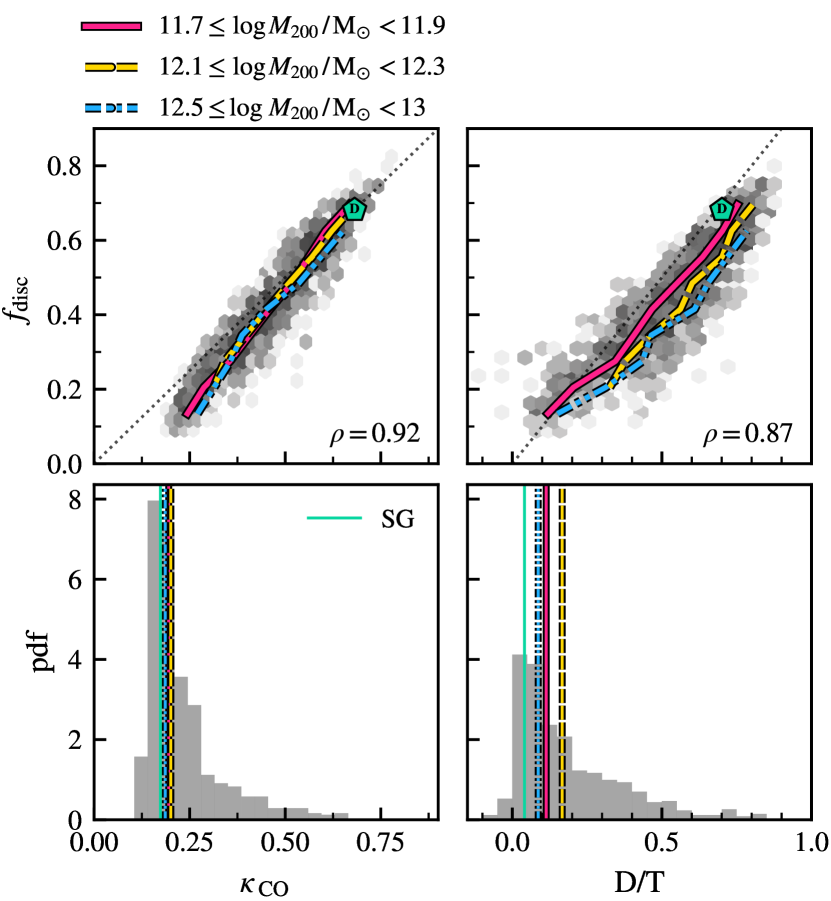
In Fig. 5 we compare the mass fraction allocated to the disc component by our GMM () with two other kinematic indicators666Specifically, we define , where is the total kinetic energy of the stellar particles, is the -component of the angular momentum of particle , and is its distance from the -axis. The disc-to-total ratio is defined as , where is the spheroid-to-total ratio and is the mass of the stellar particle. of galaxy morphology: the fraction of kinetic energy in co-rotation (; see Correa et al. 2017) and the disc-to-total ratio (D/T; see e.g. Thob et al. 2019). Both quantities were measured using stellar particles that lie within a spherical 30 kpc aperture.
The top panels of Fig. 5 plot the 2D histogram of versus (left) and D/T (right) for disc galaxies. The lines show the median relations separately for three bins of . The Spearman correlation coefficient for the full sample of discs (labelled in the upper panels) is displayed in the bottom right corner of each panel.
Regardless of halo mass, there is a strong correlation between and ( for all galaxies, and for the individual mass bins) that closely follows the one-to-one line. Close inspection, however, reveals that the relation has a slope that is slightly steeper than 1: for there is a tendency for to exceed . This is because our GMMs can in principle yield , whereas the minimum value of for isotropic, dispersion supported systems with no rotation is . This naturally biases the relation between and , particularly for galaxies with small disc fractions.
The top right panel of Fig. 5 shows that and D/T are also strongly correlated (), but that D/T is slightly higher than for the majority of galaxies. This is true for all mass bins, but a larger offset is seen for higher . This offset occurs because the D/T statistic implicitly assumes that all spheroidal components of galaxies do not rotate and are completely dispersion supported, attributing all net rotation in the galaxy to the disc. A similar offset between D/T and disc mass fractions obtained from GMMs was reported by Obreja et al. (2016). The mass dependence of the offset hints at an increasing prevalence of rotational support in the spheroidal component for galaxies in higher mass haloes.
The bottom panels of Fig. 5 show the distributions of and D/T for our sample of spheroids. The vertical pink, yellow, and blue lines show the median values for each mass bin and the green line shows the values obtained for the spheroidal galaxy used for Figs. 1 and 2 (i.e. SG). The median value for all spheroids is 0.19, only slightly larger than the value expected for isotropic, dispersion supported systems with no net rotation. There are a handful of spheroids with relatively high values of and D/T (for example, 6.6 per cent of spheroids have , whose mean D/T ratio is 0.6). A visual inspection of these galaxies reveal they typically have lenticular morphologies, consistent with fast rotators (e.g. Cappellari, 2016), or have experienced recent mergers, which complicates the disc-bulge decomposition.
The strong correlations between and these alternative morphology metrics are perhaps unsurprising given that both and D/T are calculated directly from the -component of the angular momentum. Although they are not completely independent measures of galactic morphology, the close correspondence between them indicates that our galaxy decomposition technique yields sensible results and that the kinematic morphologies we recover are in agreement with previous work.
3.3.2 Comparison to alternative definitions of the IHL
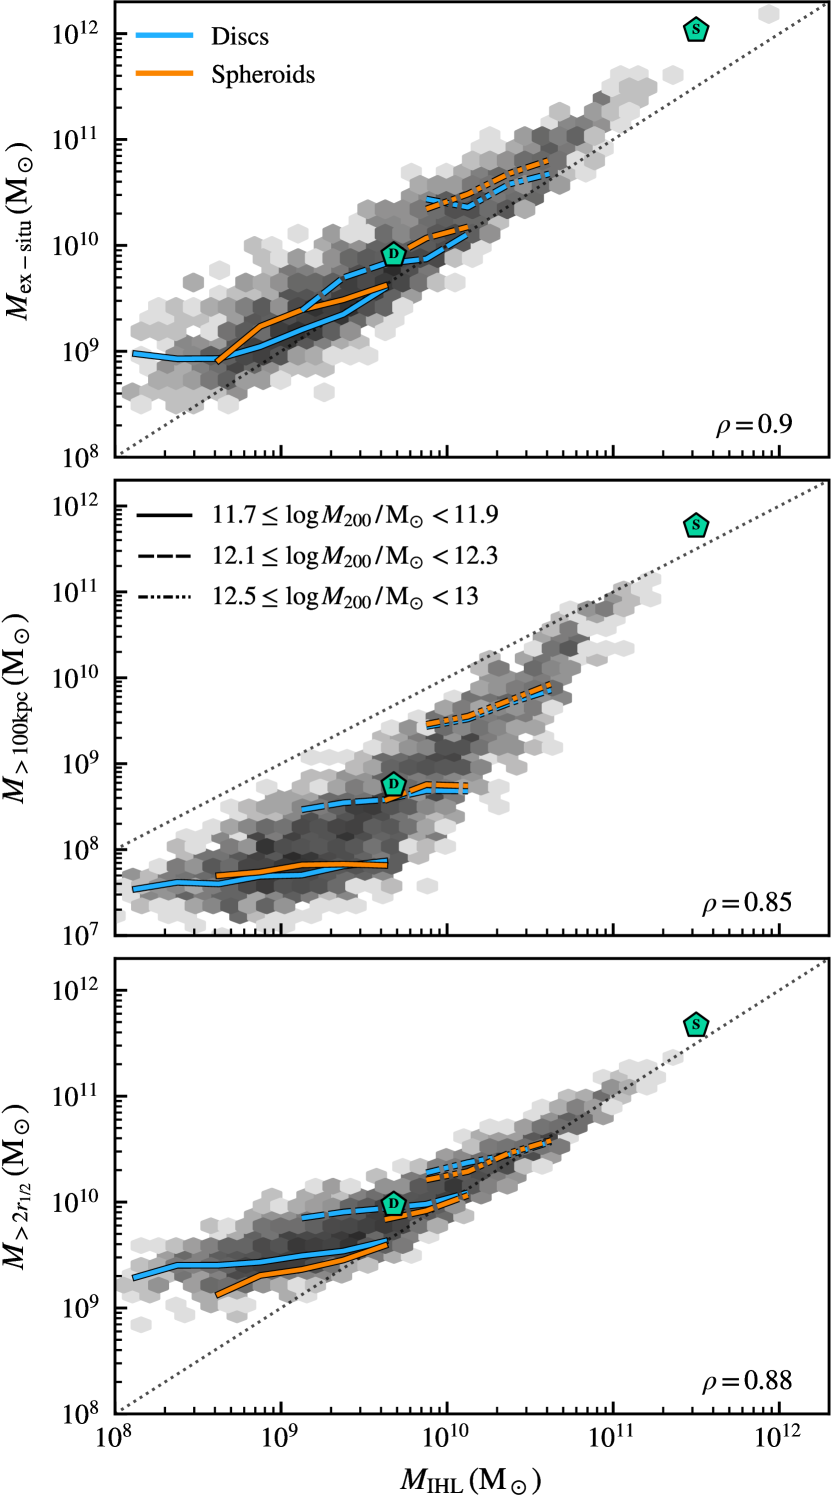
We next compare the estimates of obtained from our GMMs to those obtained using three alternative IHL definitions: 1) the total stellar mass that formed ex-situ (; e.g. Cooper et al. 2010); 2) the total stellar mass at (; e.g. Pillepich et al. 2014); and 3) the total stellar mass beyond 2 times the stellar half-mass radius of a galaxy (; e.g. Elias et al. 2018).
The top panel of Fig. 6 shows the relationship between and . Median relations are shown separately for discs and spheroids (blue and orange lines, respectively) in four bins of (see the legend in the middle panel). Both and increase with increasing , as seen by the separation of lines of different type (they move up and to the right as mass increases). As a result, the values of and for the whole sample of galaxies are strongly correlated (), although at fixed halo mass the correlations are somewhat weaker (the Spearman rank coefficients for the various mass bins plotted in Fig. 6 range from 0.57 to 0.79).
is typically larger than by about 0.2 dex, although this offset increases with increasing . The offset between and among massive spheroids likely reflects the fact that both the bulge and IHL components of these galaxies are dominated by stars that formed ex-situ. Associating the IHL exclusively with accreted stellar material is therefore inappropriate for these systems, because much of the bulge mass also formed ex-situ (e.g. Pillepich et al., 2014). We will return to these points in the next section.
Given its extended nature, defining the IHL with an aperture-based approach is common; in this case, all mass beyond some radius is assigned to the IHL, whereas the mass within that radius is assumed to belong to the other galaxy components. The middle and bottom panels of Fig. 6 show the relation between and two aperture-based IHL mass measurements: (used in e.g. Pillepich et al., 2018), and (used in e.g. Elias et al., 2018), respectively.
We find that is lower than for 99 per cent of galaxies (not surprisingly, only the most massive galaxies have ). The two IHL mass estimates are correlated for the whole population () but at fixed they are less correlated ( only for the highest halo mass bins plotted). This suggests that the correlation between these IHL mass estimates is primarily driven by the fact that and both increase with increasing . A similar conclusion applies to the relationship between and . Note that is typically larger than , and has a much smaller halo-to-halo scatter (see Cañas et al., 2020, for a similar finding).
Although the IHL masses estimated using these alternative methods correlate with our measurements, it is clear that none of them reproduce our results, and fare even poorer when comparisons are made at fixed halo mass. This is due to the fact that the various components of galaxies do not have well-defined edges, nor are they composed purely of in-situ or ex-situ stars.
4 Results
In this section, we supplement the Ref-L0100N1504 sample with 897 additional galaxies from 50-HiResDM,777All galaxies in 50-HiResDM have virial masses , and are expected to be robust to spurious collisional effects at their stellar half mass radii (see Ludlow et al., 2023, for details). as well as the 30 galaxy clusters from the C-Eagle suite. This provides us with a sample of 3342 galaxies spanning the mass range (or in stellar mass). Of the full galaxy sample, per cent were classified as discs based on our morphological classification step (see Section 3.1); the remainder as spheroids. Only 15 galaxies have no discernible IHL component; these are primarily low-mass, disc-dominated systems (with median , which corresponds to the mass of 3000 primordial gas particles). Higher baryon mass resolution is required to meaningfully study the IHL of these systems. All results that follow were obtained from our GMM galaxy decomposition using .
4.1 The stellar-to-halo mass relation and morphology
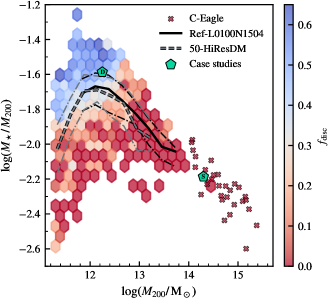
In Fig. 7 we plot the stellar-to-halo mass relation (SHMR) for the full galaxy sample, colour-coded by . The median relations obtained from Ref-L0100N1504 (shown as a solid black line) and 50-HiResDM (thick dashed line) are in good agreement (see also Ludlow et al., 2023). Fig. 7 also shows that, over the mass range , there is a clear relationship between the stellar mass fraction of a galaxy and : at fixed halo mass, disc galaxies have higher stellar masses than spheroids. For example, galaxies with have, on average, ; those with have . These results provide additional dynamical evidence for a morphology-dependent stellar-to-halo mass relation, consistent with the observational results of Posti & Fall (2021), and the theoretical results of Correa & Schaye (2020), who reported a similar trend for Eagle galaxies but using as a proxy for morphology.
Fig. 7 also demonstrates that disc-dominated galaxies tend to occupy haloes with masses (including 95 per cent of galaxies with ), but above this mass spheroids dominate (e.g. at , more than half of the galaxies in our sample have ), a trend that is also well-established observationally (e.g. Posti & Fall, 2021).
4.2 The SFRs, ex-situ fractions, and ages of discs, bulges and the IHL
Fig. 8 plots the median star formation rates (SFRs), ex-situ fractions (), and stellar half-mass formation times (), versus . Results are shown separately for each galaxy component and for all simulations (Ref-L0100N1504 results are shown using solid lines; 50-HiResDM results using dashed lines; and C-Eagle results using crosses). The SFRs were averaged over a lookback time of 500, but we have verified that our results are qualitatively insensitive to reasonable variations in that timescale. Note that merger trees are not available for our 50-HiResDM run, nor for C-Eagle, so we only present ex-situ fractions for Ref-L0100N1504. Also note that the limited baryonic mass resolution of our simulations, compounded with low component mass fractions, can result in galaxy components being resolved by very few stellar particles, particularly for galaxies occupying low-mass haloes. For that reason, in Figs. 8 and 9 we highlight the halo mass above which the various components are resolved by at least (arrows with black boundaries) or (coloured arrows) stellar particles and for 90 per cent of galaxies. Note that the bulge components of galaxies are always resolved by at least 1000 stellar particles, and the discs by at least 100. We have also verified that the qualitative differences between the disc, bulge, and IHL populations discussed in this section are unchanged if we restrict our sample to components with at least 1000 particles.
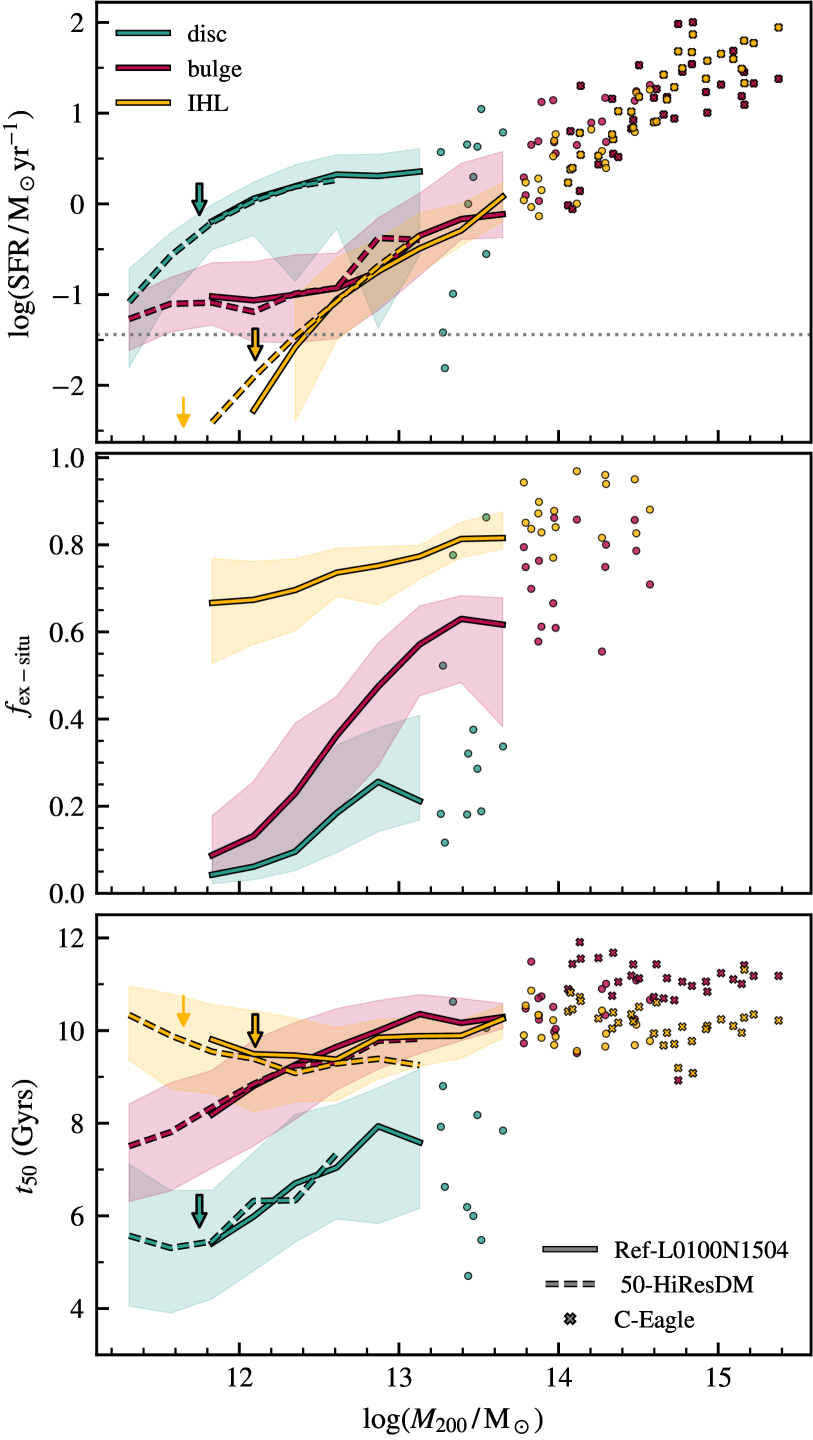
Overall, the results plotted in Fig. 8 are in qualitative agreement with observational expectations and theoretical results: compared to bulges and the IHL, discs have the highest SFRs, the lowest fractions of ex-situ stars, and are typically the youngest component of a galaxy (see, e.g., Robotham et al., 2022, for observational evidence of the latter). Note that discs have small but non-zero ex-situ fractions, possibly due to the presence of stellar particles tidally stripped from satellites co-planar with the disc (e.g. Abadi et al., 2003).
Results from our GMMs suggest that bulges host the oldest stellar populations and exhibit the lowest SFRs. They have higher ex-situ fractions than discs, but lower ex-situ fractions than the IHL at fixed mass. The ex-situ fraction of bulges correlates strongly with halo mass, increasing from about 10 per cent at to about per cent at ; for galaxies hosted by haloes of mass , roughly half of all their bulge stars were formed ex-situ.
Although the IHL is dominated by ex-situ stars at most masses, our analysis suggests that it also contains a non-negligible fraction of stars that were born in-situ (roughly 30 per cent at the galactic scale, and per cent at the cluster scale). This goes against a common assumption that the IHL is comprised entirely of accreted stellar material (e.g. Cooper et al., 2010). At , the IHL is systematically older, less star-forming, and comprised of more ex-situ stars than bulges. Above this mass scale, the median SFRs and ages of bulges and the IHL are practically indistinguishable. This is in qualitative agreement with observational results indicating that the stellar populations of the ICL and BCGs overlap significantly (Jiménez-Teja et al., 2018).
The median age of discs and bulges increases with increasing , consistent with the concept of galaxy “downsizing” (e.g. Neistein et al., 2006). The half-mass ages of the IHL component do not vary significantly with halo mass, and have a median age of Gyr. There are hints of an upturn in the IHL ages for galaxies with , though this is roughly the mass scale below which the IHL of most galaxies are resolved by fewer than 1000 particles. We explore the relationship between the age of the IHL component, the IHL mass fraction, and galaxy morphology further in Section 4.4.
Finally, note that the median SFRs and half-mass ages of the various galactic components are in good agreement between Ref-L0100N1504 and 50-HiResDM. These results corroborate and extend the findings of Ludlow et al. (2023), and suggest that spurious heating does not affect the SFRs of simulated galaxies, or even the SFRs of their dynamically-distinct components. This is because, at the mass resolution of our simulations, gaseous baryons are largely unaffected by spurious heating because their radiative cooling timescale is shorter than their collisional heating timescale (Steinmetz & White, 1997).
4.3 The structure of discs, bulges and the IHL
4.3.1 The size-mass relation for discs, bulges, and the IHL
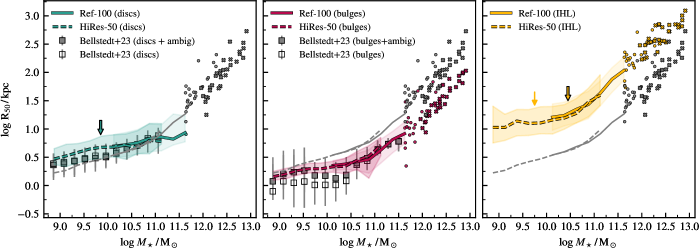
Fig. 9 plots the relations obtained from our simulations. Note that is the projected half-stellar mass radius of the galaxy, which we obtain by multiplying its 3-dimensional half-mass radius by 0.75. For comparison, we also include the half-mass radii of discs and bulges obtained for GAMA galaxies as described in Robotham et al. (2022) (including additional galaxies from Bellstedt et al. 2023). Recall that our structural decomposition method makes use of the energies and angular momenta of stellar particles, quantities that are observationally inaccessible for stars in galaxies outside of the MW. Robotham et al. (2022) and Bellstedt et al. (2023) estimate component sizes based on a simultaneous spectral and photometric decomposition of the observed systems. Despite these differences, the comparison serves as a useful test of our method.
As above, results from Ref-L0100N1504 are shown using solid lines, results from 50-HiResDM using dashed lines, and C-Eagle galaxies using crosses. Different panels show results separately for discs (left), bulges (middle), and the IHL (right). For comparison, the grey lines in each panel show the size-mass relations for the total stellar component of each galaxy, regardless of morphological type. Open squares plot the median half mass radii for the decomposition presented in Bellstedt et al. (2023) for discs (left panel) and bulges (middle panel). Filled squares plot the same, but include ambiguous sources, where the component classification is uncertain (see appendix D of Lagos et al., 2023, for details).
The median disc sizes depend weakly on across the mass range plotted, and agree well with the disc sizes obtained by Bellstedt et al. (2023). For , our disc components are slightly larger than observed discs, though both exhibit similar scatter For , bulge sizes also depend weakly on , but the relation steepens at higher masses where spheroids begin dominate our sample. The median bulge sizes are in excellent agreement with the observations across the mass range plotted, although the scatter in the simulated bulge sizes is lower. This may be due to the different stellar mass distributions between our sample and Bellstedt et al. (2023): we impose a limit of on our simulated sample, whereas the observed sample is complete down to . Note that discs are larger than bulges by roughly 0.2 dex at a given mass, in agreement with other observational results (e.g. Lange et al., 2016; Robotham et al., 2022). Like bulges, the median size of the IHL component also exhibit an upturn at .
Finally, note the good agreement between the various size-mass relations obtained from Ref-L0100N1504 and 50-HiResDM. Although we employed lower limits on for these runs such that the effects of spurious heating are negligible at (and above) the half-mass radii of all stellar particles, it is encouraging that good convergence is also obtained for the sizes of dynamically distinct discs, bulges, and the IHL.
4.3.2 The IHL transition radius
At what radius does the IHL begin to dominate the stellar mass of a galaxy? We denote this radius and explore below how it depends on halo mass and galaxy morphology.
To compute , we first construct spherically-averaged density profiles for the different structural components of each galaxy, using 36 equally-spaced bins in that span the range . We then interpolate the profiles to determine the radius at which the density of the IHL exceeds the density of the remaining stellar material. This procedure yields values for per cent of our galaxy sample. Galaxies for which could not be determined are usually low-mass, disc galaxies with low IHL fractions. For such systems, sampling noise in the stellar halo makes it difficult to determine an accurate value of . For that reason, in the remainder of this section, we only consider galaxies with , for which was reliably determined.
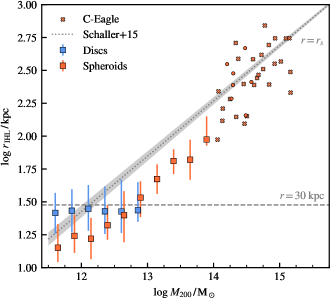
In Fig. 10, we plot versus for galaxies identified in Ref-L0100N1504. Blue points show results for our sample of disc galaxies, and orange points show spheroids. The shape of the relation differs from the size-mass relations of the individual structural components of galaxies plotted in Fig. 9. Specifically, below , is largely independent of for discs, for which the IHL begins to dominate the stellar mass distribution at (shown as a horizontal dashed line in Fig. 10). At these masses, the values of discs are larger than for spheroids, and for the latter increases proportional to .
Although marks the radius where the IHL begins to dominate the stellar mass of a galaxy, the typical fraction of the IHL within that radius can be quite large. For example, roughly 63 (56) per cent of the IHL mass of discs (spheroids) hosted by haloes with lies within . And beyond , only about 77 percent of the stellar mass is associated with the IHL (for discs; for spheroids it is 98 per cent). Although the exact values differ as a function of halo mass, our results suggest that there is significant overlap in the spatial distribution of the different galaxy components, and that (or any other characteristic radius, or fixed spherical aperture) is unlikely to accurately distinguish the IHL from the other components of a galaxy. Defining the IHL as such likely excludes a significant fraction of the total IHL mass (and includes non-negligible contributions to the IHL from bulge or disc stars) and potentially biases estimates of IHL properties.
The strong mass dependence of at differs from the findings of Contini et al. (2022), who found that at the group and cluster scale. This discrepancy is perhaps due to the different theoretical approach to the problem (they used a semi-analytic model that implicitly assumes that the IHL follows a NFW profile, albeit one that is more concentrated than the surrounding DM halo by a factor of 3), but may also be due to our different definitions of . Specifically, Contini et al. (2022) identify with the radius at which the IHL contributes 90 per cent of the total stellar mass, whereas in our definition it contributes 50 per cent. Regardless of these differences, the different mass dependence of for disc galaxies above and below seen in Fig. 10 indicates that the IHL in groups and clusters likely differs from the IHL of discs at the galaxy scale. A comprehensive analysis of the structure of the IHL, how it varies with mass, and its relationship to galaxy assembly histories warrants further investigation, which we defer to future work.
Chen et al. (2022) showed that the IHL transition radii inferred from photometric decomposition of stacked images of galaxy clusters in the Sloan Digital Sky Survey (Rykoff et al., 2014) are comparable to the characteristic scale radii (inferred from weak lensing) of their surrounding DM haloes. The grey line plotted in Fig. 10 shows the best-fitting relation proposed by Schaller et al. (2015), which was obtained by fitting NFW profiles to the average density profiles of relaxed haloes in Eagle. At the group and cluster scale, exhibits a similar dependence on to that of . Furthermore, above , we find , although with considerable scatter. We did not, however, find a correlation between and among individual systems, i.e. the scatter in at fixed cannot be attributed to differences in halo concentrations. The apparent similarity between and may be coincidental.
Finally, note that the values we obtain at cluster mass scales are consistent with observational results suggesting that the sphere of influence of BCGs can extend to (Chen et al., 2022), which is significantly larger than the fixed spherical apertures often used in theoretical work (e.g. 30 kpc; Montenegro-Taborda et al., 2023).
4.4 Variation of the IHL fraction with host galaxy properties
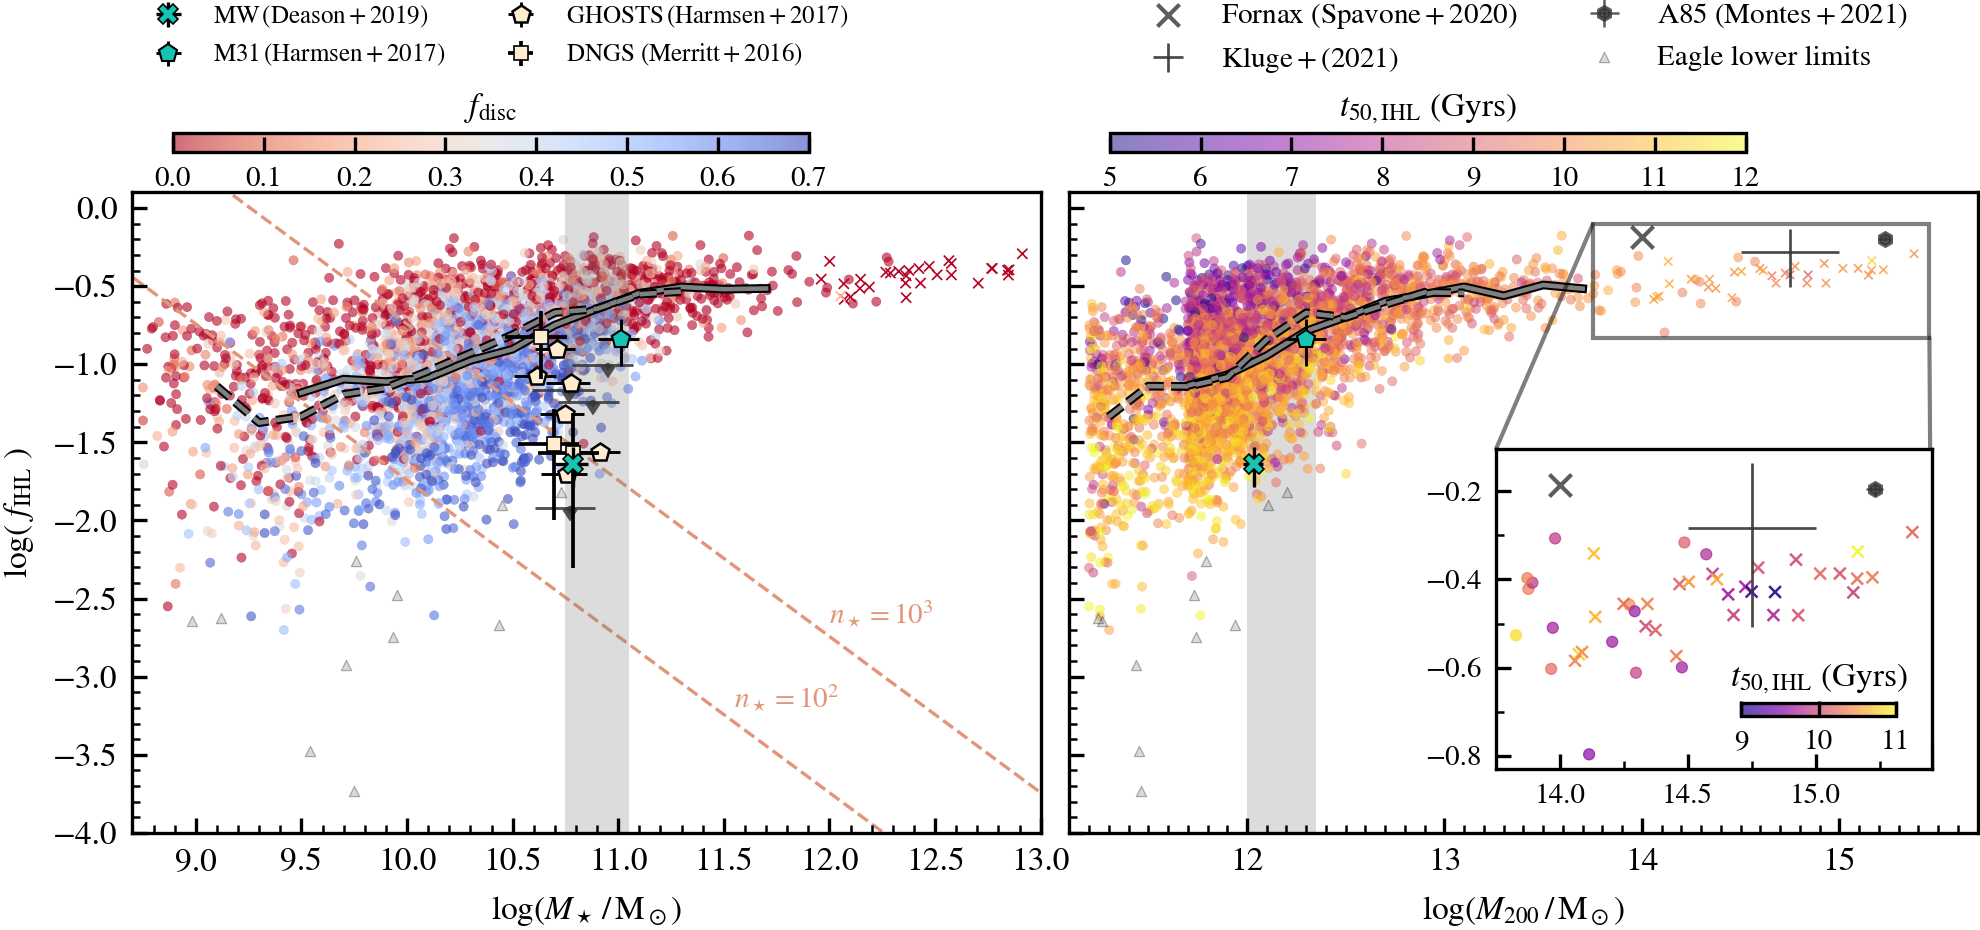
In the left panel of Fig. 11, we plot versus and compare our simulation results to values obtained from observations of nearby disc galaxies (observational data were taken from Table 4 of Harmsen et al. 2017; our simulated galaxies are colour-coded by their disc mass fractions). The MW and M31 are shown using green symbols, and the rest are plotted in beige (with black edges). For the observed discs, we have included the contribution of the IHL to the total stellar mass.
In the right panel of Fig. 11, we plot versus and compare with observed IHL fractions for a few galaxy clusters,888Observed IHL fractions at the group and cluster scale are typically expressed as light fractions. Here, we assume a constant mass-to-light ratio when comparing to our simulation results. as well as for the MW and M31 (the virial masses for the MW and M31 were taken from Shen et al. 2022 and Fardal et al. 2013, respectively; in this case, our simulated galaxies have been coloured according to the half mass ages of their stellar IHL particles). Note that at the galaxy cluster scale, it is common for IHL fractions to be expressed relative to the total stellar mass bound to the halo, inclusive of satellite galaxies. For our analysis, we only include observational data for which the contribution from satellite galaxies was excluded from the reported IHL fractions.
In both panels, solid and dashed grey lines show the running medians obtained from Ref-L0100N1504 and 50-HiResDM, respectively. The median values are in good agreement between the two simulations at all mass scales plotted, suggesting that our IHL mass estimates are robust to the spurious heating of stellar particles by DM particles. For simulated galaxies with no discernible IHL, we instead plot (grey triangles in both panels of Fig. 11), which can be interpreted as a lower limit on their IHL fractions (see Fig. 6).
The left panel of Fig. 11 shows that there is some overlap in the values obtained for our simulated galaxies and from observations (although the simulated galaxies are biased toward slightly higher , on average). The IHL fractions of simulated galaxies measured using aperture-based methods (e.g. Pillepich et al., 2018; Elias et al., 2018) or 6D phase-space information (e.g. Cañas et al., 2020) are also typically higher than observed IHL fractions. This suggests that the IHL of simulated galaxies may genuinely outweigh that of observed ones, although it has been noted that values derived from single-band photometric data (such as those in Merritt et al. 2016) are likely lower limits on the true IHL fractions (Sanderson et al., 2018). We also stress that the observed IHL fractions plotted in the left panel of Fig. 11 correspond to disc-dominated galaxies, and more closely coincide with the IHL fractions of disc-dominated galaxies in our simulations (i.e. those corresponding to the blue coloured points).
The left panel of Fig. 11 also shows that there is a large diversity in the IHL fractions of simulated galaxies at fixed stellar mass. For those that span the stellar mass range of the MW and M31 (i.e. the vertical shaded region in the left-hand panel of Fig. 11), the rms scatter (in ) about the median IHL fraction is about dex, corresponding to a factor of in IHL mass. The scatter, however, clearly correlates with galaxy morphology: at fixed , galaxies with higher IHL fractions tend to have lower disc fractions, and vice versa.
The colour coding of points in the right-hand panel of Fig. 11 shows that there is also a correlation between the IHL mass fraction and its half mass age, , at least among low-mass galaxies (i.e. ). Note, however, that the correlation between and disappears at high masses (see inset in the right-hand panel Fig. 11). At the scale of galaxy clusters, the IHL fractions obtained from our simulations approach a constant value of , systematically lower than the values reported by Kluge et al. (2021), who found using a double Sersic decomposition.
The fact that the IHL of disc dominated galaxies tends to be older and less massive than that of spheroids of similar stellar mass can be interpreted as follows. Galaxies with high disc mass fractions are unlikely to have experienced recent disruptive mergers that could potentially contribute to the growth of their IHL. As a result, what IHL they do possess tends to be older than that of spheroidal galaxies, which are more likely to have experienced recent mergers. This interpretation is supported by the conclusions of Deason et al. (2019), who showed that the low IHL mass of the MW can be largely explained by an ancient () merger event with a massive progenitor whose stellar mass now dominates its IHL.
The diagonal dashed lines in the left-hand panel of Fig. 11 highlights IHL fractions corresponding to roughly 100 and 1000 stellar particles. Clearly, the stellar haloes of many of the low-mass galaxies in our simulations (i.e. those with ) are only resolved by a few 10s to a few 100s of stellar particles. Assessing the properties of their IHL components, such as their shape or spatial and kinematic structure, will likely require simulations that reach higher baryonic mass resolution than our runs.
5 Conclusions and outlook
We used Gaussian Mixture Models (GMMs) to decompose the structural components of central galaxies identified in the output of the Eagle simulation. Most of our analysis was based on galaxies identified in Ref-L0100N1504, i.e. the 100 cubic Mpc flagship simulation of the Eagle Project (Schaye et al., 2015), which we supplemented with 30 galaxy clusters from the C-Eagle Project (Bahé et al., 2017; Barnes et al., 2017), and several hundred from 50-HiResDM (Ludlow et al., 2023). The latter run used the same numerical and subgrid model parameters as Ref-L0100N1504, but was was carried out in a smaller volume (50 cubic Mpc) and with seven times higher mass resolution in the DM component. Combined, these simulations allowed us to study the discs, bulges, and intra-halo light (IHL) of galaxies across a range of environments and over four orders of magnitude in halo mass (). Our main results are summarised below.
-
•
Our galaxy decomposition technique is robust to small variations in , i.e. the number of Gaussian distributions used by the GMM to isolate kinematically distinct galaxy components (see Section 3). The stellar mass fractions assigned to the disc, bulge, and IHL components of galaxies are, on average, independent of provided (although there is some variation on the level of individual galaxies). For most of our analysis we used , which resulted in disc fractions that correlate strongly with alternative kinematic morphology estimators, such as (Correa et al. 2017; see Fig. 5). We also reproduce the morphology-dependence of the stellar-to-halo mass relation reported in previous observational and theoretical work (Fig. 7).
-
•
Of the 3342 galaxies in our sample, roughly 71 per cent were classified as discs (i.e. have a non-zero disc mass fraction based on the GMM; see Section 3.1), the remainder were classified as spheroids. We find that 34 per cent of the disc population are disc dominated (i.e. have ). Disc galaxies primarily occupy haloes with virial mass , whereas spheroids dominate in higher-mass haloes. Less than 0.5 per cent of galaxies in our sample possess no IHL component; these are primarily low-mass, disc-dominated systems (i.e. they typically have disc mass fractions ).
-
•
The basic properties of the disc and bulge components of galaxies are consistent with well-established observed trends: discs host younger stellar populations than bulges, have higher star formation rates, and, on comparable mass scales, are systematically larger than bulges (as quantified by their stellar half-mass radii). The half-mass radii of discs and bulges are in good agreement with observational results presented in Robotham et al. (2022) and Bellstedt et al. (2023) (see Fig. 9). Discs also contain a smaller contribution from ex-situ stars than bulges, by roughly a factor of 2 (see Fig. 8).
The primary aim of our work, however, was to study the properties of the IHL components of galaxies using a consistent methodology for IHL identification, and across a broad range of galaxy and halo masses. The results listed above give us confidence that our galaxy decomposition technique is sensible and robust, and that our IHL definition is on firm footing. The main insights into the IHL components of galaxies that our work provides are summarised as follows:
-
•
Compared to discs and bulges, the IHL component of galaxies contains the highest fraction of ex-situ stars, which contribute roughly 70 per cent of the IHL mass at and about 90 per cent at . The average SFR of the IHL (averaged over a lookback time of 500 Myr) is lower than that of bulges and discs. The IHL is, on average, composed of older stellar populations than discs and bulges at ; above this mass scale the ages of bulges and the IHL overlap (Fig. 8). At all mass scales, the IHL component is more extended than the disc or bulge component (as quantified by the half stellar mass radius of each component; Fig. 9). The SFRs, ages, and sizes of the disc, bulge, and IHL components studied in this work are converged between the Ref-L0100N1504 and 50-HiResDM simulations, indicating that our results are robust to the effects of spurious collisional heating (see Ludlow et al., 2023, for details).
-
•
The fraction of mass assigned to the IHL, , increases with increasing stellar and halo mass (although slightly), but at fixed mass exhibits large scatter. For MW mass galaxies (i.e. or ) we find , which increases to at the group and cluster scale (i.e. ). The IHL fractions we obtain from our GMMs are in broad agreement with observed values obtained for disc and BCGs (Fig. 11; although several nearby disc galaxies have systematically lower IHL fractions than discs in our simulations).
-
•
At halo masses , the scatter in is closely connected to the kinematic morphology of a galaxy: at a fixed halo mass, disc dominated galaxies have lower IHL fractions than spheroidal galaxies. The IHL fraction also correlates (albeit weakly) with the median age of the IHL (Fig. 11) in such a way that the IHL of disc-dominated galaxies is systematically older than the IHL of spheroids of the same mass. This supports the idea that most disc-dominated galaxies have not undergone any recent mergers that could have increased their IHL fractions, and that, more broadly, the IHL fraction of a galaxy holds valuable information about its assembly history.
-
•
For halo masses , the various correlations between the IHL mass fraction, its age, and galaxy morphology no longer hold. This may be due to the lack of diversity in galaxy morphologies at these mass scales (Fig. 7) or due to similarities in the merger histories of massive haloes. At these mass scales, galaxies are typically spheroidal and both the bulge and IHL components are dominated by ex-situ stars. It is not clear whether a meaningful distinction exists between the bulge and IHL components of galaxies in massive haloes, since both components exhibit similar stellar populations (Fig. 8).
-
•
Finally, we explored how the IHL transition radius, (defined as the radius beyond which the stellar density profile of the IHL dominates over that of the inner galaxy), depends on halo mass and galaxy morphology. For disc galaxies, we found that . For spheroids, depends strongly on , increasing from at to at (Fig. 10). Our methodology also predicts significant spatial overlap between galaxy components, implying that (or any other spherical aperture) cannot be used to distinguish the IHL from the other structural components of a galaxy.
We believe our results provide a sensible assessment of some of the basic properties of the disc, bulge, and IHL components of simulated galaxies. We plan to leverage the galaxy decomposition technique introduced in this work to explore properties of the progenitors of the IHL (as well as the progenitors of the ex-situ components of discs and bulges) and how they depend on halo mass.
Although our simulated galaxy sample spans a large range of halo masses (), massive galaxy clusters are sparsely sampled, and the IHL of low-mass galaxies () is poorly resolved (typically containing only a few hundred to a few thousand stellar particles). Future work on the subject may benefit from recent large volume cosmological simulations that provide much larger samples of massive clusters (e.g. Pakmor et al., 2023; Kugel et al., 2023; Schaye et al., 2023). Likewise, cosmological simulations with higher baryonic resolution than Eagle will be useful for exploring the structure of the IHL of low-mass galaxies, which is crucial if we wish to properly interpret the low IHL fraction of the MW and other nearby galaxies, and to properly place their formation histories in a wider cosmological context (e.g. Evans et al., 2020). Such simulations will also enable investigations into the IHL of dwarf galaxies, which, due to their low surface brightness, are difficult to study observationally but are potentially powerful probes of dark matter models (Deason et al., 2022).
Data Availability
The EAGLE simulations are publicly available; see McAlpine et al. (2016); The EAGLE team (2017) for how to access EAGLE data. Any additional data used in this work can be made available upon reasonable request. The decomposition code is publicly available.999https://github.com/katyproctor/decomp
Acknowledgements
We thank the anonymous referee for a thoughtful report that improved the quality of the paper. We also wish to thank Joel Pfeffer for providing ex-situ particle classifications, and Matthieu Schaller for providing best-fitting NFW concentrations for the Ref-L0100N1504 simulations. KLP thanks Annette Ferguson, Azi Fattahi, and Alexander Knebe for useful discussions and thanks the University of Edinburgh for supporting a productive research visit. KLP acknowledges support from the Australian Government Research Training Program Scholarship. CL has received funding from the Australian Research Council Centre of Excellence for All Sky Astrophysics in 3 Dimensions (ASTRO 3D), through project number CE170100013, and the Australian Research Council Discovery Project (DP210101945). ADL acknowledges financial support from the Australian Research Council through their Future Fellowship scheme (project number FT160100250). ASGR acknowledges funding by the Australian Research Council (ARC) Future Fellowship scheme (FT200100374, ‘Hot Fuzz’). This work made use of the supercomputer OzSTAR which is managed through the Centre for Astrophysics and Supercomputing at Swinburne University of Technology. This supercomputing facility is supported by Astronomy Australia Limited and the Australian Commonwealth Government through the national Collaborative Research Infrastructure Strategy (NCRIS). We acknowledge the Virgo Consortium for making their simulation data available. The Eagle simulations were performed using the DiRAC-2 facility at Durham, managed by the ICC, and the PRACE facility Curie based in France at TGCC, CEA, Bruyeres-le-Chatel. The C-Eagle simulations were in part performed on the German federal maximum performance computer “HazelHen” at the maximum performance computing centre Stuttgart (HLRS), under project GCS-HYDA / ID 44067 financed through the large-scale project “Hydrangea” of the Gauss Center for Supercomputing. This work has benefitted from the following public python packages: pandas (McKinney, 2010), scipy (Virtanen et al., 2020), numpy (Harris et al., 2020), and matplotlib (Hunter, 2007).
References
- Abadi et al. (2003) Abadi M. G., Navarro J. F., Steinmetz M., Eke V. R., 2003, ApJ, 597, 21
- Adhikari et al. (2014) Adhikari S., Dalal N., Chamberlain R. T., 2014, J. Cosmol. Astropart. Phys., 2014, 019
- Bahé et al. (2017) Bahé Y. M., et al., 2017, Monthly Notices of the Royal Astronomical Society, 470, 4186
- Barker et al. (2009) Barker M. K., Ferguson A. M. N., Irwin M., Arimoto N., Jablonka P., 2009, The Astronomical Journal, 138, 1469
- Barnes et al. (2017) Barnes D. J., et al., 2017, Monthly Notices of the Royal Astronomical Society, 471, 1088
- Bellstedt et al. (2023) Bellstedt S., Robotham A. S. G., Driver S. P., Lagos C. d. P., Davies L. J. M., Cook R. H. W., 2023, Resolving cosmic star formation histories of present-day bulges, disks, and spheroids with ProFuse, %****␣main.bbl␣Line␣50␣****http://arxiv.org/abs/2307.02788
- Belokurov et al. (2018) Belokurov V., Erkal D., Evans N. W., Koposov S. E., Deason A. J., 2018, Monthly Notices of the Royal Astronomical Society, 478, 611
- Buder et al. (2022) Buder S., et al., 2022, Monthly Notices of the Royal Astronomical Society, 510, 2407
- Bullock & Johnston (2005) Bullock J. S., Johnston K. V., 2005, ApJ, 635, 931
- Cappellari (2016) Cappellari M., 2016, Annu. Rev. Astron. Astrophys., 54, 597
- Cañas et al. (2020) Cañas R., Lagos C. d. P., Elahi P. J., Power C., Welker C., Dubois Y., Pichon C., 2020, Monthly Notices of the Royal Astronomical Society, 494, 4314
- Chen et al. (2022) Chen X., Zu Y., Shao Z., Shan H., 2022, Monthly Notices of the Royal Astronomical Society, 514, 2692
- Contini (2021) Contini E., 2021, Galaxies, 9, 60
- Contini et al. (2022) Contini E., Chen H. Z., Gu Q., 2022, The Astrophysical Journal, 928, 99
- Cooper et al. (2010) Cooper A. P., et al., 2010, Monthly Notices of the Royal Astronomical Society, 406, 744
- Correa & Schaye (2020) Correa C. A., Schaye J., 2020, Monthly Notices of the Royal Astronomical Society, 499, 3578
- Correa et al. (2017) Correa C. A., Schaye J., Clauwens B., Bower R. G., Crain R. A., Schaller M., Theuns T., Thob A. C. R., 2017, Monthly Notices of the Royal Astronomical Society: Letters, 472, L45
- Crain et al. (2015) Crain R. A., et al., 2015, Mon Not R Astron Soc, 450, 1937
- Dalla Vecchia & Schaye (2012) Dalla Vecchia C., Schaye J., 2012, Monthly Notices of the Royal Astronomical Society, 426, 140
- Davis et al. (1985) Davis M., Efstathiou G., Frenk C. S., White S. D. M., 1985, The Astrophysical Journal, 292, 371
- Davison et al. (2020) Davison T. A., Norris M. A., Pfeffer J. L., Davies J. J., Crain R. A., 2020, Monthly Notices of the Royal Astronomical Society, 497, 81
- Davé et al. (2019) Davé R., Anglés-Alcázar D., Narayanan D., Li Q., Rafieferantsoa M. H., Appleby S., 2019, Monthly Notices of the Royal Astronomical Society, 486, 2827
- De Lucia & Blaizot (2007) De Lucia G., Blaizot J., 2007, Monthly Notices of the Royal Astronomical Society, 375, 2
- Deason et al. (2019) Deason A. J., Belokurov V., Sanders J. L., 2019, Monthly Notices of the Royal Astronomical Society, 490, 3426
- Deason et al. (2021) Deason A. J., et al., 2021, Monthly Notices of the Royal Astronomical Society, 500, 4181
- Deason et al. (2022) Deason A. J., Bose S., Fattahi A., Amorisco N. C., Hellwing W., Frenk C. S., 2022, Monthly Notices of the Royal Astronomical Society, 511, 4044
- Diemer (2017) Diemer B., 2017, ApJS, 231, 5
- Dolag et al. (2009) Dolag K., Borgani S., Murante G., Springel V., 2009, Monthly Notices of the Royal Astronomical Society, 399, 497
- Doménech-Moral et al. (2012) Doménech-Moral M., Martínez-Serrano F. J., Domínguez-Tenreiro R., Serna A., 2012, Monthly Notices of the Royal Astronomical Society, 421, 2510
- Du et al. (2019) Du M., Ho L. C., Zhao D., Shi J., Debattista V. P., Hernquist L., Nelson D., 2019, ApJ, 884, 129
- Du et al. (2020) Du M., Ho L. C., Debattista V. P., Pillepich A., Nelson D., Zhao D., Hernquist L., 2020, ApJ, 895, 139
- Du et al. (2021) Du M., Ho L. C., Debattista V. P., Pillepich A., Nelson D., Hernquist L., Weinberger R., 2021, The Astrophysical Journal, 919, 135
- Dubois et al. (2016) Dubois Y., Peirani S., Pichon C., Devriendt J., Gavazzi R., Welker C., Volonteri M., 2016, Mon. Not. R. Astron. Soc., 463, 3948
- Elias et al. (2018) Elias L. M., Sales L. V., Creasey P., Cooper M. C., Bullock J. S., Rich M. R., Hernquist L., 2018, Monthly Notices of the Royal Astronomical Society, 479, 4004
- Evans et al. (2020) Evans T. A., Fattahi A., Deason A. J., Frenk C. S., 2020, Monthly Notices of the Royal Astronomical Society, 497, 4311
- Fardal et al. (2013) Fardal M. A., et al., 2013, Monthly Notices of the Royal Astronomical Society, 434, 2779
- Fattahi et al. (2020) Fattahi A., et al., 2020, Monthly Notices of the Royal Astronomical Society, 497, 4459
- Furlong et al. (2017) Furlong M., et al., 2017, Mon. Not. R. Astron. Soc., 465, 722
- Gaia Collaboration et al. (2021) Gaia Collaboration et al., 2021, A&A, 650, C3
- Gonzalez et al. (2021) Gonzalez A. H., George T., Connor T., Deason A., Donahue M., Montes M., Zabludoff A. I., Zaritsky D., 2021, Monthly Notices of the Royal Astronomical Society, 507, 963
- Harmsen et al. (2017) Harmsen B., Monachesi A., Bell E. F., de Jong R. S., Bailin J., Radburn-Smith D. J., Holwerda B. W., 2017, Mon. Not. R. Astron. Soc., 466, 1491
- Harris et al. (2020) Harris C. R., et al., 2020, Nature, 585, 357
- Helmi (2008) Helmi A., 2008, Astron Astrophys Rev, 15, 145
- Helmi et al. (2018) Helmi A., Babusiaux C., Koppelman H. H., Massari D., Veljanoski J., Brown A. G. A., 2018, Nature, 563, 85
- Horta et al. (2020) Horta D., et al., 2020, Monthly Notices of the Royal Astronomical Society, 500, 1385
- Hunter (2007) Hunter J. D., 2007, Computing in Science and Engineering, 9, 90
- Ibata et al. (2013) Ibata R. A., et al., 2013, ApJ, 780, 128
- Jiménez-Teja et al. (2018) Jiménez-Teja Y., et al., 2018, ApJ, 857, 79
- Kluge et al. (2021) Kluge M., Bender R., Riffeser A., Goessl C., Hopp U., Schmidt M., Ries C., 2021, ApJS, 252, 27
- Kruijssen et al. (2019) Kruijssen J. M. D., Pfeffer J. L., Reina-Campos M., Crain R. A., Bastian N., 2019, Monthly Notices of the Royal Astronomical Society, 486, 3180
- Kugel et al. (2023) Kugel R., et al., 2023, FLAMINGO: Calibrating large cosmological hydrodynamical simulations with machine learning, doi:10.48550/arXiv.2306.05492, http://arxiv.org/abs/2306.05492
- Kumar et al. (2021) Kumar A., Das M., Kataria S. K., 2021, Monthly Notices of the Royal Astronomical Society, 506, 98
- Lagos et al. (2017) Lagos C. d. P., Theuns T., Stevens A. R. H., Cortese L., Padilla N. D., Davis T. A., Contreras S., Croton D., 2017, Monthly Notices of the Royal Astronomical Society, 464, 3850
- Lagos et al. (2022) Lagos C. d. P., Emsellem E., van de Sande J., Harborne K. E., Cortese L., Davison T., Foster C., Wright R. J., 2022, Monthly Notices of the Royal Astronomical Society, 509, 4372
- Lagos et al. (2023) Lagos C. D. P., et al., 2023, Quenching massive galaxies across cosmic time with the semi-analytic model SHARK v2.0, http://arxiv.org/abs/2309.02310
- Lange et al. (2016) Lange R., et al., 2016, Mon. Not. R. Astron. Soc., 462, 1470
- Ludlow et al. (2019) Ludlow A. D., Schaye J., Schaller M., Richings J., 2019, Monthly Notices of the Royal Astronomical Society: Letters, 488, L123
- Ludlow et al. (2021) Ludlow A. D., Fall S. M., Schaye J., Obreschkow D., 2021, Monthly Notices of the Royal Astronomical Society, 508, 5114
- Ludlow et al. (2023) Ludlow A. D., Fall S. M., Wilkinson M. J., Schaye J., Obreschkow D., 2023, Monthly Notices of the Royal Astronomical Society, 525, 5614
- McAlpine et al. (2016) McAlpine S., et al., 2016, Astronomy and Computing, 15, 72
- McKinney (2010) McKinney W., 2010. Austin, Texas, pp 56–61, doi:10.25080/Majora-92bf1922-00a, https://conference.scipy.org/proceedings/scipy2010/mckinney.html
- Merritt et al. (2016) Merritt A., van Dokkum P., Abraham R., Zhang J., 2016, ApJ, 830, 62
- Montenegro-Taborda et al. (2023) Montenegro-Taborda D., Rodriguez-Gomez V., Pillepich A., Avila-Reese V., Sales L. V., Rodríguez-Puebla A., Hernquist L., 2023, Monthly Notices of the Royal Astronomical Society, 521, 800
- Montes (2022) Montes M., 2022, Nature Astronomy, 6, 308
- Montes & Trujillo (2022) Montes M., Trujillo I., 2022, The Astrophysical Journal, 940, L51
- Montes et al. (2021) Montes M., Brough S., Owers M. S., Santucci G., 2021, ApJ, 910, 45
- Neistein et al. (2006) Neistein E., van den Bosch F. C., Dekel A., 2006, Monthly Notices of the Royal Astronomical Society, 372, 933
- Obreja et al. (2016) Obreja A., Stinson G. S., Dutton A. A., Macciò A. V., Wang L., Kang X., 2016, Mon. Not. R. Astron. Soc., 459, 467
- Obreja et al. (2018) Obreja A., Macciò A. V., Moster B., Dutton A. A., Buck T., Stinson G. S., Wang L., 2018, Monthly Notices of the Royal Astronomical Society, 477, 4915
- Obreja et al. (2019) Obreja A., et al., 2019, Monthly Notices of the Royal Astronomical Society, 487, 4424
- Ortega-Martinez et al. (2022) Ortega-Martinez S., Obreja A., Dominguez-Tenreiro R., Pedrosa S., Rosas-Guevara Y., Tissera P., 2022, Monthly Notices of the Royal Astronomical Society, p. stac2033
- Pakmor et al. (2023) Pakmor R., et al., 2023, Monthly Notices of the Royal Astronomical Society, 524, 2539
- Pillepich et al. (2014) Pillepich A., et al., 2014, Monthly Notices of the Royal Astronomical Society, 444, 237
- Pillepich et al. (2018) Pillepich A., et al., 2018, Monthly Notices of the Royal Astronomical Society, 475, 648
- Planck Collaboration et al. (2014) Planck Collaboration et al., 2014, A&A, 571, A16
- Posti & Fall (2021) Posti L., Fall S. M., 2021, A&A, 649, A119
- Purcell et al. (2007) Purcell C. W., Bullock J. S., Zentner A. R., 2007, ApJ, 666, 20
- Rey & Starkenburg (2022) Rey M. P., Starkenburg T. K., 2022, Monthly Notices of the Royal Astronomical Society, 510, 4208
- Robotham et al. (2014) Robotham A. S. G., et al., 2014, Monthly Notices of the Royal Astronomical Society, 444, 3986
- Robotham et al. (2022) Robotham A. S. G., Bellstedt S., Driver S. P., 2022, Monthly Notices of the Royal Astronomical Society, 513, 2985
- Rosas-Guevara et al. (2015) Rosas-Guevara Y. M., et al., 2015, Monthly Notices of the Royal Astronomical Society, 454, 1038
- Rykoff et al. (2014) Rykoff E. S., et al., 2014, ApJ, 785, 104
- Sanderson et al. (2018) Sanderson R. E., et al., 2018, ApJ, 869, 12
- Schaller et al. (2015) Schaller M., et al., 2015, Monthly Notices of the Royal Astronomical Society, 451, 1247
- Schaye & Dalla Vecchia (2008) Schaye J., Dalla Vecchia C., 2008, Monthly Notices of the Royal Astronomical Society, 383, 1210
- Schaye et al. (2015) Schaye J., et al., 2015, Monthly Notices of the Royal Astronomical Society, 446, 521
- Schaye et al. (2023) Schaye J., et al., 2023, Monthly Notices of the Royal Astronomical Society
- Shen et al. (2022) Shen J., et al., 2022, ApJ, 925, 1
- Spavone et al. (2020) Spavone M., et al., 2020, A&A, 639, A14
- Springel (2005) Springel V., 2005, Monthly Notices of the Royal Astronomical Society, 364, 1105
- Springel et al. (2001) Springel V., White S. D. M., Tormen G., Kauffmann G., 2001, Monthly Notices of the Royal Astronomical Society, 328, 726
- Steinmetz & White (1997) Steinmetz M., White S. D. M., 1997, Monthly Notices of the Royal Astronomical Society, 288, 545
- The EAGLE team (2017) The EAGLE team 2017, arXiv:1706.09899 [astro-ph]
- Thob et al. (2019) Thob A. C. R., et al., 2019, Monthly Notices of the Royal Astronomical Society, 485, 972
- Virtanen et al. (2020) Virtanen P., et al., 2020, Nat Methods, 17, 261
- Wiersma et al. (2009) Wiersma R. P. C., Schaye J., Theuns T., Vecchia C. D., Tornatore L., 2009, Monthly Notices of the Royal Astronomical Society, 399, 574
- Wilkinson et al. (2023) Wilkinson M. J., Ludlow A. D., Lagos C. d. P., Fall S. M., Schaye J., Obreschkow D., 2023, Monthly Notices of the Royal Astronomical Society, 519, 5942
- Zana et al. (2022) Zana T., et al., 2022, Monthly Notices of the Royal Astronomical Society, 515, 1524
- van de Sande et al. (2019) van de Sande J., et al., 2019, Monthly Notices of the Royal Astronomical Society, 484, 869