Crossing the Rubicon of Reionization with QSOs
Abstract
One of the key open questions in Cosmology is the nature of the sources that completed the cosmological hydrogen Reionization at . High-z primeval galaxies have been long considered the main drivers for Reionization, with a minor role played by high-z AGN. However, in order to confirm this scenario, it is fundamental to measure the photo-ionization rate produced by active SMBHs close to the epoch of Reionization. Given the pivotal role played by spectroscopically complete observations of high-z QSOs, in this paper we present the first results of the RUBICON (Reionizing the Universe with BrIght COsmological Nuclei) survey. It consists of a color selected sample of bona-fide QSO candidates from the Hyper Suprime-Cam Subaru Strategic Survey. Our QSO candidates have been validated both by photometric redshifts based on SED fitting and by spectroscopic redshifts, confirming that they lie at . A relatively large space density of QSOs () is thus confirmed at and , consistent with a pure density evolution of the AGN luminosity function from z=4 to z=5, with a mild density evolution rate of 0.25 dex. This indicates that AGN could play a non-negligible role in the cosmic Reionization. The Rubicon of Reionization has been crossed.
1 Introduction
During its first billion years, the Universe underwent a major phase transition for its main baryonic content, the so called Epoch of Reionization (EoR). The first stars and black holes produced an intense ultraviolet (UV) radiation that gradually ionized the hydrogen atoms in the intergalactic medium (IGM), creating ionized bubbles growing for approximately 1 Gyr, until they fully percolated at (e.g., Fan et al., 2006, 2022; Meiksin, 2009; Choudhury, 2022). A very late and relatively rapid reionization process has been suggested by current observational constraints (e.g., Planck Collaboration et al., 2020), with a tail-end extending at (e.g., Eilers et al., 2018; Keating et al., 2020; Bosman et al., 2022; Zhu et al., 2022; Jin et al., 2023) and lasting for (George et al., 2015; Reichardt et al., 2021).
The cosmological sources responsible for this disruptive event have been sought for long time, with conflicting opinions in favor of the two principal suspects, i.e. the star-forming galaxies (e.g., Finkelstein et al., 2019) and the active galactic nuclei (e.g., Giallongo et al., 2012, 2015, 2019; Boutsia et al., 2018; Grazian et al., 2018, 2020, 2022). The mainstream approach to Reionization of all the extragalactic community has been concentrated for more than twenty years to demonstrate that the Reionization process started early and extended in a relatively large redshift interval (), and that it is driven only by faint star-forming galaxies (e.g., Lehnert & Bremer, 2003; Bouwens et al., 2003, 2007; Dayal & Ferrara, 2018; Trebitsch et al., 2021). This was motivated by early results by WMAP (Spergel et al., 2003). This scenario, however, has been shown to be in clear contrast with recent measurements of the ionization status of the inter-galactic medium (IGM). The temporal evolution of the neutral hydrogen fraction indicates indeed that it rapidly drops from a value of 1.0 (fully neutral) to a value of (almost completely ionized) between and (Fan et al., 2006; Hoag et al., 2019; Planck Collaboration et al., 2020; Fontanot et al., 2023). Models assuming relatively faint star-forming galaxies as the only contributors to the photon budget of HI ionizing background are thus in tension with the observed rapid and late reionization process, since these galaxies tend to start the reionization process too early (e.g., Naidu et al., 2020).
One of the first astonishing and transformational results of the James Webb Space Telescope (JWST) is that the space density of galaxies at redshift greater than 10 seems to be quite high, possibly similar to or even larger than the one at redshift 7 (e.g., Labbé et al., 2023; Yan et al., 2023), and therefore it is significantly higher than predictions by numerical simulations (e.g., Haslbauer et al., 2022). It is worth mentioning, however, that these observational results have been based on the very early data from JWST, that can be affected by (still unknown) calibration issues, e.g., in data reduction, photometric calibration, astrometry, as discussed in Finkelstein et al. (2022); Griggio et al. (2023). For example, several galaxies fitted at can be instead extremely dusty starbursts at , as shown by Rodighiero et al. (2023) with the JWST NIRCam survey in SMACS0723. A more detailed and mature analysis of the first JWST data is certainly needed in the future, corroborated also by spectroscopic confirmations (e.g., Keller et al., 2023). There are two possible explanations to reconcile the large space density of galaxies at with a scenario of late reionization: either most of these galaxies are at or very few ionizing photons are able to escape from these high-z galaxies into the IGM.
Lastly, a numerous population of faint high-z AGN candidates has been recently emerging from deep JWST spectra (e.g., Trump et al., 2023; Brinchmann, 2022; Wang et al., 2022; Kocevski et al., 2023; Harikane et al., 2023; Larson et al., 2023; Maiolino et al., 2023), from compact morphology (Ono et al., 2022) or from deep MIRI photometry (Iani et al., 2022). Recent JWST results from the JADES survey (Robertson et al., 2023) seem to indicate that faint AGN at are started to be found in deep NIRSpec spectra of normal star-forming galaxies. For example, Übler et al. (2023) and Parlanti et al. (in prep.) are finding evidences of broad components (FWHM of 2000 km/s) for Balmer emission lines (e.g. H, H) for galaxies at at , e.g. GDS 273 and GDS 3073 in the CANDELS GOODS-South field. These powerful outflows can be powered only by AGN, as shown by Fiore et al. (2023). These two sources have already been shown to host confirmed AGN in the past (Giallongo et al., 2019; Grazian et al., 2020), thanks to the X-ray detection by Chandra for GDS 273 and to the detection of OVI 1032 line in emission for GDS 3073, as confirmed also by Barchiesi et al. (2022). Another results by deep NIRspec observations is that high-z AGN are quite common at the center of star-forming galaxies, hinting for a large space density of relatively faint accreting SMBHs in the primordial Universe, as recently found in the CEERS survey (Kocevski et al., 2023; Harikane et al., 2023). This result can have also deep implications for the early SMBH seeding/collapse scenario, as recently discussed by Trinca et al. (2022, 2023); Onoue et al. (2023); Fontanot et al. (2023).
The hypothesis of a large space density of faint AGN at and their possible contribution to the hydrogen reionization is not a new idea. In the last ten years, indeed, there was a raising consciousness for the role of AGN as relevant sources of ionizing photons, triggered by several studies focusing on the faint-end of the AGN luminosity function (LF) at . The observations of Giallongo et al. (2012, 2015, 2019); Boutsia et al. (2018, 2021) and Grazian et al. (2020, 2022) have hinted at a larger than expected number density of faint AGN at , which could imply a significant (if not dominant) contribution of AGN to the ionizing UV background, if such number densities hold up to higher redshifts (e.g., Mitra et al., 2018; Fontanot et al., 2023). This scenario has been heavily debated in the past few years, with other studies finding lower AGN number densities at (e.g., McGreer et al., 2018; Parsa et al., 2018; Akiyama et al., 2018; Kulkarni et al., 2019; Niida et al., 2020; Kim & Im, 2021; Shin et al., 2022; Jiang et al., 2022) and recently by Schindler et al. (2023). These contradicting conclusions on the space density of high-z AGN are likely connected with known problems in the candidate selection, based either on deep pencil beam surveys (highly affected by strong cosmic variance effects) or on shallow wide area surveys carried out with efficient criteria, but typically affected by large incompleteness.
In this paper we exploit the unique combination of deep and wide areal coverage of the Hyper Suprime-Cam surveys, together with selection strategy aiming at maximizing the selection completeness, in order to place a robust measurement of the space density of QSOs at , close to the main epoch of hydrogen reionization.
The structure of this paper is the following: in Section 2 we describe the new QSO survey. In Section 3 we address the problematic of the selection of QSOs, their completeness estimate, and the first results of the follow-up spectroscopic program. In Section 4 we derive the QSO luminosity function at , discussing the evolution of the QSO space density with redshift, and the derivation of the photo-ionization rate produced by QSOs at . In this section we also check the validity of the recent results on the AGN Luminosity Function at with a Monte Carlo simulation. We discuss the reliability of these results in Section 5, providing the concluding remarks in Section 6. Throughout the paper, we adopt H0=70 km s-1 Mpc-1, =0.3, and =0.7, in agreement with the cold dark matter (-CDM) concordance cosmological model. All magnitudes are in the AB photometric system.
2 Data
2.1 The RUBICON Survey
The RUBICON (Reionizing the Universe with BrIght COsmological Nuclei) survey is an attempt to provide robust constraints to the number density of QSOs close to the EoR, i.e. at . The main aim of the RUBICON survey is to measure the Luminosity Function of QSOs, to derive their contribution to the photo-ionization rate measured at high-z, and in preparation for future wide and deep surveys, e.g. with Euclid, the Roman Space Telescope, and the Vera Rubin Legacy Survey of Space and Time (LSST).
Due to the dearth of high-z QSOs, especially at bright magnitudes, large areas of the sky are required in order to build an efficient and statistically meaningful sample of the rare QSOs. Moreover, at these redshifts even the brightest QSOs () start to appear as relatively faint, due to the cosmological dimming effect and to the strong IGM absorption (e.g. Inoue et al., 2014). At this aim, we have adopted as starting database the Third Public Data Release of the Hyper Suprime-Cam Subaru Strategic Program (HSC-SSP PDR3, Aihara et al., 2022) in order to search for QSOs at . The HSC-SSP PDR3 survey covers an effective area of 34.7 sq. deg. down to magnitudes 25-27 AB in the grizY bands (Deep and Ultradeep surveys, hereafter HSC-Udeep), and a larger area of 1200 sq. deg. in three extended regions down to a slightly shallower limits of 24-26 AB magnitudes (HSC-Wide survey).
The HSC-Udeep survey allows a unique combination of extended (34.7 sq. deg.) and deep ( magnitude depth at 5) multi-wavelength (grizY) imaging, which is fundamental to overcome the dramatic issues related to previous surveys (i.e. large cosmic variance effects in small deep surveys and/or large incompleteness in wide but shallow surveys). The HSC-Udeep survey is unique at the present time since it is able to significantly widen the survey discovery space both in magnitude depth and in the areal coverage. In particular, the HSC-Udeep survey consists of four separate extragalactic fields (SXDS, COSMOS, DEEP2-3, ELAIS-N1), which allow us to beat down the cosmic variance errors to less than 10%, i.e. a negligible value111from Cosmic Variance Calculator Trenti & Stiavelli (2008) https://www.ph.unimelb.edu.au/mtrenti/cvc/CosmicVariance.html with respect to the Poissonian noise (), that is assumed to dominate in this survey, given the expected low numbers of high-z QSOs.
In order to complement the HSC-Udeep survey with larger but shallower areas, with the aim of further reducing the cosmic variance effects, we select a 108 sq. deg. patch of the HSC-Wide survey, centered around the SXDS field (Furusawa et al., 2008). The selected area covers an extended sky region with Right Ascension in the interval and declination in the range . The selected sky patch is slightly larger than the area adopted by Niida et al. (2020), allowing us to make further progresses for the selection of relatively bright QSOs at and for reducing the cosmic variance effects. The HSC-Wide survey is 1 magnitude shallower than the HSC-Udeep survey. This is not a problem for our purposes, since the QSOs we are interested on have apparent magnitudes of 20, and the depths of the HSC-Wide database are more than adequate for selecting QSO candidates of .
3 Selection method
We have selected from the HSC-Udeep and HSC-Wide surveys all the sources with magnitudes in the z-band brighter than . For each source, we have retrieved from the HSC-SSP PDR3 database the PSF photometry, which is more accurate than Kron magnitudes for point like objects. At these apparent magnitudes, indeed, we expect that the contamination from extended sources is minimal, and the bulk of the sources at are stars or rare QSOs. For the sake of completeness, however, we have checked that the results in this paper are not affected whether the Kron magnitudes are used instead of the PSF photometry.
Spectroscopic redshifts for known QSOs in HSC-Udeep and HSC-Wide surveys have been retrieved from SDSS DR17 (Abdurro’uf et al., 2022), after careful visual inspection of SDSS spectra, from SIMBAD222https://simbad.u-strasbg.fr/simbad/sim-fid, and from NASA/IPAC Extragalactic Database (NED333https://ned.ipac.caltech.edu/). In the HSC-Udeep area we have retrieved from these databases three QSOs with , while in the HSC-Wide region the number of previously known QSOs in this redshift interval is eight. They are shown in the upper part of Table 1 and Table 2.
3.1 Selection criteria in the HSC-Udeep survey
In the HSC-Udeep area there are 84122 sources with . This is our starting database for high-z QSOs selection. We set this relatively bright magnitude limit, , both for HSC-Udeep and HSC-Wide, in order to match our catalog with GAIA DR3 (Gaia Collaboration et al., 2022) and exploit this dataset to reject stars brighter than , thanks to the accurate measurements of parallaxes and proper motions still possible at this flux cut. At fainter magnitudes, the GAIA DR3 catalog starts to be less complete and going to fainter magnitude increases the contamination rate expected from galactic stars. Moreover, we have restricted the analysis to an apparent AB magnitude of , since we want to study the space density of QSOs close to the luminosity function break (, i.e. ) and in order to exploit the wide dynamic range in G-R color uniquely afforded by the deep HSC images.
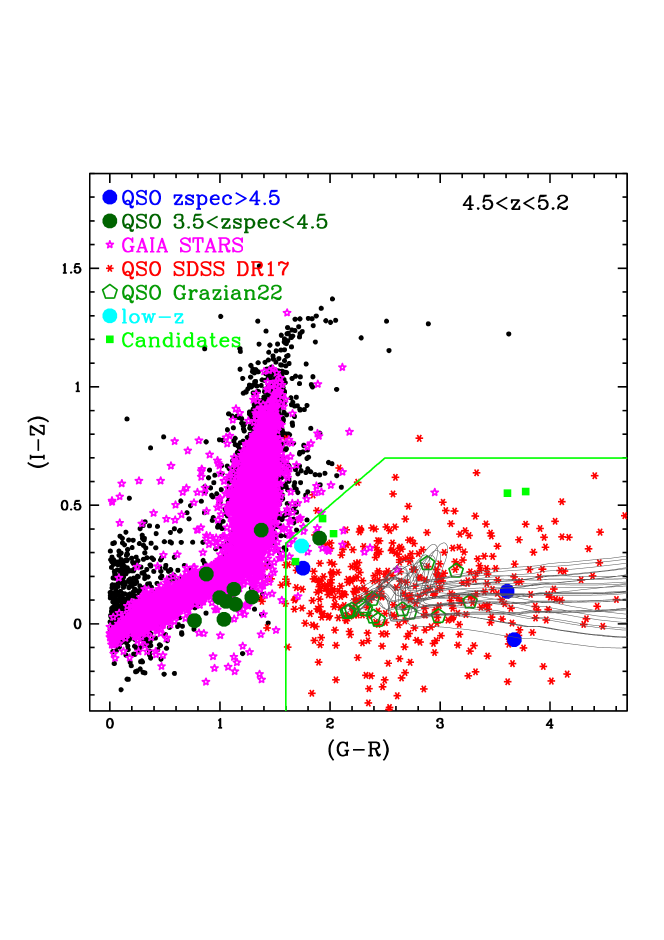
Bona-fide QSO candidates at redshift have been selected with the G-R vs I-Z color selection criterion shown in Fig. 1, similar to, but slightly more extended than, the one previously adopted e.g. by McGreer et al. (2018). The criterion used here (, , and ) is able to recover of the SDSS DR17 spectroscopically confirmed QSOs in the same redshift interval, indicating the robustness of the adopted color selection. In Fig. 1, the known very bright QSOs, discovered by Grazian et al. (2022) in the SkyMapper survey (Wolf et al., 2018), sit inside the adopted color selection criteria, confirming its validity. The synthetic HSC colors of these QSOs have been derived through SED fitting to the observed SkyMapper photometry with AGN libraries fixed at the spectroscopic redshifts of the objects. The grey tracks in Fig. 1 are the simulated colors of synthetic QSOs in the redshift range . The mean IGM absorption by Inoue et al. (2014) has been adopted for these tracks. They confirm that the adopted selection criteria is not affected by strong incompletenesses.
| RA | Dec | zspec | Class | zphot | Reference zspec | |||
|---|---|---|---|---|---|---|---|---|
| 2480 | 34.685304 | -4.806873 | 19.545 | 4.573 | QSO | 3.78 | SDSS DR17 | -26.63 |
| 42780 | 35.302588 | -3.714523 | 19.496 | 5.011 | QSO | 4.98 | SDSS DR17 | -26.89 |
| 157404 | 151.161764 | 2.209315 | 19.823 | 5.007 | QSO | 4.97 | Le Fèvre et al. (2013) | -26.56 |
| 258 | 244.195589 | 54.324056 | 19.669 | Candidate | 3.78 | |||
| 20375 | 35.334481 | -5.390547 | 18.525 | Candidate | 0.29 | |||
| 131889 | 148.729614 | 1.853699 | 19.940 | Candidate | 3.42 | |||
| 213732 | 244.192594 | 54.342625 | 19.842 | Candidate | 1.49 | |||
| 233735 | 243.709363 | 56.147401 | 19.739 | Candidate | 3.80 |
Among the HSC-Udeep sources brighter than and falling in the color-color selection region highlighted in Fig. 1, there are four confirmed QSOs, one with spectroscopic redshift (big dark-green circle) and three with (big blue circles). There are also five QSO candidates with on the color-color selection region highlighted in Fig. 1 (small green squares).
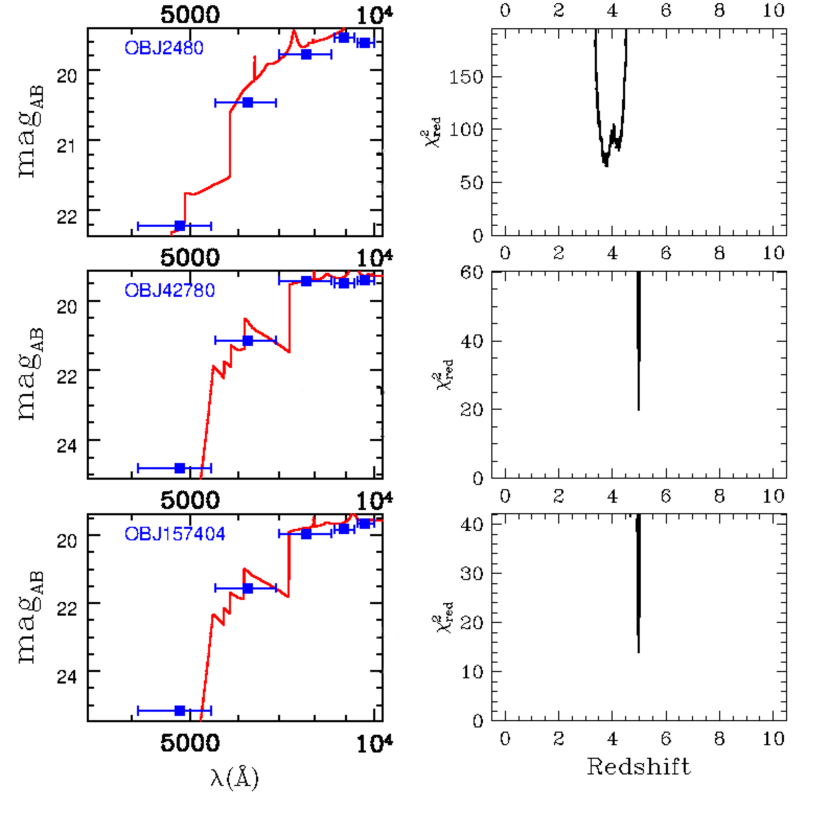
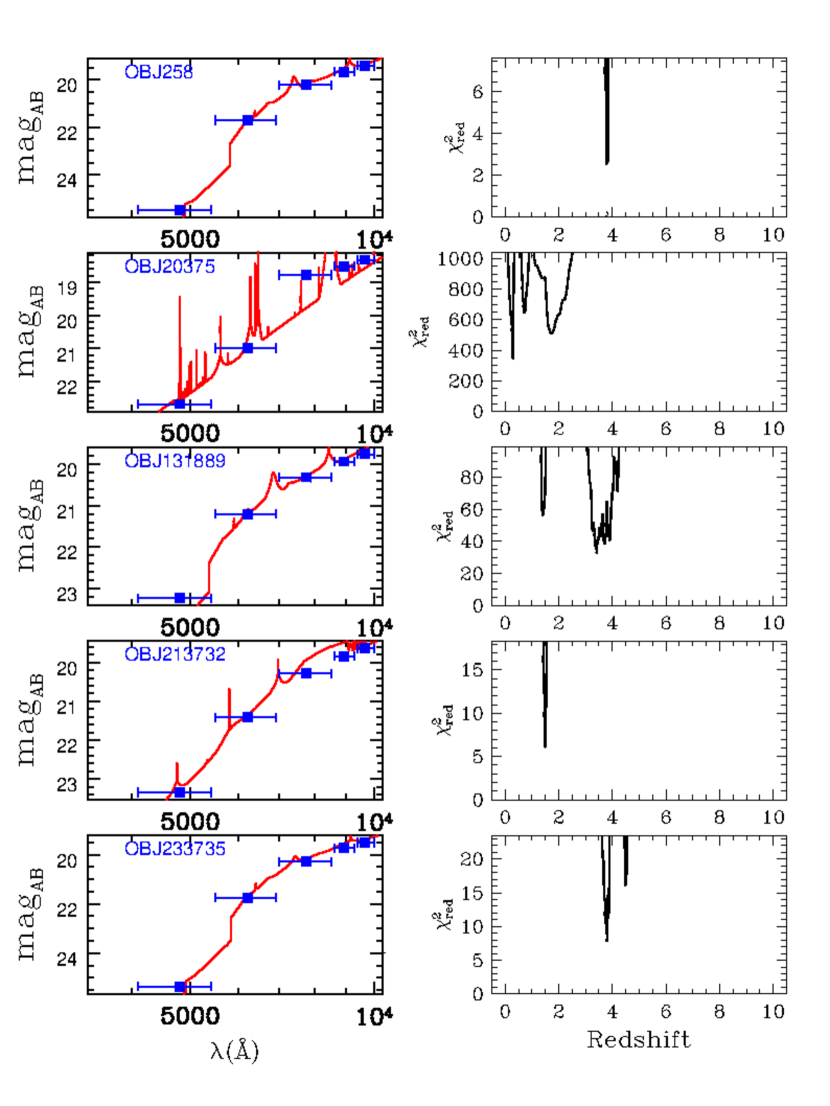
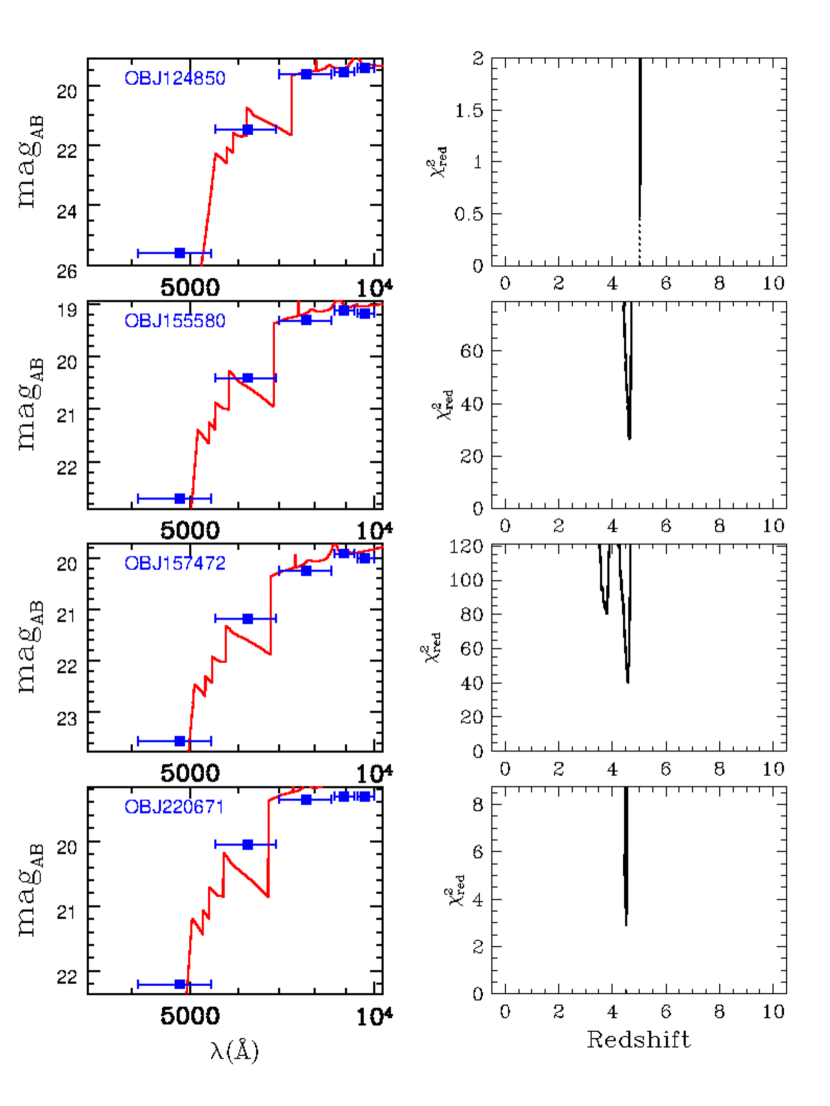
For all the known QSOs and the candidates selected through color criteria, we have computed the photometric redshifts by adopting a library of synthetic spectra of QSOs taken from LePhare software (Ilbert et al., 2006), with the mean IGM opacity of Inoue et al. (2014). These photometric redshifts are based on a fitting method between the observed photometric catalog and the model SED. The observed photometry, the SED fitting, and the for the three confirmed QSOs at in Table 1 (top) are shown in Fig. 2. From Fig. 2, it is possible to check that these photometric redshifts give an approximately good indication of the spectroscopic redshifts for the majority of the known QSOs, but, for several QSOs, they tend to slightly underestimate the true ones. In particular, a QSO with has in Table 1. This is mainly due to the fact that the G-R color is not a strict redshift indicator, but it can also be affected by the variance of IGM transmission, which is quite large at (e.g. Inoue et al., 2014; Worseck et al., 2014). The mismatch between photometric redshifts and spectroscopic ones could be due to the fact that the former are computed at a mean IGM absorption (the one by Inoue et al., 2014, in this case), while each high-z QSO has a stochastic IGM absorption along a given line of sight which is different from each other, as discussed e.g. in Cristiani et al. (2016) and Romano et al. (2019) for QSOs at .
The five QSO candidates in the bottom part of Table 1 are shown in Fig. 8. The best-fit SEDs of all these candidates show that the for these objects are significantly below 4.5, as summarized in Table 1. Moreover, the absence of convincing break in the observed color for two of these candidates (20375 and 213732) could indicate that they possibly are contaminating stars or low-z galaxies, as also indicated by their photometric redshifts. The two candidates at (258 and 233735), instead, could be QSOs at , as discussed before for the confirmed QSOs, while object 131889 has , so it is unlikely that it will turn out to be at .
Despite the large area covered by the HSC-Udeep survey (34.7 sq. deg.), the number of confirmed QSOs at and is still modest, three, due to the relatively low value of the QSO space density at high-z and bright magnitudes. Two additional candidates could be at , indicating that the current space density of high-z QSOs provided here is possibly a lower limit.
In order to minimize the cosmic variance effect, we rely also on a larger portion of the sky, observed by the HSC-Wide survey near the SXDS field, as we will describe in the following.
3.2 Selection criteria in the HSC-Wide survey
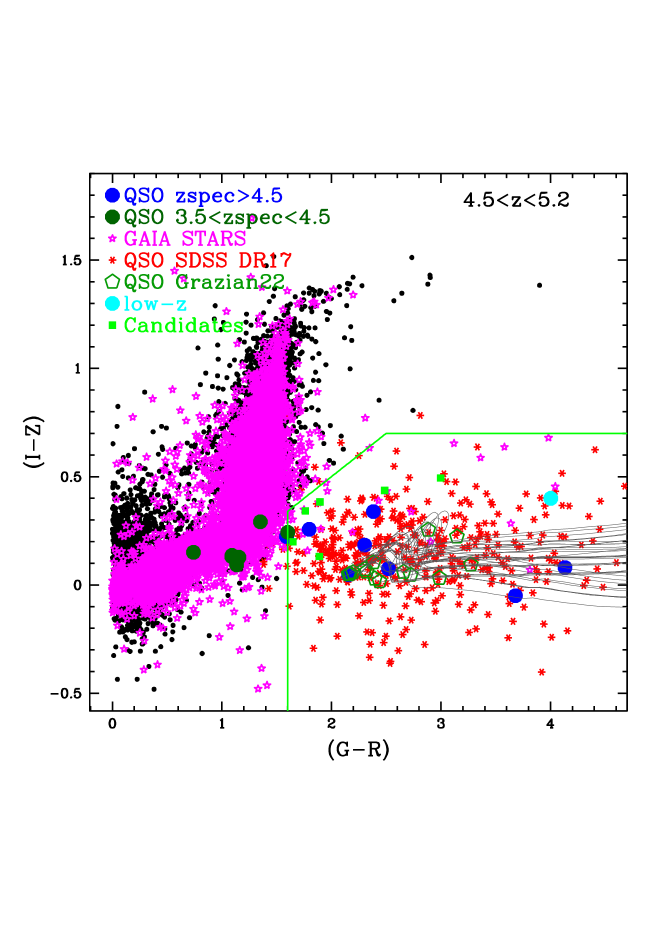
In the HSC-Wide region we have selected 245946 sources at . This is our starting database for high-z QSOs selection in the wide area. Fig. 3 shows the vs color-color diagram for all sources in the HSC-Wide area. The black dots are all the objects with magnitude , the red stars show the known QSOs with drawn from SDSS DR17. The dark-green open pentagons are the known very bright QSOs with from the QUBRICS survey (Grazian et al., 2022). The big blue circles are the known QSOs with in the HSC-Wide area. The green lines indicate the adopted color criteria for selecting bona-fide QSO candidates, while the green dots are the QSO candidates identified in the HSC-Wide region.
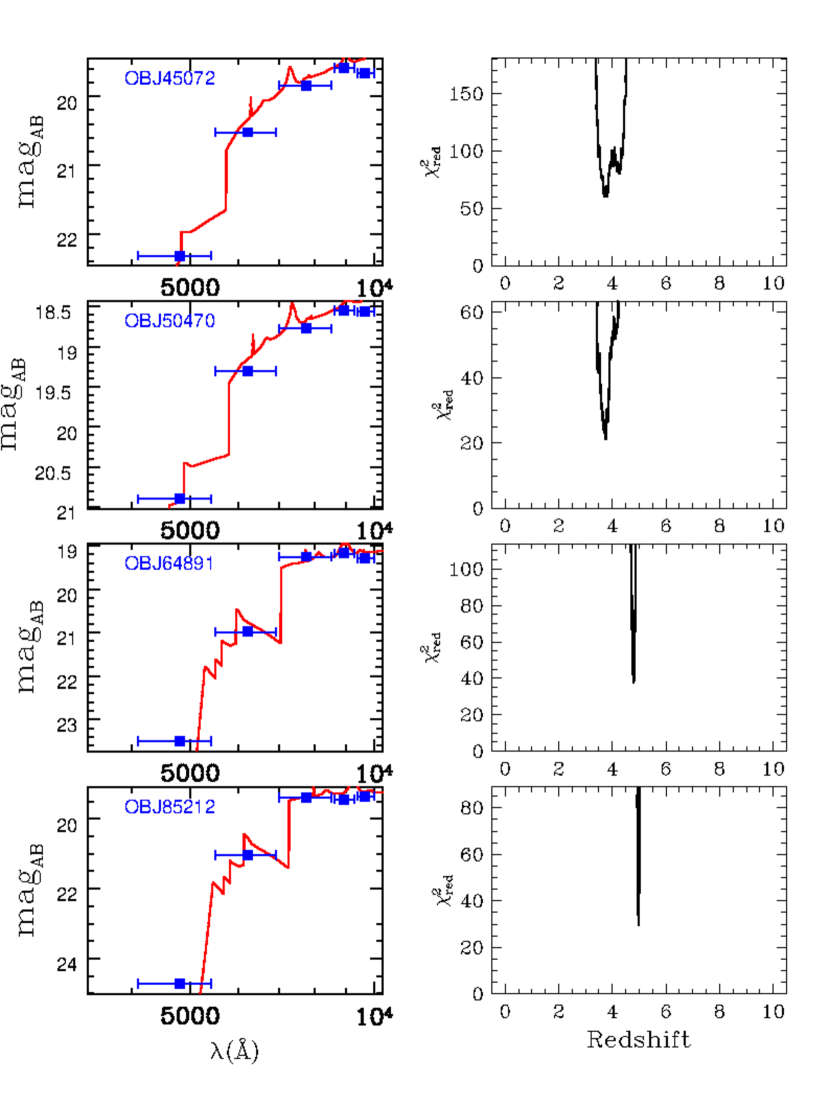
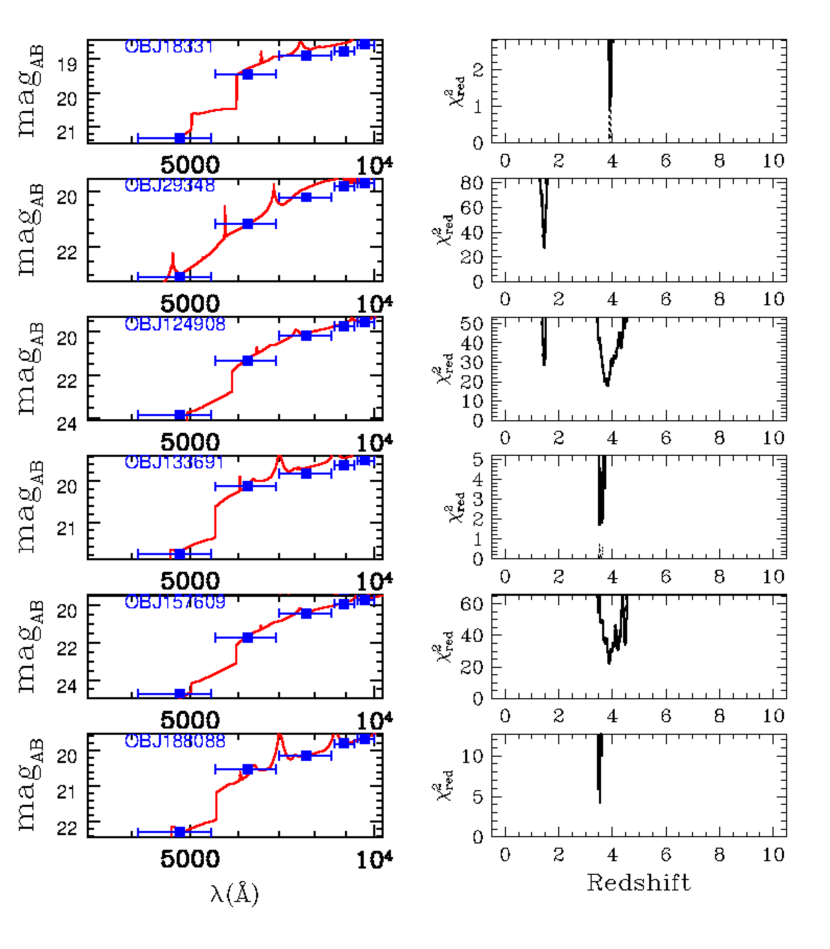
Eight QSOs with have been selected by the adopted color criteria, while six candidates at still lack spectroscopic identification, as summarized in Table 2. The photometric redshifts for these objects have been derived as described above for the HSC-Udeep sample. The SEDs and for these sources have been shown in Fig. 9, 10, and 11.
| RA | Dec | zspec | Classification | zphot | Reference zspec | |||
|---|---|---|---|---|---|---|---|---|
| 45072a | 34.685307 | -4.806874 | 19.59 | 4.573 | QSO | 3.71 | SDSS DR17 | -26.59 |
| 85212b | 35.302590 | -3.714526 | 19.45 | 5.011 | QSO | 4.97 | SDSS DR17 | -26.94 |
| 50470 | 38.108906 | -5.624829 | 18.55 | 4.565 | QSO | 3.75 | SDSS DR17 | -27.62 |
| 155580 | 32.679849 | -0.305117 | 19.12 | 4.732 | QSO | 4.64 | McGreer et al. (2013) | -27.13 |
| 64891 | 29.079132 | -4.694392 | 19.18 | 4.940 | QSO | 4.79 | Wang et al. (2016) | -27.17 |
| 124850c | 30.428719 | -1.897370 | 19.56 | 5.021 | QSO | 5.03 | This work | -26.83 |
| 157472 | 33.580926 | -1.121369 | 19.92 | 4.628 | QSO | 4.57 | Alam et al. (2015) | -26.29 |
| 220671 | 29.345417 | +2.044333 | 19.31 | 4.503 | QSO | 4.52 | Pâris et al. (2014) | -26.83 |
| 18331 | 34.160449 | -3.627184 | 18.77 | Candidate | 3.90 | |||
| 29348 | 30.086655 | -6.297243 | 19.83 | Candidate | 1.45 | |||
| 124908 | 39.195707 | -2.344237 | 19.75 | Candidate | 3.82 | |||
| 133691 | 37.494808 | -2.247878 | 19.62 | Candidate | 3.52 | |||
| 157609 | 32.563067 | -0.133051 | 19.94 | Candidate | 3.89 | |||
| 188088 | 29.302144 | +0.579305 | 19.81 | Candidate | 3.53 |
Similarly to the case of HSC-Udeep survey, not all of the QSO candidates in the HSC-Wide area have a photometric redshift above 4.5. One candidate (ID=29348) has a photometric redshift of and its SED is a power law without any evident break, so this is probably a dwarf galaxy at low-z, with optical colors similar to high-z QSOs. The five remaining candidates have , indicating that they are potential QSOs at higher redshifts, given the possible underestimation of the photometric redshift solutions for QSOs, as we find in the HSC-Udeep area. A follow-up spectroscopic confirmation of these candidates is important to derive a complete census of high-z QSOs in this region.
3.3 A pilot follow-up spectroscopic program in the HSC-Wide area
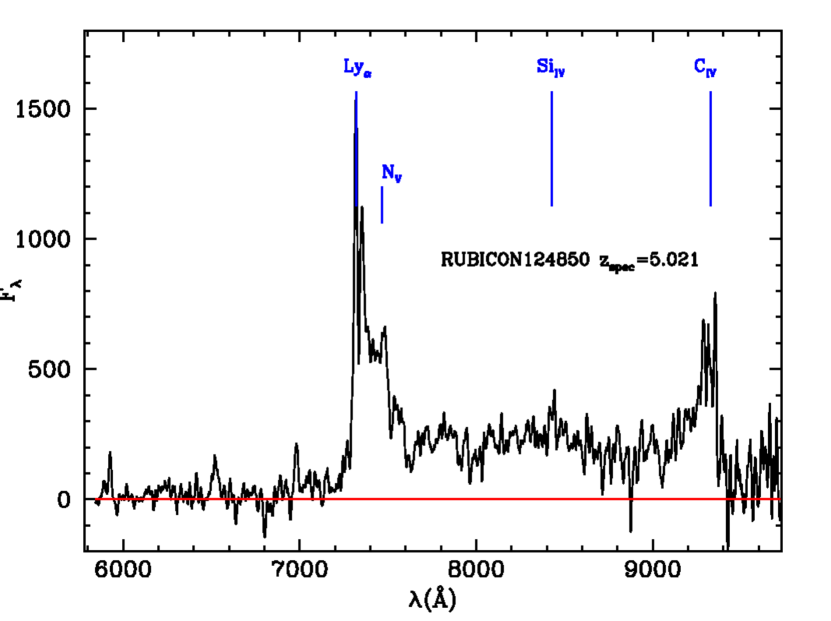
In the selected G-R vs I-Z region of the HSC-Wide survey, we recover 7 QSOs at which were previously known from other spectroscopic surveys in the literature. Another QSO (ID=124850 at ) has been discovered by a pilot spectroscopic program carried out by our team at the Magellan telescope with IMACS in November 2022. The spectrum of this new QSO is shown in Fig. 4. This object has been independently confirmed by recent spectroscopic follow-up of the QSO candidates in the DESI survey, as described in Yang et al. (2023). This new discovery indicates that the previous spectroscopic surveys in this field have not yet completed the identification of relatively bright QSO candidates, and there is still space for improvement, as shown in Table 2.
The number of candidates observed within our pilot spectroscopic project is very limited, and it is not useful at this stage to draw conclusions on the success rate of our color selection criterion. This will be carried out in the future, once a larger sky area will be taken into account. Since the QSO luminosity function has been derived by considering only the spectroscopically confirmed QSOs, the correct estimate of the success rate of the survey is not needed for the aims of the present paper.
4 Results
4.1 The Completeness of the RUBICON survey
In order to provide a fair estimate of the completeness of the RUBICON survey, we carry out simulations of synthetic QSO colors. We started from a library of 215 spectra of low-z QSOs from SDSS described in Fontanot et al. (2007) and we convolve each of them with IGM transmission corresponding to 1024 individual line-of-sight simulated using the Inoue et al. (2014) formalism, for each redshift bin from to with a separation of . The resulting spectra have been convolved with the HSC filter curves in grizY to derive the photometry in the HSC bands. The synthetic magnitudes of these 4.8 million QSOs have been perturbed according to the noise statistics of the HSC images, in order to reproduce the observed magnitude-error relation for each filter. In particular, we adopt the magnitude limits at 5 from Aihara et al. (2022) in order to reproduce the observed trend of magnitudes versus errors for each band. We carried out this exercise both for the HSC-Udeep and the HSC-Wide magnitude limits. We then apply the same color criteria shown in Fig. 1 and Fig. 3 to the synthetic sample affected by noise, and compute the selection function for different apparent magnitudes in the z-band (from to ) and for different redshifts (from to ). Fig. 5 shows the completeness of the HSC-Udeep and HSC-Wide surveys derived through these simulations. It turns out that the completeness of the adopted color criteria is almost constant, both in apparent magnitude and in redshift, and the mean value of the completeness is 94% and 88% for the HSC-Udeep and the HSC-Wide surveys, respectively.


4.2 The QSO Luminosity Function at
The HSC-Udeep sample of confirmed QSOs at in Table 1 has been used to compute the luminosity function of QSOs at . The sample in the HSC-Wide area has been used in order to check the robustness of the results obtained in the relatively small HSC-Udeep area. Indeed, the larger area adopted here for the HSC-Wide survey allows us to decrease the uncertainties associated with the possibly high cosmic variance in the HSC-Udeep region.
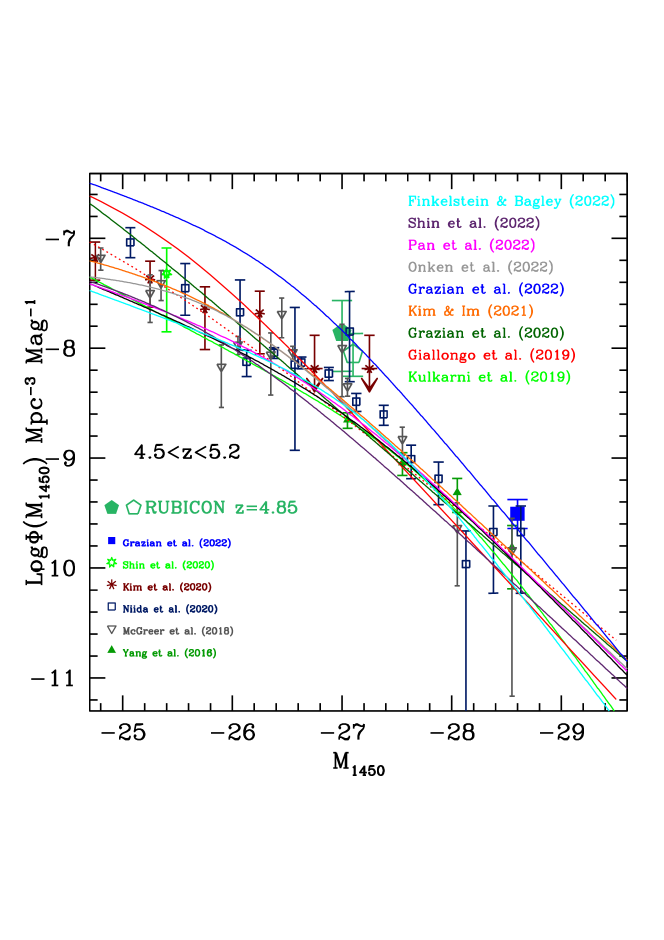
The absolute magnitudes in Table 1 and 2 have been derived for each QSO starting from the observed magnitudes in the Z band and the spectroscopic redshifts , taking into account the effect of the distant modulus and the k-correction, as described in Grazian et al. (2022). The luminosity function has been computed as the inverse of the accessible volume, summed up for all the confirmed QSOs, as described in detail in Boutsia et al. (2021) and in Grazian et al. (2022). The accessible volume for each individual QSO has been corrected for the completeness fraction derived by the simulations described above. In particular, for each QSO we adopt the completeness correction as a function of the z-band magnitude and spectroscopic redshift, as shown in Fig. 5. Error bars on the space density of QSOs have been derived through Poisson statistics, if the number of sources per bin is above 10, or with the Gehrels (1986) statistics for smaller numbers. Fig. 6 shows the QSO Luminosity Function at . The QSO space density obtained in the HSC-Udeep and HSC-Wide surveys is a factor of larger than the one derived by other surveys in the past (e.g., Yang et al., 2016; McGreer et al., 2018; Niida et al., 2020; Kim et al., 2020; Shin et al., 2020, 2022). The blue continuous line shows the best fit of Boutsia et al. (2021), evolved from to with a redshift evolution of , as derived by Grazian et al. (2022), using the results from the QUBRICS survey, which is limited to magnitudes . Even in this case, the best fit is a factor of larger than the results found by Kulkarni et al. (2019); Giallongo et al. (2019); Grazian et al. (2020); Kim et al. (2020); Onken et al. (2022). The results we present here for the RUBICON survey are consistent with the parameterization found by Boutsia et al. (2021) and the evolution of the QSO space density derived by Grazian et al. (2022), as shown in Fig. 6. This result confirms that the evolution of the QSO luminosity function is consistent with a pure density evolution in the range , with a relatively shallow declining rate ( dex), as found by Grazian et al. (2022) and Fontanot et al. (2023).
4.3 Maximum Likelihood simulations
Maximum Likelihood probabilities have been also computed, adopting as reference a large collection of publicly available parameterizations for the QSO Luminosity Function at comparable redshifts. We carried out a Monte Carlo simulation in order to predict the expected number of QSOs with and magnitude observed in the 34.7 sq. deg. of the HSC-Udeep area and in the 108 sq. deg. of the HSC-Wide survey considered here, according to different parameterizations of the QSO luminosity function proposed at . If the adopted luminosity function is not available exactly at , we adopt a pure density evolution with the parameter quoted in each paper. For each best-fit value of a given luminosity function listed in Table 3, we randomly extracted the redshifts and absolute magnitudes for the expected QSOs in a given area of the sky. We then assign to each simulated QSO a synthetic SED, randomly taken from the library used to compute the photometric redshifts described in Section 3. The selected SED is then redshifted to the assigned redshift and normalized according to the given absolute magnitude . This spectrum is then convolved with the filters adopted for the HSC survey and the observed magnitudes in the grizY photometric system have been derived for each simulated QSO. We do not take into account here the effects of the photometric errors, since at the bright magnitude limit adopted here () the photometric uncertainties should be small. We then select all the simulated QSOs within the same redshift and luminosity range of the observed sample, i.e. with and magnitude . We repeated the simulations for iterations. For each parameterization of the QSO luminosity function we then derived the mean number of QSOs expected for the HSC-Udeep and HSC-Wide areas, the standard deviation on for the random realizations and the probability of recovering at least 9 objects (i.e. the number of observed QSOs in the HSC-Udeep and HSC-Wide surveys) using the same selection criteria in these iterations, that is called . Since the spectroscopic confirmation of the candidates in Table 1 and 2 is not finished yet, and given also the incompleteness of the RUBICON survey discussed above, the observed number of high-z QSOs can be considered as a lower limit to the real number of QSOs. For this reason, we have measured the likelihood of each luminosity function parameterization by computing .
First of all, we check the consistency of the luminosity function of Grazian et al. (2022) with the observed number of high-z QSOs in the RUBICON survey. According to Table 3, the expected number of QSOs (at and ) for the HSC-Udeep and HSC-Wide surveys investigated here should be of for the parameterization of Grazian et al. (2022). In the same magnitude and redshift intervals, we observe 9 bright QSOs. This does not mean, however, that the Grazian et al. (2022) prediction is overestimated by a factor of , since in these simulations we assume a completeness of 100%, while in reality the completeness is of the order of 88-94%, as we found in this work. Moreover, the spectroscopic identification of the QSO candidates in our area is not finished yet, and other QSOs could be discovered among the targets in Table 1 or Table 2. For example, the candidates and 233735 in HSC-Udeep and , 124908, and 157609 have and all of them could be finally confirmed at , as we discussed in the previous paragraph.
Table 3 summarizes the expected numbers and the associated probabilities for a number of QSO luminosity functions appeared recently in the literature. Only the parameterization of Grazian et al. (2022) has a probability grater than 80% to observe 9 or more QSOs in the HSC-Udeep and HSC-Wide surveys, while all the other luminosity functions have a probability less than 20%, due to their much lower normalization in space density. In particular, the parameterizations by Pan et al. (2022) (models 1, 2, 3) have probabilities of , while all the other luminosity functions have probabilities less than . We can thus conclude that all the previous luminosity functions of QSOs are excluded at 1 confidence level (corresponding to 16% probability), while only the QSO luminosity functions of Grazian et al. (2022) and model 3 of Pan et al. (2022) are consistent with the present data at more than 1. Adopting a more stringent threshold of 2.3% confidence level, corresponding to 2, the following luminosity function are not (statistically) acceptable: Yang et al. (2016); McGreer et al. (2018); Kulkarni et al. (2019); Niida et al. (2020); Kim et al. (2020); Kim & Im (2021); Finkelstein & Bagley (2022); Onken et al. (2022); Jiang et al. (2022); Shin et al. (2022); Schindler et al. (2023); Harikane et al. (2023); Matsuoka et al. (2023) and model 4 of Pan et al. (2022).
| Paper | r.m.s. | ||
|---|---|---|---|
| Grazian et al. (2022) | 16.02 | 3.99 | 98.03% |
| Harikane et al. (2023) | 0.05 | 0.07 | 0.00% |
| Matsuoka et al. (2023) | 0.06 | 0.25 | 0.00% |
| Schindler et al. (2023) | 0.29 | 0.55 | 0.00% |
| Shin et al. (2022) w/o K20 | 2.10 | 1.47 | 0.00% |
| Shin et al. (2022) w/ K20 | 2.11 | 1.44 | 0.00% |
| Jiang et al. (2022) model 75% c.l. | 0.12 | 0.36 | 0.00% |
| Jiang et al. (2022) model 95% c.l. | 0.14 | 0.39 | 0.00% |
| Onken et al. (2022) w/ Kim20 | 3.59 | 1.89 | 1.39% |
| Onken et al. (2022) w/ Niida20 | 2.69 | 1.61 | 0.14% |
| Pan et al. (2022) model 1 | 4.98 | 2.24 | 7.26% |
| Pan et al. (2022) model 2 | 5.49 | 2.30 | 9.83% |
| Pan et al. (2022) model 3 | 6.45 | 2.57 | 19.68% |
| Pan et al. (2022) model 4 | 2.58 | 1.54 | 0.08% |
| Finkelstein & Bagley (2022) | 3.23 | 1.72 | 0.31% |
| Kim & Im (2021) case 1 | 2.50 | 1.55 | 0.06% |
| Kim & Im (2021) case 2 | 3.01 | 1.73 | 0.42% |
| Kim & Im (2021) case 3 | 3.46 | 1.87 | 0.11% |
| Kim et al. (2020) model 1 | 2.71 | 1.65 | 0.28% |
| Kim et al. (2020) model 1b | 2.42 | 1.57 | 0.00% |
| Kim et al. (2020) model 1c | 2.43 | 1.59 | 0.21% |
| Kim et al. (2020) model 2 | 2.89 | 1.73 | 0.14% |
| Kim et al. (2020) model 2b | 2.51 | 1.64 | 0.16% |
| Kim et al. (2020) model 2c | 3.31 | 1.78 | 0.52% |
| Niida et al. (2020) w/ ML fixed | 3.39 | 1.86 | 0.68% |
| Niida et al. (2020) w/ fixed | 2.97 | 1.74 | 0.28% |
| Niida et al. (2020) w/ ML free | 3.53 | 1.82 | 0.74% |
| Kulkarni et al. (2019) model 1 | 2.23 | 1.36 | 0.04% |
| Kulkarni et al. (2019) model 2 | 1.46 | 1.09 | 0.00% |
| Kulkarni et al. (2019) model 3 | 1.33 | 1.00 | 0.00% |
| McGreer et al. (2018) w/ DPL | 1.19 | 1.08 | 0.00% |
| McGreer et al. (2018) w/ paperI | 0.87 | 0.91 | 0.00% |
| Yang et al. (2016) model 1 | 0.74 | 0.85 | 0.00% |
| Yang et al. (2016) model 2 | 0.75 | 0.86 | 0.00% |
| Yang et al. (2016) model 3 | 0.69 | 0.85 | 0.00% |
| Yang et al. (2016) model 4 | 0.80 | 0.88 | 0.00% |
4.4 The photo-ionization rate produced by AGN
A recent estimate of the HI photo-ionization rate produced by AGN has been provided by Boutsia et al. (2021). The crucial ingredient in this analysis is the robust determination of the shape and normalization of the AGN luminosity function in an extended () luminosity range, thanks to the combination of wide surveys (e.g. QUBRICS, Calderone et al., 2019; Boutsia et al., 2020; Guarneri et al., 2021) with deep observations (Fontanot et al., 2007; Glikman et al., 2011; Boutsia et al., 2018; Giallongo et al., 2019). Based on this result, Boutsia et al. (2021) concluded that AGN are able to produce of the HI ionizing photons at , measured through Lyman forest fitting or via Proximity effect, if the escape fraction of 75% measured for bright QSOs (Cristiani et al., 2016; Romano et al., 2019) is a common feature also for fainter sources around and below the knee of the AGN luminosity function (Grazian et al., 2018).
In our previous work (Grazian et al., 2022), we find that the space density of QSOs at is 3 times higher than previous determinations, confirming the recently derived results by Onken et al. (2022) at , by Schindler et al. (2019b, a), and Boutsia et al. (2021) at . In Grazian et al. (2022) we also find that the density evolution of the AGN luminosity function from z=4 to z=5 is milder than previously reported determinations, e.g. from SDSS survey, and that the AGN luminosity function shows the same shape of the one, with a slightly lower normalization, by dex. Recent results by the CEERS survey seem to confirm this picture, indicating that the space density of AGN is relatively high at (Kocevski et al., 2023; Harikane et al., 2023), confirming early determinations by Giallongo et al. (2019) and Grazian et al. (2020). In practice, the QSO luminosity function seems to follow a pure density evolution with a mild rate.
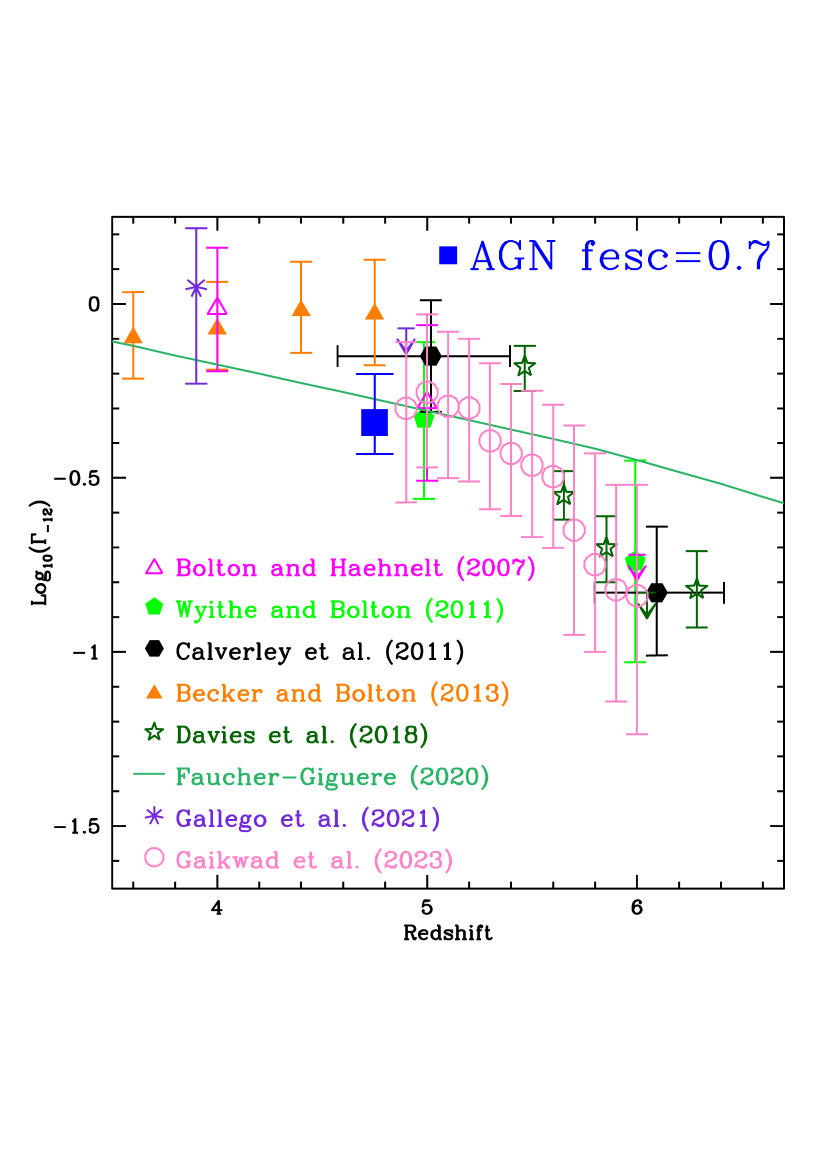
The results of this paper confirm the achievements of Grazian et al. (2022) at slightly fainter luminosities, , close to the knee of the luminosity function, where the space density of QSOs is still 2-3 times higher than previous surveys. We assume here that the mean free path of HI ionizing photons is 17.4 proper Mpc at (Worseck et al., 2014) and that the LyC escape fraction of QSOs is , similar to the one measured at by Cristiani et al. (2016); Grazian et al. (2018); Romano et al. (2019). It is then possible to compute the contribution of QSOs to the HI photo-ionization rate, by integrating the extrapolated luminosity function in the interval . Fig. 7 shows the photo-ionization rate produced by QSOs, according to the luminosity function provided in Grazian et al. (2022), which is consistent with the data found in this work. It turns out that bright QSOs and faint AGN can account for 50-100% of the required photon budget444This uncertainty is due to the factor of 2 scatter in the measurement of the hydrogen photo-ionization rate measured through Lyman forest fitting (Bolton & Haehnelt, 2007; Wyithe & Bolton, 2011; Becker & Bolton, 2013; Davies et al., 2018; Faucher-Giguère, 2020; Gallego et al., 2021; Gaikwad et al., 2023) or with the proximity effect (Calverley et al., 2011), as discussed in Boutsia et al. (2021) and Grazian et al. (2022). to explain the observed ionizing background measured close to the end of the EoR, as also shown by Grazian et al. (2022) and Fontanot et al. (2023). The photo-ionization rate of AGN derived here, is consistent with the recent estimate at of Gaikwad et al. (2023), possibly indicating that bright QSOs and faint AGN together are able to provide of the ionizing background of the IGM. This may suggest that QSOs and AGN can play an important role in the cosmological reionization process of hydrogen.
5 Discussion
5.1 Comparison with recent surveys of QSOs
It is worth asking why recent surveys of bright QSOs, e.g. Niida et al. (2020) or Shin et al. (2022), found a QSO number density which is significantly lower than our values. In order to carry out a fair comparison, we carefully checked the criteria adopted by these two surveys.
Starting from Niida et al. (2020), we have checked that our QSO ID=157404 in the HSC-Udeep survey (see Table 1) is outside their area. The other two QSOs at in our HSC-Udeep survey, instead, are part of the area covered by Niida et al. (2020). The first object, ID=2480, does not satisfy their color criterion, i.e. . Object ID=42780 in Table 1 satisfies all their color criteria and it is plausibly included in the Niida et al. (2020) QSO sample (their parent QSO sample is not publicly available). From this comparison, we can conclude that the QSO luminosity function of Niida et al. (2020) could be 50% incomplete at , and, by applying this correction factor, their QSO space density turns out to be compatible with our results in Fig. 6.
In order to compare our results with Shin et al. (2022), we download the full HSC-Udeep survey from the HSC PDR2 repository. QSO ID=157404 in Table 1 is outside their area, while the other two QSOs, ID=2480 and ID=42780, have been recovered by the PDR2 release. It is difficult to reproduce the selection criteria of Shin et al. (2022), but it is clear that these two objects are missing from their final sample. We can thus conclude that their incompleteness could be substantial at . It is thus not surprising at all that they find a much lower QSO number density than our results in Fig. 6.
The reason why previous surveys found a low number density of QSOs could be due to their incompleteness. Out of the 8 known QSOs at in the HSC-Wide survey (Table 2), only 3 have been discovered by SDSS, while the other QSOs have been found by different surveys. Thus, the total number of QSOs is large in the considered area, but the individual surveys in the past only recovered a small fraction of them, possibly due to their efficient but strict selection criteria, which lost a non-negligible fraction of high-z objects. As an example, if we had adopted only a sub-sample of the color criteria by McGreer et al. (2018), i.e. and , we would have selected 2 out of 3 QSOs at in the HSC-Udeep survey and 6 out of 8 QSOs at in the HSC-Wide area, with a further reduction of 66-75% of the survey completeness. If we apply all the color criteria of McGreer et al. (2018), i.e. , , , , we would have selected 2 out of 3 QSOs at in the HSC-Udeep survey and only 3 out of 8 QSOs at in the HSC-Wide area. In this case, by applying the more stringent color criteria by McGreer et al. (2018), the completeness drops down to a level of 38-66%.
As a general comment, surveys searching for high-z QSOs are usually very efficient, above 50% (e.g., Shin et al., 2022), but their completeness level could be very low, as already pointed out in Grazian et al. (2020); Boutsia et al. (2021) and in this paper. This incompleteness is even more exacerbated in the case of shallow surveys, where the photometric scatter, especially in the bands used for drop-out, could undermine the completeness of the selection criteria adopted. It is thus not surprising at all that in the past there were a number of claims of a low space density of high-z QSOs (e.g. Yang et al., 2016; McGreer et al., 2018; Kulkarni et al., 2019; Niida et al., 2020; Kim et al., 2020; Kim & Im, 2021; Finkelstein & Bagley, 2022; Onken et al., 2022; Jiang et al., 2022; Shin et al., 2022; Pan et al., 2022; Schindler et al., 2023; Matsuoka et al., 2023), that are not supported by the data of this paper. A possible way out to have a high level of the completeness, while still keeping the efficiency of the spectroscopic surveys acceptable, is to adopt selection methods based on machine learning and iterative removing of low probability candidates (Calderone et al. in prep). It will be interesting in the future to apply this method to the entire HSC database.
5.2 Considerations and Implications from the RUBICON survey
A number of considerations can be drawn here from the QSO search we have carried out on the HSC-Udeep and HSC-Wide surveys. The relevant points are:
- 1.
- 2.
-
3.
The spread in the G-R color is due to both redshift evolution and fluctuations of the IGM opacity in different lines of sight. Objects with blue G-R colors () can be at , as shown in Fig. 1. In order to compute the completeness level and the selection function, detailed simulations have been carried out by including the stochasticity of the IGM absorption at these redshifts.
-
4.
The G-R color selection could be biased toward QSOs with low mean free path or negligible escape fraction of Lyman continuum photons. A possible solution to this issue can be to carry out extensive spectroscopic confirmation of candidates that lay close to the border of the color selection region, outside the adopted criteria. The selection of objects with will allow us to quantify the completeness of our color criteria and the effective distribution of the mean free path of ionizing photons. This will be possible thanks to the availability of parallaxes and proper motions of unprecedented quality from GAIA, which allows to clean the catalog from contaminating stars.
- 5.
-
6.
Photometric redshifts are computed at the mean IGM transmission of Inoue et al. (2014). At high redshift, a large scatter of the IGM absorption is expected. Detailed simulations of the IGM variance have been carried out in order to calculate the effective completeness of the RUBICON survey.
The lessons learned from the RUBICON survey is that the number of interlopers is relatively low in the color selection region adopted (provided that relatively deep surveys are available), and the HSC-Wide and HSC-Udeep data are very promising to address the key question of the space density of AGN at . At present, the results shown in Fig. 6 and Table 3 are based only on the spectroscopically confirmed QSO sample. In the future, the spectroscopic confirmation of all the candidates in Table 1 and Table 2 will be important in order to assess the completeness of these surveys.
6 Conclusions
In this paper we present the first results of the RUBICON survey, aimed at constraining the space density of relatively bright QSOs () at , i.e. at the end of the reionization epoch (Eilers et al., 2018; Keating et al., 2020; Bosman et al., 2022; Zhu et al., 2022).
From the ultradeep imaging in the grizY bands covering 34.7 sq. deg. in the HSC-Udeep survey (Aihara et al., 2022), an almost complete sample of three spectroscopically confirmed QSOs at and has been drawn (see Fig. 1 and Table 1). QSO candidates at have been selected through the vs color-color criteria, as shown in Fig. 1. Bona fide stars have been excluded, based on the parallax and proper motion information from GAIA DR3 (Gaia Collaboration et al., 2022). Two promising candidates in HSC-Udeep have , and they can also be at , due to the tendency of our photo-z to underestimate the spectroscopic redshifts of high-z QSOs (see Table 1). The spectroscopic confirmation of these targets is currently on-going.
In order to check the reliability of our results on even larger areas, the HSC-Udeep survey has been complemented by adding 108 sq. deg. of wide and deep imaging in the HSC-Wide area, finding eight spectroscopically confirmed QSOs (two are in common with the HSC-Udeep survey) and five QSO candidates at with redshift (see Fig. 3 and Table 2). Some of these candidates are also expected to be QSOs with , pending spectroscopic confirmation in the future. One of the known QSOs (ID=124850) has been confirmed by spectroscopic observations at Magellan telescope (Las Campanas Observatory) in November 2022, triggered by the RUBICON survey. This QSO has been independently discovered by Yang et al. (2023).
The HSC-Udeep area is divided into four well separated fields (SXDS, COSMOS, DEEP2-3, ELAIS-N1), thus minimizing cosmic variance effects (10%). For comparison, the Poissonian error in the same corresponding area is 30-40%, thus dominating the uncertainty of this survey, due to the expected low numbers of high-z QSOs.
The luminosity function of QSOs (Fig. 6) has been computed as the inverse of the accessible cosmological volume at , summed up for all the spectroscopically confirmed sources in the HSC-Udeep survey. A completeness of 94% has been assumed. The same calculation has been carried out in the HSC-Wide survey, giving comparable results in terms of QSO space density. These QSO luminosity functions are a factor of 2-3 times larger than the one derived by Yang et al. (2016); McGreer et al. (2018); Kulkarni et al. (2019); Niida et al. (2020); Kim et al. (2020); Kim & Im (2021); Finkelstein & Bagley (2022); Onken et al. (2022); Jiang et al. (2022); Shin et al. (2022); Schindler et al. (2023); Harikane et al. (2023); Matsuoka et al. (2023) and model 4 of Pan et al. (2022). The Maximum Likelihood approach summarized in Table 3 confirms the results obtained with the non-parametric luminosity function analysis. We estimated the expected number of QSOs from the published parameterizations of the QSO luminosity functions. We show that all of them, with the relevant exception of Grazian et al. (2022) and models 1, 2, 3 of Pan et al. (2022), predict a too low number of QSOs (and are thus incompatible with our findings at confidence level).
It is clear, from Fig. 6 and from the maximum likelihood analysis in Table 3, that the only viable parameterization of the QSO luminosity function in agreement with the present data is the one of Grazian et al. (2022). This has deep implications for the role of high-z AGN on the HI reionization event. We assume an escape fraction of 70% at all redshifts and luminosities, and we integrate the QSO luminosity function of Grazian et al. (2022) in the interval . Given a mean free path of 17.4 proper Mpc at z=4.75, it turns out that AGN are able to produce 50-100% of the ionizing background at the end of the reionization epoch. In particular, recent claims of a negligible role of AGN in the HI reionization, based on earlier luminosity function estimates (e.g. Yang et al., 2016; McGreer et al., 2018; Kulkarni et al., 2019; Niida et al., 2020; Kim et al., 2020; Kim & Im, 2021; Finkelstein & Bagley, 2022; Onken et al., 2022; Jiang et al., 2022; Shin et al., 2022; Pan et al., 2022; Schindler et al., 2023; Harikane et al., 2023; Matsuoka et al., 2023) are formally excluded at more than 2 level, given our results here on the luminosity function of QSOs.
We have provided here starting evidences in term of QSO number density that AGN can produce a substantial amount of the required ionizing photons to sustain the final phases of the Reionization epoch at . In the future, the RUBICON survey can be extended both in area, within all the HSC-Wide area (1200 sq. deg.), and in depth, thanks to the deep imaging already available in the HSC-Udeep survey (e.g. Desprez et al., 2023). If confirmed by future studies, this will have a strong impact on the study of Reionization and on the sources responsible for this cosmological event.
It is now time to cross the Rubicon of Reionization with QSOs: “Alea Iacta Est” (Caesar, 49 B.C.).
Appendix A The spectral energy distributions of confirmed and candidates QSOs
Examples of the spectral energy distributions for QSO candidates in the HSC-Udeep survey (Fig. 8), confirmed and QSO candidates in the HSC-Wide area (Fig. 9, 10, and 11).
References
- Abdurro’uf et al. (2022) Abdurro’uf, Accetta, K., Aerts, C., et al. 2022, ApJS, 259, 35
- Aihara et al. (2022) Aihara, H., AlSayyad, Y., Ando, M., et al. 2022, PASJ, 74, 247
- Akiyama et al. (2018) Akiyama, M., He, W., Ikeda, H., et al. 2018, PASJ, 70, S34
- Alam et al. (2015) Alam, S., Albareti, F. D., Allende Prieto, C., et al. 2015, ApJS, 219, 12
- Barchiesi et al. (2022) Barchiesi, L., Dessauges-Zavadsky, M., Vignali, C., et al. 2022, arXiv e-prints, arXiv:2212.00038
- Becker & Bolton (2013) Becker, G. D., & Bolton, J. S. 2013, MNRAS, 436, 1023
- Bolton & Haehnelt (2007) Bolton, J. S., & Haehnelt, M. G. 2007, MNRAS, 382, 325
- Bosman et al. (2022) Bosman, S. E. I., Davies, F. B., Becker, G. D., et al. 2022, MNRAS, 514, 55
- Boutsia et al. (2018) Boutsia, K., Grazian, A., Giallongo, E., Fiore, F., & Civano, F. 2018, ApJ, 869, 20
- Boutsia et al. (2020) Boutsia, K., Grazian, A., Calderone, G., et al. 2020, ApJS, 250, 26
- Boutsia et al. (2021) Boutsia, K., Grazian, A., Fontanot, F., et al. 2021, ApJ, 912, 111
- Bouwens et al. (2007) Bouwens, R. J., Illingworth, G. D., Franx, M., & Ford, H. 2007, ApJ, 670, 928
- Bouwens et al. (2003) Bouwens, R. J., Illingworth, G. D., Rosati, P., et al. 2003, ApJ, 595, 589
- Brinchmann (2022) Brinchmann, J. 2022, arXiv e-prints, arXiv:2208.07467
- Calderone et al. (2019) Calderone, G., Boutsia, K., Cristiani, S., et al. 2019, ApJ, 887, 268
- Calverley et al. (2011) Calverley, A. P., Becker, G. D., Haehnelt, M. G., & Bolton, J. S. 2011, MNRAS, 412, 2543
- Choudhury (2022) Choudhury, T. R. 2022, General Relativity and Gravitation, 54, 102
- Cristiani et al. (2016) Cristiani, S., Serrano, L. M., Fontanot, F., Vanzella, E., & Monaco, P. 2016, MNRAS, 462, 2478
- Davies et al. (2018) Davies, F. B., Hennawi, J. F., Bañados, E., et al. 2018, ApJ, 864, 142
- Dayal & Ferrara (2018) Dayal, P., & Ferrara, A. 2018, Phys. Rep., 780, 1
- Desprez et al. (2023) Desprez, G., Picouet, V., Moutard, T., et al. 2023, A&A, 670, A82
- Eilers et al. (2018) Eilers, A.-C., Davies, F. B., & Hennawi, J. F. 2018, ApJ, 864, 53
- Fan et al. (2022) Fan, X., Banados, E., & Simcoe, R. A. 2022, arXiv e-prints, arXiv:2212.06907
- Fan et al. (2006) Fan, X., Carilli, C. L., & Keating, B. 2006, ARA&A, 44, 415
- Faucher-Giguère (2020) Faucher-Giguère, C.-A. 2020, MNRAS, 493, 1614
- Finkelstein & Bagley (2022) Finkelstein, S. L., & Bagley, M. B. 2022, ApJ, 938, 25
- Finkelstein et al. (2019) Finkelstein, S. L., D’Aloisio, A., Paardekooper, J.-P., et al. 2019, ApJ, 879, 36
- Finkelstein et al. (2022) Finkelstein, S. L., Bagley, M. B., Arrabal Haro, P., et al. 2022, ApJ, 940, L55
- Fiore et al. (2023) Fiore, F., Ferrara, A., Bischetti, M., Feruglio, C., & Travascio, A. 2023, ApJ, 943, L27
- Fontanot et al. (2007) Fontanot, F., Cristiani, S., Monaco, P., et al. 2007, A&A, 461, 39
- Fontanot et al. (2023) Fontanot, F., Cristiani, S., Grazian, A., et al. 2023, MNRAS, 520, 740
- Furusawa et al. (2008) Furusawa, H., Kosugi, G., Akiyama, M., et al. 2008, ApJS, 176, 1
- Gaia Collaboration et al. (2022) Gaia Collaboration, Vallenari, A., Brown, A. G. A., et al. 2022, arXiv e-prints, arXiv:2208.00211
- Gaikwad et al. (2023) Gaikwad, P., Haehnelt, M. G., Davies, F. B., et al. 2023, arXiv e-prints, arXiv:2304.02038
- Gallego et al. (2021) Gallego, S. G., Cantalupo, S., Sarpas, S., et al. 2021, MNRAS, 504, 16
- Gehrels (1986) Gehrels, N. 1986, ApJ, 303, 336
- George et al. (2015) George, E. M., Reichardt, C. L., Aird, K. A., et al. 2015, ApJ, 799, 177
- Giallongo et al. (2012) Giallongo, E., Menci, N., Fiore, F., et al. 2012, ApJ, 755, 124
- Giallongo et al. (2015) Giallongo, E., Grazian, A., Fiore, F., et al. 2015, A&A, 578, A83
- Giallongo et al. (2019) —. 2019, ApJ, 884, 19
- Glikman et al. (2011) Glikman, E., Djorgovski, S. G., Stern, D., et al. 2011, ApJ, 728, L26
- Grazian et al. (2018) Grazian, A., Giallongo, E., Boutsia, K., et al. 2018, A&A, 613, A44
- Grazian et al. (2020) Grazian, A., Giallongo, E., Fiore, F., et al. 2020, ApJ, 897, 94
- Grazian et al. (2022) Grazian, A., Giallongo, E., Boutsia, K., et al. 2022, ApJ, 924, 62
- Griggio et al. (2023) Griggio, M., Nardiello, D., & Bedin, L. R. 2023, Astronomische Nachrichten, 344, easna.20230006
- Guarneri et al. (2021) Guarneri, F., Calderone, G., Cristiani, S., et al. 2021, MNRAS, 506, 2471
- Harikane et al. (2023) Harikane, Y., Zhang, Y., Nakajima, K., et al. 2023, arXiv e-prints, arXiv:2303.11946
- Haslbauer et al. (2022) Haslbauer, M., Kroupa, P., Zonoozi, A. H., & Haghi, H. 2022, ApJ, 939, L31
- Hoag et al. (2019) Hoag, A., Bradač, M., Huang, K., et al. 2019, ApJ, 878, 12
- Iani et al. (2022) Iani, E., Caputi, K. I., Rinaldi, P., & Kokorev, V. I. 2022, ApJ, 940, L24
- Ilbert et al. (2006) Ilbert, O., Arnouts, S., McCracken, H. J., et al. 2006, A&A, 457, 841
- Inoue et al. (2014) Inoue, A. K., Shimizu, I., Iwata, I., & Tanaka, M. 2014, MNRAS, 442, 1805
- Jiang et al. (2022) Jiang, L., Ning, Y., Fan, X., et al. 2022, Nature Astronomy, 6, 850
- Jin et al. (2023) Jin, X., Yang, J., Fan, X., et al. 2023, ApJ, 942, 59
- Keating et al. (2020) Keating, L. C., Weinberger, L. H., Kulkarni, G., et al. 2020, MNRAS, 491, 1736
- Keller et al. (2023) Keller, B. W., Munshi, F., Trebitsch, M., & Tremmel, M. 2023, ApJ, 943, L28
- Kim & Im (2021) Kim, Y., & Im, M. 2021, ApJ, 910, L11
- Kim et al. (2020) Kim, Y., Im, M., Jeon, Y., et al. 2020, ApJ, 904, 111
- Kocevski et al. (2023) Kocevski, D. D., Onoue, M., Inayoshi, K., et al. 2023, arXiv e-prints, arXiv:2302.00012
- Kulkarni et al. (2019) Kulkarni, G., Worseck, G., & Hennawi, J. F. 2019, MNRAS, 488, 1035
- Labbé et al. (2023) Labbé, I., van Dokkum, P., Nelson, E., et al. 2023, Nature, 616, 266
- Larson et al. (2023) Larson, R. L., Finkelstein, S. L., Kocevski, D. D., et al. 2023, arXiv e-prints, arXiv:2303.08918
- Le Fèvre et al. (2013) Le Fèvre, O., Cassata, P., Cucciati, O., et al. 2013, A&A, 559, A14
- Lehnert & Bremer (2003) Lehnert, M. D., & Bremer, M. 2003, ApJ, 593, 630
- Maiolino et al. (2023) Maiolino, R., Scholtz, J., Witstok, J., et al. 2023, arXiv e-prints, arXiv:2305.12492
- Matsuoka et al. (2023) Matsuoka, Y., Onoue, M., Iwasawa, K., et al. 2023, arXiv e-prints, arXiv:2305.11225
- McGreer et al. (2018) McGreer, I. D., Fan, X., Jiang, L., & Cai, Z. 2018, AJ, 155, 131
- McGreer et al. (2013) McGreer, I. D., Jiang, L., Fan, X., et al. 2013, ApJ, 768, 105
- Meiksin (2009) Meiksin, A. A. 2009, Reviews of Modern Physics, 81, 1405
- Mitra et al. (2018) Mitra, S., Choudhury, T. R., & Ferrara, A. 2018, MNRAS, 473, 1416
- Naidu et al. (2020) Naidu, R. P., Tacchella, S., Mason, C. A., et al. 2020, ApJ, 892, 109
- Niida et al. (2020) Niida, M., Nagao, T., Ikeda, H., et al. 2020, ApJ, 904, 89
- Onken et al. (2022) Onken, C. A., Wolf, C., Bian, F., et al. 2022, MNRAS, 511, 572
- Ono et al. (2022) Ono, Y., Harikane, Y., Ouchi, M., et al. 2022, arXiv e-prints, arXiv:2208.13582
- Onoue et al. (2023) Onoue, M., Inayoshi, K., Ding, X., et al. 2023, ApJ, 942, L17
- Pan et al. (2022) Pan, Z., Jiang, L., Fan, X., Wu, J., & Yang, J. 2022, ApJ, 928, 172
- Pâris et al. (2014) Pâris, I., Petitjean, P., Aubourg, É., et al. 2014, A&A, 563, A54
- Parsa et al. (2018) Parsa, S., Dunlop, J. S., & McLure, R. J. 2018, MNRAS, 474, 2904
- Planck Collaboration et al. (2020) Planck Collaboration, Aghanim, N., Akrami, Y., et al. 2020, A&A, 641, A6
- Reichardt et al. (2021) Reichardt, C. L., Patil, S., Ade, P. A. R., et al. 2021, ApJ, 908, 199
- Robertson et al. (2023) Robertson, B. E., Tacchella, S., Johnson, B. D., et al. 2023, Nature Astronomy, 7, 611
- Rodighiero et al. (2023) Rodighiero, G., Bisigello, L., Iani, E., et al. 2023, MNRAS, 518, L19
- Romano et al. (2019) Romano, M., Grazian, A., Giallongo, E., et al. 2019, A&A, 632, A45
- Schindler et al. (2019a) Schindler, J.-T., Fan, X., Huang, Y.-H., et al. 2019a, ApJS, 243, 5
- Schindler et al. (2019b) Schindler, J.-T., Fan, X., McGreer, I. D., et al. 2019b, ApJ, 871, 258
- Schindler et al. (2023) Schindler, J.-T., Bañados, E., Connor, T., et al. 2023, ApJ, 943, 67
- Shin et al. (2022) Shin, S., Im, M., & Kim, Y. 2022, ApJ, 937, 32
- Shin et al. (2020) Shin, S., Im, M., Kim, Y., et al. 2020, ApJ, 893, 45
- Spergel et al. (2003) Spergel, D. N., Verde, L., Peiris, H. V., et al. 2003, ApJS, 148, 175
- Trebitsch et al. (2021) Trebitsch, M., Dubois, Y., Volonteri, M., et al. 2021, A&A, 653, A154
- Trenti & Stiavelli (2008) Trenti, M., & Stiavelli, M. 2008, ApJ, 676, 767
- Trinca et al. (2023) Trinca, A., Schneider, R., Maiolino, R., et al. 2023, MNRAS, 519, 4753
- Trinca et al. (2022) Trinca, A., Schneider, R., Valiante, R., et al. 2022, MNRAS, 511, 616
- Trump et al. (2023) Trump, J. R., Arrabal Haro, P., Simons, R. C., et al. 2023, ApJ, 945, 35
- Übler et al. (2023) Übler, H., Maiolino, R., Curtis-Lake, E., et al. 2023, arXiv e-prints, arXiv:2302.06647
- Wang et al. (2016) Wang, F., Wu, X.-B., Fan, X., et al. 2016, ApJ, 819, 24
- Wang et al. (2022) Wang, X., Cheng, C., Ge, J., et al. 2022, arXiv e-prints, arXiv:2212.04476
- Wolf et al. (2018) Wolf, C., Onken, C. A., Luvaul, L. C., et al. 2018, PASA, 35, e010
- Worseck et al. (2014) Worseck, G., Prochaska, J. X., O’Meara, J. M., et al. 2014, MNRAS, 445, 1745
- Wyithe & Bolton (2011) Wyithe, J. S. B., & Bolton, J. S. 2011, MNRAS, 412, 1926
- Yan et al. (2023) Yan, H., Ma, Z., Ling, C., Cheng, C., & Huang, J.-S. 2023, ApJ, 942, L9
- Yang et al. (2016) Yang, J., Wang, F., Wu, X.-B., et al. 2016, ApJ, 829, 33
- Yang et al. (2023) Yang, J., Fan, X., Gupta, A., et al. 2023, arXiv e-prints, arXiv:2302.01777
- Zhu et al. (2022) Zhu, Y., Becker, G. D., Bosman, S. E. I., et al. 2022, ApJ, 932, 76