Practical Commercial 5G Standalone (SA) Uplink Throughput Prediction
Abstract
While the 5G New Radio (NR) network promises a huge uplift of the uplink throughput, the improvement can only be seen when the User Equipment (UE) is connected to the high-frequency millimeter wave (mmWave) band. With the rise of uplink-intensive smartphone applications such as the real-time transmission of UHD 4K/8K videos, and Virtual Reality (VR)/Augmented Reality (AR) contents, uplink throughput prediction plays a huge role in maximizing the users’ quality of experience (QoE). In this paper, we propose using a ConvLSTM-based neural network to predict the future uplink throughput based on past uplink throughput and RF parameters. The network is trained using the data from real-world drive tests on commercial 5G SA networks while riding commuter trains, which accounted for various frequency bands, handover, and blind spots. To make sure our model can be practically implemented, we then limited our model to only use the information available via Android API, then evaluate our model using the data from both commuter trains and other methods of transportation. The results show that our model reaches an average prediction accuracy of 98.9% with an average RMSE of 1.80 Mbps across all unseen evaluation scenarios.
Index Terms:
5G Standalone, Throughput Prediction, ConvLSTM, Radio Access Network, Wireless CommunicationI Introduction
In the early smartphone era, most of the applications focus on the consumption of content over the mobile network, which results in the overall traffic being downlink (DL) heavy. However, recently, smartphone usage pattern has changed massively with the rise of social media platforms, where users are encouraged to create and share their own content in real-time. This drives the demand for high uplink (UL) throughput to support the creation of high bandwidth content such as UHD 4K/8K video, Virtual Reality (VR), and Augmented Reality (AR) content. The introduction of the 5G New Radio (NR) network brings a huge uplift in uplink throughput over the legacy 4G Long-Term Evolution (LTE) network, with the promised target peak uplink throughput of 10 Gbps [1], which should be sufficient for any multimedia application for many years to come. However, that kind of throughput is highly experimental and only achievable in the laboratory with a controlled environment. One of the latest 5G RF Modem to be announced was the Qualcomm Snapdragon X75, which will be used by smartphone manufacturers from late-2023 onward, only supports the peak uplink throughput of 3.5 Gbps [2]. The latest showcase by Advanced Info Service (AIS), the Thailand’s largest Mobile Network Operator (MNO), and ZTE, one of the largest Radio Access Network (RAN) manufacturers, yields a peak uplink speed of 2.12 Gbps [3] when using the high frequency 5G millimeter-wave (mmWave) band and the experimental setting with DL to UL ratio of 1:3 and the total channel bandwidth of 400 MHz. Realistically, all MNO in Thailand and Japan configured their 5G mmWave network with a 3:1 DL to UL ratio, which yields a theoretical peak maximum speed of 1.0 Gbps when using the total channel bandwidth of 400 MHz.
As a part of preliminary research of this work, the authors conducted the experiment on a commercial 5G mmWave network, the result shows that the typical uplink throughput achievable in real-world settings is around 400-650 Mbps when the UE is directly pointed at the mmWave base station. However, with extremely limited coverage of 5G mmWave and the substantial cost added to the manufacturing of mmWave-capable smartphones, not many MNO around the world deploy 5G service on this frequency band yet, and all of the MNOs that deploy 5G mmWave only do so in high-density neighborhoods in urban areas. Most of the 5G coverage is achievable by using the middle and low-frequency band with limited channel bandwidth, which resulted in limited throughput. The recent study [4] shows that while the theoretical maximum uplink throughput on the middle frequency band can be as high as 285.72 Mbps when using high-end UE with UL-2Tx capability on 100 MHz-width channel and the most common Time Division Duplexing (TDD) Timing with DL to UL ratio of 7:2, the average real-world throughput can be as low as 9.86 Mbps, with further degradation observed when using the typical UE with a single transmission antenna.
While there are many efforts to predict mobile network throughput in the past, most of the approaches are not fully optimal for commercial 5G SA environment or has some impracticality for real-world implementation. Mainly there are two main approaches to tackle this problem; application layer approach, where packet loss and delay are used for the prediction [5][6][7], and physical layer approach, where RF and low-level parameters are used for the prediction. Some examples of the physical layer approaches are [8][9][10], where the neural network had been used to accurately predict the uplink throughput. However, many of the parameters such as Resource Block Allocation (RB) and Transmission Power (Tx Power) can’t be accessed without modifying the smartphone and installing specialized software, which renders them impractical. Furthermore, frequency bands and duplex schemes are not taken into account. In the 5G SA network, both legacy spectrum from LTE networks [11] and newly allocated spectrum are being used for 5G services. Therefore, both duplex schemes; FDD and TDD; are being utilized. Additionally, frequency bands play a huge role due to the difference in path loss, which increased significantly on the high-frequency bands, as 5G uplink may take place anywhere from 600 MHz to 4.9 GHz in the Frequency Range 1 [12]. Lastly, the introduction of Massive MIMO Active Antenna Unit (AAU) resulted in a mixed deployment between legacy Remote Radio Unit (RRU) + Passive Antenna and AAU. Massive MIMO AAU may contain up to 128 antenna elements compared to the maximum of eight in the legacy combination, which yields a huge improvement of beamforming performance resulting in a significantly difference in uplink performance [13], especially in challenging conditions.
Since 5G uplink performance has a critical effect on users’ QoE as well as the operable of mission-critical Internet-of-Things (IoT) devices such as self-driving vehicles and industrial automation, there is a need to accurately predict the available throughput, especially when the UE is entering the area with low signal quality, so that link adaptation can be performed appropriately and maintain a reliable connection while offering good QoE given the channel quality. In this paper, we propose a ConvLSTM-based network to accurately predict the uplink throughput on a commercial 5G SA network using the data available via Android API. The model will be trained using real-world data from riding a commuter train in Tokyo, Japan, then it will be evaluated using data with various mobility behavior including walking, driving, tram, metro, and commuter train from the same area. This paper is organized as follows: Section II will discuss the background of this study. Section III will provide experiment results as well as an analysis of the results. Finally, the conclusion and future work will be discussed in Section IV.
II Background
II-A Network Configuration and Data Collection
For the UE, Samsung Galaxy S22 Ultra 5G (SC-52C) with Qualcomm Snapdragon X65 5G RF Modem [14] was used. Due to the rarity of UL-2Tx-capable UE [4], the UL-1Tx UE was chosen. By using Network Signal Guru (NSG), a professional mobile network drive test software, the UECapabilityInformation packet was obtained and verified that the UE is compatible with all frequency bands that are being used in Japan. According to the 3GPP standard [12], due to high path loss at a higher frequency, particularly above 2.5 GHz, High Power UE (HPUE) with Power Class 2 capability may increase its uplink power on some frequency band to the maximum of 26 dBm instead of 23 dBm. This functionality was verified to be enabled on the smartphone prior to the data collection, which allows the UE to transmit up to 26 dBm on the eligible band. At the time of the study, both the UE nor the network didn’t support 5G Uplink Carrier-Aggregation (UL-CA), so prediction with UL-CA enabled was not carried out, though once available, this will be re-visited in future work. Due to the coverage of the 5G SA network, only SoftBank has a meaningful coverage that allows the data collection to be possible, so it was used as the network provider throughout this research. SoftBank has 5G services on four of their frequency spectrum, the summary of the theoretical maximum uplink throughput for each of the frequency spectrum was calculated according to 3GPP TS 38.306 standard [15] assuming UE doesn’t support UL-2Tx and can be seen in Table I.
| Frequency | Band | B/W | Duplex | Max Thpt (Mbps) |
|---|---|---|---|---|
| 700 MHz | n28 | 10 MHz | FDD | 59.72 |
| 1800 MHz | n3 | 15 MHz | FDD | 90.43 |
| 3400 MHz | n77 | 40 MHz | TDD | 55.47 |
| 3900 MHz | n77 | 100 MHz | TDD | 142.86 |
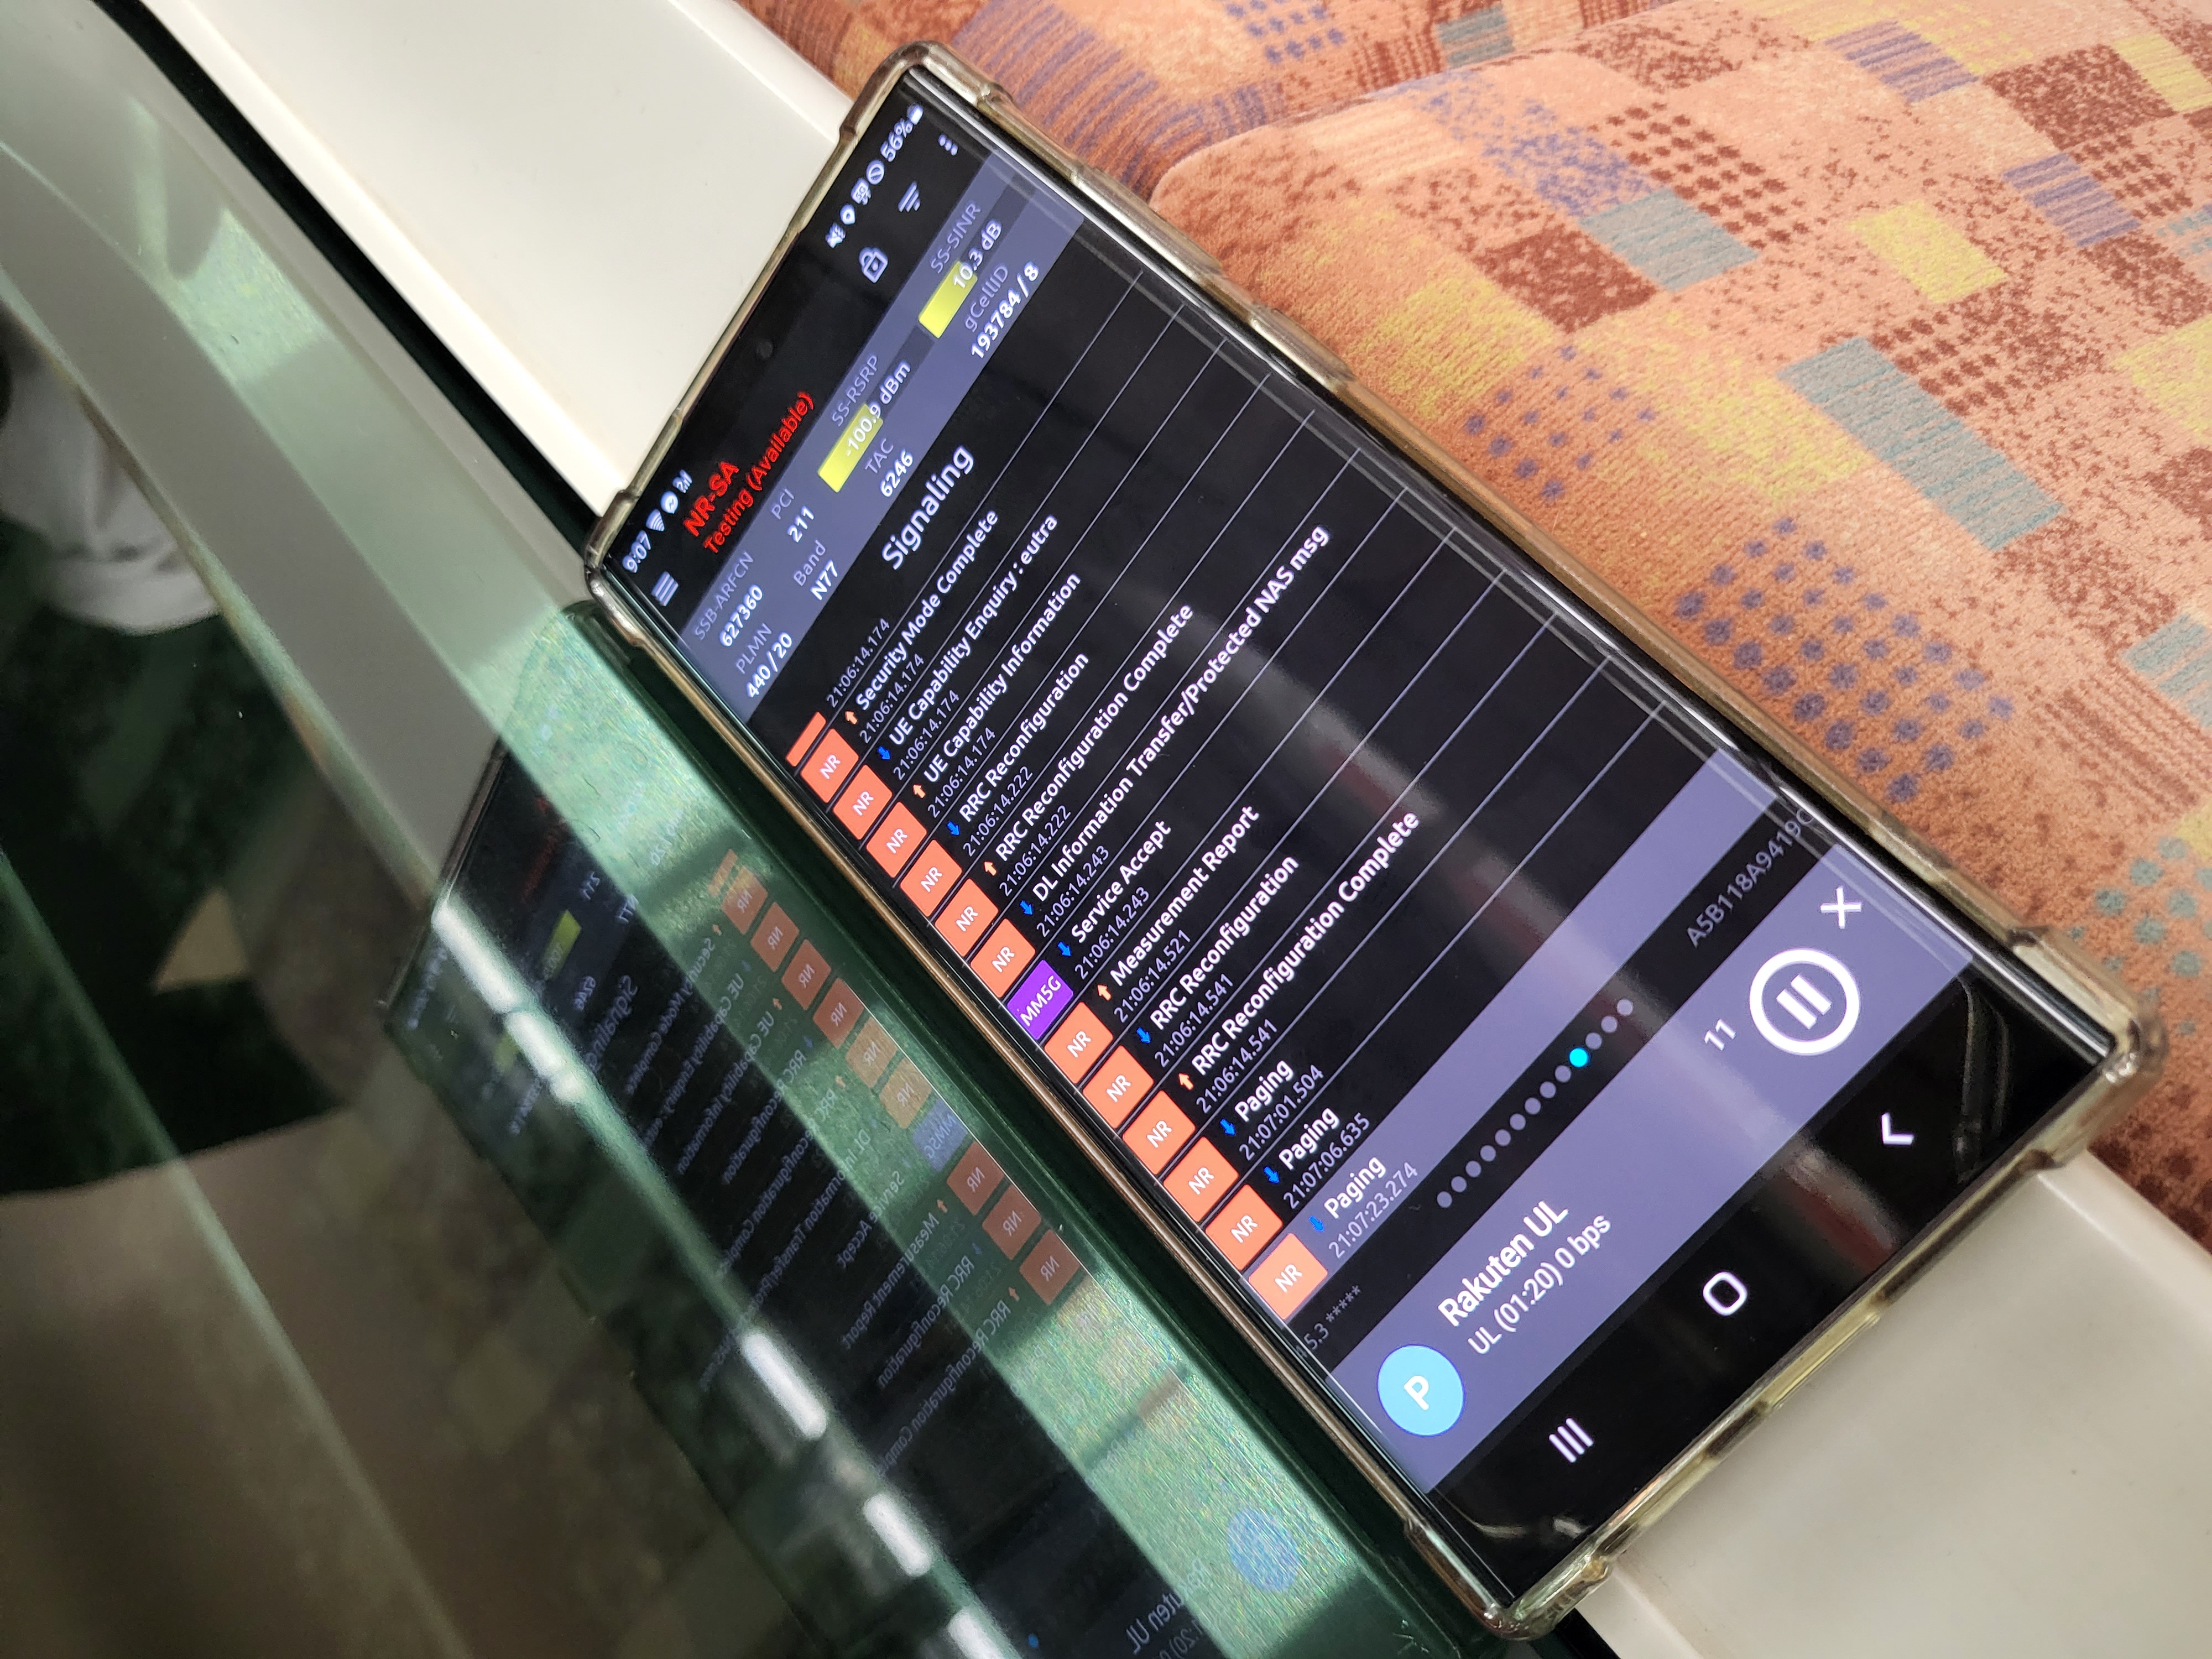
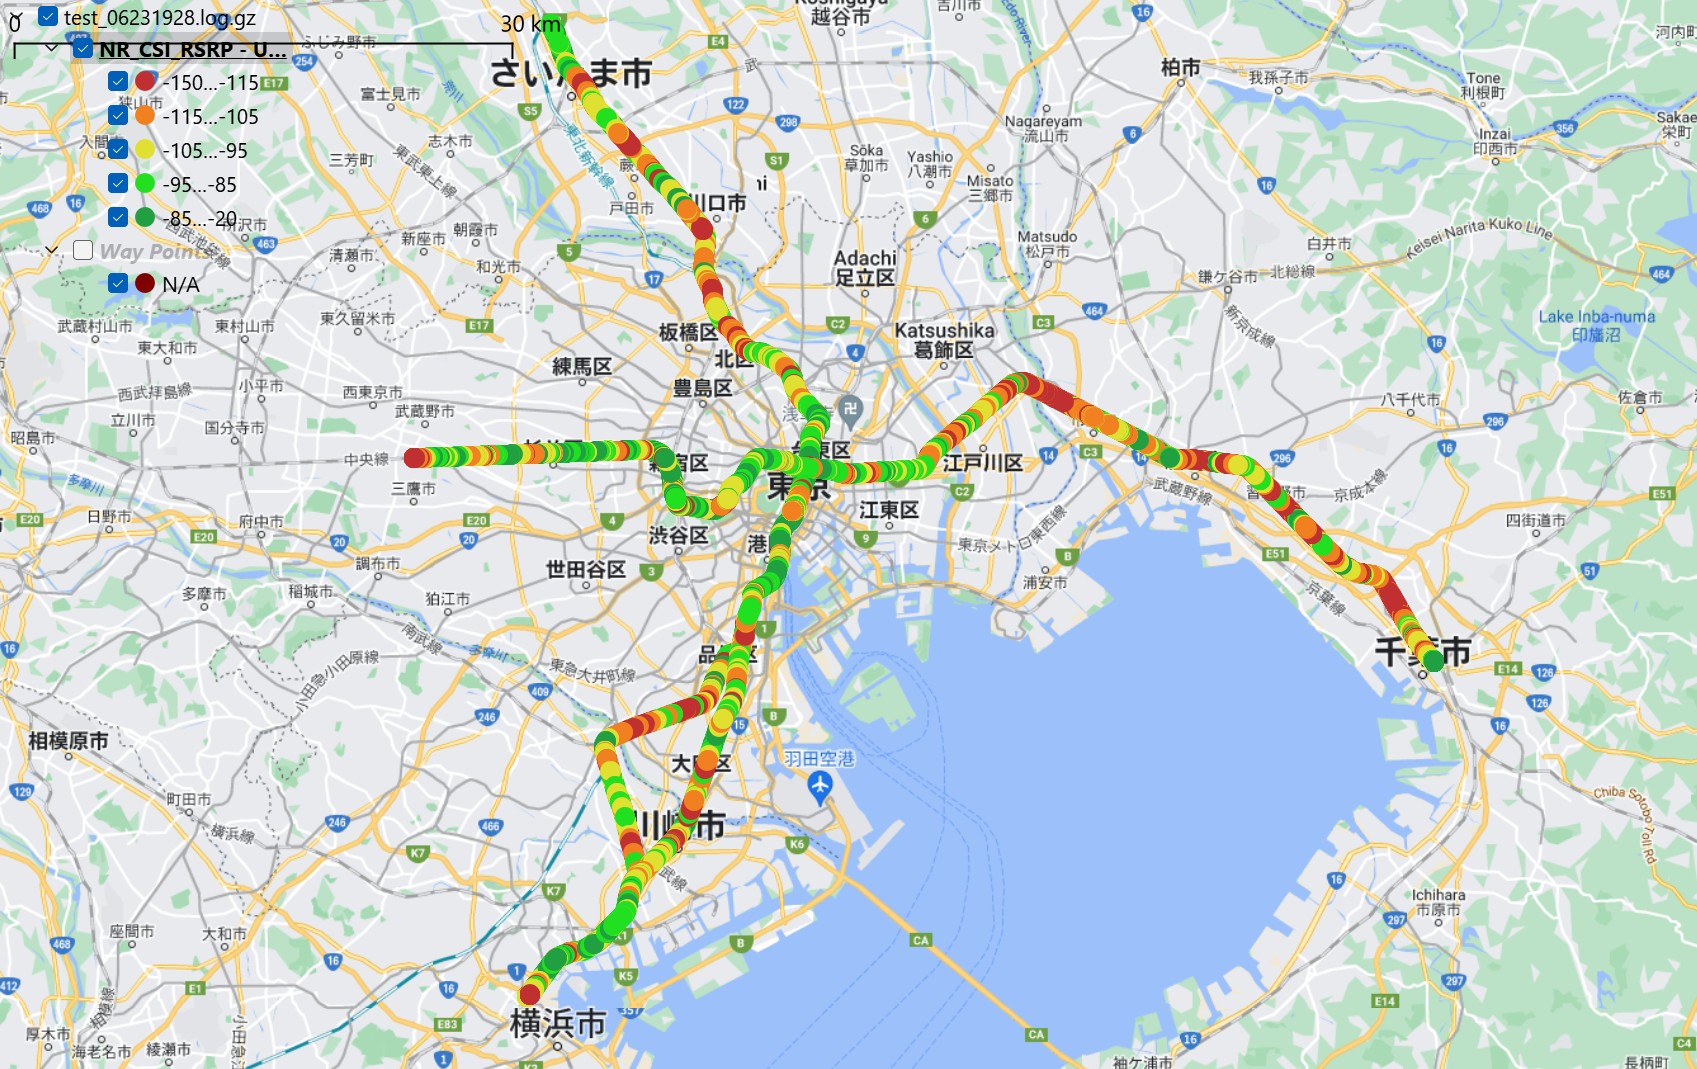
By using the NSG test function, the upload stress test was conducted by continuously transmitting the data via HTTP POST protocol to the server. All of the RF parameters were saved to log files. Additionally, the GPS location and speed were also recorded for reference purposes. When applicable, the UE is placed on the side of the vehicle’s window (as seen in Fig. 1) to ensure the best signal reception and to eliminate the variable caused by the way the smartphone is being held. Training data consisted of 17 traces on commuter trains of six operators across four prefectures of Japan with each trace being collected at different times of the day. Furthermore, the mix of local, rapid, express, and limited express trains was used to collect the data to cover various mobility speeds. Due to SoftBank’s network configuration, UE is usually automatically attached to frequency band n3, so the modem was modified to have band n3 and n28 disable for some of the traces. Overall, more than 12 hours of training data were collected. The testing data was collected using the same procedure. The summary of both training and testing data can be seen in Table II and Table III. The map can also be seen in Fig. 2.
| Line | Time | Departure | Arrival | Avg. | Avg. | Avg. | Avg. | Total | Total Data | Avg. | Frequency Band Percentage |
|---|---|---|---|---|---|---|---|---|---|---|---|
| Speed | RSRP | RSRQ | SINR | Data | Transmitted | Thput. | (0.7G/1.8G/3.4G/3.9G) (%) | ||||
| (km/h) | (dBm) | (dBm) | (dB) | Point | (MB) | (Mbps) | |||||
| JR Chuo Line (Rapid) | 23:02 | Tokyo | Nakano | 36.67 | -89.91 | -15.28 | 16.62 | 1407 | 2959.0 | 16.82 | 0.00 / 0.00 / 100.00 / 0.00 |
| JR Chuo-Sobu Line | 17:51 | Nakano | Chiba | 36.85 | -99.45 | -15.96 | 11.72 | 5715 | 6582.3 | 9.21 | 0.00 / 0.00 / 100.00 / 0.00 |
| JR Keihin-Tohoku Line | 21:41 | Yokohama | Tokyo | 63.00 | -97.24 | -15.66 | 12.37 | 1536 | 2644.3 | 13.77 | 0.00 / 0.00 / 100.00 / 0.00 |
| JR Sobu Line (Rapid) | 19:39 | Chiba | Tokyo | 61.42 | -103.52 | -16.18 | 9.74 | 2006 | 1855.6 | 7.40 | 0.00 / 0.00 / 100.00 / 0.00 |
| JR Ueno-Tokyo Line | 20:47 | Tokyo | Saitama-Shintoshin | 54.87 | -97.66 | -16.01 | 9.59 | 1815 | 2517.8 | 11.10 | 0.00 / 0.00 / 100.00 / 0.00 |
| JR Ueno-Tokyo Line | 21:20 | Saitama-Shintoshin | Yokohama | 56.74 | -97.88 | -15.86 | 11.28 | 3602 | 5691.5 | 12.64 | 0.00 / 0.00 / 100.00 / 0.00 |
| JR Yamanote Line | 22:55 | Shinjuku | Shinjuku | 30.49 | -94.39 | -15.85 | 20.40 | 4089 | 6172.7 | 12.08 | 0.00 / 0.00 / 88.70 / 11.30 |
| Keikyu Main Line | 20:56 | Kurihama | Shinagawa | 52.57 | -87.31 | -14.45 | 14.86 | 3662 | 9023.1 | 19.71 | 11.31 / 49.62 / 24.58 / 14.50 |
| Keikyu Main Line | 19:48 | Shinagawa | Kurihama | 50.61 | -86.26 | -14.44 | 12.71 | 3603 | 5241.1 | 11.64 | 10.21 / 58.81 / 27.48 / 3.50 |
| Keisei SkyAccess Line | 18:09 | Narita | Aoto | 58.20 | -98.77 | -14.95 | 9.50 | 3022 | 2712.6 | 7.18 | 49.54 / 30.08 / 19.03 / 1.36 |
| Seibu Ikebukuro Line | 12:20 | Wakoshi | Kotesashi | 58.48 | -104.14 | -16.35 | 7.36 | 1298 | 1037.5 | 6.39 | 100.00 / 0.00 / 0.00 / 0.00 |
| Seibu Ikebukuro Line | 12:20 | Kotesashi | Wakoshi | 51.30 | -88.62 | -14.54 | 9.83 | 1636 | 2467.9 | 12.07 | 21.52 / 49.27 / 19.01 / 10.21 |
| Tobu Tojo Line | 16:36 | Wakoshi | Shinrin Koen | 55.58 | -80.36 | -13.56 | 10.25 | 2493 | 4379.4 | 14.05 | 14.00 / 69.31 / 7.82 / 8.86 |
| Tobu Tojo Line | 17:31 | Shinrin Koen | Ikebukuro | 65.36 | -83.90 | -14.31 | 9.45 | 2736 | 3364.0 | 9.84 | 18.35 / 69.15 / 11.66 / 0.84 |
| Tokyu Toyoko Line | 15:44 | Yokohama | Shibuya | 52.49 | -89.05 | -14.80 | 13.01 | 1348 | 2181.1 | 12.94 | 2.97 / 49.41 / 44.07 / 3.56 |
| Tokyu Toyoko Line | 13:12 | Shibuya | Yokohama | 54.14 | -81.35 | -14.48 | 11.41 | 1356 | 3770.1 | 22.24 | 27.06 / 28.69 / 35.10 / 9.14 |
| Tokyu Toyoko Line | 17:56 | Shibuya | Yokohama | 51.63 | -96.19 | -15.64 | 13.29 | 1418 | 1888.5 | 10.65 | 0.00 / 0.00 / 100.00 / 0.00 |
| Total / Average | 50.45 | -92.96 | -15.21 | 12.36 | 42742 | 64488.8 | 12.07 | 12.14 / 24.16 / 59.63 / 4.08 |
| Line | Time | Departure | Arrival | Avg. | Avg. | Avg. | Avg. | Total | Total Data | Avg. | Frequency Band Percentage |
|---|---|---|---|---|---|---|---|---|---|---|---|
| Speed | RSRP | RSRQ | SINR | Data | Transmitted | Thput. | (0.7G/1.8G/3.4G/3.9G) (%) | ||||
| (km/h) | (dBm) | (dBm) | (dB) | Point | (MB) | (Mbps) | |||||
| Keisei SkyAccess Line | 16:37 | Aoto | Narita | 55.38 | -96.92 | -15.60 | 6.88 | 3361 | 2862.8 | 6.81 | 74.80 / 20.29 / 4.91 / 0.00 |
| JR Chuo Line (Rapid) | 18:15 | Tokyo | Otsuki | 48.04 | -90.61 | -14.37 | 11.51 | 5087 | 8755.7 | 13.77 | 16.83 / 37.88 / 34.20 / 11.09 |
| JR Chuo Line (Rapid) | 20:56 | Takao | Nakano | 48.05 | -93.94 | -14.69 | 10.24 | 2694 | 4084.5 | 12.13 | 19.12 / 31.66 / 39.31 / 9.91 |
| JR Musashino Line (n3 only) | 17:36 | Nishi-Funabashi | Nishi-Kokubunji | 53.28 | -95.61 | -17.32 | 7.59 | 3857 | 3738.1 | 7.75 | 0.00 / 100.00 / 0.00 / 0.00 |
| JR Musashino Line (n28 only) | 13:15 | Nishi-Kokubunji | Nishi-Funabashi | 53.94 | -97.64 | -17.02 | 5.35 | 3954 | 7846.7 | 15.88 | 100.00 / 0.00 / 0.00 / 0.00 |
| Drive | 19:47 | Nishi-Waseda | Shin-Okubo | 19.05 | -80.09 | -13.57 | 16.83 | 484 | 1264.3 | 20.90 | 0.00 / 75.00 / 25.00 / 0.00 |
| Drive | 20:51 | Shin-Okubo | Nishi-Waseda | 13.94 | -90.55 | -15.17 | 15.13 | 726 | 1326.6 | 14.62 | 4.68 / 71.21 / 24.10 / 0.00 |
| Tokyo Sakura Tram | 18:05 | Waseda | Minowabashi | 12.06 | -81.27 | -13.97 | 14.52 | 3572 | 11091.1 | 24.84 | 8.87 / 66.94 / 20.32 / 3.86 |
| Yurikamome (Metro) | 19:53 | Shimbashi | Toyosu | 27.69 | -81.47 | -15.66 | 9.58 | 1727 | 6047.1 | 28.01 | 28.84 / 45.80 / 8.05 / 17.31 |
| Yurikamome (Metro) | 20:23 | Toyosu | Shimbashi | 24.41 | -75.71 | -14.79 | 10.01 | 2166 | 8994.6 | 33.22 | 14.17 / 63.71 / 9.19 / 12.93 |
| Walking | 21:08 | Shiodome | Shimbashi | 3.29 | -82.29 | -15.27 | 14.48 | 1590 | 7783.6 | 39.16 | 44.78 / 22.83 / 2.20 / 30.19 |
II-B Neural Networks
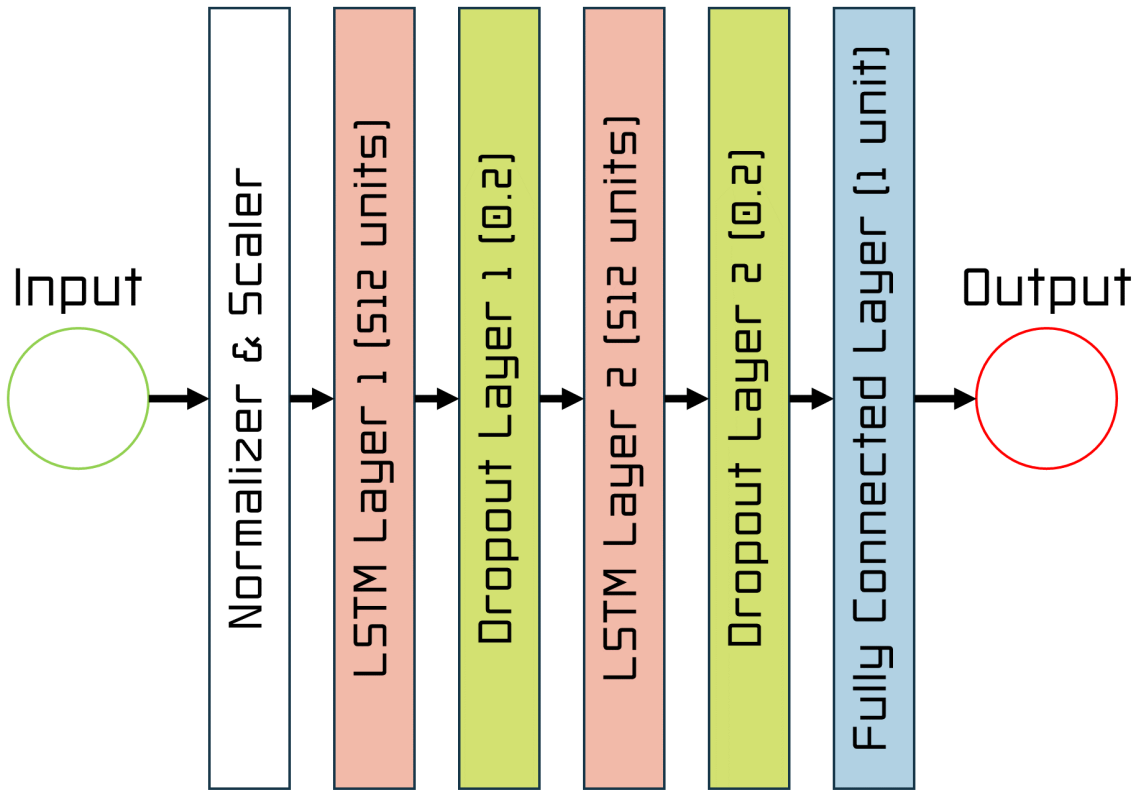
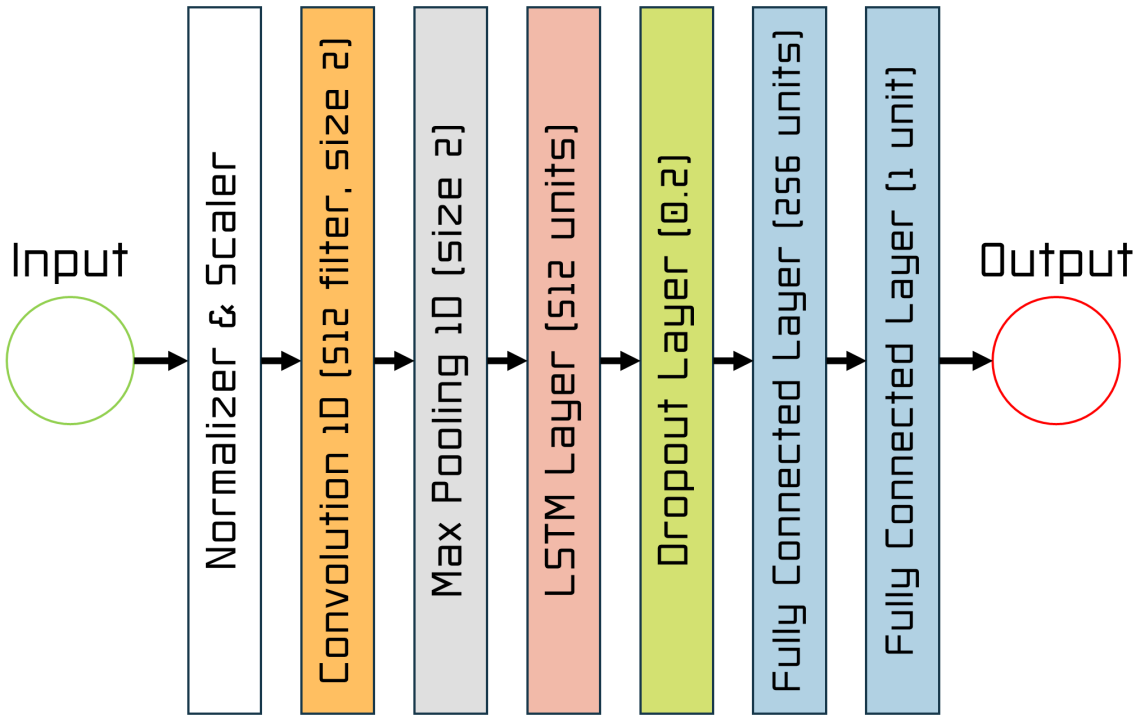
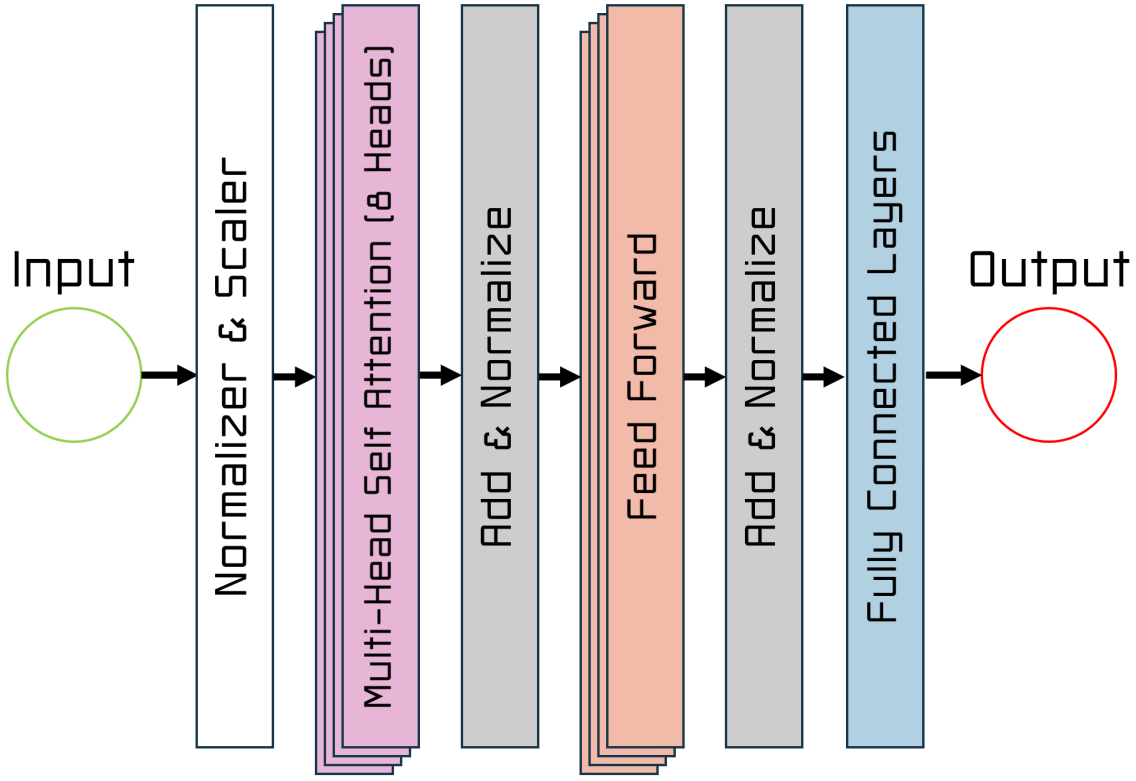
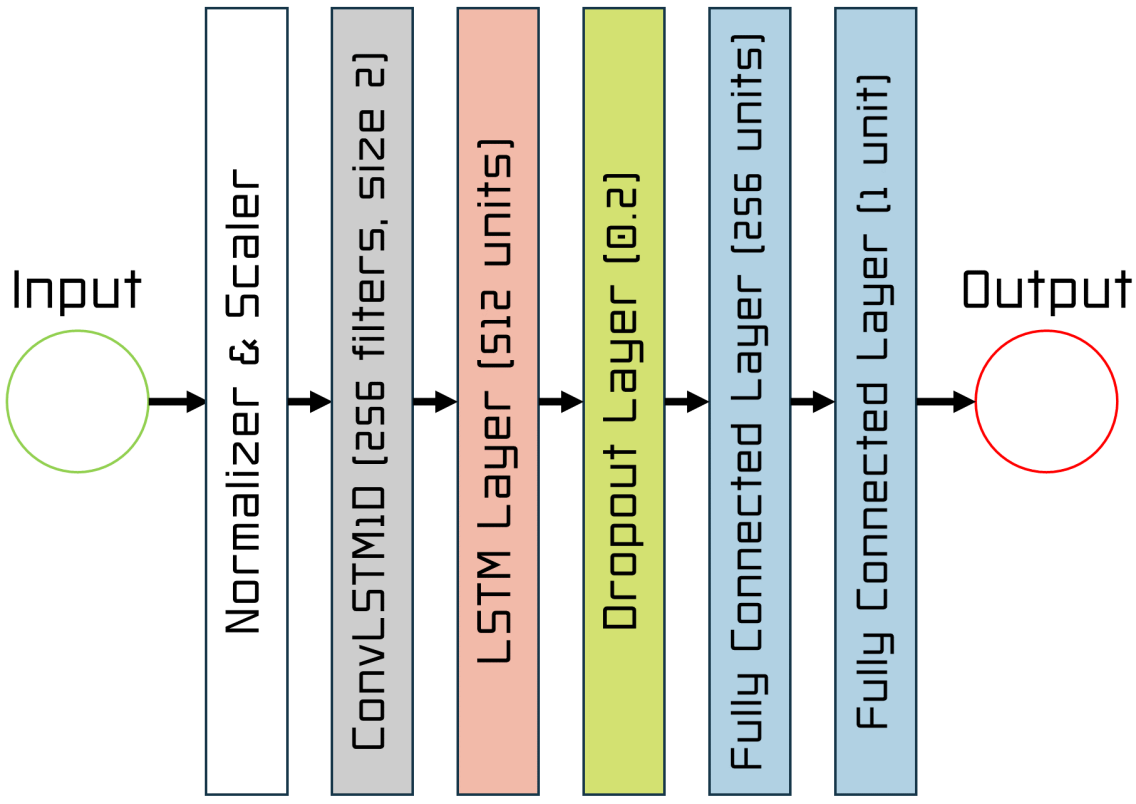
ConvLSTM-based [16] network was implemented as it is known to learn spatio-temporal relationship better than the conventional LSTM and CNN-LSTM. As many of the 5G parameters are related to each other and also the parameter may change over time due to varying cell load and mobility of the UE, using ConvLSTM will effectively exploit these relationships. For comparison, the conventional LSTM, modified from [8], and CNN-LSTM are also implemented. Aside from the LSTM-based network, one of the recent works [10] has implemented a Transformer-based (Self-Attention) [17] neural network and shown good performance on South Korea’s commercial 5G Non-Standalone (NSA) networks. Therefore, a similar Transformer-based network was also implemented for comparison. To allow for a fair comparison, the model and feed-forward dimension had been increased to 256 and 512, respectively. The structure of LSTM, CNN-LSTM, Transformer, as well as our proposed ConvLSTM network can be seen in Fig. 4(a), 4(b), 4(c), and 4(d), respectively.
As for the prediction time window, a preliminary study was conducted. With the data sample interval of one point per second, it was found that a time window of five seconds yield the best result. This is likely due to shorter time window doesn’t give the neural network enough context to accurately predicted the throughput, while the longer time window may cause the network to bias toward an incorrect trend caused by fluctuating input data. The optimal number of epochs was found for each type of model, so ConvLSTM, LSTM, CNN-LSTM, and transformer were trained for 10, 125, 100, and 150 epochs, respectively, and a batch size of 32 was used. All fully connected layers in every LSTM network utilized the ReLU activation function, whereas GELU was used in the Transformer network to match the implementation in the earlier work. Finally, the Adam optimizer was used for training of all networks.
II-C Input Parameters
While data of all RF parameters with high sampling intervals from the modem chipset are available when using the professional network drive test tools on a modified smartphone, application developers rely on Android API to get information about the RF conditions, which only outputs limited data with very limited update intervals. Even though the correlation has been found between low-level RF parameters such as Tx Power, Resource Block (RB), and uplink throughput [4][8][10][18], these information are not available to typical users. Since the real-world implementation is highly desirable, the data was collected with the sample interval of one second per data point to match the update interval of signal parameters via Android API, and only the parameters that are available via the API; CSI-RSRP, CSI-RSRQ, CSI-SINR, SSB ARFCN (Frequency), and past throughput were used. Despite lacking information about the cell load information, which can easily be derived from RB allocation, the study shows that RSRQ contains the information about the cell load and may be used to predict such information [19]. To keep the data collection simple, the data was collected using NSG, and not directly from Android API, but since this set of parameters matches the output information of the API, it will now be referred to as Android API Data.
To evaluate how much each model’s performance degrades compared to the case when all of the parameters are available, each model will also be evaluated with full RF parameters including; CSI-RSRP, CSI-RSRQ, CSI-SINR, Resource Block Allocation (RB), Schedule Count, SSB-ARFCN (Frequency), PUCCH Tx Power, Channel Bandwidth, and past throughput. This set of parameters will now be referred to as Full Data.
Lastly, to match the parameters used in [10], the model will also be tested using the same parameters in the study with two changes. First, there is no LTE information when UE is connected directly to the 5G SA network, so no LTE-related information will be provided to the network. Secondly, transport block size (TBS) was replaced with the throughput directly to match the other test cases. This resulted in four parameters being utilized; CSI-RSRP, Resource Block Allocation (RB), PUCCH Tx Power, and past throughput; and will now be referred to as SURE Data.
II-D Evaluation Metrics
Two metrics, RMSE and MAPE, will be used to evaluate the prediction accuracy of the models. While Root Mean Square Error (RMSE) can be used to paint the picture of instantaneous throughput prediction accuracy directly, applying mean absolute percentage error (MAPE) to the predicted throughput data directly will be problematic as 5G uplink throughput often hits zero during handover in the area with weak signal due to failure of RACH procedure. Therefore, MAPE is applied to the sum of the data being transferred instead. Finally, all of the prediction output data points with negative values will be normalized to zero as it’s impossible to have a negative throughput.
II-E Evaluation Data
As seen in Table III, 11 traces will be used for model performance evaluation. Even though five of the traces are from commuter trains, each of them has a different purpose. The data from Keisei SkyAccess Line is from the same route as one of the training data, while another two traces on JR Chuo Line (Rapid) are from different sections of the line compared to the training data. By comparing these data, the performance of the model on seen and unseen data can be observed. Furthermore, two traces on JR Musashino Line are collected with the UE locked to a specific frequency band to simulate low-end UE or UE belonging to visiting tourists, which may not support all of the 5G frequency bands. Due to 5G SA being unavailable in the Japanese subway, the data from an elevated metro line was used for the evaluation. To keep the evaluation simple, the weighted average will be applied to some of the testing data with similar characteristics.
III Results and Analysis
III-A Instantaneous Throughput Prediction Accuracy
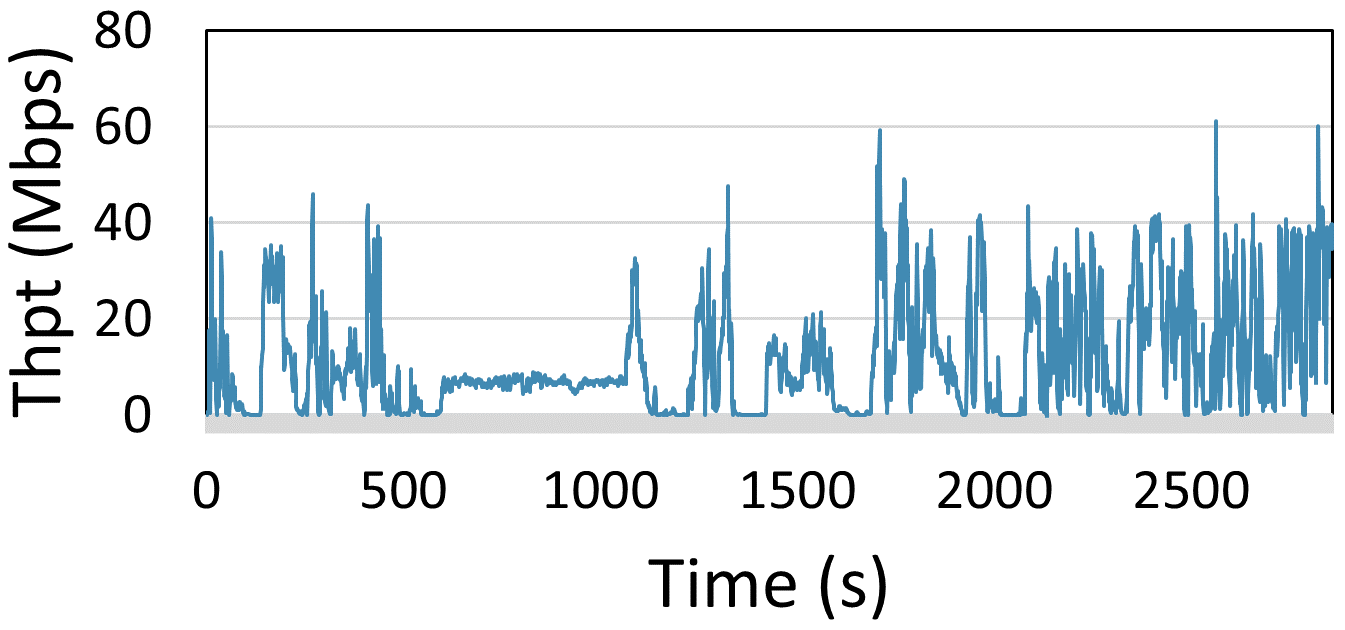
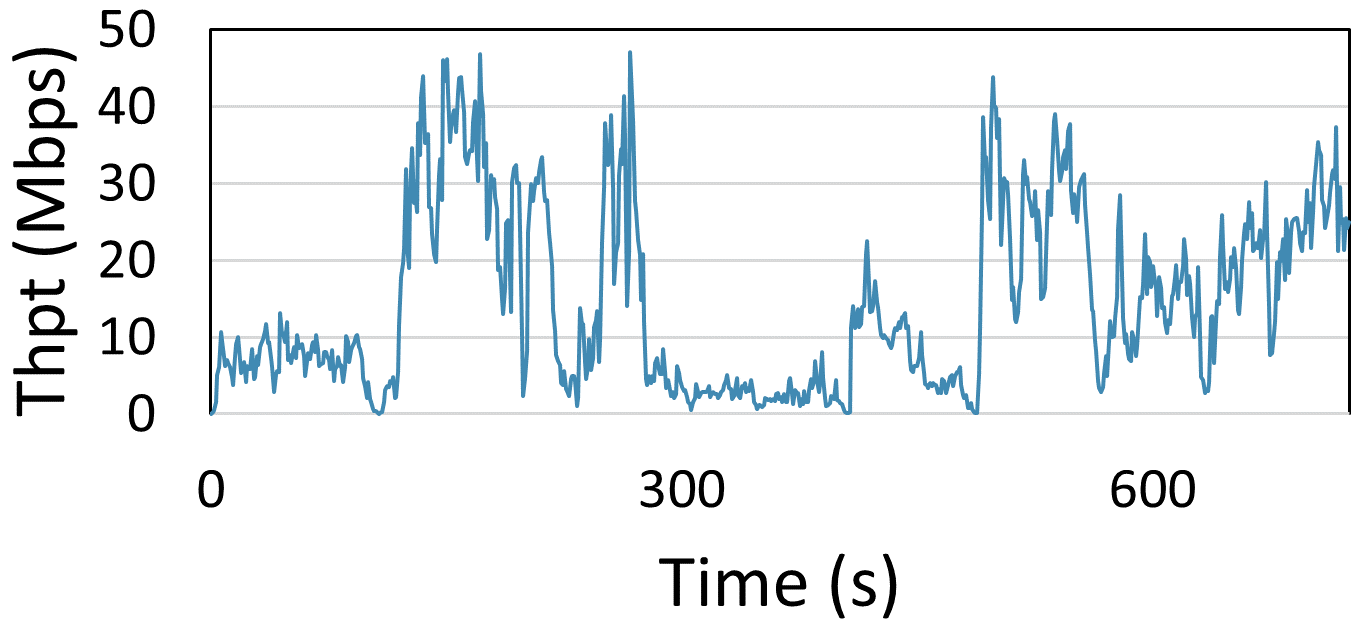
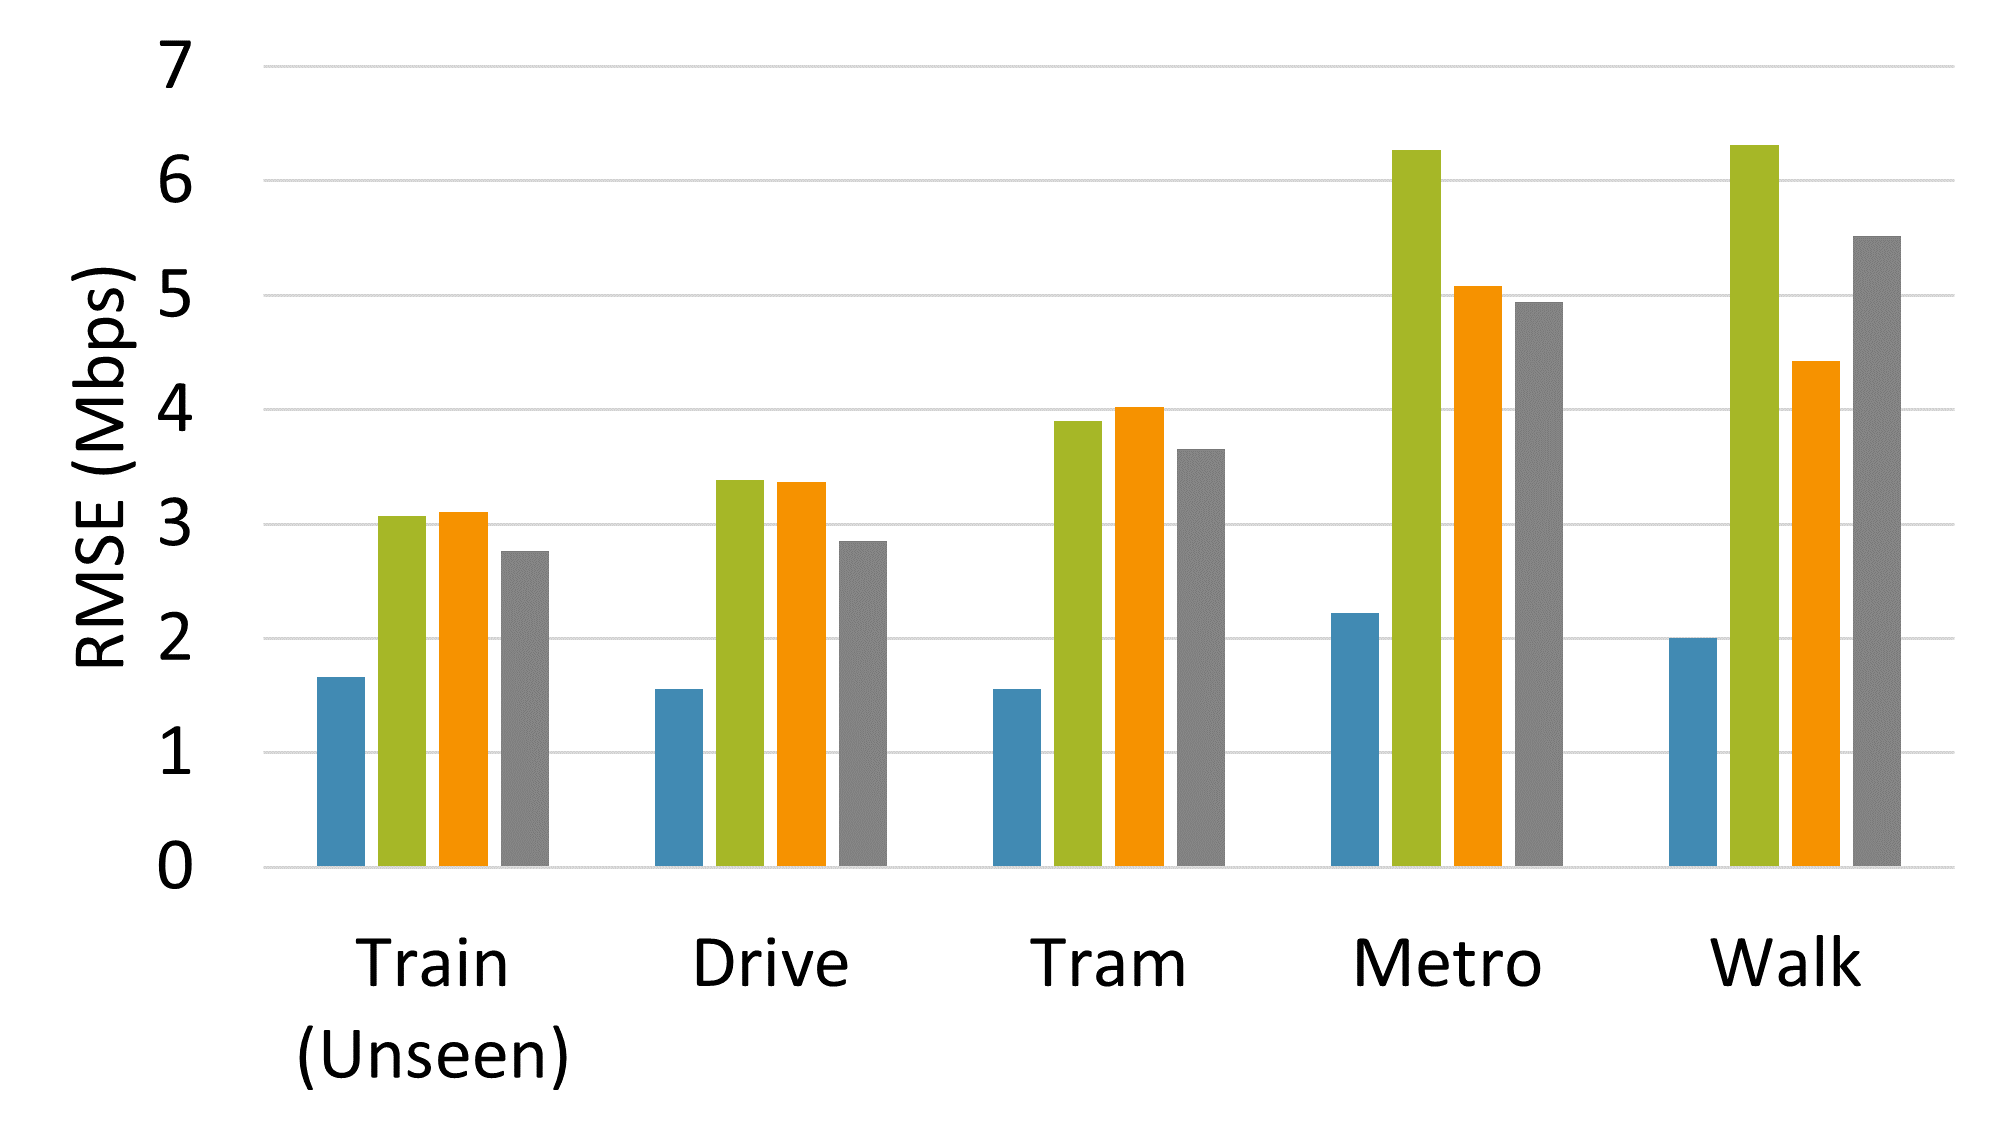
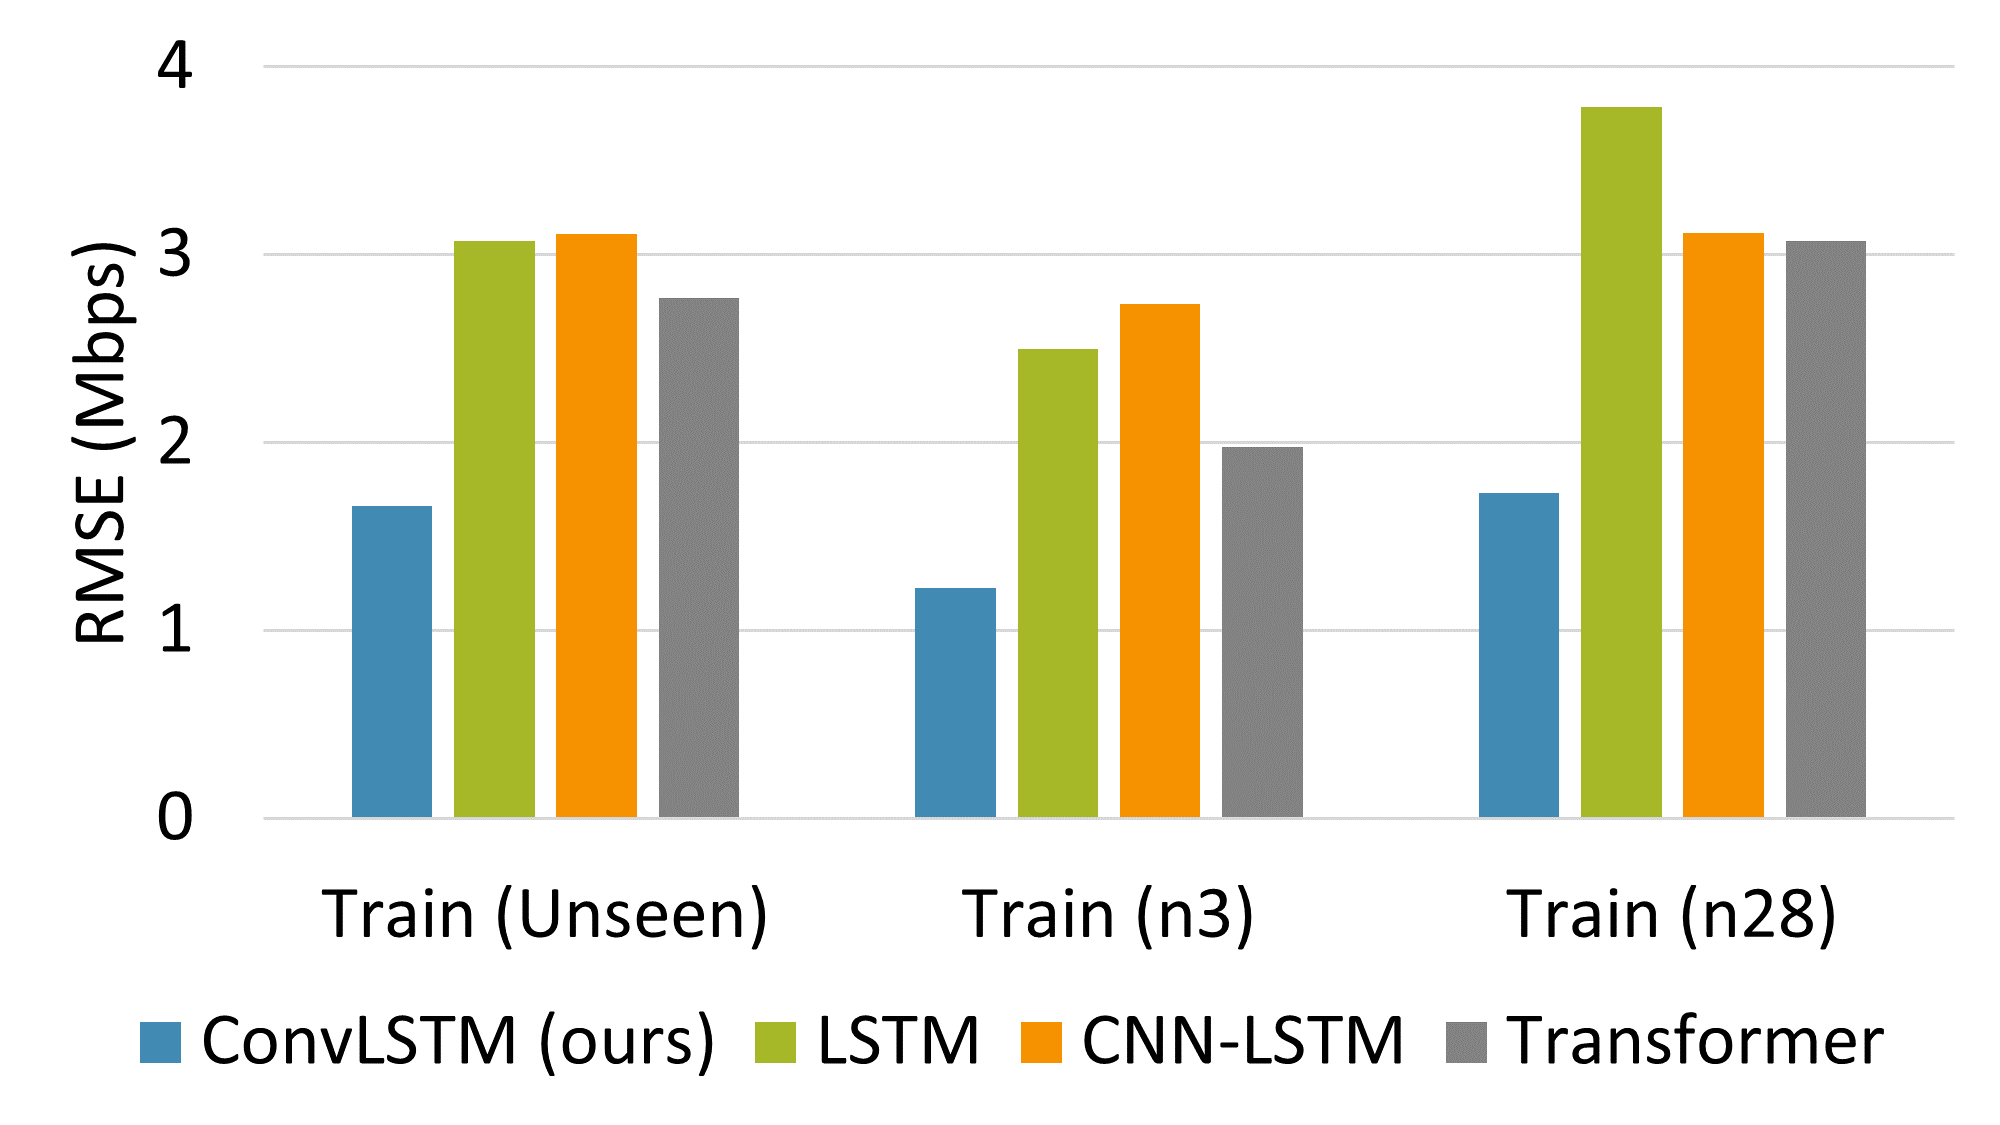
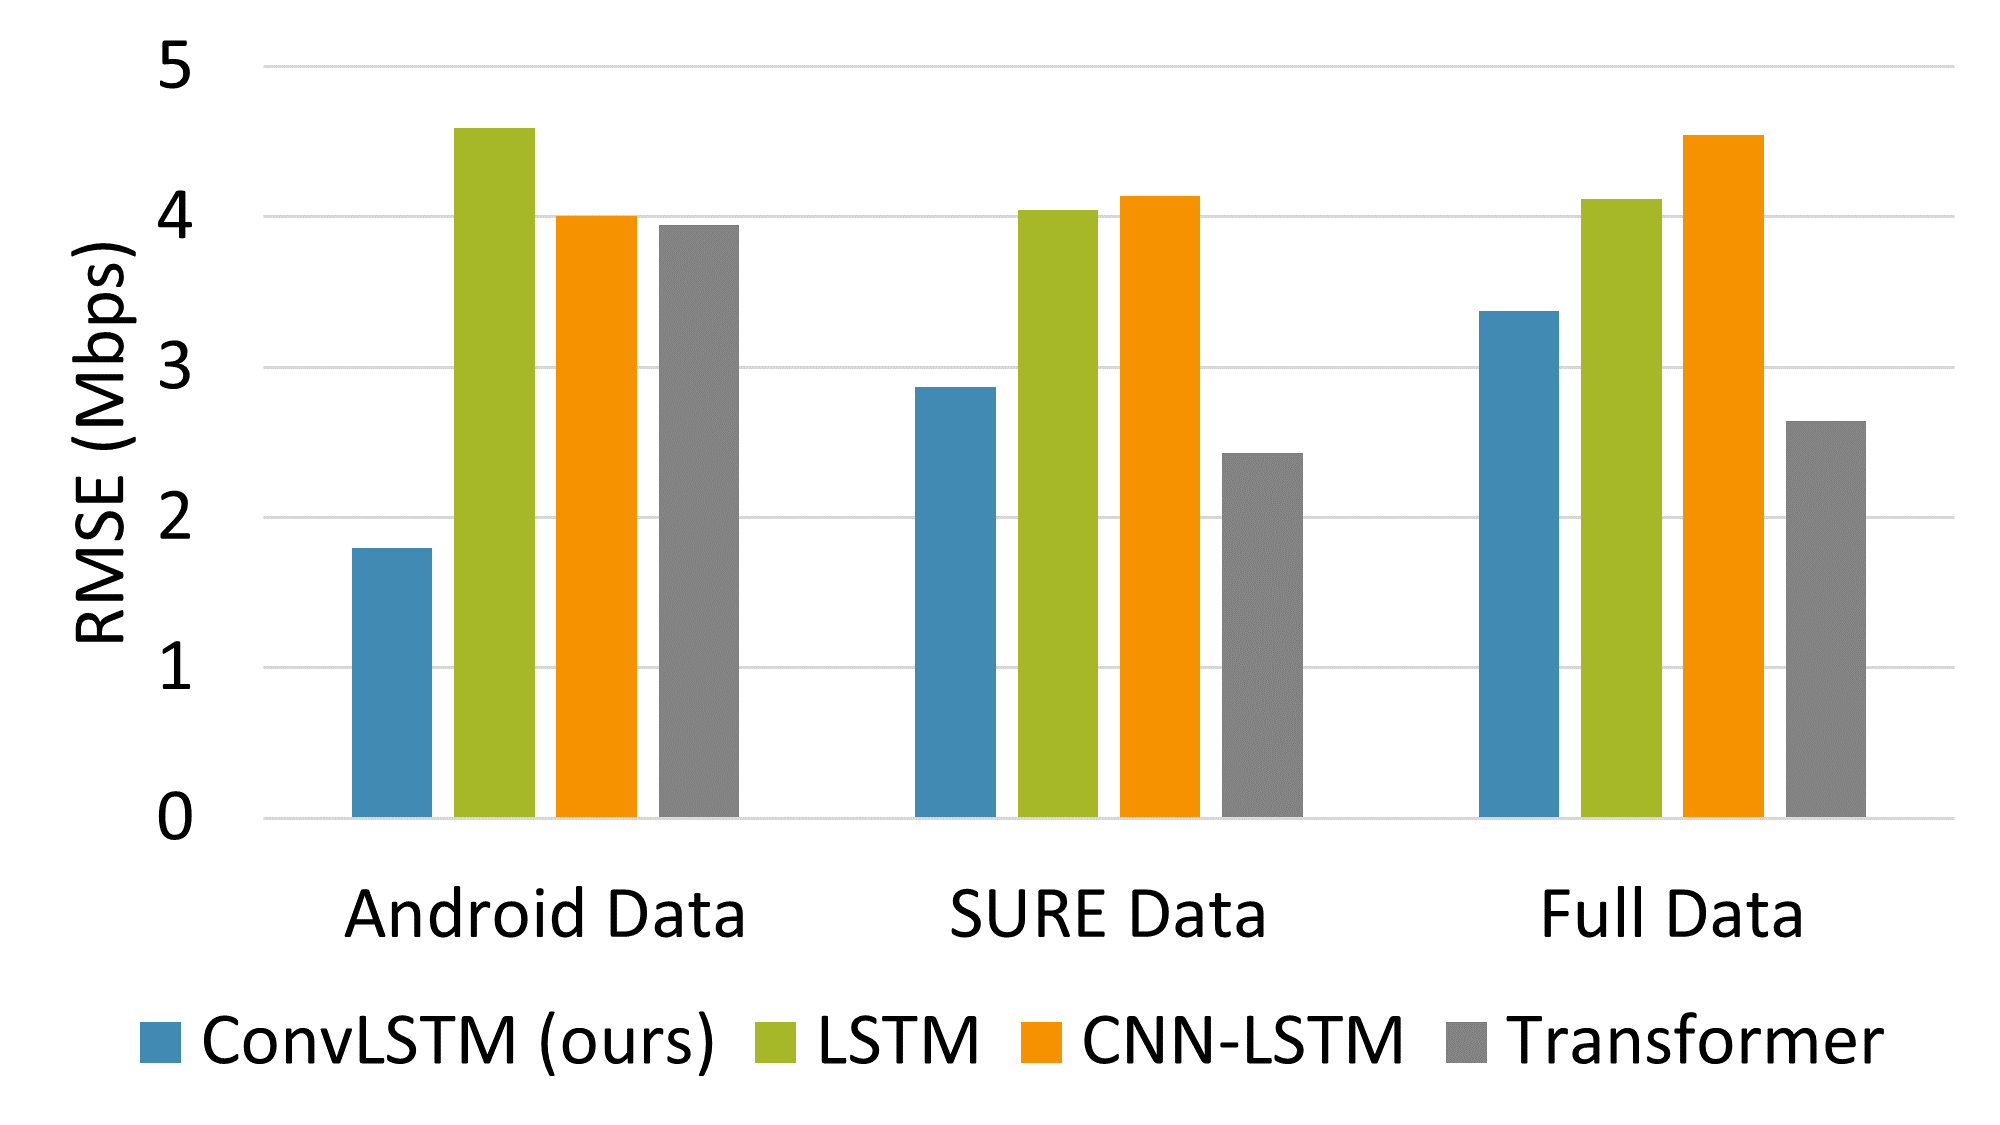
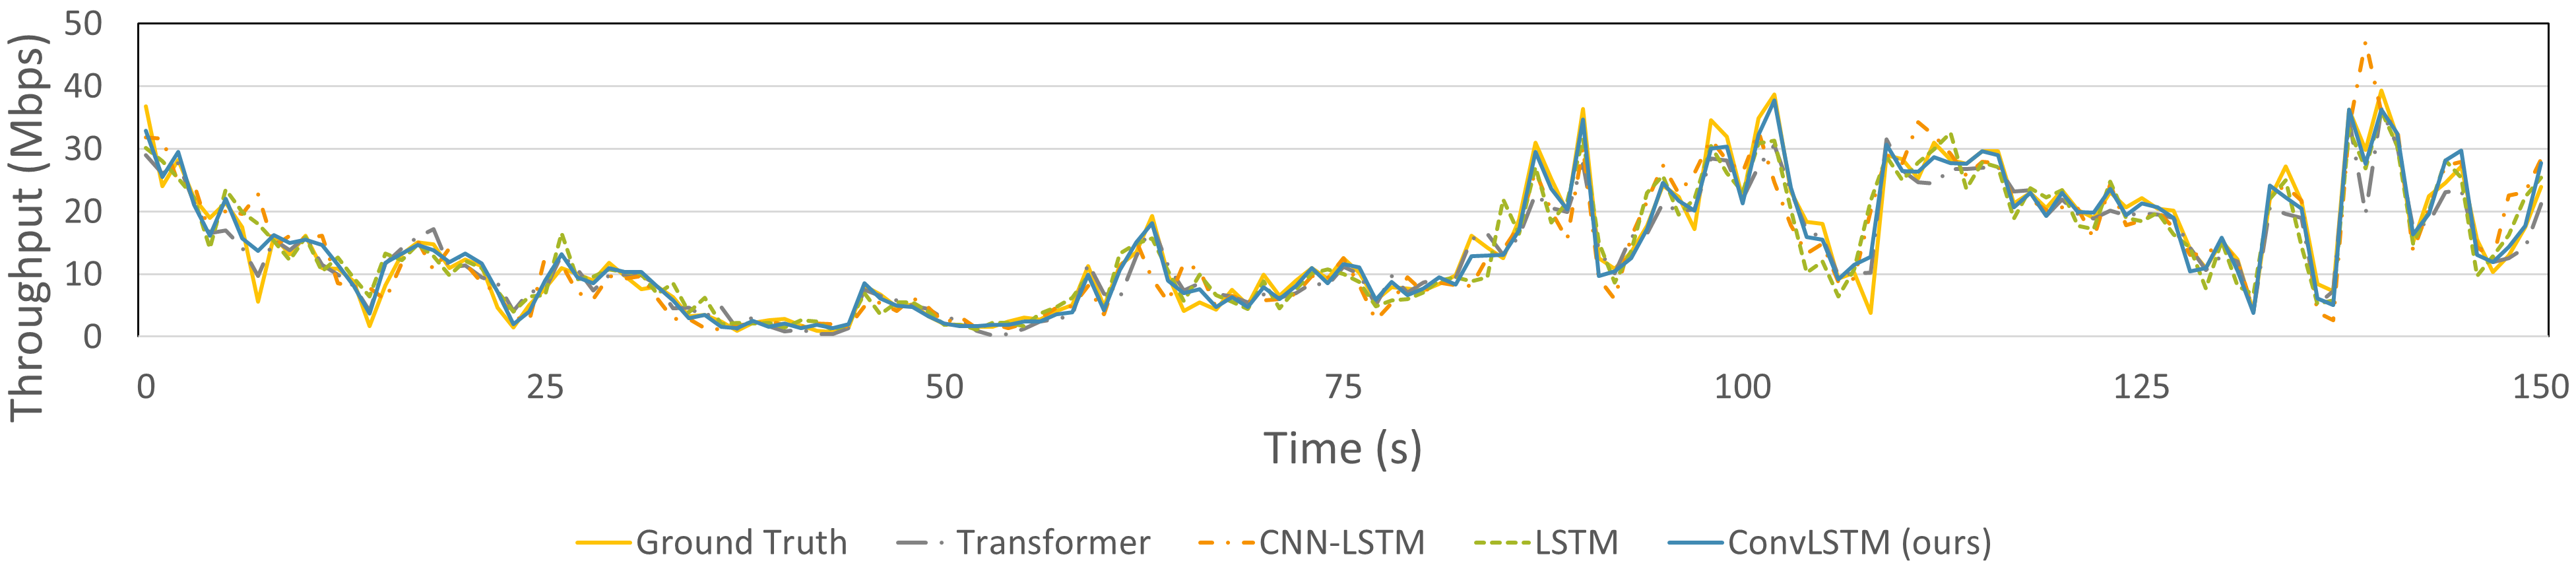
When comparing our proposed model to the others, our proposed method delivers superior performance when performing throughput prediction using just only the Android API data. The predicted throughput trace in Fig. 6 shows that our model is resilient to extreme fluctuation of throughput and can predict the ground truth the most accurately. Even though the model is trained using the data commuter train, it performed well across the board, achieving the RMSE of 1.65 Mbps on an unseen train line and the RMSE of between 1.55 Mbps and 2.23 Mbps with an average of 1.80 Mbps when considering all of the unseen cases (see Fig. 5(a)). Our model significantly outperformed the conventional LSTM, CNN-LSTM model, and Transformer model, which achieve the average RSME of 4.59 Mbps, 4.00 Mbps, and 3.94 Mbps, respectively. When simulating the band incompatibility by forcing the UE to only connect to a specific band, while other model yields some degradation in performance, especially when connecting to frequency band n28 (700 MHz), our model maintains nearly the same performance with RMSE of 1.23 Mbps and 1.73 Mbps when operating on frequency band n3 (1.8 GHz) and n28 (700 MHz), respectively (see Fig. 5(b)). When considering different input parameter sets, it has been found that our model performs better when the parameter is limited to Android API data (see Fig. 5(c)), outperformed other models in all cases including when the other models are given SURE data or full data. Finally, as seen in Fig. 7, our proposed model performed well in both seen and unseen cases. However, the performance in the seen case is significantly better with the RMSE of 1.14 Mbps when predicting the uplink throughput on an Airport Express train on Keisei SkyAccess Line from Aoto Station to the Narita Airport, compared to RMSE of 1.66 Mbps in the unseen train route. Therefore, training this model for a specific use case can be considered for high-accuracy applications.
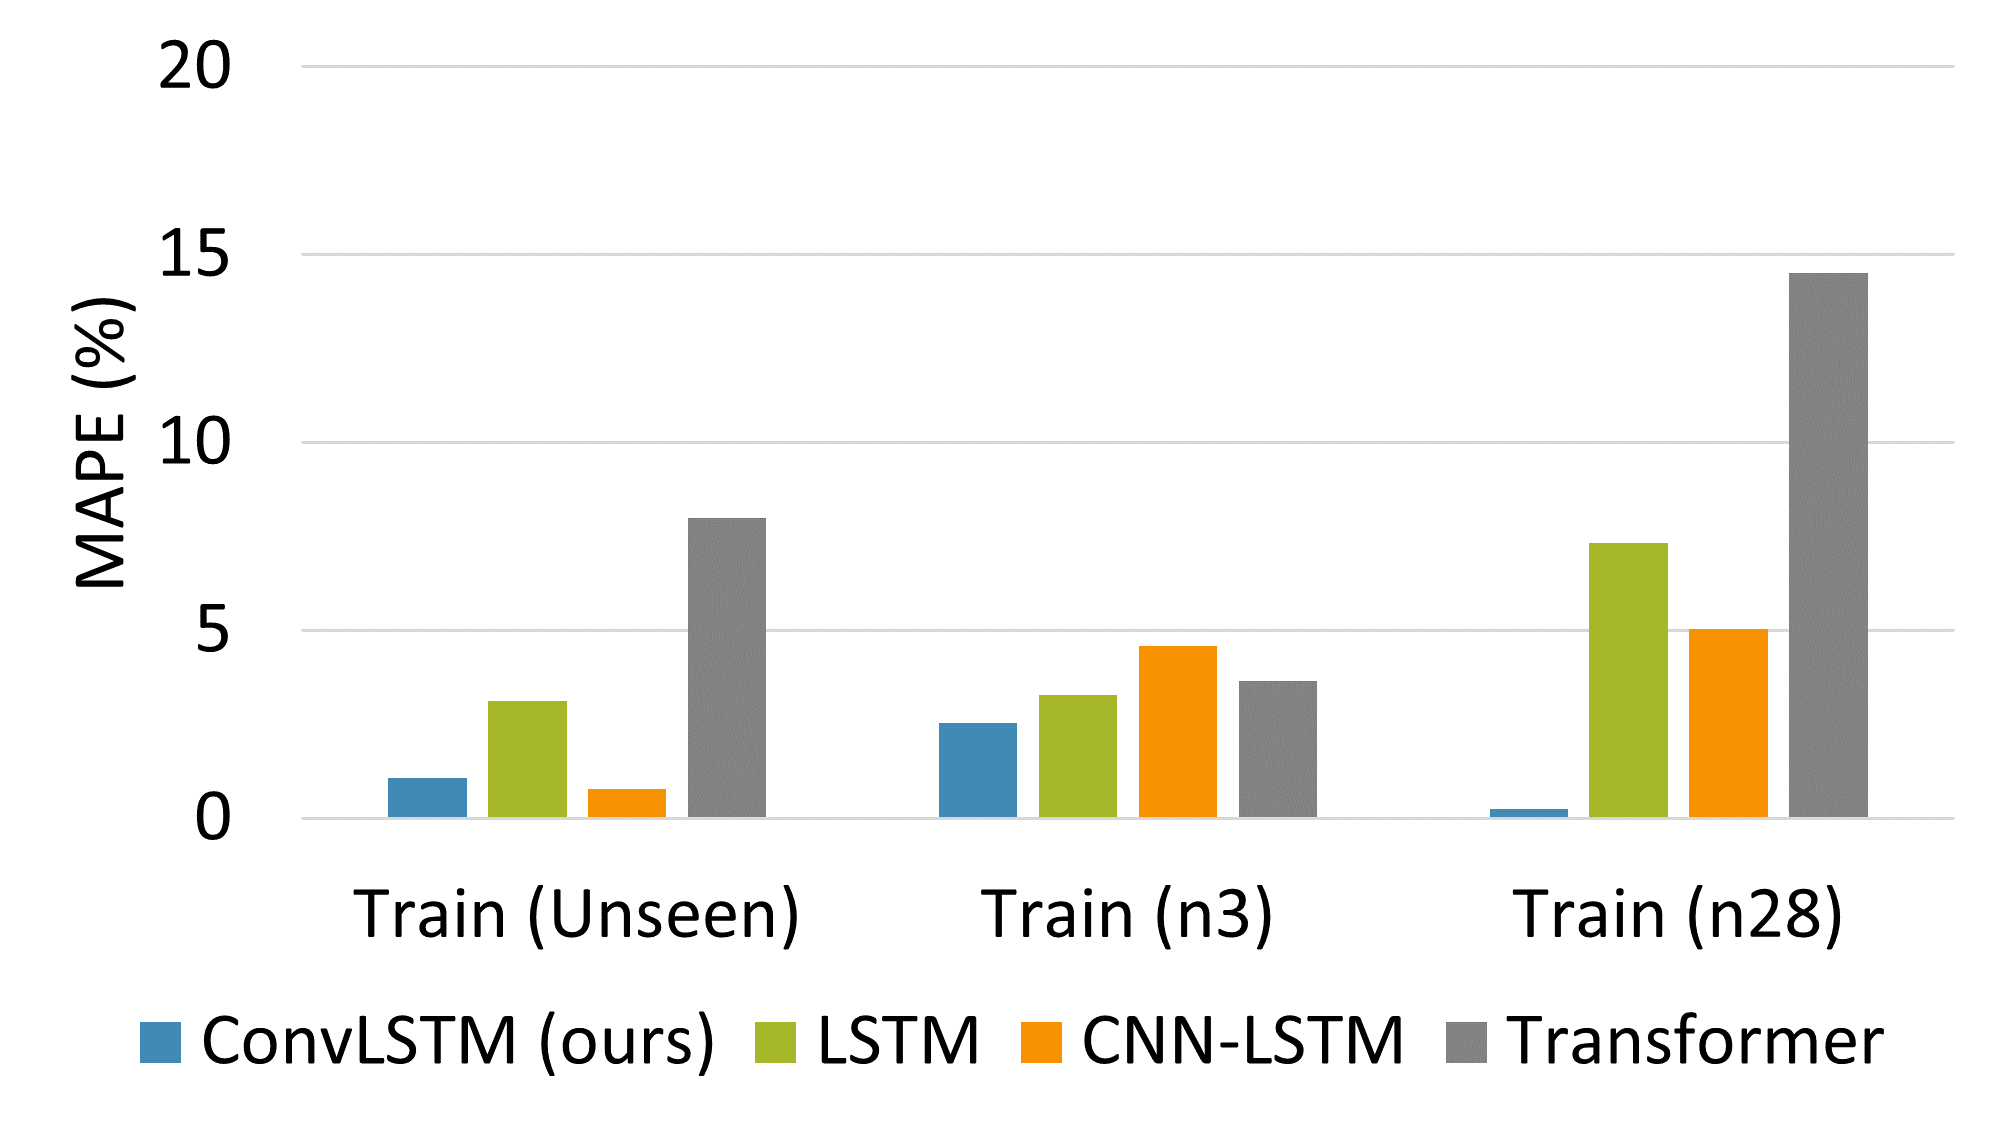
III-B Total Data Transfer Prediction Accuracy
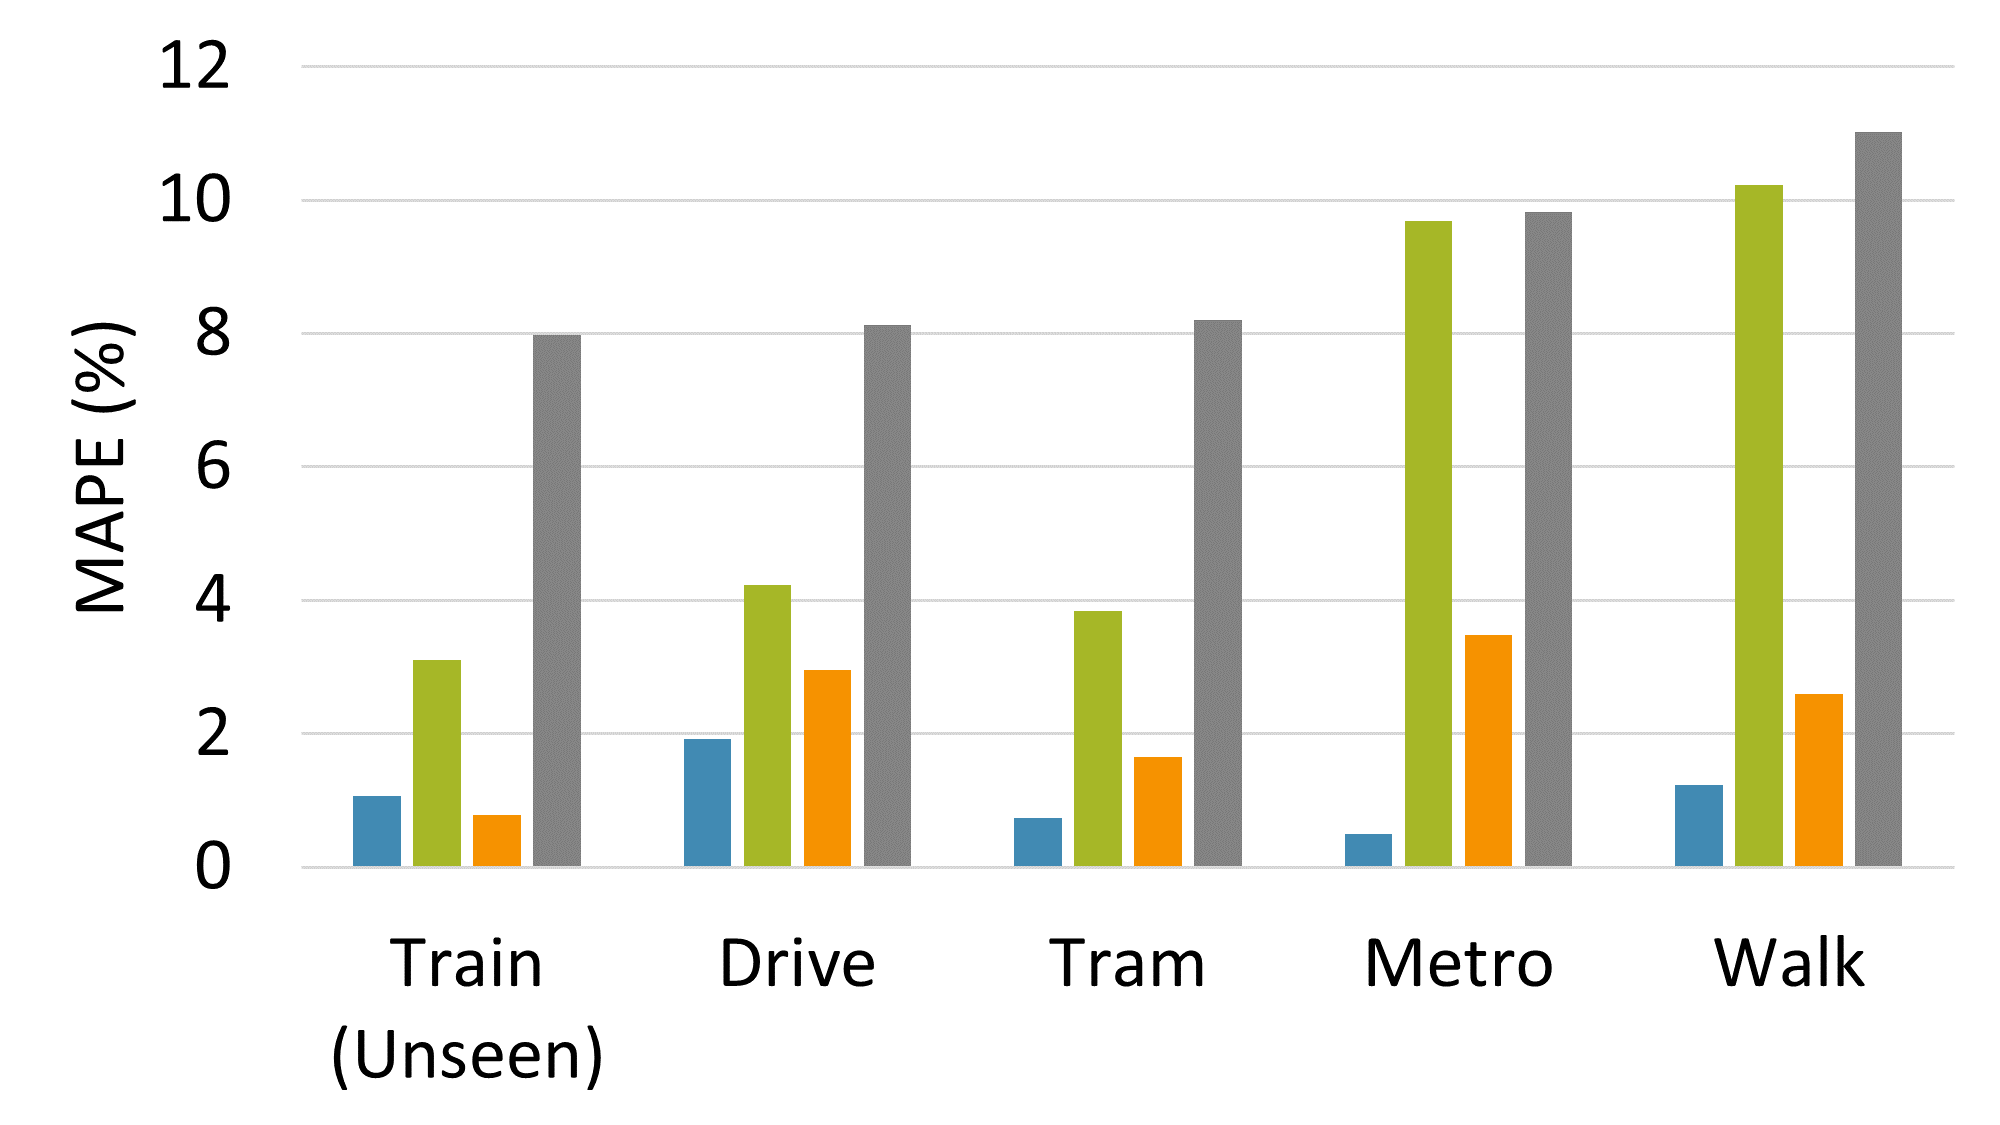
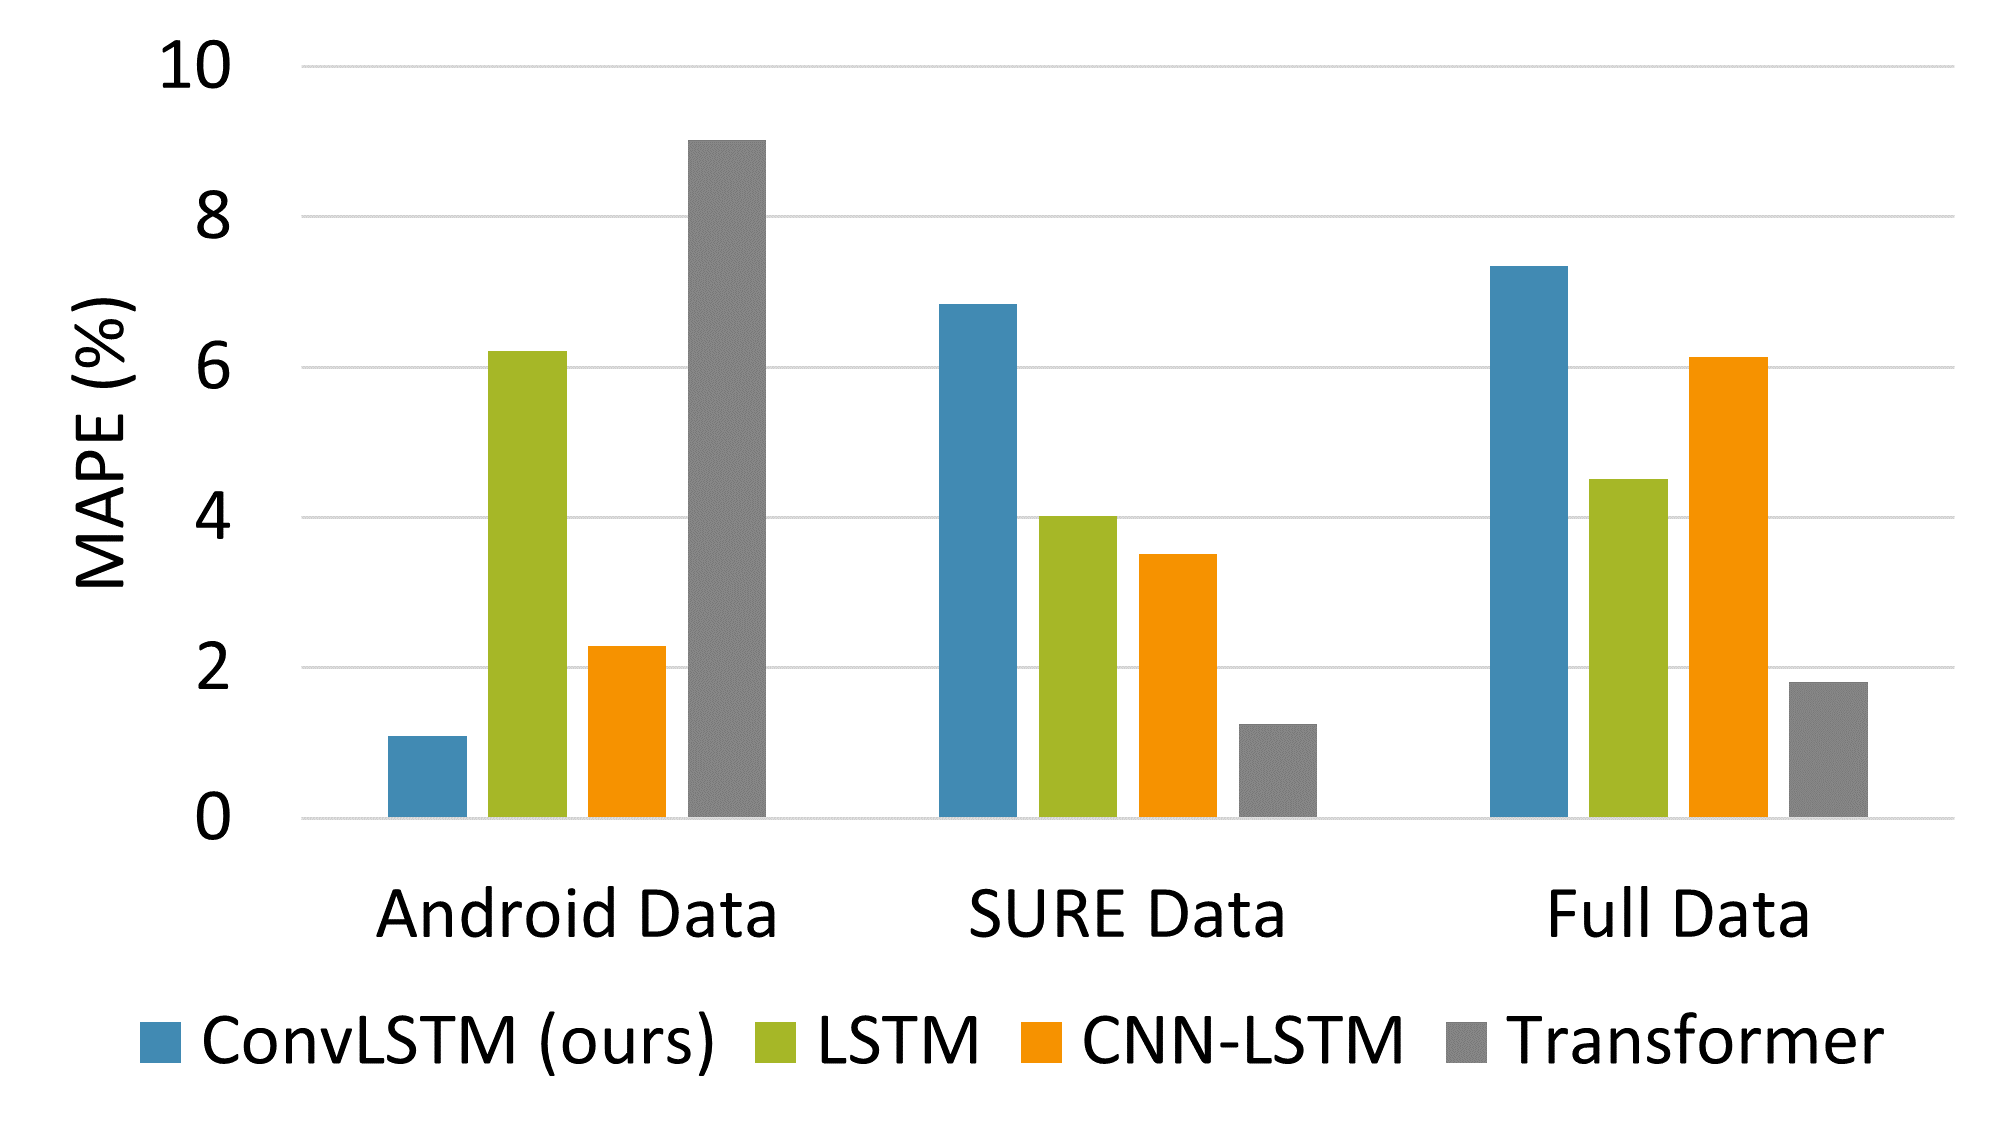
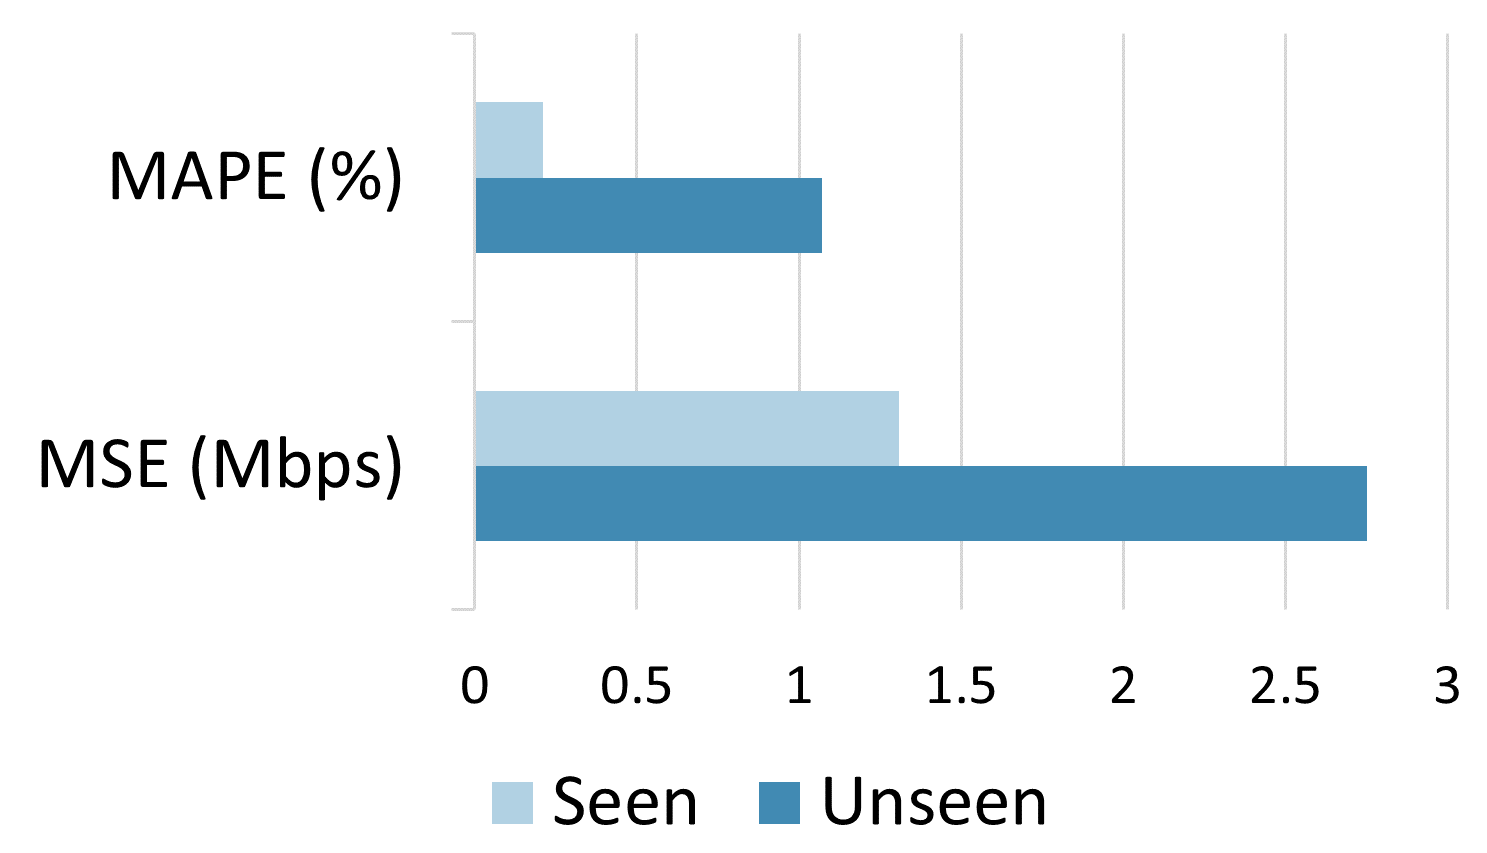
When looking at the prediction of the total data being transferred, our proposed model yields the maximum MAPE of 1.92% in unseen cases (see Fig. 5(d)), delivering more than 98% prediction accuracy. When considering UE incompatibility, our model shows a slight degradation with the maximum MAPE of 2.54% on frequency band n3 (1.8 GHz), however, the performance is still better than other implementations (see Fig. 5(e)). Similar to the instantaneous throughput prediction accuracy, our proposed model works better when Android API data is being given compared to the full data, hitting the average MAPE of 1.10% compared to 6.92% (see Fig. 5(f)). Lastly, the model performed significantly better on the seen data, yielding the MAPE of just 0.21% and delivers more than 99.5% accuracy, compared to MAPE of 1.07% in the unseen case.
IV Conclusions and Future Work
In this paper, we propose a ConvLSTM-based neural network to predict the throughput using only the RF parameters accessible via Android API to ensure that the implementation is feasible for real-world applications. More than 12 hours of real-world RF parameters on a commercial 5G Standalone (SA) network were obtained using a network drive test tool on commuter trains, then used to train the model. The model was then evaluated using another set of real-world data on various kinds of transportation such as trains, trams, metros, cars, and walking against various different types of models used in earlier literature including conventional LSTM, CNN-LSTM, and Transformer (Self-Attention).
While transformer model outperformed our model when both models are given the full data or parameters similar to [10], the results show that our model can accurately predict the uplink throughput on commercial 5G SA network with extreme throughput fluctuation, dropout, and blind spots, when the input data is limited to what offers by Android API, achieving an average RMSE of 1.80 Mbps when considering the instantaneous throughput and 98.9% accuracy when considering the total amount of data transferred, outperforming all other models. It can be said that with an adequate model, low-level parameters might not be necessary for accurate prediction as our model achieves higher accuracy when using Android API data as the input and even slightly outperformed the transformer model with full data. Since our model offers high accuracy for both instantaneous and total data prediction, while only using the accessible RF parameters via Android API, it’s highly suitable for implementation in smartphone applications for a variety of use cases on the 5G mobile network including real-time video transmission, self-driving vehicle, and large file transfer.
As for future work, the model may be improved to incorporate supports for throughput prediction with newer 5G uplink throughput enhancement features, such as Uplink MIMO and Uplink Carrier-Aggregation, enabled and active on both the network and the UE side as well adding the support of the upcoming 5G Frequency Range 2 (mmWave) SA network, which has been actively tested by MNOs and RAN manufacturers around the world, recently.
Acknowledgement
This work was supported by NICT (Grant No. 03801), Japan. Additionally, the authors would like to express their gratitude to PEI Xiaohong of Qtrun Technologies for providing Network Signal Guru (NSG) and AirScreen, the cellular network drive test software used for result collection and analysis in this research. The authors would like to thank ElimZ and Lunaleaf for inspiring this research. Additionally, we would like to thank Shota Hirose for providing useful suggestions on the neural network architecture, and Fangzheng Lin for reviewing this paper. Finally, the first author thanks oElimZo Crew and the members of Saintsitive’s Discord, who provide emotional support and make this research much more bearable.
References
- [1] Minimum requirements related to technical performance for IMT-2020 radio interface(s), International Telecommunication Union Standard Rec. ITU-R M.2083, Nov. 2017. [Online]. Available: https://www.itu.int/pub/R-REP-M.2410
- [2] Qualcomm, “Snapdragon x75 5g modem-rf system,” 2023. [Online]. Available: https://www.qualcomm.com/products/technology/modems/snapdragon-x75-5g-modem-rf-system
- [3] Z. Corporation, “Ais and zte announce thailand’s first 5g mmwave sa showcase at 26ghz,” Jun 2023. [Online]. Available: https://www.zte.com.cn/global/about/news/ais-and-zte-announce-thailands-first-5g-mmwave-sa-showcase-at-26ghz.html
- [4] K. Arunruangsirilert, P. Wongprasert, and J. Katto, “Performance evaluations of c-band 5g nr fr1 (sub-6 ghz) uplink mimo on urban train,” in 2023 IEEE Wireless Communications and Networking Conference (WCNC), 2023, pp. 1–6.
- [5] E. Kurdoglu, Y. Liu, Y. Wang, Y. Shi, C. Gu, and J. Lyu, “Real-time bandwidth prediction and rate adaptation for video calls over cellular networks,” in Proceedings of the 7th International Conference on Multimedia Systems, ser. MMSys ’16. New York, NY, USA: Association for Computing Machinery, 2016. [Online]. Available: https://doi.org/10.1145/2910017.2910608
- [6] A. Zhou, H. Zhang, G. Su, L. Wu, R. Ma, Z. Meng, X. Zhang, X. Xie, H. Ma, and X. Chen, “Learning to coordinate video codec with transport protocol for mobile video telephony,” in The 25th Annual International Conference on Mobile Computing and Networking, ser. MobiCom ’19. New York, NY, USA: Association for Computing Machinery, 2019. [Online]. Available: https://doi.org/10.1145/3300061.3345430
- [7] A. Sacco, M. Flocco, F. Esposito, and G. Marchetto, “Owl: Congestion control with partially invisible networks via reinforcement learning,” in IEEE INFOCOM 2021 - IEEE Conference on Computer Communications, 2021, pp. 1–10.
- [8] J. Lee, S. Lee, J. Lee, S. D. Sathyanarayana, H. Lim, J. Lee, X. Zhu, S. Ramakrishnan, D. Grunwald, K. Lee, and S. Ha, “Perceive: Deep learning-based cellular uplink prediction using real-time scheduling patterns,” in Proceedings of the 18th International Conference on Mobile Systems, Applications, and Services, ser. MobiSys ’20. New York, NY, USA: Association for Computing Machinery, 2020, p. 377–390. [Online]. Available: https://dl.acm.org/10.1145/3386901.3388911
- [9] C. Yue, R. Jin, K. Suh, Y. Qin, B. Wang, and W. Wei, “Linkforecast: Cellular link bandwidth prediction in lte networks,” IEEE Transactions on Mobile Computing, vol. 17, no. 7, pp. 1582–1594, 2018.
- [10] J. Jung, S. Lee, J. Shin, and Y. Kim, “Self-attention-based uplink radio resource prediction in 5g dual connectivity,” IEEE Internet of Things Journal, pp. 1–1, 2023.
- [11] N. Ray, “T‑mobile is still the only adult in the room on 5g. and here’s why. ‑ t‑mobile newsroom,” Nov 2020. [Online]. Available: https://www.t-mobile.com/news/network/t-mobile-5g-coverage-and-speed
- [12] NR; User Equipment (UE) radio transmission and reception; Part 1: Range 1 Standalone, 3GPP Standard TS 38.101-1 version 16.5.0 Release 16, Nov. 2022.
- [13] Ericsson, “Whitepaper on antenna system for 5g networks,” Nov 2018. [Online]. Available: https://www.ericsson.com/en/reports-and-papers/white-papers/advanced-antenna-systems-for-5g-networks
- [14] Qualcomm, “Snapdragon x65 5g modem-rf system,” 2021. [Online]. Available: https://www.qualcomm.com/products/technology/modems/snapdragon-x65-5g-modem-rf-system
- [15] NR; User Equipment (UE) radio access capabilities, 3GPP Standard TR 38.306 Version 16.9.0 Release 16, Jul. 2022.
- [16] X. Shi, Z. Chen, H. Wang, D.-Y. Yeung, W.-k. Wong, and W.-c. Woo, “Convolutional lstm network: A machine learning approach for precipitation nowcasting,” in Proceedings of the 28th International Conference on Neural Information Processing Systems - Volume 1, ser. NIPS’15. Cambridge, MA, USA: MIT Press, 2015, p. 802–810.
- [17] A. Vaswani, N. Shazeer, N. Parmar, J. Uszkoreit, L. Jones, A. Gomez, L. Kaiser, and I. Polosukhin, “Attention is all you need,” 06 2017.
- [18] D. Minovski, N. Ögren, K. Mitra, and C. Åhlund, “Throughput prediction using machine learning in lte and 5g networks,” IEEE Transactions on Mobile Computing, vol. 22, no. 3, pp. 1825–1840, 2023.
- [19] V. Raida, M. Lerch, P. Svoboda, and M. Rupp, “Deriving cell load from rsrq measurements,” in 2018 Network Traffic Measurement and Analysis Conference (TMA), 2018, pp. 1–6.