On the Origin of Galactic Diffuse TeV-PeV Emission: Insight from LHAASO and IceCube
Abstract
The high-energy diffuse gamma-ray emission and neutrino emission are expected from the Galactic plane, generated by hadronuclear interactions between cosmic rays (CR) and interstellar medium (ISM). Therefore, measurements of these diffuse emissions will provide important clues on the origin and nature of Galactic CRs. Comparing the latest observations of LHAASO and IceCube on the diffuse Galactic gamma-ray and neutrino emissions respectively, we suggest that the diffuse gamma-ray emission at multi-TeV energies contains a considerable contribution of a leptonic component. By modelling the gamma-ray halos powered by middle-aged pulsars in our Galaxy with taking into account the magnetic field configuration and the interstellar radiation field in the Galaxy, we demonstrate that the collective contribution of pulsar halos can account for the excess in the measured diffuse gamma-ray emission with respect to the predicted flux from CR-ISM interactions. The resulting one-dimensional profile along the Galactic longitude is also consistent with the observation.
I Introduction
The diffuse gamma-ray emission of the Galactic Plane (DGE) is the most prominent structure in the gamma-ray sky, as firstly revealed by SAS-2 (Fichtel et al., 1975) and COS-B (Bignami et al., 1975) about half a century ago, and later by EGRET, Fermi-LAT at GeV band. Ground-based TeV gamma-ray instruments can also measure part of the Galactic plane and the diffuse emission from Galactic plane has been discovered at energies up to TeV-PeV band (Atkins et al., 2005; Bartoli et al., 2015; Amenomori et al., 2021) in recent decades. It is believed that the DGE mainly originates from hadronuclear interactions between Galactic cosmic rays (CRs) and interstellar medium (ISM) (Stecker, 1973; Strong et al., 2010; Ackermann et al., 2012; Lipari and Vernetto, 2018), with possible contribution from unresolved, faint sources of either leptonic or hadronic emission. Therefore, the DGE contains critical information of the origin of Galactic CRs and extreme particle accelerators in our Galaxy. Very recently, the Large High-Altitude Air Shower Observatory (LHAASO) published the most complete TeV-PeV gamma-ray source catalog up to date in the declination between and 80∘ (Cao et al., 2023a), and the measurement of DGE in TeV after subtracting the contribution of these sources (Cao et al., 2023b). The measured flux, interestingly, is about 3 times higher than the prediction of CR-ISM interactions in the inner Galactic plane and 2 times higher than that predicted in the outer Galactic plane in the range of TeV. The excess could be either caused by CR overdensity with respect to the conventional model prediction due to complicated propagation effect in reality, or by contribution of unresolved sources. The latter scenario has been suggested to account for excesses in DGE measured by some other instruments (Linden and Buckman, 2018; Liu and Wang, 2021a; Zhang et al., 2022; Vecchiotti et al., 2022; Yan and Liu, 2023; Sun et al., 2023), although the dominating source population has not been unambiguously identified. Either leptonic sources such as pulsar halos, or hadronic sources such as young stellar clusters may be responsible for the excess.
On the other hand, the IceCube neutrino telescope has recently reported discovery of high-energy neutrinos from our Galaxy at a significance over level with 10-year data of cascade events (IceCube Collaboration et al., 2023). The inferred Galactic neutrino flux contributes approximately of the all-sky astrophysical flux at 30 TeV. The discovery unambiguously serves as a smoking gun for the hadronuclear interactions between high-energy CRs and gas in the Milky Way. Although no individual neutrino source has been identified due to the poor angular resolution and insufficient statistics, the extracted neutrino flux based on certain all-sky spatial templates can nevertheless provide insights into the hadronic component of the DGE. In this article, we will attempt to understand the origin of the DGE based on the latest measurements of LHAASO and IceCube.
II Insight of Galactic Diffuse Gamma-ray Emission from Icecube and LHAASO
The neutrino analysis is based on theoretical all-sky spatial templates, while the DGE flux given by LHAASO is extracted from a portion of the Galactic plane ( and ), after masking the contribution of all known sources. Furthermore, the neutrino emission measured by IceCube likely contains a considerable contribution also from neutrino sources in the Galaxy (IceCube Collaboration et al., 2023), in addition to those truly diffusive emission from CR-ISM interactions. Hence, the results of the two measurements cannot be compared directly.
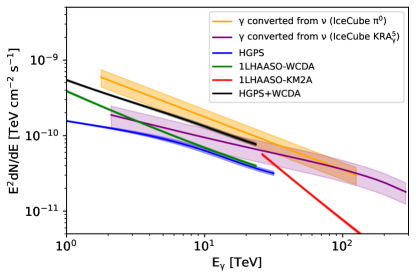
As the first step of the analysis, we compare the Galactic neutrino flux to the total flux of known gamma-ray sources powered by hadronic processes, in order to estimate the fraction of the neutrino flux related to CR-ISM interactions. As a ground-based gamma-ray detector, LHAASO cannot detect most sources in the southern hemisphere. We therefore combine sources reported in the first LHAASO catalog with and sources recorded in the Galactic Plane survey of High Energy Spectroscopic System (HESS) with declination less than to get a complete source list in the entire Galactic plane. To exclude gamma-ray sources of leptonic origin, we do not count in sources with spatial association of pulsars, despite of suggestions that pulsars or pulsar wind nebulae may also be high-energy proton accelerators (Atoyan and Aharonian, 1996; Amato et al., 2003; Liu and Wang, 2021b). On the other hand, we find that the neutrino flux from Galactic plane with is about 50% of the all-sky flux according to the Fermi-LAT template (Acero et al., 2016), and about 70% of the all sky flux according to the KRA template (Gaggero et al., 2015), which are employed in IceCube’s data analysis. The gamma-ray flux and the single-flavor neutrino flux generated in the same hadronuclear interactions are approximately related by , where . We then can convert the neutrino flux in the Galactic plane to corresponding gamma-ray flux and compare with the total source flux. As shown in Fig 1, the sum of the source contribution reaches about 2/3 of the total flux converted from the neutrino measurement with the template, from a few TeV up to several tens of TeV. Although the measured neutrino flux is based on the template only for CR-ISM interactions, the contribution from sources would increase the normalization of the inferred neutrino spectrum significantly. Beyond TeV, on the other hand, we can see the source contribution is negligible, implying that Galactic neutrinos is dominated by CR-ISM interactions above this energy. The neutrino flux in the Galactic plane obtained with the KRA template is even slightly lower than the source contribution, which is not physical. Actually, the KRA template gives rise to a lower significance of neutrino detection than the template, which may not reflect the neutrino flux level in the Galaxy accurately. Nevertheless, it also indicates a significant contribution of sources to the neutrino emission in the Galactic plane.
Next, to estimate the hadronic gamma-ray component in the DGE measured by LHAASO, we need to find out the neutrino flux from the same region of interest (ROI) as LHAASO’s DGE analysis. LHAASO’s DGE analysis masked each of the known sources and the surrounding ISM in the sky map to reduce the contamination of the source to the measured DGE. Therefore, we also need to mask the same region in the all-sky template for the neutrino analysis. We find that the flux ratio of the remaining region to the all-sky map is 12.5% for the Fermi-LAT template and 8.1% for the KRA template (see Appendix for details). Dividing the rescaled neutrino flux by the corresponding solid angle of the remaining region, which is 0.206 sr for the inner Galactic plane () and 0.268 sr for the outer Galactic plane (), we can obtain the average neutrino intensity, which is supposed to be related with CR-ISM interactions, from the same ROI of LHAAOS’s DGE measurement. After converting the neutrino intensity into the corresponding gamma-ray intensity, we can compare it to LHAASO’s DGE measurement.
We note that some uncertainties may exist in the above analysis. First, we may expect the existence of some unresolved hadronic TeV gamma-ray sources in the Galaxy, such as star-forming regions, historical hypernova remnants, interactions of freshly injected CRs and medium surrounding their accelerators (Liu and Wang, 2021a; Ahlers and Murase, 2014; Zhang et al., 2022). Considering contributions of these sources would further reduce the gamma-ray flux related to CR-ISM interactions. On the other hand, some of known gamma-ray sources without pulsar association could be of the leptonic origin actually. If so, it would reduce the fraction of the hadronic gamma-ray flux from sources, and increase the gamma-ray flux related to CR-ISM interactions. The uncertainties from these two aspects operate in the opposite direction, and may somehow cancel each other to certain extent. An accurate evaluation of the uncertainty relies on further studies of these sources, via multiwavelength and multimessenger observations.
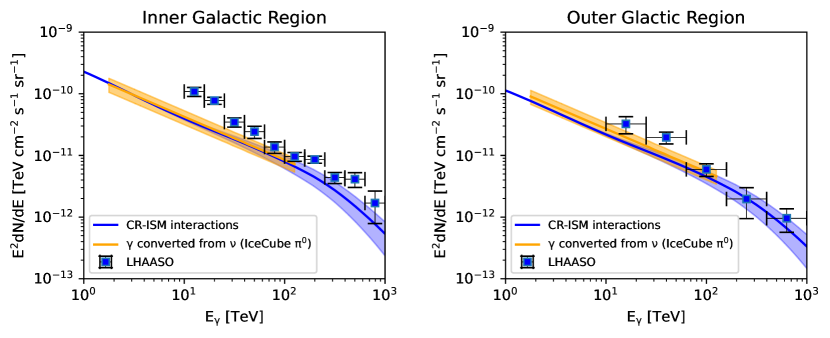
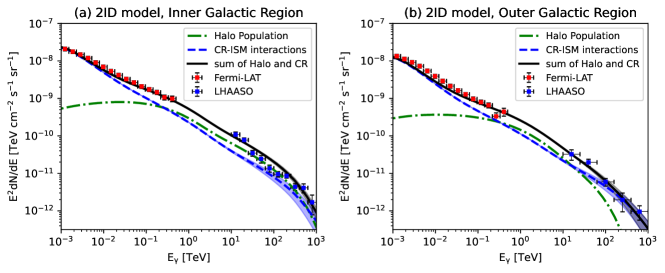
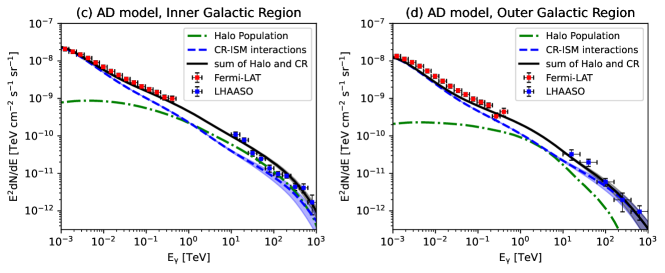
Finally, we present the comparison between the gamma-ray flux derived from the neutrino measurement and the DGE measured by LHAASO in Fig. 2. We see that the derived gamma-ray intensity related to CR-ISM interactions is lower than the LHAASO measured DGE flux below TeV for both the inner Galactic region and the outer Galactic region. The predicted diffuse gamma-ray intensity from CR-ISM interactions, following the calculation by Zhang et al. (Zhang et al., 2023), is also shown for reference. This calculation employs GALPROP (Vladimirov et al., 2011) and is based on up-to-date measurements of the local CR spectra from various instruments for CR protons, helium nuclei and heavier isotopes such as Li, Be, B, C, O, as well as electrons and positrons Zhang et al. (2023); Yuan et al. (2020). We see that an excess in the DGE measured by LHAASO is obvious below TeV with respect to the model prediction. Interestingly, the gamma-ray intensity derived from the neutrino measurement is well consistent with the model prediction, corroborating the existence of the excess in DGE. The excess indicates an additional component contributing to the DGE, and must be of the leptonic origin. A plausible candidate population for the leptonic DGE excess is pulsar halos, which have been discussed as potential contributors to DGE (Linden and Buckman, 2018; Vecchiotti et al., 2022; Martin et al., 2022; Yan and Liu, 2023; Dekker et al., 2023) with simple modelings of the contribution of the pulsar halo population. In what follows, we will explore in detail the pulsar halo interpretation for the DGE excess measured by LHAASO.
III Pulsar Halos as Dominating Sources of DGE at Multi-TeV
Pulsar halos are produced by the IC scattering of energetic electron/positron pairs, which have escaped from their pulsar wind nebulae (PWNe), off the background radiation field in the ISM (Liu, 2022; López-Coto et al., 2022; Fang, 2022). From the perspective of energy budget, pulsar halos are powered by the rotational energy of pulsars, with a fraction of the pulsar’s spindown power converted into energetic pairs and subsequently into radiations. Pulsar halos are apt to form around pulsars with age beyond several tens of thousand years (Giacinti et al., 2020), as the confinements of pairs are relatively weak inside these middle-aged PWNe while the spindown powers of the pulsars are not very low. Although the transport mechanism of injected pairs in the surrounding ISM is still under debate, a consensus has been reached that pulsar halos are extended TeV gamma-ray sources without sharp boundaries. It is therefore natural to expect that many pulsar halos are faint, diffusive gamma-ray sources and most of them are not resolved by instruments.

To estimate their contribution to the DGE, we single out pulsars with age between 50 kyr and 10 Myr from the ATNF pulsar catalog (Manchester et al., 2005). Here we consider two propagation models for escaping pairs. The first one is the two-zone isotropic diffusion model (2ID model) with a suppressed diffusion coefficient within a radius of from the central pulsar and the typical diffusion coefficient of the ISM as inferred from the secondary-to-primary CR ratio for the region beyond (Fang et al., 2018; Profumo et al., 2018). In the second model, we consider the anisotropic diffusion model (AD model) (Liu et al., 2019a) in which particle diffuse more rapidly along the mean magnetic field direction than they diffuse perpendicular to the mean field direction. In both models, we generate the interstellar magnetic field strength in the vicinity of each pulsar based on their positions in the Galaxy and the Galactic magnetic field (GMF) model suggested by Jansson & Farrar (Jansson and Farrar, 2012a, b), and consider the interstellar radiation field density following the model proposed by Popescu et al. (Popescu et al., 2017). As such, we can calculate cooling and radiation of pairs around each pulsars. For the AD model, we also generate the mean direction of the magnetic field because it determines the preferential diffusion direction of injected pairs. The turbulent level of the magnetic field, indicated by the Alfvénic Mach number , is then randomly assigned in the range of which is typical for ISM. A detailed description of our model can be found in Appendix.
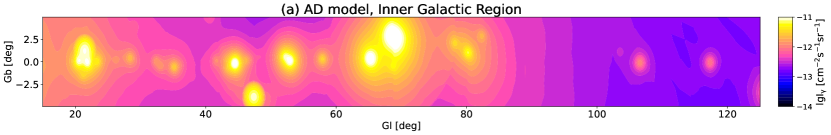
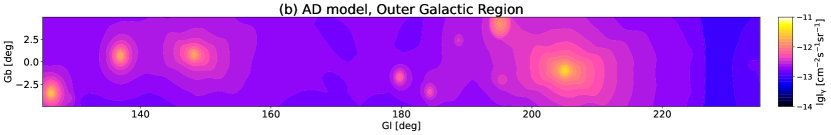
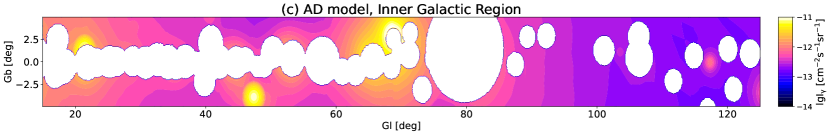
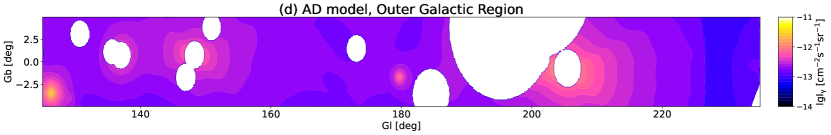
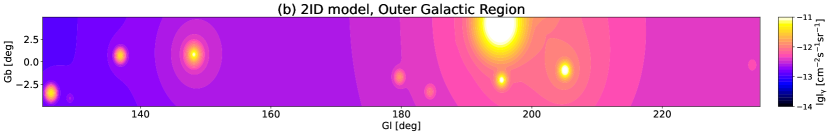
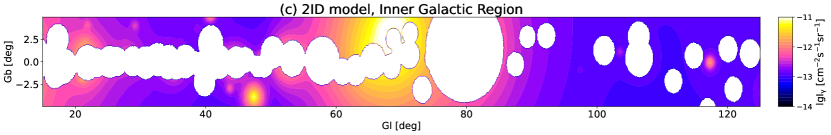
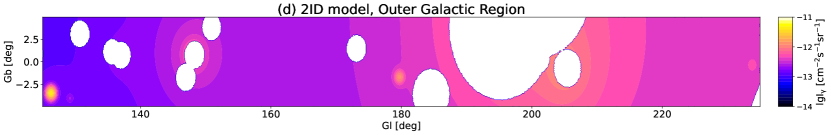
We then can simulate the pulsar halos powered by each of selected pulsars based on the model. To compare with LHAASO’s measurement, we make a two-dimensional intensity map of projection of each pulsar halo onto the Galactic plane according to the Galactic coordinate and distance of each pulsar, and then convolve the intensity map with LHAASO’s point spread function (Ma et al., 2022) to mimic the sky viewed by LHAASO. In Fig. 3 and Fig. 4, we present the projected intensity map of 1179 selected pulsars in the region where the DGE is extracted under the 2ID model and the AD model respectively. Then we mask the same region as used in the LHAASO data analysis, and calculate the average gamma-ray intensity in the remaining Galactic plane for and respectively. It is worth noting the existence of pulsars that are invisible to us, if their lighthouse-like radiation beam do not sweep Earth as they spin. These invisible off-beamed pulsars, however, may also generate pulsar halos around them and emissions of these pulsar halos would contribute to DGE (Yan and Liu, 2023). Therefore, the average gamma-ray intensity obtained above need be multiplied by a beam-correction factor following Ref. (Yan and Liu, 2023; Tauris and Manchester, 1998) to account for the contribution from halos of those off-beamed pulsars.
In Fig. 5, we show that the DGE excess measured by LHAASO can be well explained by the pulsar halo population with a reasonable set of model parameters. Furthermore, an excess of DGE in GeV is also reported in the same region of LHAASO’s analysis based on Fermi-LAT’s data (Zhang et al., 2023). Although the Fermi-LAT excess is not necessarily related to pulsar halos since there may be more potential GeV gamma-ray emitters in the Galaxy, we find that the Fermi-LAT excess can be accounted for by pulsar halos as well if some specific (but reasonable) model parameters are chosen. Beside the spectrum, we also compare the one-dimensional Galactic longitude profile between our simulation and LHAASO’s observation. Because halos of those undetectable, off-beamed pulsars cannot be included in the modeled profile and because of the possible variation in the pair injection spectrum from individual pulsar halos, we do not expect a quantitative match between the measured profile and the modeled one. Nevertheless, we find the tendency of the longitudinal profile of the DGE excess and that predicted by our model are generally in good consistency, supporting the pulsar halo interpretation.
IV Discussion
Our results suggest that pulsar halos make a considerable, if not dominant, contribution to the DGE emission measured by LHAASO below TeV, extending probably down to GeV. This conclusion does not depend on the model of pulsar halos and it only requires that approximately of a pulsar’s spindown power has converted to electron/positron pairs escaping to ISM with an injection spectral index . The main uncertainty lies in the halos powered by those off-beamed pulsars, which are now dealt with multiplying a beam-correction factor to contribution of halos formed around detected pulsars. If these invisible pulsars have similar properties to those detected ones in a statistical way (such as following the same luminosity function and spatial distribution), the total flux from the pulsar halo population predicted by the present model would be basically correct.
The collective emission of pulsar halos constitutes a non-negligible background for other gamma-ray sources in the Milky Way. Therefore, it is important to understand the nature of these pulsar halos so as to better eliminate their influence when studying other sources. With increasing exposure time, sensitive TeV gamma-ray instruments such as LHAASO may resolve more and more pulsar halos, and hence reduces the background of this leptonic component. However, it would not be straightforward to recognize halos of those off-beamed pulsars. Accurate measurements of the intensity profile of gamma-ray sources by imaging air Cherenkov telescopes of high angular resolution such as the Cherenkov Telescope Array (Actis et al., 2011), as well as a mulitwavelength study, would help the identification. On the other hand, the neutrino measurement is crucial to distinguish the hadronic component from the leptonic component. The next-generation neutrino telescopes with improved angular resolution and effective area (Aartsen et al., 2021; Hu et al., 2023) would be capable of identifying bright neutrino sources from the Galaxy. The advanced measurement of high-energy neutrinos, along with the high-sensitivity gamma-ray observations, will hopefully unravel the composition of the DGE, uncover the nature of Galactic leptonic and hadronic gamma-ray emitters, and finally solve the century-old puzzle of the cosmic-ray origin.

Acknowledgement
We are grateful to Lu Lu for helpful discussions on IceCube’s results. This work is supported by the National Natural Science Foundation of China (No. 2031105, 12220101003) and the Project for Young Scientists in Basic Research of Chinese Academy of Sciences (No. YSBR-061).
Appendix
IV.1 Compare Measurements between LHAASO and IceCube
The neutrino emission measured by IceCube contains a considerable contribution from Galactic neutrino emission sources. To estimate the source component in the measured neutrino flux and the converted hadronic gamma-ray flux, we add up the gamma-ray sources of potential hadronic origin observed by HESS and LHAASO. Among the 90 sources listed in the 1st LHAASO catalog, 85 of them are Galactic sources. Among the 85 Galactic sources, we exclude 35 sources with pulsar or PWN associations which are like of the leptonic origin, and focus on those sources located within Galactic latitude . There are 45 remaining gamma-ray sources of potential hadronic origin in the Galactic plane, measured in the range of 1-25 by LHAASO-WCDA and by LHAASO-KM2A. Note some sources only have detection by only one of the two detectors of LHAASO. The best-fit spectral parameters and the uncertainties are given in Ref.(Cao et al., 2023a). On the other hand, HESS Galactic Plane Survey (HGPS) H. E. S. S. Collaboration et al. (2018a) announced 78 sources from 300 GeV to 30 TeV. Among them, 14 are confirmed PWNe H. E. S. S. Collaboration et al. (2018b) and others are regarded as potential hadronic sources. Part of them are the same sources recorded in the LHAASO catalog so we only consider 43 sources in HGPS with declination smaller than , where is outside LHAASO’s field of view.
Both catalogs provide the best-fit spectra of these sources either described with a power-law function
| (1) |
or exponential cutoff power-law function from
| (2) |
as well as the uncertainties of these parameters, i.e., , , and . The flux uncertainty is evaluated via
| (3) |
noting that the last term in the square root should be dropped out if the spectrum is fitted with simply a power-law function without cutoff. The total flux is added up via where represents the spectrum of the th source in the list, and the uncertainty is calculated by .
On the other hand, the neutrino flux is obtained based on certain all-sky template for hadronic gamma-ray emissions in IceCube’s analysis (IceCube Collaboration et al., 2023). To compare with the hadronic emission from Galactic sources as discussed before, we exclude the region outside . The integrated flux of the remaining region is 50.2% and 71.9% of the all-sky integrated flux in TeV for the Fermi-LAT template and the KRA template respectively. The inferred gamma-ray fluxes in the ROI of derived from the neutrino measurement and that from hadronic sources are compared as shown in Fig. 1.
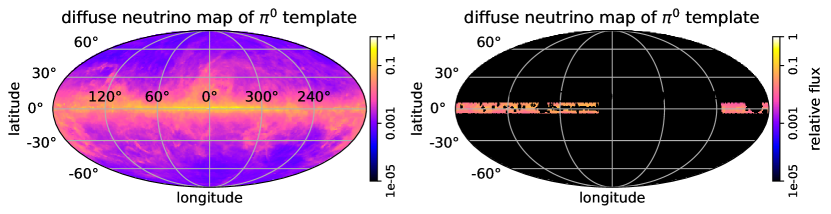
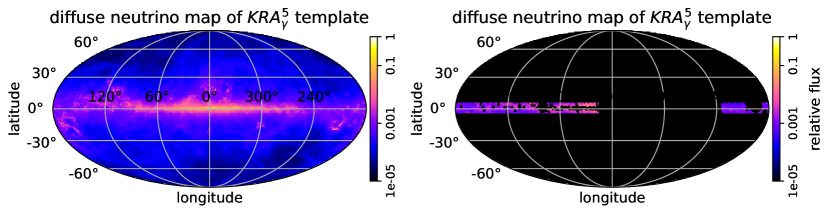
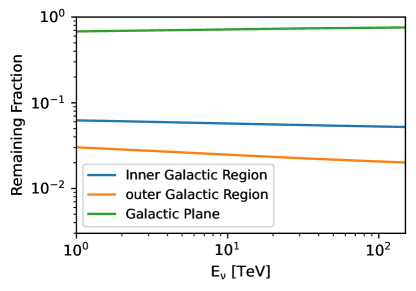
To obtain the DGE of the hadronic origin from the same region of LHAASO’s measurement, we need to further exclude the region outside and in the template and KRA template presented in the left panels of Fig. 7. We also need to mask the same region as that in LHAASO’s DGE analysis (Cao et al., 2023b). The remaining region is shown in Fig. 7. For the inner (outer) Galactic region (), the integrated flux of the remaining region is 6.87% (5.69%) and 5.74% (2.49%) of the all-sky integrated flux in TeV for the Fermi-LAT template and the KRA template respectively. Note that the KRA template is mildly energy dependent, and consequently the fraction of the remaining flux also changes with energy slowly for this template. This effect is considered in our analysis and the dependence of the fraction as a function of energy is shown in Fig. 8. The corresponding solid angle of the remaining region is 0.206 sr for the inner Galactic plane and 0.268 sr for the outer Galactic plane. The neutrino flux of single flavor (assuming a flavor ratio of after oscillation) is related to the co-produced gamma-ray flux of the hadronuclear origin by , where . The inferred DGE of the hadronic origin can be obtained via dividing the flux by the solid angle.
IV.2 Injection of Electron/Positron Pairs
We assume that pairs are injected in a power-law spectrum with a high-energy cutoff at a rate of
| (4) |
where is the normalization which is related to the spindown power of the pulsar by . The temporal evolution of the spindown power can be given by (Pacini and Salvati, 1973), simply assuming pulsars as a rotational magnetic dipole. The present spindown power can be obtained by once the rotational period and the first derivative of the period of the pulsar is measured, with being the pulsar’s moment of inertia which is taken to be a typical value of . Here is the initial spindown power of the pulsar and is the initial spindown timescale which can be derived given , and the initial rotational period . The initial rotational period of a pulsar is an unknown parameter, we here assume it to be
| (5) |
The cutoff energy in the injection spectrum describes the acceleration limit of the PWN and can be given by (de Jager and Harding, 1992; Amato and Olmi, 2021). is the fractional energy converted from kinetic energy of the pulsar wind to the magnetic energy at the pulsar wind termination shock, which is suggested to be for middle-aged pulsar (Yan and Liu, 2023). For simplicity, we take here for all pulsars. The beam-correction factor depends on the age or rotational period of the pulsar, which reads (Tauris and Manchester, 1998) where is the age of the pulsar, or . Both relations yield a similar beam-correction factor. The flux of each halo is divided by the corresponding beam-correction factor to account for the contribution of those off-beamed pulsar with similar properties.
To fit the DGE excess from TeV, we employ for both the 2ID model and the AD model with and 0.1 respectively, as shown in Fig. 5. If we only focus on the excess from TeV as measured by LHAASO, a broader range of and are available, e.g., a harder injection spectrum (i.e., a smaller ) and a smaller pair conversion efficiency (i.e., a smaller ) with a lower spectral cutoff energy (i.e., a smaller ).
IV.3 Models for Pulsar Halos
Two-zone Isotropic Diffusion (2ID) model
Under this model , the diffusion coefficient is suppressed in the inner zone to a radius of (typically a few tens of parsecs), and beyond the suppressed diffusion zone, a typical diffusion coefficient is assumed, i.e.,
| (6) |
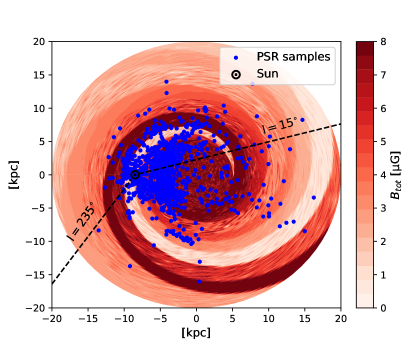
For simplicity we fix , , (Trotta et al., 2011). The analytical solution of particle distribution in both momentum space and real space in the 2ID model is given by Ref.(Tang and Piran, 2019; Di Mauro et al., 2019). For cooling of pairs, we consider synchrotron cooling in the Galactic magnetic field, and the IC cooling in the background radiation field including CMB and ISRF from the far infrared band to the ultraviolet band. The interstellar magnetic field strength around each pulsar is based on the model proposed by Jansson & Farrar (Jansson and Farrar, 2012a, b), as shown in Fig. 9. The Monte Carlo method is used to generate the magnetic field strength. The ISRF is based on the model proposed by Popescu et al. (Popescu et al., 2017).
Anisotropic Diffusion (AD) model
Under the AD model, the perpendicular diffusion coefficient is suppressed by a factor of with respect to the parallel diffusion coefficient , i.e., . We assume to be the typical diffusion coefficient in the ISM, i.e., same as in the 2ID model. We follow the analytical solution provided by Refs. (Fang et al., 2023; Delahaye et al., 2010) to calculate the distribution of pairs in both real space and energy space. The same GMF and ISRF are considered in this model to calculate the cooling of pairs. Note that injected pairs diffuse preferentially along the mean magnetic field direction in the AD model, and hence the magnetic field direction matters. Therefore, in addition to the magnetic field strength, we also need to consider the magnetic field direction in the AD model. The GMF in the JF12 model contains both a regular component and a random component. For the regular component, we can simply obtain the direction of the regular field around each pulsar based on the positions of the pulsar in the Milky Way. For the random striated component, the so called “ordered random fields”, is randomly assigned either a direction aligned with the regular component or anti-aligned with the regular component (Jansson and
Farrar, 2012a). For those “true random fields”, which may represent the influence of local astrophysical objects, we assign a random direction with an equal possibility in the solid angle. The final direction (as well as the strength) of the magnetic field is determined by the vector sum of the regular component and the random component.
2D Gamma-ray Intensity Map
After obtaining the pair distribution around each pulsar, we can calculate the gamma-ray emissivity of pairs through the IC process. By integrating the emission over the line of sight (LOS) toward a certain direction in the Galactic plane, we can project each gamma-ray halo onto the plane of the sky, and obtain the 2D intensity map composed of emissions from pulsar halos as shown in Fig. 3 and Fig. 4. For the 2ID model, we follow the projection method shown in Ref. (Liu et al., 2019b) to overlaid each pulsar halo in the Galactic plane. For the AD model, the projection method is detailed Ref. (Liu et al., 2019a) but additional procedure is carried out to minimize the possible bias arising from the randomly generated magnetic field direction, as the latter largely determines the morphology of pulsar halos in the AD model. To do this, we generate 10,000 realizations of the GMF, and obtain intensity maps in the Galactic plane composed of pulsar halos based on each of the realization of the GMF.
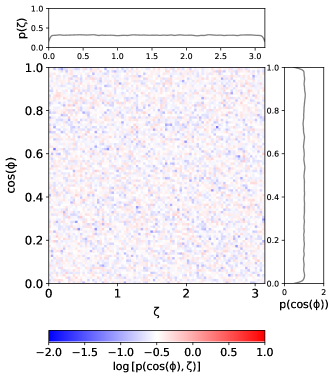
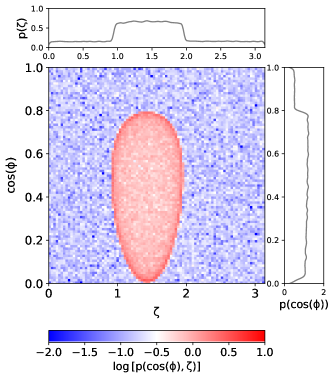
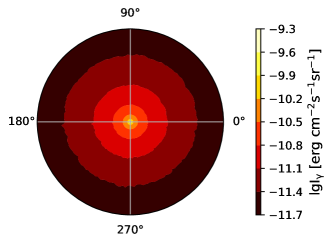
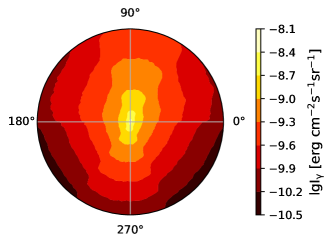
For reference, we show the 2D probability distribution of the magnetic field direction with respect to the cosine of the angle between the generated field and of the LOS (), and the azimuthal angle of projected field on the celestial plane () in Fig. 10. In left panels, we show a pulsar located in the magnetic field dominated by the random component. In this case, the probability distribution of and is almost homogeneous (the top-left panel) and the average expectation of the halo morphology is nearly isotropic (the bottom-left panel). On the contrary, if a pulsar located in the magnetic field dominated by the regular component, as shown in the right panels, the average magnetic field would have a preferential direction. This can be seen from the enhancement of the probability in the lower-middle part of the plane. The resulting halo is correspondingly elongated along the projected direction of the magnetic field in the celestial plane.
Finally, we average over all the generated gamma-ray intensity maps of the Galactic plane, and get the average expectation of the DGE contributed by pulsar halos under the AD model. Particularly, for the observed two pulsar halos around Geminga and Monogem, we restrict the inclination angle between the magnetic field and the LOS to be less than , in order to be consistent with the observed morphology of these two halos (Liu et al., 2019a).
IV.4 Model for CR-ISM interactions
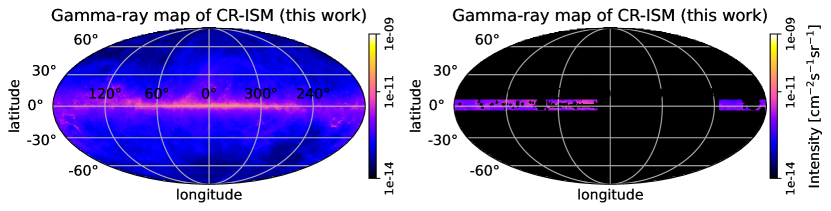
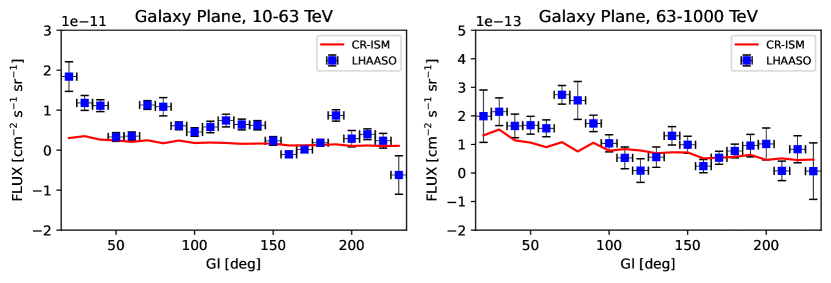
We model the CR-ISM interactions following the same method suggested in Refs. Zhang et al. (2023); Yuan et al. (2020). In addition to the generated pionic gamma-ray spectrum as already shown in Ref. Zhang et al. (2023), we also present the all-sky template (the top-left panel of Fig. 11) and the one after the mask (the top-right panel of Fig. 11). We then obtain the 1D Galactic longitudinal profile in the energy ranges of TeV and TeV, extracted from the same ROI of LHAASO’s DGE analysis. The results are compared with LHAASO’s measurement in the bottom panels of Fig. 11, based on which the flux ratio presented in Fig. 6 is obtained.
References
- Fichtel et al. (1975) C. E. Fichtel, R. C. Hartman, D. A. Kniffen, D. J. Thompson, G. F. Bignami, H. Ögelman, M. E. Özel, and T. Tümer, Astrophys. J. 198, 163 (1975).
- Bignami et al. (1975) G. F. Bignami, C. E. Fichtel, D. A. Kniffen, and D. J. Thompson, Astrophys. J. 199, 54 (1975).
- Atkins et al. (2005) R. Atkins, W. Benbow, D. Berley, E. Blaufuss, D. G. Coyne, T. De Young, B. L. Dingus, D. E. Dorfan, R. W. Ellsworth, L. Fleysher, et al., Phys. Rev. Lett. 95, 251103 (2005), eprint astro-ph/0502303.
- Bartoli et al. (2015) B. Bartoli, P. Bernardini, X. J. Bi, P. Branchini, A. Budano, P. Camarri, Z. Cao, R. Cardarelli, S. Catalanotti, S. Z. Chen, et al., Astrophys. J. 806, 20 (2015), eprint 1507.06758.
- Amenomori et al. (2021) M. Amenomori, Y. W. Bao, X. J. Bi, D. Chen, T. L. Chen, W. Y. Chen, X. Chen, Y. Chen, S. W. Cirennima, Cui, L. K. Danzengluobu, Ding, et al., Phys. Rev. Lett. 126, 141101 (2021).
- Stecker (1973) F. W. Stecker, Astrophys. J. 185, 499 (1973).
- Strong et al. (2010) A. W. Strong, T. A. Porter, S. W. Digel, G. Jóhannesson, P. Martin, I. V. Moskalenko, E. J. Murphy, and E. Orlando, Astrophys. J. Lett. 722, L58 (2010), eprint 1008.4330.
- Ackermann et al. (2012) M. Ackermann, M. Ajello, W. B. Atwood, L. Baldini, J. Ballet, G. Barbiellini, D. Bastieri, K. Bechtol, R. Bellazzini, B. Berenji, et al., Astrophys. J. 750, 3 (2012), eprint 1202.4039.
- Lipari and Vernetto (2018) P. Lipari and S. Vernetto, Phys. Rev. D 98, 043003 (2018), eprint 1804.10116.
- Cao et al. (2023a) Z. Cao, F. Aharonian, Q. An, Axikegu, Y. X. Bai, Y. W. Bao, D. Bastieri, X. J. Bi, Y. J. Bi, J. T. Cai, et al., arXiv e-prints arXiv:2305.17030 (2023a), eprint 2305.17030.
- Cao et al. (2023b) Z. Cao, F. Aharonian, Q. An, Axikegu, Y. X. Bai, Y. W. Bao, D. Bastieri, X. J. Bi, Y. J. Bi, J. T. Cai, et al., arXiv e-prints arXiv:2305.05372 (2023b), eprint 2305.05372.
- Linden and Buckman (2018) T. Linden and B. J. Buckman, Phys. Rev. Lett. 120, 121101 (2018), eprint 1707.01905.
- Liu and Wang (2021a) R.-Y. Liu and X.-Y. Wang, Astrophys. J. Lett. 914, L7 (2021a), eprint 2104.05609.
- Zhang et al. (2022) P.-P. Zhang, B.-Q. Qiao, Q. Yuan, S.-W. Cui, and Y.-Q. Guo, Phys. Rev. D 105, 023002 (2022), eprint 2107.08280.
- Vecchiotti et al. (2022) V. Vecchiotti, F. Zuccarini, F. L. Villante, and G. Pagliaroli, Astrophys. J. 928, 19 (2022), eprint 2107.14584.
- Yan and Liu (2023) K. Yan and R.-Y. Liu, Phys. Rev. D 107, 103028 (2023), eprint 2304.12574.
- Sun et al. (2023) D.-X. Sun, P.-P. Zhang, Y.-Q. Guo, W. Liu, and Q. Yuan (2023), eprint 2307.02372.
- IceCube Collaboration et al. (2023) IceCube Collaboration, R. Abbasi, M. Ackermann, J. Adams, J. A. Aguilar, M. Ahlers, M. Ahrens, J. M. Alameddine, A. A. Alves, N. M. Amin, et al., Science 380, 1338 (2023), eprint https://www.science.org/doi/pdf/10.1126/science.adc9818, URL https://www.science.org/doi/abs/10.1126/science.adc9818.
- Atoyan and Aharonian (1996) A. M. Atoyan and F. A. Aharonian, Mon. Not. R. Astron. Soc. 278, 525 (1996).
- Amato et al. (2003) E. Amato, D. Guetta, and P. Blasi, Astron. Astrophys. 402, 827 (2003), eprint astro-ph/0302121.
- Liu and Wang (2021b) R.-Y. Liu and X.-Y. Wang, Astrophys. J. 922, 221 (2021b), eprint 2109.14148.
- Acero et al. (2016) F. Acero, M. Ackermann, M. Ajello, A. Albert, L. Baldini, J. Ballet, G. Barbiellini, D. Bastieri, R. Bellazzini, E. Bissaldi, et al., Astrophys. J. Supp. 223, 26 (2016), eprint 1602.07246.
- Gaggero et al. (2015) D. Gaggero, D. Grasso, A. Marinelli, A. Urbano, and M. Valli, Astrophys. J. Lett. 815, L25 (2015), eprint 1504.00227.
- Ahlers and Murase (2014) M. Ahlers and K. Murase, Phys. Rev. D 90, 023010 (2014), eprint 1309.4077.
- Zhang et al. (2023) R. Zhang, X. Huang, Z.-H. Xu, S. Zhao, and Q. Yuan, arXiv e-prints arXiv:2305.06948 (2023), eprint 2305.06948.
- Vladimirov et al. (2011) A. E. Vladimirov, S. W. Digel, G. Jóhannesson, P. F. Michelson, I. V. Moskalenko, P. L. Nolan, E. Orlando, T. A. Porter, and A. W. Strong, Computer Physics Communications 182, 1156 (2011), eprint 1008.3642.
- Yuan et al. (2020) Q. Yuan, C.-R. Zhu, X.-J. Bi, and D.-M. Wei, J. Cosmol. Astropart. Phys. 2020, 027 (2020), eprint 1810.03141.
- Martin et al. (2022) P. Martin, L. Tibaldo, A. Marcowith, and S. Abdollahi, Astron. Astrophys. 666, A7 (2022), eprint 2207.11178.
- Dekker et al. (2023) A. Dekker, I. Holst, D. Hooper, G. Leone, E. Simon, and H. Xiao, arXiv e-prints arXiv:2306.00051 (2023), eprint 2306.00051.
- Liu (2022) R.-Y. Liu, International Journal of Modern Physics A 37, 2230011 (2022), eprint 2207.04011.
- López-Coto et al. (2022) R. López-Coto, E. de Oña Wilhelmi, F. Aharonian, E. Amato, and J. Hinton, Nature Astronomy 6, 199 (2022), eprint 2202.06899.
- Fang (2022) K. Fang, Frontiers in Astronomy and Space Sciences 9, 1022100 (2022), eprint 2209.13294.
- Giacinti et al. (2020) G. Giacinti, A. M. W. Mitchell, R. López-Coto, V. Joshi, R. D. Parsons, and J. A. Hinton, Astron. Astrophys. 636, A113 (2020), eprint 1907.12121.
- Manchester et al. (2005) R. N. Manchester, G. B. Hobbs, A. Teoh, and M. Hobbs, Astron. J. 129, 1993 (2005), eprint astro-ph/0412641.
- Fang et al. (2018) K. Fang, X.-J. Bi, P.-F. Yin, and Q. Yuan, Astrophys. J. 863, 30 (2018), eprint 1803.02640.
- Profumo et al. (2018) S. Profumo, J. Reynoso-Cordova, N. Kaaz, and M. Silverman, Phys. Rev. D 97, 123008 (2018), eprint 1803.09731.
- Liu et al. (2019a) R.-Y. Liu, H. Yan, and H. Zhang, Phys. Rev. Lett. 123, 221103 (2019a).
- Jansson and Farrar (2012a) R. Jansson and G. R. Farrar, Astrophys. J. 757, 14 (2012a), eprint 1204.3662.
- Jansson and Farrar (2012b) R. Jansson and G. R. Farrar, Astrophys. J. Lett. 761, L11 (2012b), eprint 1210.7820.
- Popescu et al. (2017) C. C. Popescu, R. Yang, R. J. Tuffs, G. Natale, M. Rushton, and F. Aharonian, Mon. Not. R. Astron. Soc. 470, 2539 (2017), eprint 1705.06652.
- Ma et al. (2022) X.-H. Ma, Y.-J. Bi, Z. Cao, M.-J. Chen, S.-Z. Chen, Y.-D. Cheng, G.-H. Gong, M.-H. Gu, H.-H. He, C. Hou, et al., Chinese Physics C 46, 030001 (2022).
- Tauris and Manchester (1998) T. M. Tauris and R. N. Manchester, Mon. Not. R. Astron. Soc. 298, 625 (1998).
- Actis et al. (2011) M. Actis, G. Agnetta, F. Aharonian, A. Akhperjanian, J. Aleksić, E. Aliu, D. Allan, I. Allekotte, F. Antico, L. A. Antonelli, et al., Experimental Astronomy 32, 193 (2011), eprint 1008.3703.
- Aartsen et al. (2021) M. G. Aartsen, R. Abbasi, M. Ackermann, J. Adams, J. A. Aguilar, M. Ahlers, M. Ahrens, C. Alispach, P. Allison, N. M. Amin, et al., Journal of Physics G Nuclear Physics 48, 060501 (2021), eprint 2008.04323.
- Hu et al. (2023) F. Hu, Z. Wei, W. Tian, Z. Ye, F. Zhang, Z. Sun, W. Zhi, Q. Chang, Q. Xue, Z. Li, et al., Nuclear Instruments and Methods in Physics Research A 1054, 168367 (2023), eprint 2302.05032.
- H. E. S. S. Collaboration et al. (2018a) H. E. S. S. Collaboration, H. Abdalla, A. Abramowski, F. Aharonian, F. Ait Benkhali, E. O. Angüner, M. Arakawa, M. Arrieta, P. Aubert, M. Backes, et al., Astron. Astrophys. 612, A1 (2018a), eprint 1804.02432.
- H. E. S. S. Collaboration et al. (2018b) H. E. S. S. Collaboration, H. Abdalla, A. Abramowski, F. Aharonian, F. Ait Benkhali, A. G. Akhperjanian, T. Andersson, E. O. Angüner, M. Arrieta, P. Aubert, et al., Astron. Astrophys. 612, A2 (2018b), eprint 1702.08280.
- Pacini and Salvati (1973) F. Pacini and M. Salvati, Astrophys. J. 186, 249 (1973).
- de Jager and Harding (1992) O. C. de Jager and A. K. Harding, Astrophys. J. 396, 161 (1992).
- Amato and Olmi (2021) E. Amato and B. Olmi, Universe 7, 448 (2021), eprint 2111.07712.
- Trotta et al. (2011) R. Trotta, G. Jóhannesson, I. V. Moskalenko, T. A. Porter, R. Ruiz de Austri, and A. W. Strong, Astrophys. J. 729, 106 (2011), eprint 1011.0037.
- Tang and Piran (2019) X. Tang and T. Piran, Mon. Not. R. Astron. Soc. 484, 3491 (2019), eprint 1808.02445.
- Di Mauro et al. (2019) M. Di Mauro, S. Manconi, and F. Donato, arXiv e-prints arXiv:1903.05647 (2019), eprint 1903.05647.
- Fang et al. (2023) K. Fang, H.-B. Hu, X.-J. Bi, and E.-S. Chen, arXiv e-prints arXiv:2304.04570 (2023), eprint 2304.04570.
- Delahaye et al. (2010) T. Delahaye, J. Lavalle, R. Lineros, F. Donato, and N. Fornengo, Astron. Astrophys. 524, A51 (2010), eprint 1002.1910.
- Liu et al. (2019b) R.-Y. Liu, C. Ge, X.-N. Sun, and X.-Y. Wang, Astrophys. J. 875, 149 (2019b), eprint 1904.11438.