Cosmological Tensions and the Transitional Planck Mass Model
Abstract
In this followup analysis, we update previous constraints on the Transitional Planck Mass (TPM) modified gravity model using the latest version of EFTCAMB and provide new constraints using SPT and Planck anisotropy data along with Planck CMB lensing, BAO, SNe Ia, and an prior from local measurements. We find that large shifts in the Planck mass lead to large suppression of power on small scales that is disfavored by both SPT and Planck. Using only SPT TE-EE data, this suppression of power can be compensated for by an upward shift of the scalar index to resulting in and a shift in the Planck mass. Including Planck TT and Planck TE-EE data restricts the shift to be at with . Excluding the prior, SPT and Planck data constrain the shift in the Planck mass to be at with a best-fit value of , consistent with the CDM limit. In this case , which is partially elevated by the dynamics of the scalar-field in the late universe. This differs from EDE models that prefer higher values of when high Planck TT data are excluded. We additionally constrain TPM using RSD data from BOSS DR 12 and cosmic shear, galaxy-galaxy lensing, and galaxy clustering data from DES Y1 finding both disfavor transitions close to recombination, but earlier Planck mass transitions are allowed.
tablenum \restoresymbolSIXtablenum
1 Introduction
The standard model of cosmology is the CDM model, which has undergone many independent tests that show good agreement with measurements from big bang nucleosynthesis (BBN) (Cyburt et al., 2016; Cooke et al., 2018), primary anisotropy from the cosmic microwave background (CMB) (Bennett et al., 2013; Planck Collaboration et al., 2020a; Dutcher et al., 2021; Aiola et al., 2020), the baryon acoustic oscillations (BAO) in galaxy distributions (Alam et al., 2021), and the present accelerated expansion of the universe (Brout et al., 2022). However, CDM is not a complete model. It only provides a phenomenological description of the dark matter and the dark energy instead of a more complete physics description.
Moreover in the last decade, cosmological parameter tensions have emerged in the determination of the Hubble constant, , and the clustering of matter, . The parameter is derived from a combination of the fractional matter density, , and the amplitude of matter fluctuations on a sphere of radius 8 h-1 Mpc, , that is given by .
In particular, the most precise CMB constraints today predict assuming the CDM model (Planck Collaboration et al., 2020a), while direct measurements using the cosmological distance ladder approach using Cepheid variable stars to calibrate Type Ia Supernova find (Riess et al., 2021). This discordance exists between several different cosmological probes, and, in general, early universe probes prefer lower values of while late universe probes prefer higher values of . For a review of the tension see Abdalla et al. (2022).
Similarly, there is also a clustering tension. In particular, Planck predicts a value of assuming CDM that is up to higher than the values measured by cosmic shear experiments such as the Dark Energy Survey (DES), the Kilo Degree Survey (KiDS), and the Hyper Suprime-Cam (HSC) (Abbott et al., 2022; Heymans et al., 2021; Li et al., 2023).
On the other hand, ACT DR 6 CMB lensing measurements find higher values of , which are in agreement with the value of preferred by primary CMB anisotropy measurements (Qu et al., 2023; MacCrann et al., 2023; Madhavacheril et al., 2023). This restricts the space of allowed cosmological models and may hint that the tension may not be cleanly divided between high and low redshifts. Additionally, a reanalysis of DES Y3 and KiDS-1000 cosmic shear measurements using a consistent hybrid pipeline for both finds the combined data are in only tension with the Planck measurement (DES+KiDS, 2023).
Nevertheless, these cosmological parameter tensions may provide hints of physics beyond CDM, which warrants explorations. Independently, testing the effect of relaxing assumptions made by CDM in data analyses is important as a test of the CDM model.
One of the most well-studied extensions to CDM in the last several years has been the broad class of early dark energy (EDE) models, which have been shown to alleviate the Hubble tension when fit to Planck data (Poulin et al., 2019; Lin et al., 2019; Niedermann & Sloth, 2019; Karwal et al., 2021; Sabla & Caldwell, 2022; McDonough et al., 2022; Lin et al., 2022).
In general, EDE models involve a scalar-field that becomes dynamical around matter-radiation equality and subsequently redshifts away faster than radiation. The scalar-field has a relativistic speed of sound and increases the expansion rate of the universe prior to recombination relative to the CDM case, which results in a lowering of the size of the sound horizon at the surface of last scattering. This in turn results in an increase in the Hubble constant value preferred by CMB and galaxy BAO data (see, e.g., Knox & Millea, 2020, for further details). For a review of the impact of EDE models on the Hubble tension see Di Valentino et al. (2021) and Schöneberg et al. (2022).
There have been numerous works that have shown that EDE models can alleviate but not fully resolve the Hubble tension between Planck and SH0ES when a prior on is included. However without the prior, this is not the case. Moreover, EDE models tend to fit large-scale-structure (LSS) data worse than CDM because of a preference for a large increase in the cold dark matter density (Hill et al., 2020; Ivanov et al., 2020; D’Amico et al., 2020).
It was shown by Vagnozzi (2020) that this results from an enhanced early integrated Sachs-Wolfe effect because of the faster than CDM expansion rate prior to recombination. To offset the enhanced decay of gravitational potential wells, more dark matter is needed, which results in increased clustering in the late universe and thus larger values of
In Benevento et al. (2022), hereafter B22, we proposed a modified gravity model called the Transitional Planck Mass (TPM) model to address the cosmological parameter tensions. The TPM model includes a scalar-field that is coupled to gravity and becomes dynamical prior to recombination. This causes the value of the Planck mass on cosmological scales to shift, which increases the background expansion rate prior to recombination while providing a greater gravitational attraction in the early universe to hold potential wells together.
While a time evolution of the gravitational attraction on cosmological scales is a common feature to many modified gravity models, the idea of an early time change has been explored only recently, in relation to cosmological tensions (see, e.g., Karwal et al., 2021; McDonough et al., 2021; Lin et al., 2022; Solà Peracaula et al., 2023).
In B22, we showed that a combination of Planck CMB anisotropy and lensing data along with BAO, Supernova, and an prior could provide meaningful constraints on the TPM model. In particular, the data preferred an approximately shift in the Planck mass some time prior to recombination. A greater gravitational attraction in the early universe was shown to be able to increase the preferred value of above while allowing for values less than , which alleviates both the Hubble and clustering tensions simultaneously.
Importantly, we found that the transition in the value of Planck mass could occur over multiple decades of scale factor growth prior to recombination eliminating the coincidence problem with many EDE models, which require transitions to occur near matter-radiation equality. Additionally, we found the data were insensitive to the shape of the transition implying that the results were robust to the details of how the transition in the Planck mass would have occurred. In the late universe, the scalar-field in the TPM model behaves like a dark energy component, and thus replaces the need for a cosmological constant. However, for the case without the prior, we found no statistically significant preference for the TPM model over CDM.
In this work, we expand the analysis of the TPM model using new combinations of cosmological data. In particular, we explore the effect of using primary CMB anisotropy data from the South Pole Telescope 3G camera (SPT) instead of Planck anisotropy data (Dutcher et al., 2021). We also study the effect of including both the SPT and Planck anisotropy data. This exploration of using alternative CMB data sets is important to assess consistency of the TPM model across all measurements.
These particular tests are additionally motivated by work that has shown that there is some preference for EDE in SPT and Atacama Cosmology Telescope (ACT) data alone and in combination with Planck anisotropy data where the CMB TT power spectrum is cut at (Hill et al., 2021; Poulin et al., 2021; Smith et al., 2022). The multipole cut at is done to replicate the TT power spectrum from the Wilkinson Microwave Anisotropy Probe (WMAP) (Bennett et al., 2013). In Smith et al. (2022), the full multipole range Planck TE and EE power spectra are also included. These tests find preferred values that are in better agreement with the SH0ES measurement even without requiring the SH0ES prior. It is therefore of interest to determine if there is a similar preference for TPM in these datasets.
In addition to studying the effect of changing the primary CMB anisotropy data, we also explore adding more LSS data in the form of redshift space distortion (RSD) from BOSS DR12 (Alam et al., 2021) as well as cosmic shear, galaxy-galaxy lensing, and galaxy clustering measurements from DES Y1 (Abbott et al., 2018). These measurements provide constraints on the clustering of matter in the universe.
In Section 2, we provide a brief summary of the theory, which is fully described in B22. In Section 3, we outline the numerical implementation of the TPM model and the observational data sets that we include to constrain the TPM model. In Section 4 and Section 5, we show the results of MCMC samplings of the TPM model parameters with alternative CMB data and LSS data, respectively. Finally, in Section 6, we provide conclusions to the results obtained and discuss potential future work.
2 Theory
In this section, we briefly summarize the TPM model theory, which was initially introduced in B22. In this work, we make no changes to the underlying theory describing the TPM model as was described in B22 but instead expand on the data sets that we use to constrain the TPM model. Therefore, we refer the curious reader to B22 for further details of the TPM model theory.
In the TPM model, there is a transition in the value of Planck mass in the pre-recombination universe such that the Planck mass on cosmological scales, , is different from the present day value of the Planck mass obtained from solar system measurements, .
To describe the transition in the Planck mass, we use the Effective Field Theory of Dark Energy and Modified Gravity (hereafter EFT) formalism (see, e.g., Frusciante & Perenon, 2020, for a review). The TPM model is described by a function that rescales the Planck mass on cosmological scales via . In particular, the transition in the Planck mass in the TPM model is described using an error function (ERF) given by
| (1) | |||
| (2) |
where sets the common log of the scale factor at which the Planck mass transitions from its initial value to its present value on cosmological scales. The parameter is the amplitude of the transition, and the parameter encodes how rapid the transition in the value of the Planck mass occurs.
Finally, the TPM model includes the parameter , which sets the dynamics of the scalar-field in the late universe. Qualitatively, the parameter acts like an equation of state parameter for the scalar-field in the late universe such that more negative values of correspond to more negative values of the equation of state parameter.
In some cases, we fix . We refer to this case as the TPM f(R) model because, as discussed in B22, this case can be described using the f(R) modified gravity formalism (see, e.g., Sotiriou & Faraoni, 2010, for a review on f(R) gravity).
3 Data Analysis
In this section, we outline the computational tools and techniques as well as the observational data that we use to constrain the TPM model parameters.
3.1 Numerical Implementation
For numerical calculations, we use EFTCAMB111https://github.com/EFTCAMB/EFTCAMB (Hu et al., 2014; Raveri et al., 2014). The EFTCAMB code is a modified version of the CAMB code (Lewis et al., 2000) that includes the EFT description of modified gravity and dark energy. In B22, the TPM model was implemented in EFTCAMB.
To sample the posterior distribution functions for the model parameters, we run Markov Chain Monte Carlo (MCMC) using EFTCosmoMC. The EFTCosmoMC code is built on the existing CosmoMC code (Lewis & Bridle, 2002), but uses EFTCAMB instead of CAMB. To assess the convergence of the MCMC chain, we use a Gelman-Rubin convergence statistic of (Gelman & Rubin, 1992). For each MCMC, we use flat priors on the TPM model parameters given by , , , and .
We determine the best-fit parameter values for all models using the BOBYQA algorithm (Powell, 2009) included in EFTCosmoMC and CosmoMC. For the starting point of the BOBYQA algorithm, we use the mean values from the MCMCs for each of the parameters.
We note that since the publication of the first TPM paper, B22, there have been updates to the EFTCAMB code that result in shifts in parameters at the level for both the TPM and CDM models. We compared the ability of the combination of EFTCAMB and EFTCosmoMC to recover the posterior distributions of parameters to the ability of the latest versions of CAMB and CosmoMC when assuming CDM. We replaced the Planck 2018 TTTEEE data with a best-fit theory model from the CDM fit to the Planck 2018 likelihood. For these power spectra, we do not include any sources of noise or cosmic variance. We ran MCMCs using both EFTCosmoMC and CosmoMC and find that in each case we recover the input CDM parameters to within . This implies that there is good agreement between the new versions of EFTCAMB/EFTCosmoMC and the new versions of CAMB/CosmoMC.
In all cases, we only solve the evolution of linear cosmological perturbations, as we do not currently have a prescription for the non-linear growth of matter perturbations in the TPM model.
3.2 Observational Data
In this subsection, we provide a summary of the data sets that we use to constrain the TPM model in this work. In B22, the TPM model was constrained by a Baseline likelihood that included Planck primary anisotropy and CMB lensing data as well as BAO, Supernova, and a local prior on .
In this work, we expand on this analysis and in particular explore the effects of replacing Planck primary anisotropy data with SPT 3G primary ansiotropy data as well as combining both data sets. In addition, we also constrain the TPM model using RSD and weak lensing measurements.
In the remainder of this subsection, we outline what data sets are used in this analysis. In all cases we include
We refer to this combination of data as the Base likelihood. These data sets were all included in the B22 TPM analysis. In addition to the Base data combination, we also include various combinations of SPT and Planck CMB primary anisotropy data. In particular, we will refer to these combinations as
-
•
SPT: Measurements of the TE and EE power spectra from SPT 3G over the multipole range (Dutcher et al., 2021). For cases where we do not include Planck Low EE data, we include a prior on .
-
•
Planck TTTEEE: Plik Lite 2018 TTTEEE along with Planck TT , and Planck Low EE data (Planck Collaboration et al., 2020b).
- •
Additionally we explore the ability of RSD and weak lensing measurements to constrain the TPM model. We will refer to these data as
-
•
RSD: Redshift space distortion measurements from BOSS DR 12 (Alam et al., 2017). These measurements are correlated with the other BOSS DR 12 BAO data meaning a combined BAO + RSD likelihood replaces the BAO likelihood above.
- •
Finally, we explore the effect that including a prior on has on the allowed parameter space for the TPM model. This prior is given by
- •
For some data combinations explored in this analysis, we combine Planck and SPT anisotropy data. For the cases where we combine Planck and SPT data, we make a multipole cut on Planck TT at 222For the Planck multipole cuts, we artificially increase the uncertainties in the Planck data covariance matrix for TT for the TT-TT, TT-TE, and TT-EE covariance blocks. We check that this method results in a with respect to the true of less than for the TPM model meaning we are recovering the correct to within this error.. Planck TT provides a good approximation for combining SPT data with WMAP data as has been explored in Hill et al. (2021) and Smith et al. (2022). Including a WMAP-like dataset provides a large angular scale anchor that complements SPT data.
Additionally, we include the full multipole range Planck TE and EE data to see how adding additional polarization data can tighten constraints on the TPM model. To a good approximation, the covariance between Planck TE or EE and SPT TE or EE is negligible because of noisier Planck polarization measurements, and the fact that SPT sky coverage comprises a small fraction of the total area covered by the Planck measurements (Dutcher et al., 2021; Balkenhol et al., 2022).
For weak lensing measurements, we include cosmic shear, galaxy-galaxy lensing, and galaxy clustering measurements from DES Y1. In all cases, we use the DES Y1 built in aggressive linear scale cuts because we do not currently have accurate modelling of the non-linear collapse of dark matter on small scales (Abbott et al., 2019). We note, however, that these scale cuts were made by the DES collaboration assuming the CDM model and the scale where non-linearities become relevant may in general be different for the TPM model.
4 Using SPT 3G Anisotropy Data to Constrain the TPM Model
In this section, we study the effect of fitting the TPM model to SPT primary anisotropy data instead of Planck. In particular, we use data from the SPT-3G camera, which operates from the South Pole and covers a survey field of approximately 1500 deg2 patch of the sky. In Section 4.1, we show the differences between using SPT versus Planck on the constraining power of the CDM and TPM parameters. In Section 4.2, we show parameter constraints from a combination of SPT and Planck anisotropy data. In Section 4.3, we provide discussions on the differences between the preferred TPM parameter values when fit to SPT or Planck data. For supplementary material related to the TPM model fits to each data sets, in Appendix A, we show the effect of including/excluding a prior on , and in Appendix B, we show the effect of fixing , which corresponds to the TPM f(R) case.
4.1 Fits to Either SPT or Planck Anisotropy Data
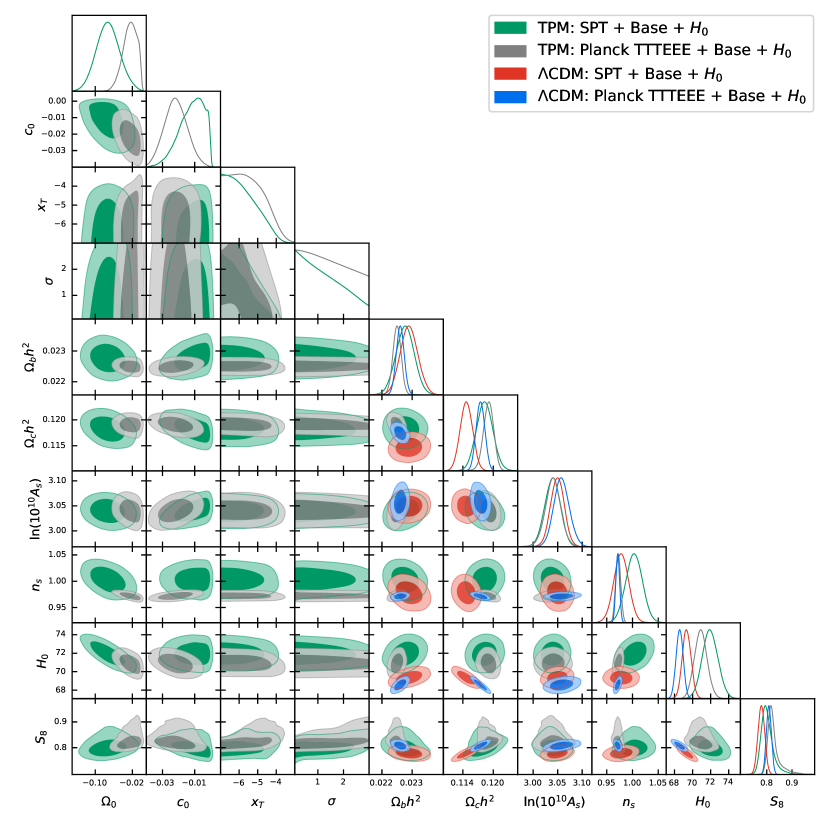
In this subsection, we compare how the CDM and TPM models fit to data combinations that include either SPT or Planck anisotropy data. In particular, we run MCMCs for both models in fits to Planck TTTEEE + Base + and SPT + Base + (see Section 3.2 for descriptions of each of these data sets). We show the resulting parameter constraints from the MCMCs in Table 1 and Figure 1.
| CDM: Planck TTTEEE | : Planck TTTEEE | CDM: SPT | : SPT | |
| + Base + | + Base + | + Base + | + Base+ | |
| 1.0413 () | 1.04139 (1.04135 0.00036) | 1.03992 () | 1.04039 ( ) | |
| 0.02261 (0.02261 0.00013) | 0.022505 (0.022498 0.00013) | 0.02288 (0.02290 0.00029) | 0.02271 (0.02277 0.00030) | |
| 0.11748 (0.11748 0.00086) | 0.11934 (0.11906 0.00099) | 0.1148 (0.1147 0.0012) | 0.1182 (0.1183 0.0016) | |
| 0.0615 () | 0.0532 (0.0528 0.0074 ) | 0.0556 (0.0563 0.0070) | 0.0610 (0.0543 0.071) | |
| 3.054 () | 3.043 (3.040 0.015) | 3.047 (3.049 0.014 ) | 3.049 (3.039 0.016) | |
| 0.9712 (0.9713 0.0036) | 0.9715 (0.9721 0.0048) | 0.978 (0.978 0.014) | 1.008 (1.003 0.016) | |
| - | -0.025 (> -0.058 at 95) | - | -0.073 (-0.072 0.025) | |
| - | -5.33 (-5.58 0.99) | - | -5.06 () | |
| - | 0.82 () | - | 1.35 () | |
| - | -0.02293 (-0.02174 0.0071) | - | -0.0111 (> -0.0287 at 95) | |
| 68.56 (68.57 0.39) | 70.94 ( ) | 69.32 () | 71.87 () | |
| 0.8076 (0.8091 0.0064) | 0.839 () | 0.7948 () | 0.830 () | |
| 0.8068 () | 0.815 () | 0.778 (0.779 0.013) | 0.794 () | |
| 589.78 | 585.69 | - | - | |
| 22.41 | 21.41 | - | - | |
| 397.70 | 395.83 | - | - | |
| - | - | 1120.67 | 1120.67 | |
| 9.575 | 8.82 | 8.95 | 9.17 | |
| 5.55 | 7.74 | 8.27 | 6.32 | |
| 1034.73 | 1037.08 | 1035.00 | 1035.23 | |
| 20.68 | 3.52 | 13.66 | 0.69 | |
| 0.22 | 0.09 | 0.66 | 0.41 | |
| 2081.39 | 2060.19 | 2187.20 | 2172.48 |
| Parameter | Shift () |
| -0.5 | |
| -0.9 | |
| 0 | |
| -0.2 | |
| -0.4 | |
| -0.6 | |
| 1.3 | |
| -0.3 | |
| 0.7 | |
| -0.6 | |
| -0.6 | |
| 0 | |
| 0 |
The Planck TTTEEE + Base + was the Baseline data combination explored in B22. As noted in Section 3.1, since the publication of B22, there have been some improvements in the EFTCAMB code that have resulted in shifts in parameter values. We find that these changes bring the EFTCAMB code into better agreement with the more recent CAMB releases. We report all of these shifts in model parameters in Table 2. The largest shift is a 1.3 higher (less negative) value for so that the data prefer approximately a shift in the Planck mass. Because the prior penalizes lower values of and smaller shifts in the Planck mass result in lower preferred values of , the parameter decreases (becomes more negative) relative to the value reported in B22 by to increase the preferred value of .
The combination of these changes still leads to a shift downward in relative to B22 by to . Thus the TPM model still reduces the Hubble tension between Planck CMB data and local measurements.
The TPM model fits the SPT + Base + data better than CDM. Quantitatively, the overall , though most of this improvement comes from the increase in the preferred value of (). We explore the effect of not including the prior in Appendix A. To summarize, we find that the TPM model fit to SPT + Base data has parameter posteriors with non-Gaussian tails that allow for , , and , though these parameter values are not the peaks of the posteriors.
The improvement found by the TPM model fit to SPT + Base + compared to the CDM fit to the same data is smaller than the corresponding improvement found by the TPM model fit to Planck TTTEEE + Base + compared to the CDM fit, .
Relative to the TPM fit to Planck TTTEEE + Base + , the TPM fit to SPT + Base + have broader posteriors for , , and , which are shown in Figure 1. Notably, these uncertainties are only marginally larger than the uncertainties on the corresponding parameters in the CDM fit to SPT + Base + .
These larger uncertainties on standard CDM parameters allow for more negative transitions in the Planck mass so that SPT + Base + prefers , which corresponds to a nonzero shift in the Planck mass at . As a result, the constraint on shifts to , which corresponds to a with the prior constraint from local measurements resolving the Hubble tension between these specific data. Note that this preference for a shift in the Planck mass is driven by the prior on .
These parameter shifts in and are compensated for by an increase in the scalar index to , which is notably larger than the value of preferred by the CDM fit to SPT + Base + . The TPM fit to SPT + Base + also has a shift upward in and shift downward in relative to the TPM fit to Planck TTTEEE + Base + . While the best-fit value of is lower for the TPM fit to SPT + Base + than the TPM fit to Planck TTTEEE + Base + , the best-fit value for the CDM fit to SPT + Base + is lower than both. This lower preferred values of for CDM fits to SPT is consistent with the results obtained in Dutcher et al. (2021).
For the remainder of the TPM model parameters, both the scale factor of the transition in the Planck mass, quantified by , and the rapidity of the transition, , are poorly constrained by both Planck and SPT anisotropy data. This implies that: 1) the transition is free to occur over several decades of scale factor, which removes the so-called "Why now?" problem with many EDE models, and 2) these results are robust to changes in the phenomenology of how the transition occurs.
Finally, the preferred value of the parameter is lower for the TPM fit to SPT + Base + than the TPM fit to Planck TTTEEE + Base + . The parameter acts like an equation of state parameter for the scalar field in the late universe. Lowering the value of leads to an increase in , so because the parameter already increases to be in agreement with the prior, there is less need for the parameter to be nonzero.
To summarize, we find that SPT anisotropy data have a broader allowed parameter space than the Planck anisotropy data, which allows for larger shifts in that resolve the Hubble tension between SPT and SH0ES. These shifts are compensated for by a shift upward in the scalar index to . While these shifts in the preferred values of and are driven by the prior, this part of parameter space is allowed within confidence intervals even when the prior is excluded.
4.2 Fits to Combined SPT and Planck Anisotropy Data
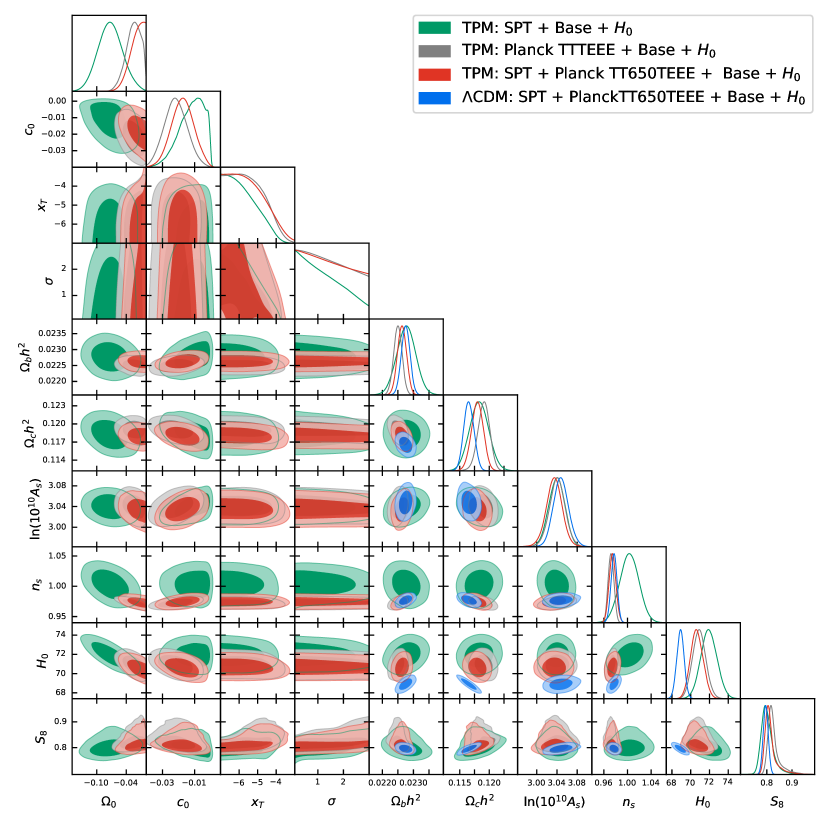
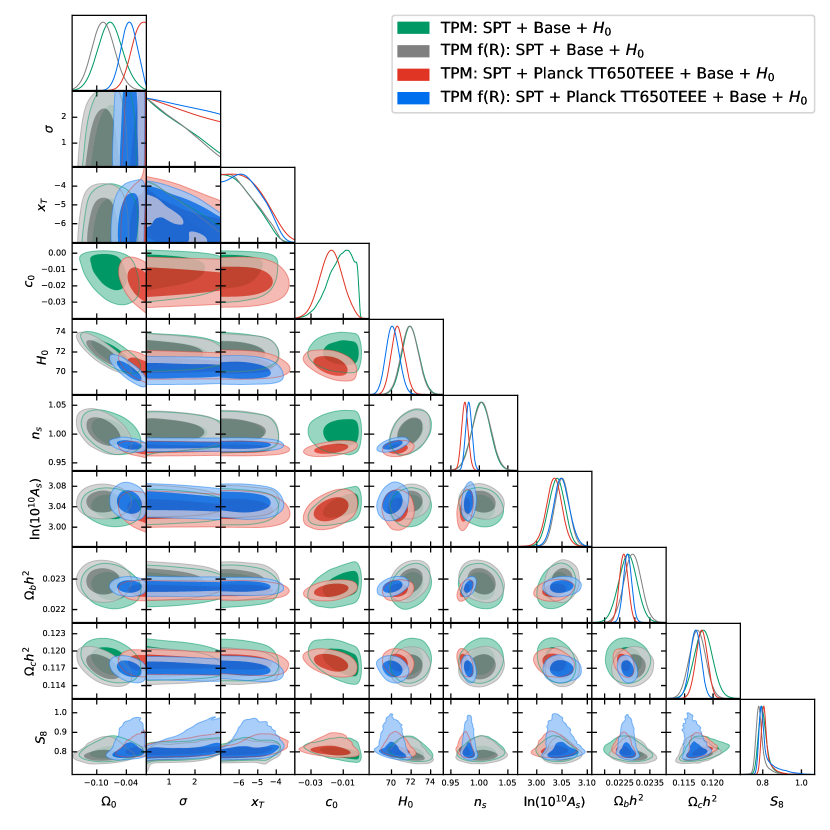
In this subsection, we explore the impact of combining SPT and Planck anisotropy data. In particular, we run MCMCs for both CDM and TPM fits to the SPT + Planck TT650TEEE + Base + likelihood combination (see Section 3.2 for descriptions of each of these data sets). We show the resulting parameter constraints from the MCMCs in Table 3 and Figure 2. In Figure 2, we additionally include posteriors from the TPM fits to SPT + Base + , the TPM fit to Planck TTTEEE + Base + , and the CDM fit to SPT + Planck TT650TEEE + Base + for comparison.
| CDM: SPT | : SPT | |
| + Planck TT650TEEE | + Planck TT650TEEE | |
| + Base + | + Base + | |
| 1.04093 (1.04092 0.00033) | 1.04091 () | |
| 0.02275 (0.02275 0.00014) | 0.02261 (0.02263 0.00014) | |
| 0.11652 () | 0.1182 (0.1179 0.0010) | |
| 0.0625 (0.0598 0.0074) | 0.0485 (0.0516 0.0075) | |
| 3.053 (3.048 0.015) | 3.027 (3.034 0.015) | |
| 0.9771 (0.9771 0.0050) | 0.9733 (0.9746 0.0057) | |
| - | -0.013 (> -0.051 at 95) | |
| - | -5.57 () | |
| - | 1.42 () | |
| - | -0.0205 (> -0.0311 at 95) | |
| 68.91 () | 70.60 (70.65 0.66) | |
| 0.8044 (0.8026 0.0064) | 0.825 () | |
| 0.7971 (0.7956 0.0099) | 0.802 () | |
| 445.73 | 445.53 | |
| 21.48 | 21.31 | |
| 397.74 | 395.73 | |
| 1122.85 | 1123.46 | |
| 10.36 | 8.37 | |
| 6.37 | 8.43 | |
| 1034.77 | 1037.11 | |
| 17.24 | 5.09 | |
| 0.20 | 0.26 | |
| 3056.76 | 3045.28 |
The TPM model fits the SPT + Planck TT650TEEE + Base + data better than CDM does with a combined . This is a smaller improvement for the TPM model over CDM than the corresponding improvement in the fits to SPT + Base + as well as the fits to Planck TTTEEE + Base + . Similar to both or these fits, most of the improvement found by the TPM model over CDM comes from a better fit to the prior. In this case, the improvement is meaning the TPM model fits the remaining data sets, collectively, slightly worse than CDM. We explore the effect of not including the prior in Appendix A where we find the Planck anisotropy data remove the non-Gaussian tails in and that allow for a resolution of the Hubble tension. We find that the best-fit value of , which is consistent with no transition in the Planck mass.
In general, the SPT + Planck TT650TEEE + Base + restrict the TPM model to refind the preferred values from the TPM fit to Planck TTTEEE + Base + . In particular, the constraint on , which is very close to the constraint from Planck TTTEEE + Base + given by . Similarly, the constraints on are and for with and without SPT data respectively. The best-fit value of for the CDM fit to SPT + Planck TT650TEEE + Base + is lower than the TPM best-fit value.
While the best-fit parameters for the TPM fits to Planck TTTEEE + Base + and SPT + Planck TT650TEEE + Base + tend to be similar, the best-fit values of and ln() for the TPM fit to SPT + Planck TT650TEEE + Base + are lower.
These shifts in the preferred values of and result from a tightening of parameter space for , , , and , which have comparable uncertainties to the uncertainties from the TPM fit to Planck TTTEEE + Base + . The inclusion of Planck TT650TEEE lowers the mean value of the scalar index to compared to . Notably, the best-fit value of from the CDM fit to SPT + Planck TT650TEEE + Base + is higher than the best-fit value for the TPM fit to the same data.
For the TPM model specific parameters, the amplitude of the transition of the Planck mass, quantified by the parameter, is constrained to be smaller than a shift at the 95 confidence level, which is a tighter constraint than when no SPT anisotropy data are included. Because the SPT + Planck TT650TEEE + Base + constrain the amplitude of the transition in the Planck mass more tightly than SPT + Base + do, the parameter shifts to more negative values to fit the prior similar to the constraint on from the TPM fit to Planck TTTEEE + Base + .
We show the results for the case where , which we refer to as the TPM f(R) case, in Appendix B. To summarize, we find that the amplitude of the transition of the Planck mass is constrained to be less than at the confidence level. This follows because the prior still shifts the preferred parameter space to find higher values of , but the TPM f(R) case cannot modify the parameter. The constraint on is roughly comparable to the full TPM model where the parameter is allowed to vary.
The phenomenology of the transition quantified by the timing of the transition, , and the rapidity of the transition , are still unconstrained for the TPM fit to SPT + Planck TT650TEEE + Base + .
We additionally tested the impact of combining SPT anisotropy data with the Planck TTTEEE likelihood. We find that we obtain qualitatively similar results with tighter constraints on parameters to the case when we use the Planck TT650TEEE likelihood. The choice of fitting the TPM model to SPT + Planck TT650TEEE + Base + in this work was done to highlight the difference between TPM and EDE. For EDE, SPT + Planck TT650TEEE data have been shown to prefer higher values of even without including an prior from local measurements (Smith et al., 2022). This is not the case for the TPM model, which emphasizes the importance of testing each cosmological model with all of the available data sets to evaluate the viability of a cosmological model.
Overall, we find that while SPT anisotropy data alone were less constraining of the TPM model and allowed for larger shifts in both the Planck mass and , the inclusion of Planck TT650TEEE restricts the allowed parameter space to be similar to the TPM fit to Planck TTTEEE + Base + limit, though with tighter constraints on the amplitude of the transition of the Planck mass. Moreover, the improvement found by the TPM model over CDM for the combination of Planck and SPT data is smaller than for either data set alone.
4.3 Understanding the Differences Between Preferred Cosmology by SPT and Planck
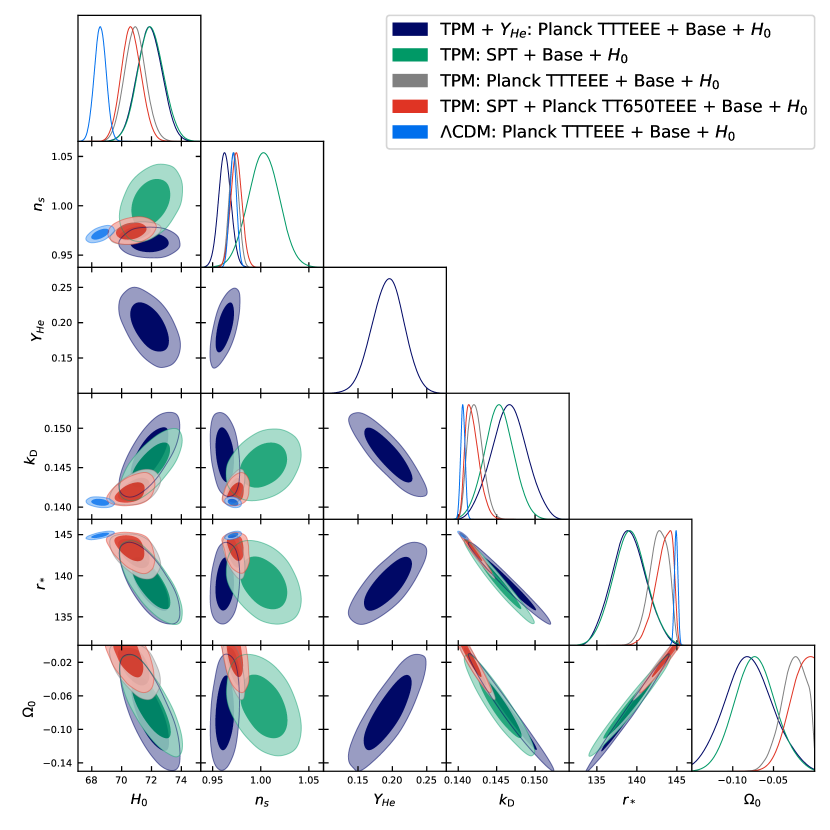
In this subsection, we explore the differences between the preferred parameter values for the TPM fit to SPT + Base + and the TPM fit to Planck TTTEEE + Base + . In particular, we run an additional MCMC for the TPM fit to Planck TTTEEE + Base + where we allow the helium fraction, , to vary. As discussed in Hou et al. (2013), the helium fraction only enters the CMB anisotropy calculations through the ionization fraction of electrons, which directly affects the CMB damping tail. While the helium fraction does have some effect on the size of sound horizon, this is subdominant to the effect on the damping scale.
We show the results of the TPM + fit to Planck TTTEEE + Base + in Table 4 and Figure 3. The constraint on for the TPM + fit to Planck TTTEEE + Base + is given by , which is lower than the BBN consistency relation between and the physical baryon density even given the larger uncertainties when the helium fraction is allowed to vary. Additionally, these low values of conflict with more direct empirical estimates of the primordial helium abundance (see, e.g. Fields et al., 2020, for a review). The TPM fits with varying are nevertheless valuable for elucidating the differences between the constraining power of SPT and Planck data.
Allowing the helium fraction to vary in the TPM fit to Planck TTTEEE + Base + results in a further opening of the degeneracy between the sound horizon, , and to match the degeneracy found when TPM is fit to SPT + Base + as shown in Figure 3. Because the primary effect on CMB anisotropy calculations of varying the helium mass is to affect the physics of diffusion damping on small scales, and decreasing the helium fraction results in an increase in power on small scales or less diffusion damping, we conclude that the TPM model prefers a suppression of power on small angular scales that is disfavored by Planck TTTEEE data. Varying the helium fraction within the TPM model means there are now two new parameters, and , that affect the small angular scale CMB power spectra in ways that can cancel out.
This suppression of power on small angular scales by the TPM model is consistent with results shown in Figure 3 of B22, which shows that the best-fit TPM model prefers a suppression of power on small scales in both the TT and EE power spectra. This occurs because the angular size of the sound horizon, , and the angular size of the damping scale, , are both dependent on the same angular diameter distance to the surface of last scattering. The CMB measurements constrain the angles and meaning lowering the sound horizon results in a drop of to compensate. This in turn shifts the physical size of the damping scale, , which sets the physical scale of CMB anisotropy suppression.
So do SPT data prefer this suppression of power on small angular scales? Fitting the TPM model to SPT + Base + data results in a large increase in . This suggests that the SPT data also do not favor the suppression of power on small angular scales favored by larger amplitude transitions in the Planck mass, but that the data allow for shifts in parameters like . Increasing shifts power in the primordial power spectrum from large angular scales to small angular scales meaning that more negative transitions in the Planck mass, which are necessary to resolve the Hubble tension within the TPM model, can be compensated for by increasing . This can be seen in the increases in the preferred value of for the TPM model compared to CDM for both fits to SPT + Base + and Planck TTTEEE + Base + , which shown in Table 1.
When the TPM model is fit to the SPT + Base + data, is allowed to increase so that , which in turn allows for large enough shifts in the Planck mass to bring into agreement with the prior. This results from the fact that SPT anisotropy data do not have a low multipole anchor to constrain at the same level as the full Planck anisotropy data.
Therefore, there is more freedom in parameter space to increase and shift power from large angular scales to small angular scales. However, additionally including Planck TT650TEEE constrains the large angular scales and complements the SPT data allowing for a tighter constraint on . This is why the best-fit values of and as a result are lower when Planck TT650TEEE are added to SPT data.
In both the TPM fit to SPT + Base + data and the Planck TTTEEE + Base + data, the CMB anisotropy data do not prefer the suppression of power on small angular scales necessary to resolve the Hubble tension within the TPM model, but SPT data allow for larger shifts of parameters like , which allows it to compensate for the small-scale suppression of power.
| CDM | CDM + | + | ||
| 1.0413 ( ) | 1.0416 () | 1.4139 (1.04135 0.00036 ) | 1.04064 (1.04038 0.00055 ) | |
| 0.002261 (0.02261 0.00013) | 0.022699 (0.022692 0.00017) | 0.022505 (0.022498 0.00013) | 0.02219 (0.02210 0.00021) | |
| 0.11748 (0.11741 0.00086) | 0.1177 (0.1176 0.00086) | 0.1193 (0.11906 0.00099) | 0.1190 () | |
| 0.0615 () | 0.0631 () | 0.0532 (0.0528 0.0074) | 0.0525 () | |
| 3.054 () | 3.059 (3.062 0.016) | 3.043 (3.040 0.015) | 3.035 (3.034 0.016) | |
| 0.9712 (0.9713 0.0036) | 0.9753 () | 0.9715 (0.9721 0.0048) | 0.9654 (0.9627 0.0063) | |
| - | - | -0.025 (> -0.058 at 95) | -0.069 (-0.080 0.029) | |
| - | - | -5.33 (-5.58 0.99) | -4.61 () | |
| - | - | 0.82 () | 0.924 () | |
| - | - | -0.02293 (-0.02174 0.0071) | -0.0183 (>-0.031 at 95) | |
| 68.56 (68.57 0.39) | 68.69 (68.71 0.42 ) | 70.94 () | 71.74 (71.87 0.84) | |
| 0.8076 (0.8079 0.0064) | 0.8115 () | 0.839 () | 0.853 () | |
| 0.8068 () | 0.810 (0.810 0.010) | 0.815 () | 0.818 () | |
| 0.246810 () | 0.257 (0.257 0.012) | 0.246761 (0.246770 0.000051) | 0.206 (0.195 0.023) | |
| 589.78 | 590.63 | 585.69 | 585.22 | |
| 22.41 | 21.92 | 21.41 | 21.29 | |
| 397.70 | 398.24 | 395.83 | 395.83 | |
| 9.575 | 9.46 | 8.82 | 8.27 | |
| 5.55 | 5.65 | 7.74 | 6.7 | |
| 1034.73 | 1034.73 | 1037.08 | 1035.89 | |
| 20.68 | 19.36 | 3.52 | 0.96 | |
| 0.22 | 0.04 | 0.09 | 0.03 | |
| 2081.39 | 2080.03 | 2060.19 | 2054.19 |
5 Including Additional Large Scale Structure Data: BOSS Redshift Space Distortions and DES Y1 Cosmic Shear, Galaxy-Galaxy Lensing, and Galaxy Clustering
In this section, we explore how additional LSS data can be used to constrain the TPM model. In particular, we look at two additional data sets, the BOSS RSD and DES Y1 cosmic shear, galaxy-galaxy lensing, and galaxy clustering measurements. We show the results of including RSD measurements in Section 5.1 and the results of including the DES Y1 cosmic shear, galaxy-galaxy lensing, and galaxy clustering measurements in Section 5.2.
5.1 BOSS Redshift Space Distortions
| CDM: Planck TTTEEE | : Planck TTTEEE | CDM: Planck TTTEEE | : Planck TTTEEE | |
| + Base + | + Base + | + Base + + RSD | + Base+ + RSD | |
| 1.04130 () | 1.04139 (1.04135 0.00036) | 1.04121 (1.04124 0.00029) | 1.04141 (1.04138 0.00036) | |
| 0.02261 (0.02261 0.00013) | 0.022505 (0.022498 0.00013) | 0.02256 (0.02259 0.00013) | 0.022514 (0.022503 0.00013) | |
| 0.11748 (0.11748 0.00086) | 0.1193 (0.11906 0.00099) | 0.1178 () | 0.11913 (0.11924 0.00092) | |
| 0.0615 () | 0.0532 (0.0528 0.0074 ) | 0.0601 () | 0.0543 (0.0530 0.0076) | |
| 3.054 () | 3.043 (3.040 0.015) | 3.053 (3.056 0.015) | 3.044 (3.041 0.015) | |
| 0.9712 (0.9713 0.0036) | 0.9715 (0.9721 0.0048) | 0.9700 (0.9709 0.0035) | 0.9721 (0.9723 0.0049) | |
| - | -0.025 (> -0.058 at 95) | - | -0.028 (> -0.061 at 95) | |
| - | -5.33 (-5.58 0.99) | - | -5.58 (-) | |
| - | 0.82 () | - | 1.03 () | |
| - | -0.02293 (-0.02174 0.0071) | - | -0.0196 (> -0.0323 at 95) | |
| 68.56 (68.57 0.39) | 70.94 ( ) | 68.40 (68.50 0.38) | 70.81 (70.74 0.68) | |
| 0.8076 (0.8091 0.0064) | 0.839 () | 0.8077 (0.8088 0.0062) | 0.834 () | |
| 0.8068 () | 0.815 () | 0.8094 (0.8092 0.0097) | 0.811 () | |
| 589.78 | 585.69 | 588.73 | 586.83 | |
| 22.41 | 21.41 | 22.58 | 21.30 | |
| 397.70 | 395.83 | 397.30 | 396.00 | |
| 9.575 | 8.82 | 9.45 | 8.46 | |
| 5.55 | 7.74 | 7.94 | 11.49 | |
| 1034.73 | 1037.08 | 1034.75 | 1036.39 | |
| 20.68 | 3.52 | 22.36 | 4.10 | |
| 0.22 | 0.09 | 0.31 | 0.00 | |
| 2081.39 | 2060.19 | 2083.42 | 2064.56 |
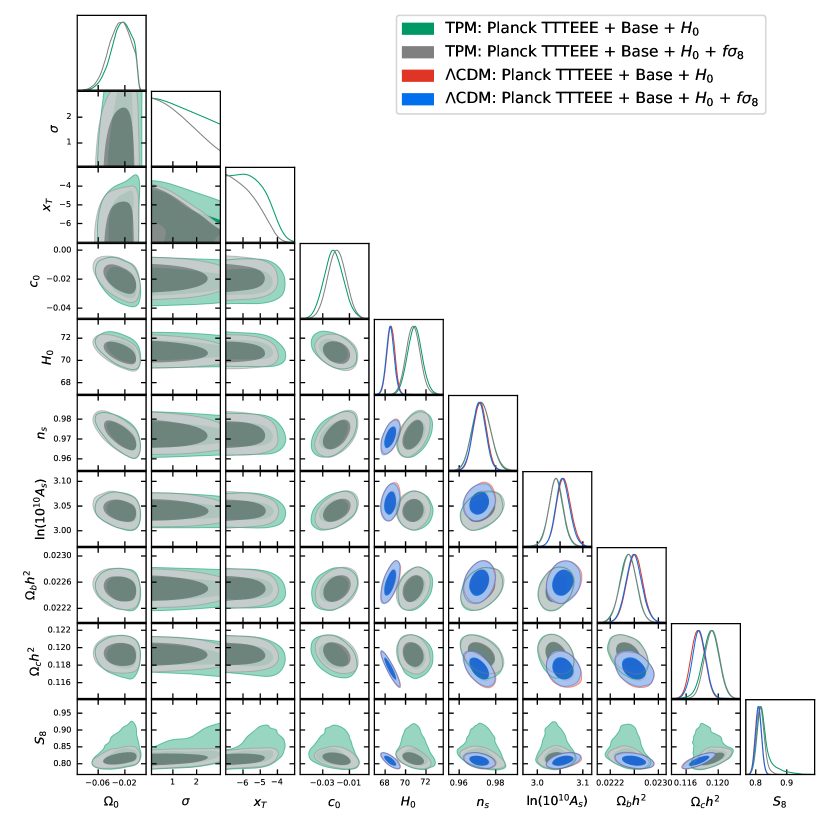
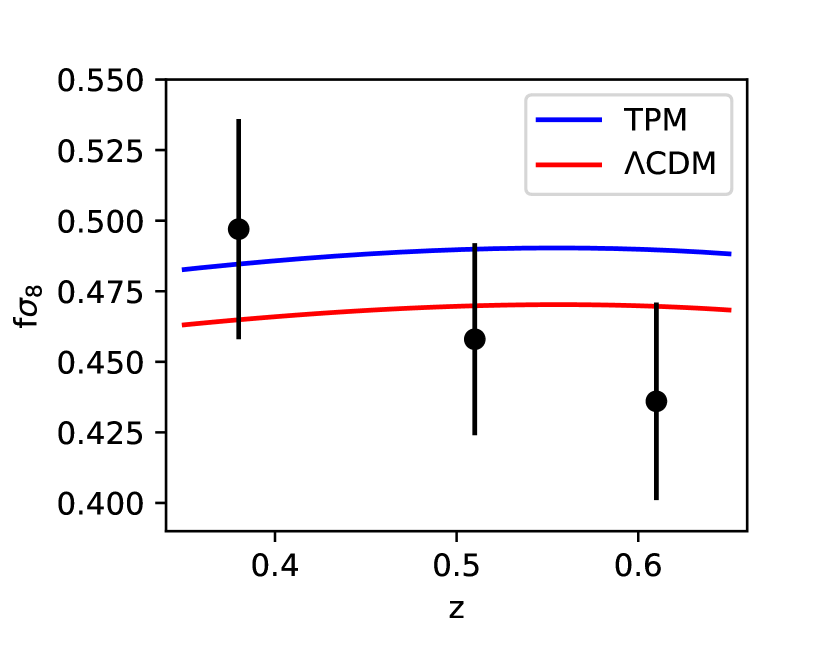
We use the constraints from BOSS DR 12 measurements in Alam et al. (2017) to constrain the TPM model. In particular, we run an MCMC of the TPM model fitting the Planck TTTEEE + Base + RSD + (see Section 3.2 for details of the RSD likelihood). The BOSS DR 12 RSD measurements primarily constrain the parameter combination at redshifts 0.38, 0.51, and 0.61. Here is the linear growth rate where is the growth factor related to the density perturbations . We show the results of this MCMC in Figure 4 and Table 5.
In general, we find that the RSD measurements do not add significant new constraints to the TPM model over the existing TPM constraints from Planck TTTEEE + Base + . The primary change is that the non-Gaussian tail present in the posterior distribution function for for the TPM model fit to the Planck TTTEEE + Base + is removed.
In B22, we showed that values in this non-Gaussian tail result from transitions that happen closer to recombination. This is supported by Figure 4, which shows that the values of that are closest to recombination are removed from the posteriors for the TPM fit to Planck TTTEEE + Base + + RSD compared to the posteriors for the TPM fit to Planck TTTEEE + Base + .
In the TPM model, matter perturbation modes that enter the horizon during the transition in the Planck mass are enhanced relative to those modes that enter after the transition. Therefore, later transitions (closer to recombination) result in enhanced matter perturbation modes for larger wavelength or smaller wavenumber modes relative to the CDM case. This in turn affects the growth of structure and in general leads to an increased as shown in Figure 5.
The TPM model fits the Planck TTTEEE + Base + RSD + better than CDM with a cumulative , which is smaller than the equivalent improvement when the RSD data are not included, .
While the addition of the constraints from RSD measurements are not constraining enough to rule out the TPM model entirely, these RSD measurements do disfavor later transitions (closer to recombination) that result in relatively large values of . As a result, the part of the TPM parameter space that allows for and when fit to Planck TTTEEE + Base + are still allowed.
5.2 DES Y1
| CDM: Planck TTTEEE | f(R): Planck TTTEEE | CDM: Planck TTTEEE | f(R): Planck TTTEEE | |
| + Base + | + Base + | + Base + + DES | + Base + + DES | |
| 1.04130 () | 1.04186 (1.04184 0.00034) | 1.04128 (1.04129 0.00029) | 1.04178 (1.04185 0.00034) | |
| 0.02261 (0.02261 0.00013) | 0.02264 (0.02262 0.00013) | 0.022635 (0.022642 0.00013) | 0.022659 (0.022660 0.00013) | |
| 0.11748 (0.11748 0.00086) | 0.11832 () | 0.11717 () | 0.11796 (0.11782 0.00086) | |
| 0.0615 () | 0.0621 (0.0626 0.0077) | 0.0617 () | 0.0621 (0.0618 0.0075) | |
| 3.054 () | 3.061 (3.062 0.015) | 3.053 (3.054 0.015) | 3.062 (3.060 0.015) | |
| 0.9712 (0.9713 0.0036) | 0.9791 (0.9800 0.0045) | 0.9717 () | 0.9802 (0.9806 0.0044) | |
| - | -0.051 (-0.050 0.016) | - | -0.049 (-0.050 0.015) | |
| - | -5.52 (-) | - | -5.66 (-5.66 0.92) | |
| - | 1 (fixed) | - | 1 (fixed) | |
| - | 0 (fixed) | - | 0 (fixed) | |
| 68.56 (68.57 0.39) | 70.28 () | 68.70 (68.76 0.37) | 70.35 (70.45 0.65) | |
| 0.8076 (0.8091 0.0064) | 0.816 () | 0.8064 (0.8064 0.0061) | 0.816 () | |
| 0.8068 () | 0.798 () | 0.8032 () | 0.796 () | |
| 589.78 | 595.08 | 589.58 | 593.73 | |
| 22.41 | 20.73 | 22.26 | 20.62 | |
| 397.70 | 398.00 | 397.71 | 397.95 | |
| 9.575 | 9.28 | 9.28 | 9.16 | |
| 5.55 | 5.28 | 5.82 | 5.44 | |
| 1034.73 | 1034.75 | 1034.74 | 1034.74 | |
| 20.68 | 6.83 | 19.28 | 6.45 | |
| - | - | 320.28 | 320.66 | |
| 0.22 | 0.14 | 1.59 | 1.79 | |
| 2081.39 | 2070.09 | 2400.63 | 2390.54 |
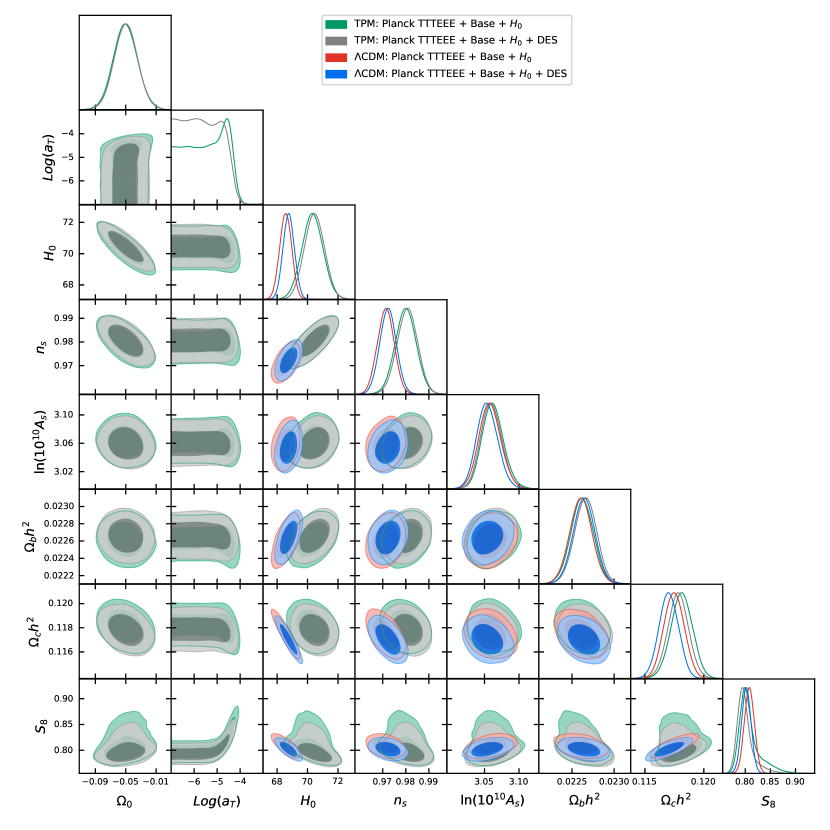
In this subsection, we explore how including weak lensing data can constrain the TPM model. In particular, we combine DES Y1 cosmic shear, galaxy-galaxy lensing, and galaxy clustering data with Planck TTTEEE + Base + . This collection of weak lensing data is typically referred to as a 3x2 point analysis. The Dark Energy Survey is a photometric survey. The DES Y1 data include measurements from the first year of the survey and cover 1321 deg2 of the sky. See Section 3.2 for details of the DES Y1 data including cuts in wavenumber that we make to only include linear scales.
We note that while the TPM model tends to prefer lower values of when fit to Planck TTTEEE + Base + data, it is unclear whether this will actually be in better agreement with weak lensing data. In particular, B22 showed that the TPM model lowers relative to CDM when fit to Planck TTTEEE + Base + data by lowering the fractional matter density, , while either does not change much or increases relative to CDM. Notably, in DES+KiDS (2023), it is shown that there is good agreement between cosmic shear measurements and Planck on the determination of but not or highlighting a possibility that the TPM model could fit both data better. It is therefore of interest to see how the TPM model compares when fit to actual cosmic shear data.
We run an MCMC of the TPM model fit to Planck TTTEEE + Base + DES Y1 + data. For this MCMC, we restrict , which corresponds to the TPM f(R) case. We additionally restrict . These choices were made because we found numerical instabilities when evaluating the DES Y1 likelihood. Sometimes numerical instabilities correspond to unphysical situations, but that is not the cause in this case. For only the TPM fit to Planck TTTEEE + Base + DES Y1 + , we use a Gelman-Rubin convergence criteria of R-1 = 0.02. For comparison, we also run an MCMC of the CDM model fit to Planck TTTEEE + Base + DES Y1 + data. We show the results of these MCMCs in Figure 6 and Table 6.
In general, we find similar results for the TPM fit to Planck TTTEEE + Base + DES Y1 + as for the TPM fit to Planck TTTEEE + Base + RSD + . The primary effect of including the DES Y1 data is to reduce the upper bounds for the parameter. In this case, the 95 confidence interval for the TPM fit to Planck TTTEEE + Base + DES Y1 + is higher than the 95 confidence interval for the TPM fit to Planck TTTEEE + Base + RSD + . The uncertainty for is approximately 1.4 times smaller for the TPM fit to Planck TTTEEE + Base + DES Y1 + compared to the TPM fit to Planck TTTEEE + Base + .
In summary we find that the DES Y1 data are not sufficiently constraining to significantly affect the TPM model parameter space allowed by Planck, BAO, and Supernova measurements, though DES Y1 data does slightly restrict the non-Gaussian tail for the parameter similar to the inclusion of the RSD data. Including DES Y3 data, which provides three times the sky coverage as well as increased depth of field, may provide tighter constraints, though we note that there are some internal inconsistencies in the lens sample galaxies from MagLim and redMaGiC for galaxy clustering and galaxy-galaxy lensing measurements (Abbott et al., 2022; Rodríguez-Monroy et al., 2022; Pandey et al., 2022; Elvin-Poole et al., 2023). Additionally, including non-linear and quasi-non-linear scales might also provide improvement in constraining power, but this would require the ability to model the nonlinear collapse of dark matter. This would require either full N-body simulations or hybrid perturbation-N-body simulations such as COLA simulations (see, e.g., Tassev et al., 2013) of the TPM model.
6 Conclusions
In this followup analysis to the original TPM analysis performed in B22, we explored the constraining power of using alternative primary CMB anisotropy data in the form of SPT 3G and alternative LSS measurements in the form of RSD measurements from BOSS DR12 and weak lensing measurements from DES Y1.
We find that SPT 3G primary anisotropy data are in general less constraining of the TPM model than Planck anisotropy data, which would allow for the TPM model to resolve the Hubble tension between specifically SPT data and local measurements in the absense of other cosmological information. In particular, we highlight the large shift in the mean value and larger uncertainty of for the case when TPM is fit to SPT CMB data along with BAO, Supernova, Planck CMB lensing, and an prior. This is accompanied by a shift in the amplitude of the transition in the Planck mass (or graviational strength) to . This shift in the Planck mass is nonzero at 2.9, but we caution that this preference for a shift in is driven by the prior on from local measurements.
While the TPM model fit to these data results in an increase in to be in better agreement with the prior compared to the CDM fit to the same data, we note that the preferred values of are slightly higher. When the prior is excluded, the large transitions in the Planck mass and higher preferred values are still allowed by these data at the 95 confidence level, but these parameter values are found in the non-Gaussian tails of the posterior parameter distributions. The best-fit values are and .
When we additionally include Planck TT650TEEE, we find that the constraint on the scalar index shifts to and the shift in the Planck mass is constrained to be smaller than 5.1 at the 95 confidence level. In this case, the Hubble tension is still alleviated with , though this is helped by a more negative parameter relative to the case with only SPT anisotropy data. From the perspective of the TPM model, shifts in the are less well-motivated because the primary effect of the TPM phenomenology is to change the Planck mass in the early universe. Altering the parameter is interesting, but can be explored more directly using scalar-field models of dark energy in the late universe. Notably, the constraints from this combination are slightly tighter than but still consistent with the constraints from Planck TTTEEE + Base + .
Again the improvement found by TPM over CDM is driven entirely by the prior. Without this prior, we find a best-fit value of , and the amplitude of the transition of the Planck mass is constrained to be smaller than 3 at the 95 confidence level. The best-fit value of the amplitude of transition is 0.04, which is consistent with the CDM limit of no change in the Planck mass.
We conclude that large amplitude transitions in the Planck mass result in a suppression of power on small angular scales that are disfavored by SPT and Planck data, but SPT data allow for a large shift upward in that can offset this suppression on small scales. The inclusion of the Planck anisotropy data restricts the allowed parameter space for , and thus limits the TPM model’s ability to resolve the Hubble tension.
One of the main goals of this work was to explore whether the same behavior found by EDE model fits to SPT/ACT data would also be true for the TPM model. In Smith et al. (2022), EDE was found to produce higher values without including a prior on when fit to SPT + Planck TT650TEEE. We find that the TPM model does not also exhibit this behavior. We could constrain the TPM model using ACT primary anisotropy data similar to the EDE fits to ACT both with and without Planck anisotropy data. Additionally, while completing this work, we became aware of the public likelihood of SPT data that includes the TT power spectrum (Balkenhol et al., 2022). We did not use these data sets because the tests using SPT TE and EE data already did not prefer higher values of . The different behavior between TPM and EDE is noteworthy because it highlights the fact that not all models that phenomenologically increase the expansion rate prior to recombination to lower the sound horizon and resolve the Hubble tension will fit the available data in a similar way.
In addition to exploring the ability of SPT data to constrain the TPM model, we also tested the impact of including alternative LSS data. We found that the inclusion of BOSS growth of structure measurements on resulting from redshift space distortions (RSD) do not significantly alter the allowed TPM parameter space. However, the RSD measurements do restrict the non-Gaussian tail present in the posterior distribution for . In B22, we showed that this non-Gaussian tail results from transitions in the Planck mass that occur closer to recombination.
In addition to growth of structure measurements, we tested the impact of including cosmic shear, galaxy-galaxy lensing, and galaxy clustering measurements from DES Y1. Because the TPM model does not have a proper description of the non-linear collapse of dark matter, we restricted the DES Y1 weak lensing data only include linear scales. We find that these data do not add any significant constraining power when Planck primary anisotropy and lensing data as well as BAO and Supernova data are already included. However, the inclusion of DES Y1 does slightly restrict the parameter space for similar to the inclusion of RSD data. We conclude that low redshift probes of the matter power spectrum and the growth of structure could constrain the TPM model and particularly the phenomenology of the transition itself.
Cosmic shear data along with galaxy-galaxy lensing and galaxy clustering from DES Y3, KiDS, and HSC Y3 may also be able to constrain some of the phenomenology of the transition of the TPM model including the rapidity transition and the timing of the transition. However, the data included in this work show little preference for a shift in the Planck mass.
A potential future effort could consider modifications of the TPM model. However, the data used in this paper are not particularly constraining of or , which suggests that changing the functional form of the simple step-like transition in the Planck mass is not likely to have a significant effect. One might also explore changing the TPM description of perturbation level parameters as well as details of the scalar-field dynamics, though this has the downside of adding additional parameters.
We tested the impact of a scalar-field that is minimally coupled to gravity but restricted the equation of state parameter to follow that of the TPM model. We find that this does not greatly affect cosmological parameters. This is because the TPM model scalar-field alone does not have a sufficient energy density prior to recombination to significantly alter background expansion.
It may be possible to construct a model that has similar phenomenology to TPM or EDE that can mimic the effect of varying the Helium fraction or ionization fraction of electrons so that the reduction in the physical size of the sound horizon at the surface of last scattering does not lead to the same suppression of small scale power through the shift in CMB damping scale. To this point, we strongly caution that a hypothetical new model that can achieve this would likely have multiple new effects relative to the standard CDM scenario.
Appendix A Effect of Including an Prior
| SPT | SPT | SPT + Planck TT650TEEE | SPT + Planck TT650TEEE | |
| + Base + | + Base | + Base + | + Base | |
| 1.04039 () | 1.03966 () | 1.4091 ( ) | 1.4073 (1.04072 0.00036 ) | |
| 0.02271 (0.02277 0.00030) | 0.022419 (0.022573 0.00031) | 0.02261 (0.02263 0.00014) | 0.02258 (0.02254 0.00014) | |
| 0.1182 (0.1183 0.0016) | 0.1176 (0.1182 0.0015) | 0.1182 (0.1179 0.0010) | 0.11834 (0.11856 0.00099) | |
| 0.061 (0.0543 0.0071) | 0.0526 () | 0.0485 (0.0516 0.0075) | 0.0554 () | |
| 3.049 (3.039 0.016) | 3.035 (3.037 0.015) | 3.027 (3.034 0.015) | 3.040 (3.035 0.015) | |
| 1.008 (1.003 0.016) | 0.9845 (0.9897 0.016) | 0.9733 (0.9746 0.0057) | 0.9719 (0.9713 0.0053) | |
| -0.073 (-0.072 0.025) | -0.030 (> -0.100 at 95) | -0.013 (> -0.051 at 95) | -0.0004 (> -0.0301 at 95) | |
| -5.06 (-) | -5.25 (-) | -5.57 () | -6.11 (-) | |
| 1.35 () | 0.76 () | 1.42 () | 0.91 () | |
| -0.0111 (> -0.0287 at 95) | -0.0051 (> -0.0253 at 95) | -0.0205 (> -0.0311 at 95) | -0.0080 (> -0.0228 at 95) | |
| 71.87 () | 68.28 () | 70.60 (70.65 0.66) | 68.82 () | |
| 0.830 () | 0.810 () | 0.825 () | 0.814 () | |
| 0.794 () | 0.812 () | 0.802 () | 0.813 () | |
| - | - | 445.53 | 444.13 | |
| - | - | 21.31 | 21.52 | |
| - | - | 395.73 | 396.03 | |
| 1120.67 | 1118.75 | 1123.46 | 1122.76 | |
| 9.17 | 8.98 | 8.37 | 8.69 | |
| 6.32 | 5.59 | 8.43 | 5.85 | |
| 1035.23 | 1034.73 | 1037.11 | 1034.86 | |
| 0.69 | - | 5.09 | - | |
| 0.41 | 0.44 | 0.26 | 0.27 | |
| 2172.48 | 2168.49 | 3045.28 | 3034.12 |

In this appendix, we explore the impact of the prior on the fits to SPT + Base + and SPT + Planck TT650TEEE + Base + . We show the results of these tests in Figure 7 and Table 7. We find that for both the fits to SPT + Base + and SPT + Planck TT650TEEE + Base + , the mean value of . For the TPM fit to SPT + Base + , the constraint is ; however, the parameter distribution function is non-Gaussian as evidenced by the posteriors shown in Figure 7 and by the best-fit value of . This means the mean value is skewed to higher values by the presence of a non-Gaussian tail.
Additionally, there is a non-Gaussian tail for the amplitude of the transition in the Planck mass, , whose best-fit value corresponds to 2.4 shift in the Planck mass, but is constrained at the 95 level to have a transition smaller than 10. The parameter, which acts like a scalar-field equation of state parameter in the late universe, is consistent with a value of 0. This corresponds to the TPM f(R) case.
Importantly, without the prior, the constraint on , which is lower than the constraint when the prior is included. This highlights that the prior is driving this shift in just as it drives the increase in the preferred value of and decrease in preferred value of .
When Planck TT650TEEE data are added to this likelihood combination, the data show no preference for a shift in the Planck mass with a best-fit value for the amplitude of the transition being 0.04, which is consistent with no transition in the Planck mass (i.e. the CDM limit). The amplitude is constrained to be less than at the confidence level. This highlights that these data show no preference for the core phenomenology of the TPM model.
Appendix B Comparison of the TPM Versus TPM f(R) Models for SPT Data
| TPM | TPM f(R) | TPM | TPM f(R) | |
| SPT | SPT | SPT + Planck TT650TEEE | SPT + Planck TT650TEEE | |
| + Base + | + Base + | + Base + | + Base + | |
| 1.04039 () | 1.04086 (1.04067 0.00069) | 1.4091 () | 1.04124 (1.04133 0.00039 ) | |
| 0.02271 (0.02277 0.00030) | 0.022939 (0.022928 0.00028) | 0.02261 (0.02263 0.00014) | 0.02273 () | |
| 0.1182 (0.1183 0.0016) | 0.1174 (0.1173 0.0014) | 0.1182 (0.1179 0.0010) | 0.11732 () | |
| 0.061 (0.0543 0.0071) | 0.0565 (0.0558 0.0070 ) | 0.0485 (0.0516 0.0075) | 0.0550 (0.0588 0.0074) | |
| 3.049 (3.039 0.016) | 3.052 (3.050 0.014) | 3.027 (3.034 0.015) | 3.041 (3.049 0.015) | |
| 1.008 (1.003 0.016) | 1.004 (1.004 0.016) | 0.9733 (0.9746 0.0057) | 0.9800 (0.9814 0.0054) | |
| -0.073 (-0.072 0.025) | -0.088 (-0.086 0.023) | -0.013 (> -0.051 at 95) | -0.034 (> -0.067 at 95) | |
| -5.06 (-) | -6.14 (-) | -5.57 (-) | -4.98 (-) | |
| 1.35 () | 1.16 () | 1.42 () | 0.25 () | |
| -0.0111 (> -0.0287 at 95) | 0 (fixed) | -0.0205 (> -0.0311 at 95) | 0 (fixed) | |
| 71.87 () | 71.98 () | 70.60 (70.65 0.66) | 69.90 (70.12 0.67) | |
| 0.830 () | 0.816 () | 0.825 () | 0.804 () | |
| 0.794 (0.802 0.027) | 0.777 () | 0.802 () | 0.787 () | |
| - | - | 445.53 | 450.78 | |
| - | - | 21.31 | 20.65 | |
| - | - | 395.73 | 395.95 | |
| 1120.67 | 1122.48 | 1123.46 | 1123.55 | |
| 9.17 | 9.73 | 8.37 | 11.39 | |
| 6.32 | 5.53 | 8.43 | 5.70 | |
| 1035.23 | 1034.73 | 1037.11 | 1034.74 | |
| 0.69 | 0.51 | 5.09 | 9.25 | |
| 0.41 | 0.45 | 0.26 | 0.05 | |
| 2172.48 | 2173.43 | 3045.28 | 3052.04 |
We have explored constraints on the TPM model with the parameter free to vary. However, it is also interesting to explore what happens when this parameter is fixed to 0 because this isolates the core phenomenology of the TPM model (i.e. the shift in the Planck mass). The parameter effectively acts as the equation of state parameter for the scalar-field in the late universe. More negative values of lead to larger values of similar to how more negative values of in models tend to lead to larger preferred values of . We refer to this case where as the TPM f(R) model because this model exists within the broad class of f(R) modified gravity models.
In this appendix, we explore the constraints on the TPM f(R) model. We run MCMCs for the TPM f(R) model fits to SPT + Base + and SPT + Planck TT650TEEE + Base + , and show the results in Figure 8 and Table 8.
There is little difference between fitting the TPM and TPM f(R) models to SPT + Base + because these data can compensate large shifts in the Planck mass by increasing . The full TPM model has the additional model freedom of the parameter to increase . Thus, the SPT + Base + prefer more negative values of in the TPM f(R) model than the full TPM model.
The TPM f(R) model fits the SPT + Base + slightly worse than the TPM model, but the additional model freedom from varying does not significantly improve the fit to data.
When Planck TT650TEEE data are additionally included, the parameter is more tightly constrained, which in turn restricts by how much the parameter can shift and still fit the data well. Nevertheless, the prior forces the model to find parameters that have higher values. Therefore, in the full TPM model, the parameter shifts to more negative values and the best-fit value for the shift in the Planck mass is only .
For the TPM f(R) model, the best-fit value for the shift in the Planck mass is 3.4, and the best-fit value for . Importantly, the TPM f(R) model fits the SPT + Planck TT650TEEE + Base + significantly worse than the full TPM model with a for only one additional parameter.
References
- Abbott et al. (2018) Abbott, T. M. C., Abdalla, F. B., Alarcon, A., et al. 2018, Phys. Rev. D, 98, 043526, doi: 10.1103/PhysRevD.98.043526
- Abbott et al. (2019) Abbott, T. M. C., Abdalla, F. B., Avila, S., et al. 2019, Phys. Rev. D, 99, 123505, doi: 10.1103/PhysRevD.99.123505
- Abbott et al. (2022) Abbott, T. M. C., Aguena, M., Alarcon, A., et al. 2022, Phys. Rev. D, 105, 023520, doi: 10.1103/PhysRevD.105.023520
- Abdalla et al. (2022) Abdalla, E., Abellán, G. F., Aboubrahim, A., et al. 2022, Journal of High Energy Astrophysics, 34, 49, doi: 10.1016/j.jheap.2022.04.002
- Aiola et al. (2020) Aiola, S., Calabrese, E., Maurin, L., et al. 2020, arXiv e-prints, arXiv:2007.07288. https://arxiv.org/abs/2007.07288
- Alam et al. (2017) Alam, S., Ata, M., Bailey, S., et al. 2017, Monthly Notices of the Royal Astronomical Society, 470, 2617, doi: 10.1093/mnras/stx721
- Alam et al. (2021) Alam, S., Aubert, M., Avila, S., et al. 2021, Phys. Rev. D, 103, 083533, doi: 10.1103/PhysRevD.103.083533
- Balkenhol et al. (2022) Balkenhol, L., Dutcher, D., Spurio Mancini, A., et al. 2022, arXiv e-prints, arXiv:2212.05642, doi: 10.48550/arXiv.2212.05642
- Benevento et al. (2022) Benevento, G., Kable, J. A., Addison, G. E., & Bennett, C. L. 2022, Astrophys. J., 935, 156, doi: 10.3847/1538-4357/ac80fd
- Bennett et al. (2013) Bennett, C. L., Larson, D., Weiland, J. L., et al. 2013, ApJS, 208, 20, doi: 10.1088/0067-0049/208/2/20
- Beutler et al. (2011) Beutler, F., Blake, C., Colless, M., et al. 2011, Monthly Notices of the Royal Astronomical Society, 416, 3017–3032, doi: 10.1111/j.1365-2966.2011.19250.x
- Blakeslee et al. (2021) Blakeslee, J. P., Jensen, J. B., Ma, C.-P., Milne, P. A., & Greene, J. E. 2021, The Astrophysical Journal, 911, 65, doi: 10.3847/1538-4357/abe86a
- Brout et al. (2022) Brout, D., Scolnic, D., Popovic, B., et al. 2022, ApJ, 938, 110, doi: 10.3847/1538-4357/ac8e04
- Cooke et al. (2018) Cooke, R. J., Pettini, M., & Steidel, C. C. 2018, APJ, 855, 102, doi: 10.3847/1538-4357/aaab53
- Cyburt et al. (2016) Cyburt, R. H., Fields, B. D., Olive, K. A., & Yeh, T.-H. 2016, Reviews of Modern Physics, 88, 015004, doi: 10.1103/RevModPhys.88.015004
- D’Amico et al. (2020) D’Amico, G., Senatore, L., Zhang, P., & Zheng, H. 2020, arXiv e-prints, arXiv:2006.12420. https://arxiv.org/abs/2006.12420
- DES+KiDS (2023) DES+KiDS. 2023, arXiv e-prints, arXiv:2305.17173, doi: 10.48550/arXiv.2305.17173
- Di Valentino et al. (2021) Di Valentino, E., Mena, O., Pan, S., et al. 2021, Class. Quant. Grav., 38, 153001, doi: 10.1088/1361-6382/ac086d
- Dutcher et al. (2021) Dutcher, D., Balkenhol, L., Ade, P. A. R., et al. 2021, Phys. Rev. D, 104, 022003, doi: 10.1103/PhysRevD.104.022003
- Elvin-Poole et al. (2023) Elvin-Poole, J., MacCrann, N., Everett, S., et al. 2023, MNRAS, 523, 3649, doi: 10.1093/mnras/stad1594
- Fields et al. (2020) Fields, B. D., Olive, K. A., Yeh, T.-H., & Young, C. 2020, J. Cosmology Astropart. Phys, 2020, 010, doi: 10.1088/1475-7516/2020/03/010
- Frusciante & Perenon (2020) Frusciante, N., & Perenon, L. 2020, Physics Reports, 857, 1–63, doi: 10.1016/j.physrep.2020.02.004
- Gelman & Rubin (1992) Gelman, A., & Rubin, D. B. 1992, Statist. Sci., 7, 457, doi: 10.1214/ss/1177011136
- Heymans et al. (2021) Heymans, C., Tröster, T., Asgari, M., et al. 2021, Astronomy & Astrophysics, 646, A140, doi: 10.1051/0004-6361/202039063
- Hill et al. (2020) Hill, J. C., McDonough, E., Toomey, M. W., & Alexander, S. 2020, Phys. Rev. D, 102, 043507, doi: 10.1103/PhysRevD.102.043507
- Hill et al. (2021) Hill, J. C., Calabrese, E., Aiola, S., et al. 2021, The Atacama Cosmology Telescope: Constraints on Pre-Recombination Early Dark Energy. https://arxiv.org/abs/2109.04451
- Hou et al. (2013) Hou, Z., Keisler, R., Knox, L., Millea, M., & Reichardt, C. 2013, Phys. Rev. D, 87, 083008, doi: 10.1103/PhysRevD.87.083008
- Hu et al. (2014) Hu, B., Raveri, M., Frusciante, N., & Silvestri, A. 2014, arXiv e-prints, arXiv:1405.3590. https://arxiv.org/abs/1405.3590
- Ivanov et al. (2020) Ivanov, M. M., McDonough, E., Hill, J. C., et al. 2020, Phys. Rev. D, 102, 103502, doi: 10.1103/PhysRevD.102.103502
- Karwal et al. (2021) Karwal, T., Raveri, M., Jain, B., Khoury, J., & Trodden, M. 2021, Chameleon Early Dark Energy and the Hubble Tension. https://arxiv.org/abs/2106.13290
- Knox & Millea (2020) Knox, L., & Millea, M. 2020, Phys. Rev. D, 101, 043533, doi: 10.1103/PhysRevD.101.043533
- Lewis & Bridle (2002) Lewis, A., & Bridle, S. 2002, Physical Review D, 66, doi: 10.1103/physrevd.66.103511
- Lewis et al. (2000) Lewis, A., Challinor, A., & Lasenby, A. 2000, The Astrophysical Journal, 538, 473, doi: 10.1086/309179
- Li et al. (2023) Li, X., Zhang, T., Sugiyama, S., et al. 2023, arXiv e-prints, arXiv:2304.00702, doi: 10.48550/arXiv.2304.00702
- Lin et al. (2019) Lin, M.-X., Benevento, G., Hu, W., & Raveri, M. 2019, Phys. Rev. D, 100, 063542, doi: 10.1103/PhysRevD.100.063542
- Lin et al. (2022) Lin, M.-X., McDonough, E., Hill, J. C., & Hu, W. 2022. https://arxiv.org/abs/2212.08098
- MacCrann et al. (2023) MacCrann, N., et al. 2023. https://arxiv.org/abs/2304.05196
- Madhavacheril et al. (2023) Madhavacheril, M. S., Qu, F. J., Sherwin, B. D., et al. 2023, arXiv e-prints, arXiv:2304.05203, doi: 10.48550/arXiv.2304.05203
- McDonough et al. (2021) McDonough, E., Lin, M.-X., Hill, J. C., Hu, W., & Zhou, S. 2021, The Early Dark Sector, the Hubble Tension, and the Swampland. https://arxiv.org/abs/2112.09128
- McDonough et al. (2022) —. 2022, Phys. Rev. D, 106, 043525, doi: 10.1103/PhysRevD.106.043525
- Niedermann & Sloth (2019) Niedermann, F., & Sloth, M. S. 2019, arXiv e-prints, arXiv:1910.10739, doi: 10.48550/arXiv.1910.10739
- Pandey et al. (2022) Pandey, S., Krause, E., DeRose, J., et al. 2022, Phys. Rev. D, 106, 043520, doi: 10.1103/PhysRevD.106.043520
- Pesce et al. (2020) Pesce, D. W., Braatz, J. A., Reid, M. J., et al. 2020, The Astrophysical Journal, 891, L1, doi: 10.3847/2041-8213/ab75f0
- Planck Collaboration et al. (2020a) Planck Collaboration, Aghanim, N., Akrami, Y., et al. 2020a, AAP, 641, A6, doi: 10.1051/0004-6361/201833910
- Planck Collaboration et al. (2020b) Planck Collaboration, Aghanim, N., Akrami, Y., et al. 2020b, A&A, 641, A5, doi: 10.1051/0004-6361/201936386
- Poulin et al. (2021) Poulin, V., Smith, T. L., & Bartlett, A. 2021, Phys. Rev. D, 104, 123550, doi: 10.1103/PhysRevD.104.123550
- Poulin et al. (2019) Poulin, V., Smith, T. L., Karwal, T., & Kamionkowski, M. 2019, Phys. Rev. Lett., 122, 221301, doi: 10.1103/PhysRevLett.122.221301
- Powell (2009) Powell, M. 2009, Technical Report, Department of Applied Mathematics and Theoretical Physics
- Qu et al. (2023) Qu, F. J., et al. 2023. https://arxiv.org/abs/2304.05202
- Raveri et al. (2014) Raveri, M., Hu, B., Frusciante, N., & Silvestri, A. 2014, Physical Review D, 90, doi: 10.1103/physrevd.90.043513
- Riess et al. (2021) Riess, A. G., Yuan, W., Macri, L. M., et al. 2021, arXiv e-prints, arXiv:2112.04510. https://arxiv.org/abs/2112.04510
- Rodríguez-Monroy et al. (2022) Rodríguez-Monroy, M., et al. 2022, Mon. Not. Roy. Astron. Soc., 511, 2665, doi: 10.1093/mnras/stac104
- Ross et al. (2015) Ross, A. J., Samushia, L., Howlett, C., et al. 2015, Monthly Notices of the Royal Astronomical Society, 449, 835–847, doi: 10.1093/mnras/stv154
- Sabla & Caldwell (2022) Sabla, V. I., & Caldwell, R. R. 2022, Phys. Rev. D, 106, 063526, doi: 10.1103/PhysRevD.106.063526
- Schöneberg et al. (2022) Schöneberg, N., Franco Abellán, G., Pérez Sánchez, A., et al. 2022, Phys. Rept., 984, 1, doi: 10.1016/j.physrep.2022.07.001
- Scolnic et al. (2018) Scolnic, D. M., Jones, D. O., Rest, A., et al. 2018, ApJ, 859, 101, doi: 10.3847/1538-4357/aab9bb
- Smith et al. (2022) Smith, T. L., Lucca, M., Poulin, V., et al. 2022, Phys. Rev. D, 106, 043526, doi: 10.1103/PhysRevD.106.043526
- Solà Peracaula et al. (2023) Solà Peracaula, J., Gómez-Valent, A., de Cruz Pérez, J., & Moreno-Pulido, C. 2023, Universe, 9, 262, doi: 10.3390/universe9060262
- Sotiriou & Faraoni (2010) Sotiriou, T. P., & Faraoni, V. 2010, Reviews of Modern Physics, 82, 451–497, doi: 10.1103/revmodphys.82.451
- Tassev et al. (2013) Tassev, S., Zaldarriaga, M., & Eisenstein, D. J. 2013, J. Cosmology Astropart. Phys, 2013, 036, doi: 10.1088/1475-7516/2013/06/036
- Vagnozzi (2020) Vagnozzi, S. 2020, Physical Review D, 102, doi: 10.1103/physrevd.102.023518